Montana Extreme Working Group...
30
Prepared For: Dam Safety Program Montana Department of Natural Resources and Conservation Prepared By: Extreme Storm Working Group Summary Report December 2016
Transcript of Montana Extreme Working Group...

Prepared For:
Dam Safety ProgramMontana Department of Natural Resources and Conservation
Prepared By:
Extreme Storm Working Group Summary Report
December 2016

Extreme Storm Working Group Summary Report
Prepared For:
Dam Safety Program
Montana Department of Natural Resources and Conservation
Prepared By:
DOWL
Billings, MT 59101
December 2016

\\BIL-FS\BIL-projects\26\21407-01\94Rpts\WorkingGroupReport_R0.docx Page i
TABLE OF CONTENTS
1.0 Executive Summary ................................................................................................................. 1
2.0 introduction ............................................................................................................................. 2
3.0 Background .............................................................................................................................. 3
4.0 Uncertainty & Risk ................................................................................................................... 3
5.0 Hydrologic Modeling Parameters & Considerations ............................................................... 4
5.1 Precipitation Depth .................................................................................................. 5
5.1.1 WRIR 97-4004: Regional Analysis of Precipitation Maximum in Montana .............. 5
5.1.2 Probable Maximum Precipitation ............................................................................. 5
5.1.3 NOAA Atlas 14 ........................................................................................................... 6
5.2 Precipitation - Temporal Distribution ...................................................................... 6
5.2.1 WRIR 98-4100: Characteristics of Extreme Storms in Montana and Methods for
Constructing Synthetic Storm Hyetographs ............................................................. 7
5.2.2 Other References ...................................................................................................... 7
5.3 Precipitation – Spatial Distribution .......................................................................... 7
5.4 Basin Delineation ...................................................................................................... 8
5.5 Antecedent Conditions & Rainfall Losses ................................................................. 9
5.6 Unit Hydrographs ................................................................................................... 10
6.0 Model Validation ................................................................................................................... 11
6.1 Definitions .............................................................................................................. 11
6.1.1 Verification .............................................................................................................. 11
6.1.2 Calibration ............................................................................................................... 12
6.1.3 Pseudo-Calibration .................................................................................................. 12
6.1.4 Simulation: .............................................................................................................. 12
6.2 Verification ............................................................................................................. 12
6.3 Pseudo-Calibration / Calibration ............................................................................ 13
6.4 Verify IDF Reasonableness ..................................................................................... 15
6.5 Validation Process Flow diagram ........................................................................... 16
7.0 Mitigating uncertainty ........................................................................................................... 18
8.0 State of the Practice .............................................................................................................. 20
9.0 Conclusions ............................................................................................................................ 21
10.0 References ............................................................................................................................. 22

\\BIL-FS\BIL-projects\26\21407-01\94Rpts\WorkingGroupReport_R0.docx Page ii
TABLE OF APPENDICES Appendix A –Model Validation Checklist

\\BIL-FS\BIL-projects\26\21407-01\94Rpts\WorkingGroupReport_R0.docx Page | 1
1.0 EXECUTIVE SUMMARY
In 2016 the Montana Department of Natural Resources and Conservation (DNRC) Dam Safety
Program organized the Extreme Storm Working Group (Group) to conduct a comprehensive
review of the state of the practice for computing hydrology for dams. Over the course of seven
meetings, the panel evaluated and discussed the major elements necessary to compute inflow
design flood hydrographs for high hazard dams and made recommendations to DNRC for
further action.
The Administrative Rules of Montana define a risk-based approach to determining the Inflow
Design Flood (IDF) for high hazard dams. This risk-based standard has been successful in
allowing Montana to rehabilitate many more dams than would have been possible under a
Probable Maximum Flood (PMF) based standard. However, risk based standards are more
sensitive to basin response parameters than a PMF based standard. Inaccurate computation
(under-prediction) of an IDF results in a potentially significantly lesser level of protection than is
believed (or required by rule) to be provided. Because of this, the Montana Dam Safety
Program must have confidence in the IDFs that are submitted for their review. Review of
recent IDF reports has highlighted the need for the Dam Safety Program to reevaluate
Montana’s guidance documents on how an IDF should be computed, with particular attention
to hydrologic modeling.
Over the course of the meetings, the Group collectively developed the following principal
conclusions:
The engineer is responsible for selecting the most appropriate method for determining
an IDF and for selecting rainfall-runoff parameters, but those selections must be
documented, justified, and accepted by the DNRC Dam Safety Program.
For determination of spillway capacity, the objective of a hydrologic study is to develop
a “best estimate” for the IDF and an awareness of the uncertainty associated with the
IDF.
Awareness of uncertainty comes from a flood frequency analysis using a variety of
methods to estimate flood magnitudes, coupled with a sensitivity analysis on the
rainfall-runoff model parameters.
The “best estimate” for the IDF must be validated to assure the dam/spillway design to
safely pass IDF will provide a level of protection commensurate with the downstream
risk.
IDFs with recurrence intervals from 500-years to 5,000-years are more sensitive to
model parameters than are IDFs that approach the PMF.

\\BIL-FS\BIL-projects\26\21407-01\94Rpts\WorkingGroupReport_R0.docx Page | 2
Use of the Hydrometeorological Reports (HMRs) developed by the National Weather
Service for Probable Maximum Precipitation (PMP) is adequate for evaluation of
existing high hazard dams. For design and construction of a new high hazard dam,
development of a site specific PMP should be considered.
Methods to compute freeboard as an approach to account for uncertainty should be
explored.
A law or rule change is not necessary. The Montana specific guideline for developing
the inflow design flood (Technical Note 1) should be updated to reflect the
recommendations of the Group.
In addition to the Group meetings, a questionnaire was sent to the dam safety program
representatives from other states with a dam safety program to assess the standard of practice
and learn how the issues of model calibration and uncertainty are addressed outside of
Montana. From that survey, the Group learned that the requirements and level of
sophistication vary widely from state to state. The spectrum spans the full range of regulatory
authority from no requirements and no analysis guidelines to strict PMF based standards and
prescriptive analysis requirements. The survey responses demonstrate that Montana has a
strong dam safety program, with generally good guidance and expectations regarding
computation of an IDF.
2.0 INTRODUCTION
In early 2016, the Montana Dam Safety Program (MT DSP) identified a need to re-examine the guidelines used for Montana dam spillway analysis, particularly with respect to rainfall runoff parameters and modeling methodologies. Towards that end, the MT DSP assembled a panel of professionals with expertise in hydrologic modeling and dam design to participate in an Extreme Storm Working Group (Group). This Group was comprised of public sector professionals (Montana DNRC, USGS, and NRCS) and private sector consultants (DOWL, Morrison Maierle, and Loughlin Water Associates). The primary purpose of the Group was to discuss and evaluate the best practices that are currently being used in rainfall-runoff modeling for spillway analyses in the dam safety industry. The final outcome of the Group’s efforts is anticipated to be a revision to Technical Note 1 Analysis of Spillway Capacity in Montana (TN-1) that incorporates the recommendations of the Group and provides guidance to the engineering community on performing hydrologic analyses to develop an Inflow Design Flood (IDF) that complies with Montana rules.

\\BIL-FS\BIL-projects\26\21407-01\94Rpts\WorkingGroupReport_R0.docx Page | 3
3.0 BACKGROUND
The State of Montana has a risk-based approach to determine the spillway capacity for high hazard dams – as the estimated loss of life (LOL) that would result from a dam failure increases, the IDF also increases. From Administrative Rule of Montana (ARM) 36.14.502 Hydrologic Standard for Emergency and Principal Spillways, the required spillway capacity for a high hazard dam ranges from the 500-year flood (for a LOL = 0.5) to the Probable Maximum Flood (PMF) (LOL ≥ 1,000). Because spillway capacity assignment is based on risk (loss of life), inaccurate computation of the corresponding IDF (i.e., under estimate of the peak runoff rate and total runoff volume) can result in a lesser level of protection than is statutorily required. Accurate computation of the IDF is a fundamental assumption in application of ARM 36.14.502. Further, because the IDF is generally computed from a hydrologic model of the rainfall-runoff response, the Montana Dam Safety Program must have confidence that the hydrologic modeling process produces an IDF that is commensurate with the estimated risk. Therefore, consistent application of sound hydrologic modeling practices and judgement is essential for effective implementation of a risk-based standard. Review by the MT DSP of recent IDF reports for high hazard dams (with a wide range of hazard potential) highlight the need to clarify and strengthen the program’s guidance document on how to compute an IDF in Montana. Salient Point(s):
Accurate computation of the IDF is a fundamental assumption in application of ARM 36.14.502.
4.0 UNCERTAINTY & RISK
Hydrologic models simulate the physical phenomena of rainfall and rainfall runoff, as well as “routing” the rainfall-runoff hydrograph through the reservoir and dam. Hydrologic systems are complex and vary in both space (different surface characteristics across the basin) and time (changing rainfall intensities and infiltration rates over the course of a storm and different antecedent conditions from storm to storm). There is uncertainty associated with every component variable in hydrologic modeling. During the analysis and design processes, the engineer must be aware of uncertainty and develop an understanding of how the uncertainty of each component of a hydrologic model quantitatively affects the computed IDF and, consequently, the dam and spillway design. The uncertainty of an IDF increases as the recurrence interval or magnitude of the flood event gets larger. Nevertheless, for the largest IDFs based on precipitation depths that approach the Probable Maximum Precipitation (PMP), the rainfall-runoff model parameters that affect runoff volume (i.e., initial abstraction, infiltration, imperviousness) are often set at or near their minimum values so that runoff is maximized. The ironic result is that IDF hydrographs that are based on smaller design storms with recurrence intervals from 500-years to 5,000-years are more sensitive to the wider allowable ranges in model parameters than are IDF hydrographs for the largest storms. Engineers thus need to carefully evaluate the effects of changes in model
\\BIL-FS\BIL-projects\26\21407-01\94Rpts\WorkingGroupReport_R0.docx Page | 4
parameters on an IDF hydrograph to ensure that downstream risk is not increased through parameter selections that result in an unrealistically low prediction of the IDF. The uncertainty of an IDF can only be estimated by comparing results from the rainfall-runoff model used to compute the IDF to one or more independent flood-frequency analyses wherein statistical methods are used to quantify the uncertainty. Unfortunately, flood-frequency analyses provide flood estimates only for recurrence intervals up to 500-years. Thus, the uncertainty of a modeled IDF with a 500-year recurrence interval can be estimated based on comparison with flood-frequency analyses, but the engineer needs to be aware that uncertainty increases by some unknown amount as the recurrence interval increases beyond 500 years. In addition, the range in the computed peak runoff rate and total runoff volume resulting from plausible and reasonable changes in the component rainfall-runoff model parameters needs to be considered when evaluating overall model uncertainty. This process by which the engineer individually changes the parameter values assigned to the component variables in the hydrologic model to determine the corresponding change in the runoff hydrograph is generally termed a sensitivity analysis. If a small change in a model parameter produces a large change in the hydrograph, the model is sensitive to that parameter and the general uncertainty of model results is increased. Salient Point(s):
There is uncertainty in every aspect of hydrologic modeling.
Uncertainty increases as recurrence interval increases.
IDF hydrographs for recurrence intervals from 500-years to 5,000-years are more
sensitive to basin parameter assignments than PMF hydrographs.
5.0 HYDROLOGIC MODELING PARAMETERS & CONSIDERATIONS
The basic concept behind hydrologic modeling is to predict the runoff (rate and volume) from a basin in response to a specific precipitation event (storm). A fundamental assumption of the rainfall-runoff modeling process is that a precipitation event of a particular frequency results in a runoff (or stream flow) event with a corresponding frequency, e.g., the 500-year storm results in the 500-year flood. Although this assumption is inherently flawed due to the spatial and temporal variability of basin characteristics, and the influence of other factors, such as baseflow and snowmelt, it is a reasonable approach and, equally importantly, a consistent approach for computing runoff hydrographs. Assignment of numerical values to the storm (total precipitation depth and distribution over time) and to the parameters used to compute basin response is challenging and requires specific training and experience to understand how the model elements, and the sensitivity of each element, affect the IDF. The following sections present brief discussions on the major components of a rainfall-runoff model and the preferred sources (as well as acceptable alternatives) for data and analysis procedures.

\\BIL-FS\BIL-projects\26\21407-01\94Rpts\WorkingGroupReport_R0.docx Page | 5
5.1 PRECIPITATION DEPTH
Precipitation depth is the fundamental component for developing a synthetic storm, and there are a variety of references/sources that can be used to estimate precipitation depths. In the past, NOAA Atlas 2 maps were often used to estimate the frequency (2-year through 100-year) precipitation depths. However, because the data set used to produce the NOAA Atlas 2 maps only goes through 1970, and there are more current sources available, use of NOAA Atlas 2 precipitation depths for dam hydrology is no longer acceptable.
5.1.1 WRIR 97-4004: Regional Analysis of Precipitation Maximum in Montana
The procedure presented in WRIR 97-4004 is the preferred procedure for computing the design precipitation depth for precipitation frequencies up to the 5,000-year storm. When using the regression equations presented in WRIR 97-4004, the modeler must preserve the integrity of those equations by only using the precipitation input data that are provided in WRIR 97-4004 and from which those regression equations were developed. Regression equations explain relationships between a dependent variable and one or more independent variables (or “predictors”). When applying the regression equations, the same dataset of independent variables used to develop the equations should be used. If a different dataset of independent variables is used, the relationship (represented by the equations) may not be valid. Therefore, when using the equations in Table 11 of WRIR 97-4004, the mean annual precipitation data from Plate 2 of that report must be used. Conversely, when a study basin is near a precipitation station (or stations), the engineer should use the precipitation depths from that nearby station (or stations), as opposed to simply applying the regression equations. In such cases, provided the updated precipitation data is based on a period of record at least as large as the basis for the regression equations presented in the report, use of more current precipitation data is acceptable when applying the procedures described in WRIR 97-4004. To obtain frequency precipitation depths for rainfall-runoff models of less severity than the IDF (e.g., the 100-year flood), it is acceptable to reference other precipitation sources, such as Appendix B of the Montana Department of Transportation Hydrology Manual.
5.1.2 Probable Maximum Precipitation
When the estimated LOL is greater than five, selection of the design precipitation depth requires interpolation between the 5,000-year and PMP depths. Generally speaking, for most high hazard dams in Montana, determination of the PMP using the applicable hydrometeorological report (HMR) is acceptable. Because the PMP is essentially used to define the slope of the design precipitation line (for 5 ≤ LOL ≤ 1,000), it isn’t until a LOL of several hundred that the accuracy of the PMP begins to significantly affect the design precipitation depth. While the HMRs are becoming dated, and many states are commissioning state specific PMP studies, Montana does not have sufficient justification to pursue legislative funding for a Montana PMP study. The Group concluded that HMRs continue to provide the best information
\\BIL-FS\BIL-projects\26\21407-01\94Rpts\WorkingGroupReport_R0.docx Page | 6
available and are a reasonable means for computing PMP depths in Montana for evaluating the capacity of existing dams to pass the IDF. As the consequence of failure increases (e.g., the design precipitation depth approaches the PMP), the engineer may determine that a site specific PMP is warranted. For such cases, the scope and methods proposed for the PMP study shall be coordinated with the MT DSP, and the results of the site specific PMP study shall be considered to be more reliable than the PMP computed using the applicable HMR. Factors such as the consequence of failure, the potential for a PMP based IDF to limit the number of alternatives that may be available at a specific site, and the potential for a PMP based IDF to result in a configuration that exceeds available funding shall be considered when evaluating the need for a site specific PMP study.
5.1.3 NOAA Atlas 14
As previously stated, NOAA Atlas 2 is out of date and is no longer an acceptable source for precipitation estimates to compute dam hydrology in Montana. NOAA Atlas 2 has been superseded by NOAA Atlas 14, but NOAA Atlas 14 has not been developed for use in Montana. The Group recommends the Dam Safety Program coordinate with other agencies in Montana, as well as explore cost sharing options with the other states in the Pacific Northwest for which NOAA Atlas 14 has also not been developed, and pursue developing NOAA Atlas 14 for Montana. NOAA Atlas 14 would provide updated precipitation estimates for the 500-year and 1,000-year recurrence intervals, which are common design basis storms for high hazard dams in Montana. Salient Point(s):
WRIR 97-4004 should be used to compute inflow design flood precipitation depths for precipitation frequencies up to the 5,000-year storm.
For design of new, or rehabilitation of existing, high hazard dams with significant
downstream risk, a site specific PMP should be considered. Documentation and
justification for how the PMP was obtained is a requirement for a PMP
derived/influenced inflow design flood submittal.
An update to NOAA Atlas 14 to include Montana would be beneficial.
5.2 PRECIPITATION - TEMPORAL DISTRIBUTION
The temporal distribution of rainfall describes how the total precipitation depth is distributed over the storm duration (constructing the hyetograph). When constructing a synthetic storm hyetograph, the engineer should (unless justified otherwise) select the storm pattern that results in the most severe loading (highest stage) on the dam, which may or may not be the temporal distribution that produces the greatest peak inflow rate. Specifically, some reservoir systems have sufficient volume capacity to significantly attenuate large inflow rates (volume driven system), while in other reservoir systems the inflow hydrograph passes through the reservoir with little attenuation (peak runoff rate driven system). The engineer must understand the controlling mechanism and select an appropriate rainfall distribution. Note

\\BIL-FS\BIL-projects\26\21407-01\94Rpts\WorkingGroupReport_R0.docx Page | 7
that this concept was discussed a length by the Group, and additional discussion and guidance is necessary regarding the topic of volume vs. peak inflow rate systems.
5.2.1 WRIR 98-4100: Characteristics of Extreme Storms in Montana and Methods for
Constructing Synthetic Storm Hyetographs
The procedure presented in WRIR 98-4100 is the preferred procedure for distributing the total precipitation depth over time. WRIR 98-4100 was developed using data from storms that occurred throughout Montana and is the best documentation for how rainfall intensities vary over time during severe storms in Montana. In line with the Group’s recommendation to compute the best estimate for the IDF (as opposed to a conservatively high estimate), it is appropriate to use dimensionless depths corresponding to the 0.5 exceedance probability for both evaluation and design of spillways when using WRIR 98-4100. More severe exceedance probabilities for dimensionless depths (e.g., 0.2) may be used, particularly for volume driven systems.
5.2.2 Other References
In some instances, such as with PMP events, the relevant source documents may require (or suggest) specific references/methods for distributing rainfall over time. In such cases, it is appropriate to use the specified references/methods. Additionally, if there is reason to believe WRIR 98-4100 does not result in a reasonable hyetograph, the engineer may justify the use an alternate reference for that specific application. Below are two references that do offer potentially acceptable alternatives for constructing synthetic hyetographs when performing dam hydrology.
EM 1110-2-1411 (Corps of Engineers): Standard Flood Determination
Flood Hydrology Manual (Bureau of Reclamation)
Salient Point(s):
Some reservoir/dam systems are more sensitive to runoff volume than the rate of
runoff.
WRIR 98-4011 should be used to construct the synthetic storm hyetograph for
computation of the IDF.
From WRIR 98-4100, dimensionless depths for the 0.5 exceedance probability are
acceptable.
Other references for distributing rainfall over time may be used with adequate
justification.
5.3 PRECIPITATION – SPATIAL DISTRIBUTION
The most commonly used software application for rainfall-runoff modeling is HEC-HMS. In the
current version (v4.2), HEC-HMS is limited to uniform precipitation over a basin area. In other
\\BIL-FS\BIL-projects\26\21407-01\94Rpts\WorkingGroupReport_R0.docx Page | 8
words, if precipitation is anticipated to vary spatially then an area-weighted average
precipitation depth must be computed. For study areas greater than 10 mi2 (various
references, e.g., HMRs, NOAA Technical Report NWS 24, NRCS TR-60) application of an aerial
reduction factor is generally considered necessary to adjust point precipitation depths to a
uniform precipitation depth over the study area. However, for basins with significant
topographic variability in which the storm depth and intensity are anticipated to vary spatially,
such as for a basin that includes both mountainous and plains areas, it is more appropriate to
subdivide the basin and apply a different hyetograph to each sub-basin (Section 5.4).
Salient Point(s):
Basins with large variations in precipitation depths may need to be subdividied.
5.4 BASIN DELINEATION
The determination of whether or not to subdivide a study basin is under the purview of the
engineer performing the analysis, and there are a number of considerations that must be
accounted for when evaluating a basin. The engineer must document and justify the basis for
subdividing (or not) the study basin. Compelling reasons to subdivide a study basin include:
There is a reservoir/dam internal to the study basin that may affect (attenuate) the IDF.
There is a stream gage internal to the basin that could be used to estimate unit
hydrograph parameters or that will be used to verify the rainfall-runoff model.
It is necessary to determine the rainfall-runoff response characteristics at a point
internal to the study basin.
The study basin has contiguous internal areas of uniformly different land cover, soil
type, or other characteristics that will exhibit a different rainfall-runoff response than
the balance of the study basin.
The study basin includes one (or more) constituent drainages that have a significantly
different rain-fall runoff response time, such as time-of-concentration, basin lag time,
unit duration, etc., than the balance of the study basin.
Precipitation over the study area is anticipated to be non-uniform uniform and use of a
single hyetograph for the entire basin is not appropriate (Section 5.3). Note: Use of HEC-
HMS (v4.2 or lower) requires sub basins to be delineated to vary precipitation
distribution over a study area.
Additionally, the size of the study area may be large enough to warrant subdividing, regardless
of the above considerations. From the Bureau of Reclamation’s Flood Hydrology Manual,
consideration to subdivide should be given if any of the following parameter thresholds are
exceeded:
\\BIL-FS\BIL-projects\26\21407-01\94Rpts\WorkingGroupReport_R0.docx Page | 9
Study area > 500 mi2
Unit duration > 6 hours
Basin lag time > 30 hours
Time-of-concentration > 20 hours
Salient Point(s):
The decision to divide a study area into two or more subbasins is based on engineering
judgement, but the rationale behind that decision must be described and justified.
5.5 ANTECEDENT CONDITIONS & RAINFALL LOSSES
At the onset of an extreme storm that may produce an IDF, the antecedent conditions are often
such that there is a more severe rainfall-runoff response than would be expected during a
smaller storm with a shorter frequent recurrence interval (e.g., the 100-year storm). For
example, extreme storms often occur as part of a larger storm system that saturate the basin in
advance of the “extreme” storm, or the extreme storm may occur when the ground is frozen.
For this reason, the initial abstraction and loss rates for the smaller (≤ 100-year) storms may be
significantly greater than loss rates during the larger storms, such as for a storm that produces
an IDF. Hence, for an IDF, it is often appropriate to assume the antecedent conditions are wet
and that the capacity of the basin to “absorb” rainfall (initial abstraction and infiltration) is less
than optimum. For example, it may be appropriate to assume the basin is saturated at the
onset of the storm (i.e., initial abstraction = 0 inches of rainfall) and that rainfall is lost
(infiltrated) at a constant loss rate that is equal to the ultimate infiltration rate of the area-
weighted average hydrologic soil group for the basin.
It should be noted that the concept of saturated antecedent conditions was the subject of
much debate by the Group members and unanimity could not be achieved. What was agreed
upon unanimously is that precipitation losses must be estimated as accurately as possible
based on the parameters (e.g., soil type, vegetation, basin slope) specific to the study area. The
following is a list of acceptable methods for computing rainfall losses:
Initial and constant loss
Green and Ampt
NRCS curve number (CN)
When assigning initial abstraction and loss parameters, the engineer must keep in mind that
these parameter assignments directly affect the total runoff volume – as losses are increased,
runoff volume is decreased. It is possible to adjust the basin parameters to produce an IDF
hydrograph with a peak inflow rate that appears reasonable when compared to independent

\\BIL-FS\BIL-projects\26\21407-01\94Rpts\WorkingGroupReport_R0.docx Page | 10
methods for computing flood frequency, but that has an unrealistically low total runoff volume
(e.g., <25% of the total precipitation depth). The basis for loss parameter assignments must
always be documented and justified; this is particularly true for IDF hydrographs with a total
runoff volume that equates to less than 50% of effective precipitation (ratio of the depth of
rainfall-runoff (runoff-volume divided by basin area) to the total precipitation depth).
Salient Point(s):
Storms that produce IDFs often occur at the tail end of a series of storms that saturate
the basin, resulting in more severe runoff conditions that would otherwise be expected
for a given precipitation depth.
Initial abstraction and precipitation loss rates directly affect the total runoff volume.
The basis for precipitation loss parameter assignments must be documented and
justified.
5.6 UNIT HYDROGRAPHS
The most common method for transforming excess rainfall into an inflow hydrograph is the unit
hydrograph. In practice, rarely are there sufficient rainfall and streamflow records to derive a
unit hydrograph specific to a study basin and an “industry standard” unit hydrograph is used. A
number of unit hydrographs are “programmed” into HEC-HMS and/or have been published. It
is up to the engineer to select a unit hydrograph that best represents the study basin and to
compute/assign the constituent unit hydrograph parameters from the study basin
physiography; the unit hydrograph and associated parameters determine the shape (peak and
timing) of the IDF, but do not affect the total runoff volume. The preferred unit hydrograph for
computing dam hydrology in Montana is the Clark unit hydrograph and the dimensionless unit
hydrograph, but other methods may also be used with adequate documentation and
justification.
When applying the Clark unit hydrograph or the dimensionless unit hydrograph to a study
basin, the constituent parameters should be computed using Water-Supply Paper (WSP) 2420
Procedures for Estimating Unit Hydrographs for Large Floods at Ungaged Sites in Montana. The
equations and parameter ranges presented in WSP 2420 were developed from analysis of
precipitation and stream gage data throughout Montana. Hence, WSP 2420 is the best source
for computing unit hydrographs for drainage basins in Montana. Alternate references, such as
the Bureau of Reclamation’s Flood Hydrology Manual, are also acceptable sources for
hydrograph methods and equations to estimate basin parameters, and the likely range of those
parameters, based on the physiography of the study basin.

\\BIL-FS\BIL-projects\26\21407-01\94Rpts\WorkingGroupReport_R0.docx Page | 11
Salient Point(s):
WSP 2420 describes the preferred methods for developing a unit hydrograph.
Selecting the unit hydrograph method and developing the applicable unit hydrograph
parameters is left to the engineer’s judgement, but the basis for the unit hydrograph
developed to describe the study basin must be documented and justified.
The unit hydrograph defines the shape of the IDF hydrograph, but does not affect the
total runoff volume.
6.0 MODEL VALIDATION
Ideally, a rainfall-runoff model would be validated by comparing the model results to
streamflow and precipitation data obtained at the site of interest for several large storm
events. With such data, the rainfall-runoff model could be calibrated using data from one large
storm and validated using data from another large storm. Practically, however, that kind of at-
site data is rarely available when computing hydrology for dam safety evaluations. For most
dam safety evaluations, model validation is the process by which the engineer verifies model
results against independent flood-frequency estimates and “pseudo-calibrates” the model such
that model results are reasonably consistent with results from those independent methods. A
verified model is one that is demonstrated to produce peak runoff rates for floods having 100-
year and 500-year recurrence intervals and, on that basis, is determined to be acceptable for
computation of an IDF. After computation of the IDF, the IDF is evaluated for reasonableness
by comparing the maximum inflow rate of the IDF against measured peak stream discharge
rates throughout the region (i.e., an envelope curve). Thus, in this way, the IDF is determined
to be validated.
The validation process work flow and the definition for each step in the process were the
subject of much discussion by the Group, but the following definitions were eventually
accepted. Similarly, Section 6.4 presents a flow diagram of the validation process. Refer to
Appendix A for the Model Validation Checklist.
6.1 DEFINITIONS
6.1.1 Verification
The process in which the flood frequency results from a hydrologic model (total runoff volumes
and/or peak runoff rates) are compared to flood frequency estimates developed from an
independent method (or methods).

\\BIL-FS\BIL-projects\26\21407-01\94Rpts\WorkingGroupReport_R0.docx Page | 12
6.1.2 Calibration
The process in which the parameters of a hydrologic model are adjusted to replicate a
measured (or observed) event.
6.1.3 Pseudo-Calibration
The process in which the parameters of a hydrologic model are adjusted to reasonably
approximate a range of flood frequency values obtained independently from the rainfall-runoff
model (refer to Section 6.2 Verification), such as the 100- and 500-year flood magnitudes.
6.1.4 Simulation:
The process of using a validated model to produce flood frequency hydrographs and/or an IDF
hydrograph.
6.2 VERIFICATION
For dam safety evaluations, the engineer must verify that the hydrologic model used to
compute the IDF is producing reasonable results. Because IDFs are large, infrequent floods (i.e.,
≥ 500-year recurrence interval), verification of the hydrologic model must be accomplished
through comparison of model results for smaller floods (e.g., 100-year and 500-year recurrence
intervals) with other, independent methods for computing flood frequency. Acceptable
independent methods include the following:
USGS regional regression equations described in USGS Scientific Investigations Report
2015-5019, Montana StreamStats, Chapter F.
Transferring flood-frequency estimates from a gaging station on the same stream to an
ungaged site upstream or downstream using methods described in USGS Scientific
Investigations Report 2015-5019, Montana StreamStats, Chapter F.
Local regression equations for flood frequency developed from surrounding nearby
USGS stream gages having similar physiographic characteristics. Because local
regression equations are developed using Ordinary Least Squares (OLS) regression
methods that do not account for differing record lengths at gaging stations or for the
degree of inter-station correlation among gages, USGS regional regression equations
developed from Generalized Least Squares (GLS) regression generally are preferred over
local regression equations. Nevertheless, it is recognized that local regression equations
may provide more reliable estimates for flood frequency than those from USGS regional
equations in localized areas where physiographic and runoff characteristics at nearby
gages differ from those prevalent in the rest of the region.

\\BIL-FS\BIL-projects\26\21407-01\94Rpts\WorkingGroupReport_R0.docx Page | 13
In general, if the hydrologic model produces a result within one standard deviation or one
standard error of prediction (SEP) above the value computed from one of the acceptable
methods for verification, the hydrologic model can be considered verified. Statistical measures
of reliability are not comparable among the accepted verification methods, however, and may
not even be available for some methods. For situations where the one standard deviation or
one SEP cannot be reliably calculated, an acceptable reasonable upper bound for a modeled
result would be twice the value of the result from the selected verification method. Regardless
of the method employed to verify the reasonableness of the rainfall-runoff model results, the
engineer must document and justify the basis for concluding the IDF is acceptable.
6.3 PSEUDO-CALIBRATION / CALIBRATION
When the verification process shows the hydrologic model is not producing results that are
reasonably consistent with other methods for estimating flood magnitudes, the rainfall-runoff
model parameters must be adjusted to achieve an acceptable level of agreement. When
making parameter adjustments, the goal is not necessarily to “calibrate” the model to achieve a
specific flood magnitude, rather the goal is to “pseudo-calibrate” the model to produce
acceptable flood magnitudes over a range of flood frequencies.
When pseudo-calibrating a rainfall-runoff model, the engineer must understand the
implications associated with parameter adjustments. Specifically, adjustments to the loss
parameters (initial abstraction and infiltration) add to, or subtract from, the total runoff
volume, while adjustments to the routing parameters (e.g., time-of-concentration, basin
storage coefficient) change the shape of the runoff hydrograph without affecting runoff
volume. A sensitivity analysis will determine which parameters have the greatest and least
impacts on the model results, and the final parameter assignments should be maintained
within published ranges and/or reasonably represent the modeled basin’s characteristics.
As stated previously, the rainfall runoff response during an extreme flood, such as an IDF, is
often disproportionately more severe than more frequent events. Because of the nonlinearity
of the rainfall-runoff response phenomena, a model that is calibrated to a specific event will not
compute the peak runoff rate for a different flood frequency to the same level of accuracy. For
this reason, when pseudo-calibrating a rainfall runoff model, the modeler will have to assign
parameters that produce “acceptable” results over a range of flood frequencies.
Another aspect of the non-linearity of a basin’s response to increasing precipitation depth is the
slope of the flood frequency curve decreases with increasing return interval. A common
objective when pseudo-calibrating a rainfall-runoff model is to determine the combination of
\\BIL-FS\BIL-projects\26\21407-01\94Rpts\WorkingGroupReport_R0.docx Page | 14
basin parameters that produces results that closely approximates both the 100- and 500-year
flood magnitudes as computed/estimated through an independent method. When the model
is pseudo-calibrated and reasonably predicts these two events (within the values computed
using the independent method and reasonable upper bounds, such as one standard deviation
or SEP above the values), the model is generally believed to produce a reliable estimate of the
IDF peak inflow rate.
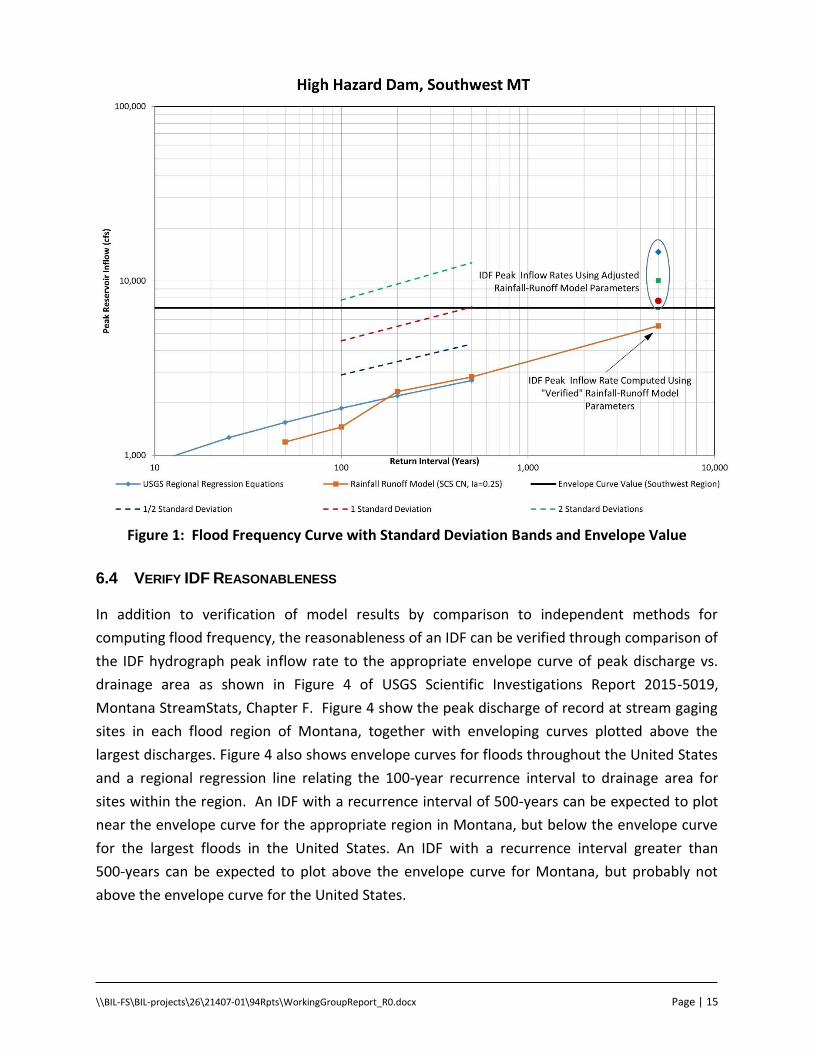
Figure 1 is a graph of the 100-year, 500-year, and IDF peak inflow rates obtained from a rainfall-
runoff model for a basin in southwestern Montana. Also shown on the graph are the upper
bands for one-half, one, and two standard deviations above the USGS Regional Regression
Equation results, and the envelope curve value for the specific basin area size, as well as the
peak inflow rate for the IDF computed using three alternate rainfall-runoff model parameter
sets. Of interest, while the rainfall-runoff model result for the 500-year peak inflow rate is in
very good agreement with the USGS Regional Regression Equation result, the peak inflow rate
computed for the IDF using those same basin parameters is less than 80% that of the envelope
curve value for the southwest region of Montana. For this application and the floods of records
in the southwest region of Montana, it is difficult to accept that the 5,000-year flood would fall
below the envelope curve. Similarly, it is also difficult to accept that a dam designed based on
this IDF hydrograph provides the minimum level of protection required by Montana’s Rules.
Consequently, for the example shown, it is necessary to make further adjustments to the basin
parameters to produce an IDF that is reasonable, such as, for example, the green square in the
ellipse of Figure 1.
\\BIL-FS\BIL-projects\26\21407-01\94Rpts\WorkingGroupReport_R0.docx Page | 15
Figure 1: Flood Frequency Curve with Standard Deviation Bands and Envelope Value
6.4 VERIFY IDF REASONABLENESS
In addition to verification of model results by comparison to independent methods for
computing flood frequency, the reasonableness of an IDF can be verified through comparison of
the IDF hydrograph peak inflow rate to the appropriate envelope curve of peak discharge vs.
drainage area as shown in Figure 4 of USGS Scientific Investigations Report 2015-5019,
Montana StreamStats, Chapter F. Figure 4 show the peak discharge of record at stream gaging
sites in each flood region of Montana, together with enveloping curves plotted above the
largest discharges. Figure 4 also shows envelope curves for floods throughout the United States
and a regional regression line relating the 100-year recurrence interval to drainage area for
sites within the region. An IDF with a recurrence interval of 500-years can be expected to plot
near the envelope curve for the appropriate region in Montana, but below the envelope curve
for the largest floods in the United States. An IDF with a recurrence interval greater than
500-years can be expected to plot above the envelope curve for Montana, but probably not
above the envelope curve for the United States.
\\BIL-FS\BIL-projects\26\21407-01\94Rpts\WorkingGroupReport_R0.docx Page | 16
6.5 VALIDATION PROCESS FLOW DIAGRAM
The flow diagram below (Figure 2) presents the verification, pseudo-calibration, and validation
process.
Salient Point(s):
Hydrologic models used to compute an IDF hydrograph must be validated.
Independent flood frequency analyses provide insight into how a basin may respond to
a precipitation event of the same frequency and can be used to guide hydrologic model
parameter assignments.
Hydrologic models can be considered verified if they produce a result equal to or
greater than the value computed from an acceptable independent method for the same
recurrence interval flood.
The IDF must be evaluated for reasonableness.

\\BIL-FS\BIL-projects\26\21407-01\94Rpts\WorkingGroupReport_R0.docx Page | 17
Figure 2: Hydrologic Model Validation & IDF Computation Process

\\BIL-FS\BIL-projects\26\21407-01\94Rpts\WorkingGroupReport_R0.docx Page | 18
7.0 MITIGATING UNCERTAINTY
It is the goal of the engineer is to develop a best estimate of the IDF, but the best estimate must
be balanced against the uncertainty inherent in hydrologic modeling. To mitigate uncertainty
and to ensure risk to the downstream community is commensurate with the statutory
requirement, a factor of safety must be incorporated into the design. Uncertainty mitigation
can be incorporated into the analysis process by selecting conservative hydrologic modeling
parameters that result in a greater IDF peak runoff rate and volume, but this “compounding
conservativism” can result in an IDF that is significantly larger than necessary. Freeboard
between the maximum pool elevation and the dam crest is the generally accepted method to
account for uncertainty (as well as other considerations), but freeboard may not adequately
account for uncertainty in the hydrologic analysis.
Assignment of a fixed freeboard value (e.g., three feet) and/or freeboard based on wave run-up
may not provide an adequate level of protection when compared to the uncertainty of an IDF.
Freeboard should be assigned commensurate with the uncertainty in the IDF – IDFs with larger
uncertainty should have more freeboard than IDFs with less uncertainty. Similarly, IDFs
computed closer to the “mean” (e.g., USGS Regional Regression Equation result) should have a
higher freeboard requirement than IDFs computed closer to one standard deviation (68%
confidence limit) over the mean (Figure 1). The engineer is cautioned against putting too much
confidence in use of a rainfall-runoff model that is pseudo-calibrated to accurately reproduce
the 100-year and 500-year flood magnitudes computed using the USGS Regional Regression
Equations. By definition, the regression equations produce a result that is representative of the
mean magnitude for the specific basin characteristics – 50% of the basins in the region would
be expected to experience peak runoff rates higher than computed using the regression
equations.
A potential method to compute freeboard that accounts for uncertainty in the IDF may be to
factor the IDF hydrograph by the ratio of the peak flood value at some specified confidence
limit for the 500-year flood magnitude to the peak runoff rate for the 500-year flood computed
by the rainfall-runoff model (see equation below). The factored IDF (freeboard) hydrograph
would then be “routed” through the spillway system and the minimum dam crest elevation
would be established as the peak reservoir stage that occurs from routing the factored IDF
(freeboard) hydrograph through the reservoir. Freeboard would then be the difference
between the reservoir stage during the factored IDF (freeboard) hydrograph and the peak stage
during the IDF. This concept for computing freeboard is un-vetted and should be explored
before being incorporated into TN-1, but it may provide a reasonable and consistent way to
compute freeboard that accounts for the uncertainty in the IDF.

\\BIL-FS\BIL-projects\26\21407-01\94Rpts\WorkingGroupReport_R0.docx Page | 19
𝐹𝑟𝑒𝑒𝑏𝑜𝑎𝑟𝑑 𝐻𝑦𝑑𝑟𝑜𝑔𝑟𝑎𝑝ℎ
= 𝐼𝐷𝐹 (𝑓𝑙𝑜𝑜𝑑 𝑚𝑎𝑔𝑛𝑖𝑡𝑢𝑑𝑒 𝑓𝑜𝑟 𝑠𝑝𝑒𝑐𝑖𝑓𝑖𝑒𝑑 𝑐𝑜𝑛𝑓𝑖𝑑𝑒𝑛𝑐𝑒 𝑙𝑖𝑚𝑖𝑡 𝑜𝑓 500 − 𝑦𝑒𝑎𝑟 𝑒𝑣𝑒𝑛𝑡
𝑟𝑎𝑖𝑛𝑓𝑎𝑙𝑙 − 𝑟𝑢𝑛𝑜𝑓𝑓 𝑚𝑜𝑑𝑒𝑙 𝑝𝑒𝑎𝑘 𝑖𝑛𝑓𝑙𝑜𝑤 𝑟𝑎𝑡𝑒 𝑓𝑜𝑟 500 − 𝑦𝑒𝑎𝑟 𝑒𝑣𝑒𝑛𝑡)
As an alternative to the “freeboard hydrograph”, uncertainty can be accounted for in the design
by determining the minimum spillway capacity based on an over-estimate of the loss of life that
would result from a dam failure. For this alternative approach, the over-estimate for loss of life
(risk) would need to be such that the resulting design basis IDF is sufficiently large to provide a
sense of confidence that the spillway/dam provides a level of protection that is commensurate
with the actual risk. Again, these “methods” are essentially un-vetted concepts and must be
evaluated for a range of loss of life and a range of reservoir capacities before being
incorporated into the Montana guidelines for analysis of spillway capacity in Montana.
Salient Point(s):
Because of the uncertainty in hydrologic modeling, it is possible that a computed IDF
does not provide the level of protection required by Rule.
Conservative parameter assignments can result in an unrealistically large IDF.
A fixed freeboard requirement may not adequately mitigate the uncertainty of an IDF
hydrograph.
Regional regression equations are developed to produce average flood magnitudes for
the specific basin characteristics that define the study area. The engineer is cautioned
against putting too much confidence in the equation results – the equations under
predict flood magnitude 50% of the time.
Freeboard should be assigned commensurate with uncertainty – as uncertainty
increases, freeboard should also increase.

\\BIL-FS\BIL-projects\26\21407-01\94Rpts\WorkingGroupReport_R0.docx Page | 20
8.0 STATE OF THE PRACTICE
The responses to the state representatives survey offers insight into the state of the practice of dam hydrology outside of Montana. The complete responses are available upon request, but the general conclusions are presented below.
Table 1: General Conclusions from Survey of States on Hydrologic Modeling
Topic General Conclusion
Guidelines requiring specific parameters or methods
Most states do not have hydrologic modeling requirements in their rules. Guidance is provided in some cases, but in general, it is up to the engineer. Most require justification in design submittal for parameters and analysis method choice. Some states complete an independent analysis as a check of engineer’s methodology and assumptions.
Conservatism A conservative approach is often encouraged due to lack of data and uncertainty. A few strive for best estimate, but then also require a sensitivity analysis.
Calibration/Verification Frequency Storms
Eastern states often have sufficient gage data for calibration. Gage data is much rarer moving west. Thus, 100- and 500-year frequency storms are most commonly used for calibration. Answers in general did not clearly specify what basin response parameters were tweaked to calibrate. One state noted that use of the unit hydrograph lag time for calibration was preferred over using hydrologic losses.
Regression Equation Use for Calibration
Local regression equations are generally preferred. Regional regression equations are allowed by most states, but not all. They are discouraged by some states due to the unreliableness of the equations. One state noted that model flows are commonly higher than USGS regression equation flows. Several noted USGS regression equations are used only to make sure results are reasonable, not for calibration….finding a gage for a similar watershed is preferred.
Subbasin Delineation Most rely on good engineering judgement, but find this is a complicated issue that often requires discussion with the design engineer. Some ask that a sensitivity analysis be performed.
Uncertainty
Most states do not address uncertainty, a few require calibration above the median; others require calibration to fall within the mean flow plus one standard deviation. Many states do a sensitivity analysis as part of their review process.
Loss Method
The SCS curve number method is the most commonly used, other loss methods are also allowed. Similarly, 0.2S is the most common method for estimating initial abstraction and AMC2 for antecedent moisture. Most states do not differentiate initial abstraction/antecedent moisture for calibration runs from model runs. Some noted that wet conditions may be more appropriate for modeling PMF events.

\\BIL-FS\BIL-projects\26\21407-01\94Rpts\WorkingGroupReport_R0.docx Page | 21
9.0 CONCLUSIONS
Over the course of seven meetings, the Extreme Storm Working Group discussed the major
elements and considerations for determining an Inflow Design Flood hydrograph. It is
anticipated that the Group’s conclusions and recommendations will be incorporated into a
future revision of Technical Note 1 Analysis of Spillway Capacity in Montana (TN-1). A law or
rule change was determined to not be necessary. Below is a list of the major conclusions and
recommendations.
The engineer is responsible for selecting the most appropriate method for determining
an IDF and for selecting rainfall-runoff parameters, but those selections must be
documented and justified.
For determination of spillway capacity, the objective of a hydrologic study is to develop
a “best estimate” for the IDF and an awareness of the uncertainty associated with the
IDF.
Awareness of uncertainty comes from a flood frequency analysis using a variety of
methods to estimate flood magnitudes, coupled with a sensitivity analysis on the
rainfall-runoff model parameters.
IDFs with recurrence intervals from 500-years to 5,000-years are more sensitive to
model parameters than are IDFs that approach the PMF.
Hydrologic models must be validated to assure they produce an IDF that is
commensurate with the downstream risk.
Use of the Hydrometeorological Reports (HMRs) developed by the National Weather
Service for Probable Maximum Precipitation (PMP) is adequate for evaluation of
existing high hazard dams. For design and construction of a new high hazard dam,
development of a site specific PMP should be considered.
Methods to compute freeboard that account for uncertainty should be explored.
A law or rule change is not necessary. The Montana specific guideline for developing
the inflow design flood (Technical Note 1) should be updated to reflect the
recommendations of the Group.

\\BIL-FS\BIL-projects\26\21407-01\94Rpts\WorkingGroupReport_R0.docx Page | 22
10.0 REFERENCES
1. Montana Department of Natural Resources and Conservation Dam Safety Program
(http://dnrc.mt.gov/divisions/water/operations/dam-safety)
2. Technical Note 1 (TN-1) Analysis of Spillway Capacity in Montana
(http://dnrc.mt.gov/divisions/water/operations/dam-safety/technical-references-and-
links/technical-notes)
3. Hydrologic Standard for Emergency and Principal Spillways (ARM 36.14.502)
(http://www.mtrules.org/gateway/ruleno.asp?RN=36.14.502)
4. Hydrometeorological Design Studies Center
(http://www.nws.noaa.gov/oh/hdsc/studies/pmp.html)
5. Characteristics of Extreme Storms in Montana and Methods for Constructing Synthetic
Storm Hyetographs, WRIR 98-4100 (https://pubs.usgs.gov/wri/1998/4100/report.pdf)
6. Standard Flood Determination, EM 1110-2-1411
(http://www.publications.usace.army.mil/Portals/76/Publications/EngineerManuals/EM_11
10-2-1411.pdf)
7. Flood Hydrology Manual (http://www.usbr.gov/tsc/techreferences/mands/mands-
pdfs/FloodHyd.pdf)
8. A Methodology for Point-to-Area Rainfall Frequency Ratios, NOAA Technical Report NWS 24
(http://www.nws.noaa.gov/oh/hdsc/Technical_reports/TR24.pdf)
9. Earth Dams and Reservoirs, TR-60
(https://directives.sc.egov.usda.gov/OpenNonWebContent.aspx?content=24937.wba)
10. Procedures for Estimating Unit Hydrographs for Large Floods at Ungaged Sites in Montana,
WSP 2420 (https://pubs.er.usgs.gov/publication/wsp2420)
11. Montana StreamStats, SIR 2015-5019 (https://pubs.er.usgs.gov/publication/sir20155019)

APPENDIX A –MODEL VALIDATION
CHECKLIST

Appendix A Model Validation Checklist Page A-1
Model Validation Checklist #1Actual Event Compare modeled results with measured or estimated flows for an actual storm event at nearby streamflow or crest stage gages with similar basin characteristics, using measured precipitation at applicable rain gages.
• If rain gage data are not available, storm characteristics may be estimated using NEXRAD data available through NOAA, or on the PRISM Climate Group website.
• If nearby streamflow gages do not have similar characteristics, or gage data are not available, request USGS to conduct an indirect measurement to estimate the maximum streamflow during the event
• Interview local eyewitnesses for information on measured flows, depth of water in spillways, starting water surface elevations peak of storm, lag following rainfall, etc.
• Consider antecedent conditions preceding storm – include this in model. A series of storms commonly precede a large event.
• Part of the process is to understand the most significant gage parameters that are being used in the validation or calibration (i.e. rainfall or snowmelt).
#2 Flood Frequency Estimates on Nearby Streamflow gages Compare modeled results with 25-, 100-, and 500-year flood frequency estimates for nearby streamflow gages that have similar basin characteristics (Table 1-6 in USGS Scientific Investigations Report 2015-5019, Montana StreamStats, Chapter F.).
#3USGS Regional Regression Equations Compare the rainfall-runoff model results with results from the USGS regional regression equations. USGS regional regression equations may also be applied at the sub-basin level. Use the USGS regional regression equations described in USGS Scientific Investigations Report 2015-5019, Montana StreamStats, Chapter C.
• Applicability of the regression equations in a region of interest must be evaluated first by comparing flood frequency estimates on nearby streamflow gages that were used in the equations with regional regression equation estimates for those gages. If significant deviation is present, regional regression equations should not be relied upon.
• Determine the size of drainage basins used in regional regression equations. If most basins are larger than the basin of interest, then the results will be biased towards bigger basins. Big drainages tend to attenuate more, and therefore the regional regression equations may underestimate flows and, hence, not be applicable to the study basin.
• Verify that regional basin parameters are within the range used to develop the equations

Appendix A Model Validation Checklist Page A-2
#4 Local Regression Equations Compare the rainfall-runoff model results with results from local regression equations for flood frequency developed from surrounding nearby USGS stream gages having similar physiographic characteristics.
• Identify nearby gages with similar basin characteristics (Table 1-1in USGS SIR 2015-5019-F ) • Using MT Dept. of Transportation (MDOT) local regression equation spreadsheet (unpublished,
available from DNRC Dam Safety upon request with permission from MDOT) and basin characteristics of nearby gages (i.e. area, elevation above 5000 feet, etc.), develop local regression equations for 100 and 500 year floods
• Using these regression equations, calculate 100 year and 500 year floods for basin of interest • Compare with local regression results for flood frequency with the rainfall-runoff model results.
If necessary, psuedo-calibrate the rainfall-runoff model basin parameters such that the rainfall-runoff model matches results from the local regression equations
#5. Conduct a Sensitivity Analysis / Document Awareness of Uncertainty
• Evaluate model sensitivity to subbasin definition, initial abstraction, loss method , unit hydrograph, and routing methods
• Document uncertainty by plotting the flood frequency curve with standard deviation or error bounds
#6 Reality Check / Reasonableness Test
• Compare the sum of individual modeled sub basin outflows to the modeled flow at lowest point of interest. Is attenuation occurring in a realistic manner?
• Determine velocities in the model reaches. Is the model matching what you would physically expect to find in the field?
• Look at drainage basin land cover when estimating initial abstraction. Examine photos – do the loss parameters assumed look right? More information on area soil characteristics can be found on the Natural Resources Conservation Service Web Soil Survey App.
• Do the flows look reasonable for the type of channel? • Are Mannings n’s in line with what would be seen during a large, out-of-bank flood event? • If there are potholes, wetlands, or other depressions in the drainage area, it may be necessary
to use the Modified Puls method for routing. • If baseflow is used, is it representative of what is normally in the stream during the time of year
a large runoff event is most likely to occur? Note that a quick approximation is to use the 2 year flow.
• Is baseflow too large – is it impacting storage in the reservoir(s) and skewing results?

Appendix A Model Validation Checklist Page A-3
#7. Envelope Curves Calculate unit peak discharge (cfs/sq mi) and compare the IDF hydrograph peak inflow rate to the appropriate envelope curve of peak discharge vs. drainage area as shown in Figure 4 of USGS Scientific Investigations Report 2015-5019, Montana StreamStats, Chapter F.