Montana Department of Justice Forensic Science Division ... · General Tim Fox and Forensic Science...
35
Montana Department of Justice Forensic Science Division Annual Report - 2017 Scott Larson, Administrator Forensic Science Division and State Medical Examiner’s Office Montana Department of Justice
Transcript of Montana Department of Justice Forensic Science Division ... · General Tim Fox and Forensic Science...
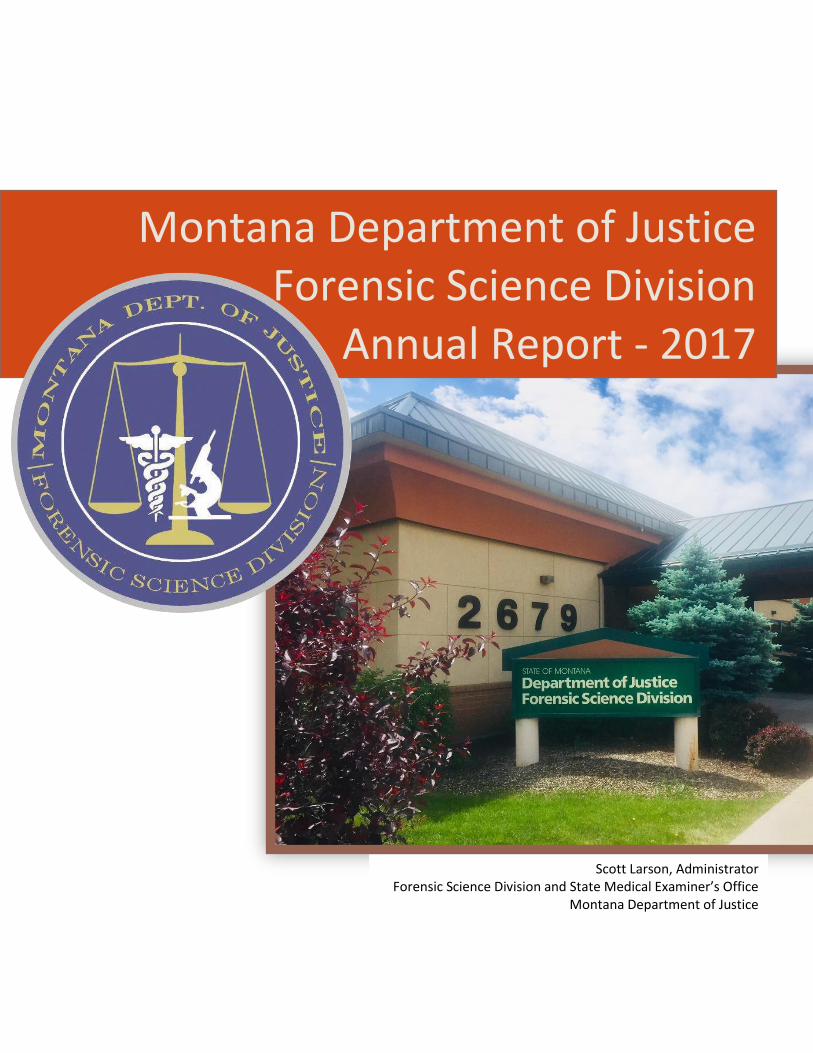
Montana Department of Justice Forensic Science Division
Annual Report - 2017
Scott Larson, Administrator Forensic Science Division and State Medical Examiner’s Office
Montana Department of Justice
1 Montana Department of Justice, Forensic Science Division Annual Report - 2017
June 11, 2018
Contents
The Forensic Science Division ................. 1-6
State Medical Examiner’s Office ............. 7-8
Toxicology Section ................................ 9-26
Chemical Analysis Section .................. 27-29
Latent Prints Section ................................. 30
DNA/Serology Section ........................ 31-32
Firearms/Tool Marks Section .................... 33
Quality Assurance and Evidence Section…34
2 Montana Department of Justice, Forensic Science Division Annual Report - 2017
June 11, 2018
Executive Summary This report will provide a high-level overview of the entire Division as well as detailed information regarding each of the scientific sections of the laboratory. This is an opportunity to reflect on our accomplishments and challenges from the previous year. I am proud of the professionalism and skills of every individual that works at the laboratory. I believe they provide a great service to the citizens of Montana and the criminal justice system.
Forensic Science Division The Forensic Science Division (FSD), better known as the State Crime Lab, is one of eight Divisions within the Department of Justice. It was established in Montana Code in 1977. Our Mission is to provide accurate, objective and timely forensic analysis in support of the Montana criminal justice community. The Division has facilities in both Missoula and Billings. The Missoula facility houses the Medical Examiners, DNA/Serology, Toxicology, Chemical Analysis, Latent Prints, Firearms/Toolmarks, Quality Assurance, and Evidence sections. The Billings facility contains Medical Examiner, Chemical Analysis, and Evidence sections.
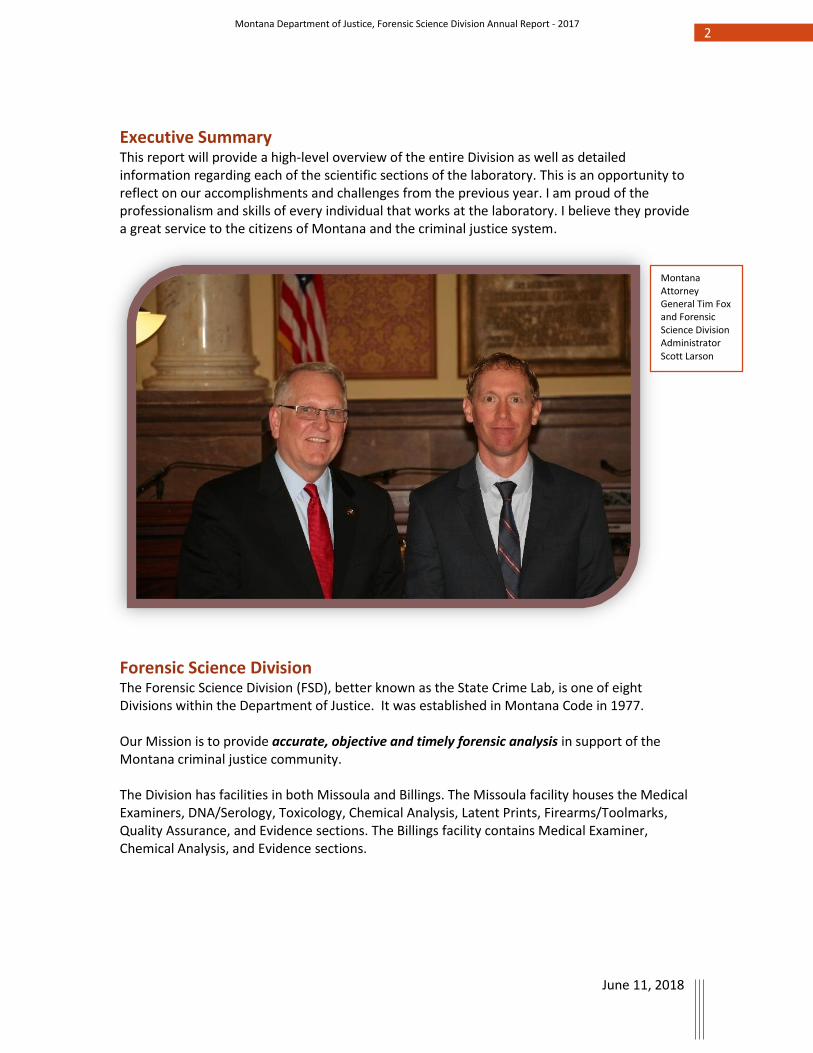
Montana Attorney General Tim Fox and Forensic Science Division Administrator Scott Larson
3 Montana Department of Justice, Forensic Science Division Annual Report - 2017
June 11, 2018
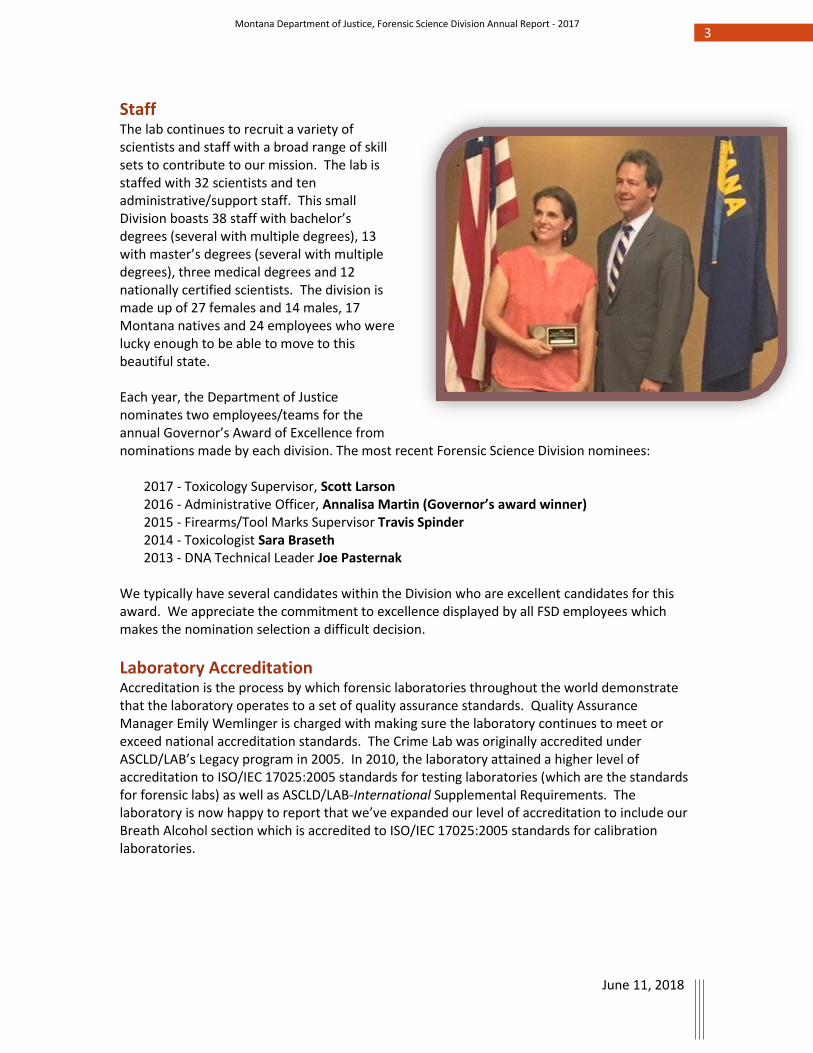
Staff The lab continues to recruit a variety of scientists and staff with a broad range of skill sets to contribute to our mission. The lab is staffed with 32 scientists and ten administrative/support staff. This small Division boasts 38 staff with bachelor’s degrees (several with multiple degrees), 13 with master’s degrees (several with multiple degrees), three medical degrees and 12 nationally certified scientists. The division is made up of 27 females and 14 males, 17 Montana natives and 24 employees who were lucky enough to be able to move to this beautiful state. Each year, the Department of Justice nominates two employees/teams for the annual Governor’s Award of Excellence from nominations made by each division. The most recent Forensic Science Division nominees:
2017 - Toxicology Supervisor, Scott Larson 2016 - Administrative Officer, Annalisa Martin (Governor’s award winner) 2015 - Firearms/Tool Marks Supervisor Travis Spinder 2014 - Toxicologist Sara Braseth 2013 - DNA Technical Leader Joe Pasternak
We typically have several candidates within the Division who are excellent candidates for this award. We appreciate the commitment to excellence displayed by all FSD employees which makes the nomination selection a difficult decision.
Laboratory Accreditation Accreditation is the process by which forensic laboratories throughout the world demonstrate that the laboratory operates to a set of quality assurance standards. Quality Assurance Manager Emily Wemlinger is charged with making sure the laboratory continues to meet or exceed national accreditation standards. The Crime Lab was originally accredited under ASCLD/LAB’s Legacy program in 2005. In 2010, the laboratory attained a higher level of accreditation to ISO/IEC 17025:2005 standards for testing laboratories (which are the standards for forensic labs) as well as ASCLD/LAB-International Supplemental Requirements. The laboratory is now happy to report that we’ve expanded our level of accreditation to include our Breath Alcohol section which is accredited to ISO/IEC 17025:2005 standards for calibration laboratories.
4 Montana Department of Justice, Forensic Science Division Annual Report - 2017
June 11, 2018
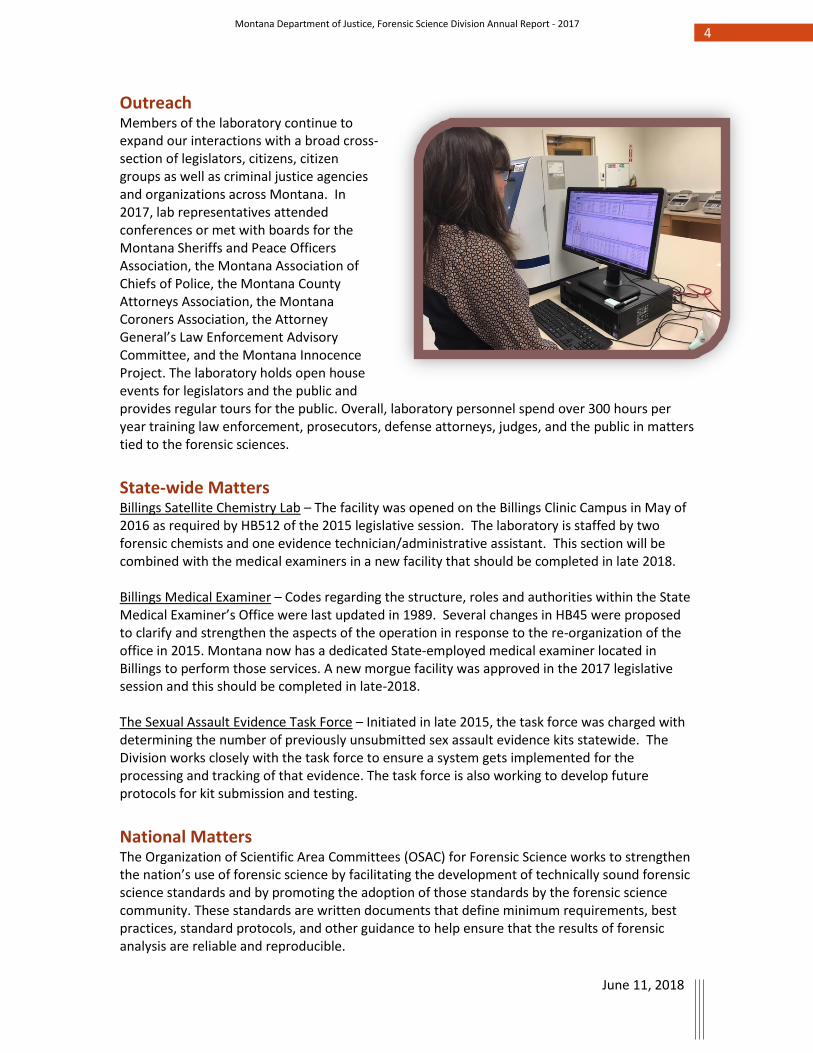
Outreach Members of the laboratory continue to expand our interactions with a broad cross-section of legislators, citizens, citizen groups as well as criminal justice agencies and organizations across Montana. In 2017, lab representatives attended conferences or met with boards for the Montana Sheriffs and Peace Officers Association, the Montana Association of Chiefs of Police, the Montana County Attorneys Association, the Montana Coroners Association, the Attorney General’s Law Enforcement Advisory Committee, and the Montana Innocence Project. The laboratory holds open house events for legislators and the public and provides regular tours for the public. Overall, laboratory personnel spend over 300 hours per year training law enforcement, prosecutors, defense attorneys, judges, and the public in matters tied to the forensic sciences.
State-wide Matters Billings Satellite Chemistry Lab – The facility was opened on the Billings Clinic Campus in May of 2016 as required by HB512 of the 2015 legislative session. The laboratory is staffed by two forensic chemists and one evidence technician/administrative assistant. This section will be combined with the medical examiners in a new facility that should be completed in late 2018. Billings Medical Examiner – Codes regarding the structure, roles and authorities within the State Medical Examiner’s Office were last updated in 1989. Several changes in HB45 were proposed to clarify and strengthen the aspects of the operation in response to the re-organization of the office in 2015. Montana now has a dedicated State-employed medical examiner located in Billings to perform those services. A new morgue facility was approved in the 2017 legislative session and this should be completed in late-2018. The Sexual Assault Evidence Task Force – Initiated in late 2015, the task force was charged with determining the number of previously unsubmitted sex assault evidence kits statewide. The Division works closely with the task force to ensure a system gets implemented for the processing and tracking of that evidence. The task force is also working to develop future protocols for kit submission and testing.
National Matters The Organization of Scientific Area Committees (OSAC) for Forensic Science works to strengthen the nation’s use of forensic science by facilitating the development of technically sound forensic science standards and by promoting the adoption of those standards by the forensic science community. These standards are written documents that define minimum requirements, best practices, standard protocols, and other guidance to help ensure that the results of forensic analysis are reliable and reproducible.
5 Montana Department of Justice, Forensic Science Division Annual Report - 2017
June 11, 2018
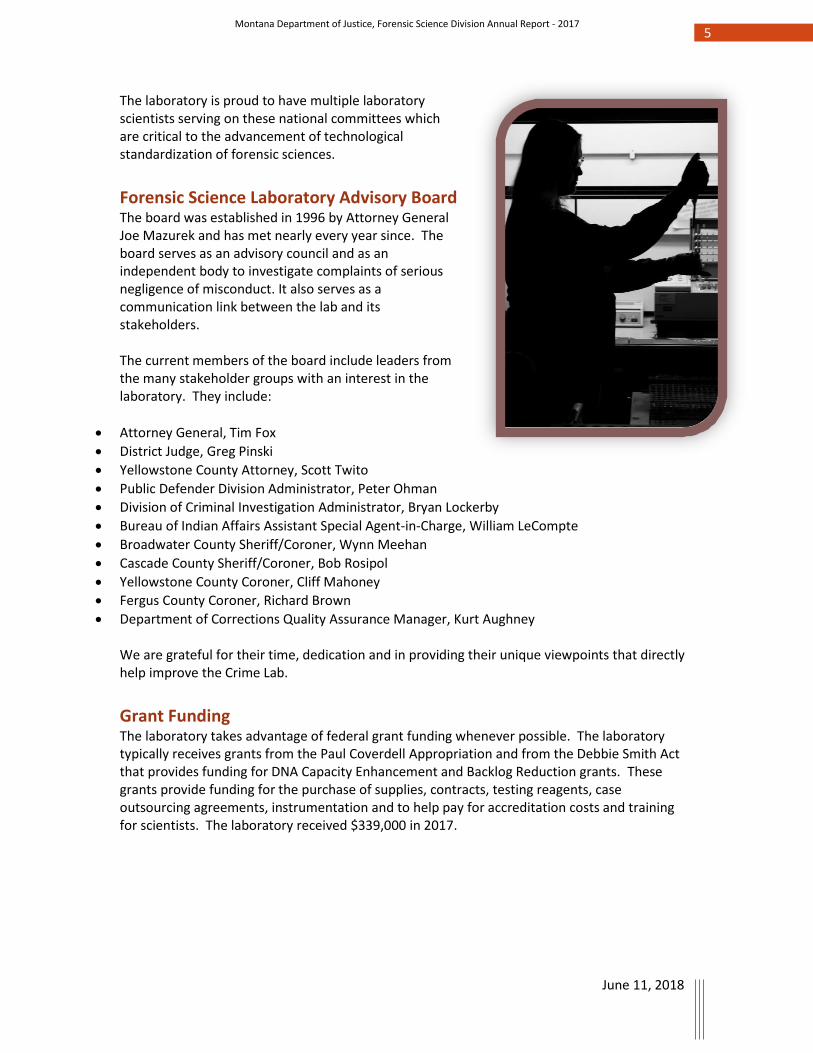
The laboratory is proud to have multiple laboratory scientists serving on these national committees which are critical to the advancement of technological standardization of forensic sciences.
Forensic Science Laboratory Advisory Board The board was established in 1996 by Attorney General Joe Mazurek and has met nearly every year since. The board serves as an advisory council and as an independent body to investigate complaints of serious negligence of misconduct. It also serves as a communication link between the lab and its stakeholders. The current members of the board include leaders from the many stakeholder groups with an interest in the laboratory. They include:
• Attorney General, Tim Fox
• District Judge, Greg Pinski
• Yellowstone County Attorney, Scott Twito
• Public Defender Division Administrator, Peter Ohman
• Division of Criminal Investigation Administrator, Bryan Lockerby
• Bureau of Indian Affairs Assistant Special Agent-in-Charge, William LeCompte
• Broadwater County Sheriff/Coroner, Wynn Meehan
• Cascade County Sheriff/Coroner, Bob Rosipol
• Yellowstone County Coroner, Cliff Mahoney
• Fergus County Coroner, Richard Brown
• Department of Corrections Quality Assurance Manager, Kurt Aughney We are grateful for their time, dedication and in providing their unique viewpoints that directly help improve the Crime Lab.
Grant Funding The laboratory takes advantage of federal grant funding whenever possible. The laboratory typically receives grants from the Paul Coverdell Appropriation and from the Debbie Smith Act that provides funding for DNA Capacity Enhancement and Backlog Reduction grants. These grants provide funding for the purchase of supplies, contracts, testing reagents, case outsourcing agreements, instrumentation and to help pay for accreditation costs and training for scientists. The laboratory received $339,000 in 2017.
6 Montana Department of Justice, Forensic Science Division Annual Report - 2017
June 11, 2018
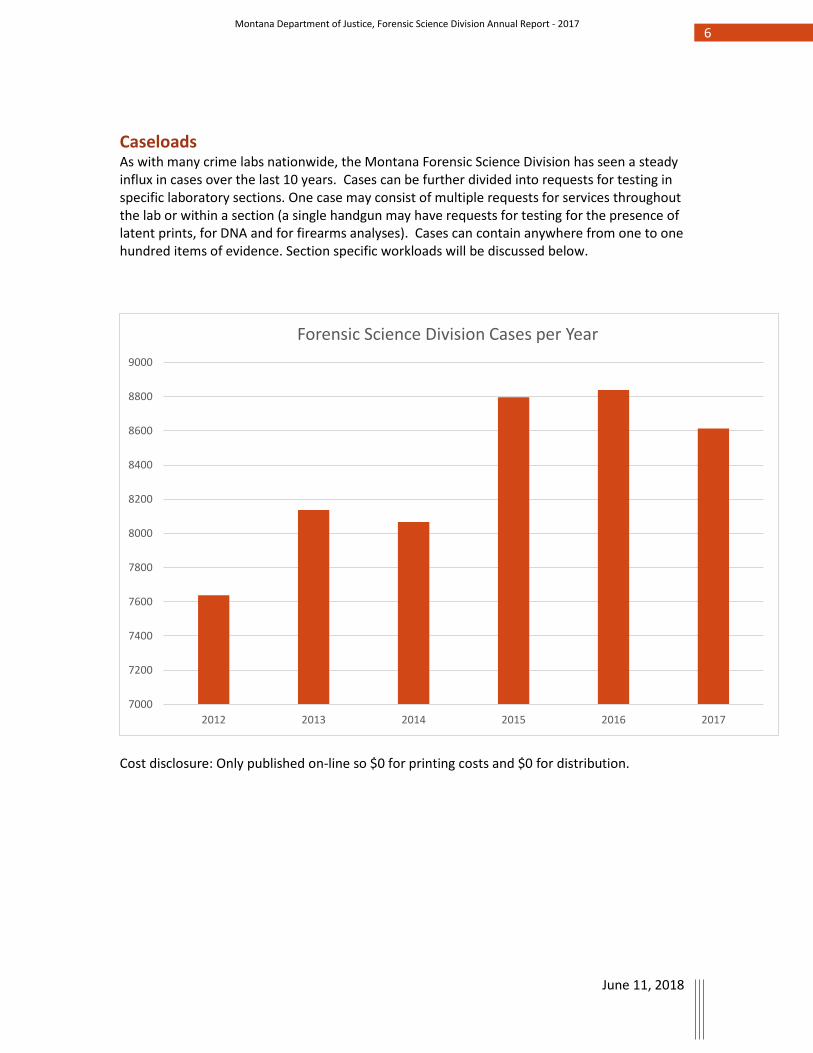
Caseloads As with many crime labs nationwide, the Montana Forensic Science Division has seen a steady influx in cases over the last 10 years. Cases can be further divided into requests for testing in specific laboratory sections. One case may consist of multiple requests for services throughout the lab or within a section (a single handgun may have requests for testing for the presence of latent prints, for DNA and for firearms analyses). Cases can contain anywhere from one to one hundred items of evidence. Section specific workloads will be discussed below.
Cost disclosure: Only published on-line so $0 for printing costs and $0 for distribution.
7000
7200
7400
7600
7800
8000
8200
8400
8600
8800
9000
2012 2013 2014 2015 2016 2017
Forensic Science Division Cases per Year
7 Montana Department of Justice, Forensic Science Division Annual Report - 2017
June 11, 2018
The State Medical Examiner’s Office The Montana Medical Examiner’s Office employs three forensic pathologists and two autopsy assistants. Two pathologists work in Missoula to serve the needs of coroners in western Montana. One pathologist currently works out of St. Vincent Hospital in Billings to serve the needs of coroners in Eastern Montana. In 2017, a total of 575 postmortem examinations were performed (Missoula 321, Billings 254). Our pathologists responded to a limited number of scene investigations and recoveries. We provided court testimony and made educational presentations at the annual Montana Coroner Advanced and Basic Coroner trainings. Informational meetings took place with coroners, law enforcement, county attorneys, organ and tissue procurement agencies, and funeral directors.
Staff Dr. Robert Kurtzman Chief Medical Examiner, Billings
Dr. Sunil Prashar Deputy Chief Medical Examiner, Missoula
Dr. Aldo Fusaro Deputy Chief Medical Examiner, Missoula
Heather Krell Autopsy Assistant, Missoula
Heather Beeler Autopsy Assistant, Billings
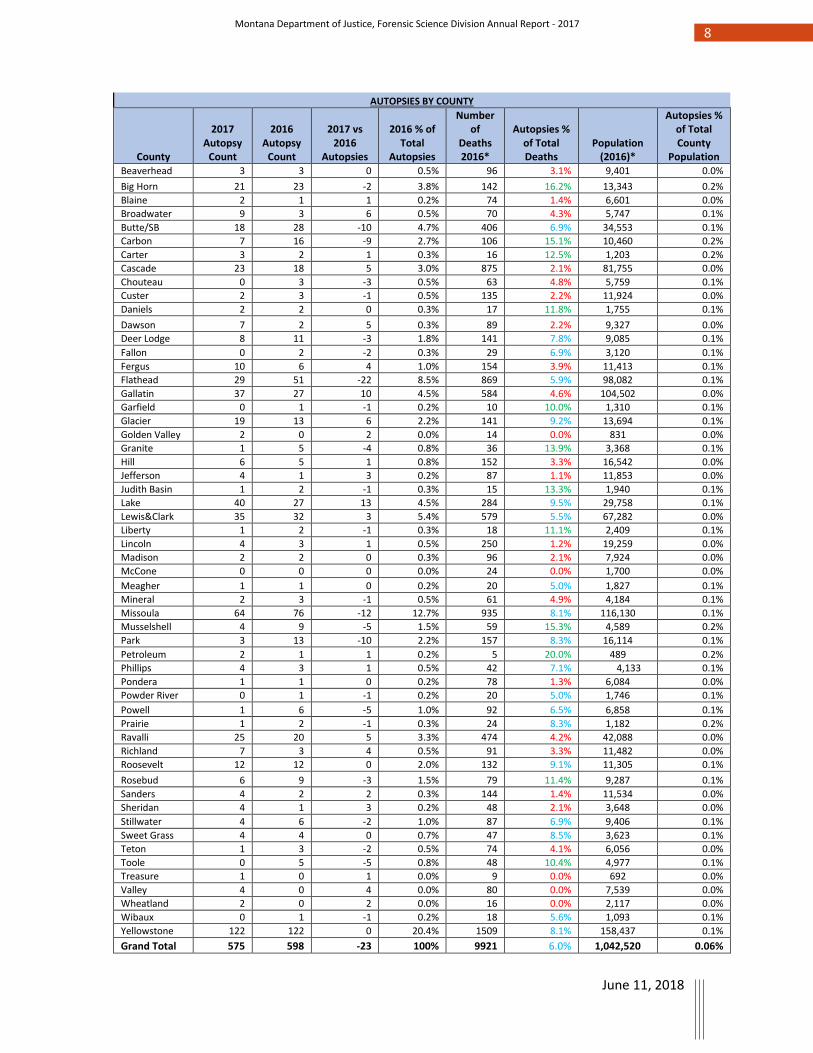
TOTAL AUTOPSIES BY COUNTY: Montana consists of 56 counties. Approximately 2/3 of the population resides in the western half of the state, which is served by the Missoula office. The eastern half contains the state’s largest city, Billings, with a city population of 110,323. At the time of this report, the population and death statistics for 2017 are not currently available from Vital Statistics; therefore, most of the information contained in the chart relates to 2016. The chart below shows the following information by county: 2017 autopsy count, 2016 autopsy count, change in autopsy count between 2016 and 2017, 2016 percent of total autopsies performed by medical examiner, total death per county, autopsy percentage relative to total deaths, county population and the percentage of autopsies relative to the total county population. The chart shows twelve counties (21%) (green) meet or exceed SWGMDI recommendations for 10% autopsy rate. Twenty counties (35%) (blue) have an autopsy rate between 5% and 10%. While this autopsy percentage is below 10%, it is consistent with NAME certified medical examiner offices that report 5% to 7% autopsy rate. Twenty-eight (50%) counties (red) have an autopsy rate below 5% and do not meet the SWGMDI recommendations. There are a variety of factors that significantly affect the listed autopsy percentages, in particular a county with a low population may experience a significant autopsy percentage change with just 1 autopsy. It would be valuable to look at autopsy percentage rates per county over several years. Regardless, 50% of Montana counties have an autopsy rate below the SWGMDI recommendations and below the national average for NAME certified medical examiner facilities. This suggests opportunities have been missed in some counties to identify issues that have significant public health risks or potentially criminal activity. Including all Montana Counties the autopsy percentage is 6%.
The Medical Examiner’s Office has focused on improving information and statistics regarding its casework in recent years. The Office releases its own annual report, which summarizes the annual case results based on manner of death, age of the decedent, deaths involving firearms, deaths attributable to alcohol or drugs, natural deaths, and report turn-around time performance. The full report can be found on the Montana Department of Justice website under the Forensic Science Division tab.
8 Montana Department of Justice, Forensic Science Division Annual Report - 2017
June 11, 2018
AUTOPSIES BY COUNTY
County
2017 Autopsy
Count
2016 Autopsy
Count
2017 vs 2016
Autopsies
2016 % of Total
Autopsies
Number of
Deaths 2016*
Autopsies % of Total Deaths
Population (2016)*
Autopsies % of Total County
Population Beaverhead 3 3 0 0.5% 96 3.1% 9,401 0.0%
Big Horn 21 23 -2 3.8% 142 16.2% 13,343 0.2%
Blaine 2 1 1 0.2% 74 1.4% 6,601 0.0%
Broadwater 9 3 6 0.5% 70 4.3% 5,747 0.1%
Butte/SB 18 28 -10 4.7% 406 6.9% 34,553 0.1%
Carbon 7 16 -9 2.7% 106 15.1% 10,460 0.2%
Carter 3 2 1 0.3% 16 12.5% 1,203 0.2%
Cascade 23 18 5 3.0% 875 2.1% 81,755 0.0%
Chouteau 0 3 -3 0.5% 63 4.8% 5,759 0.1%
Custer 2 3 -1 0.5% 135 2.2% 11,924 0.0%
Daniels 2 2 0 0.3% 17 11.8% 1,755 0.1%
Dawson 7 2 5 0.3% 89 2.2% 9,327 0.0%
Deer Lodge 8 11 -3 1.8% 141 7.8% 9,085 0.1%
Fallon 0 2 -2 0.3% 29 6.9% 3,120 0.1%
Fergus 10 6 4 1.0% 154 3.9% 11,413 0.1%
Flathead 29 51 -22 8.5% 869 5.9% 98,082 0.1%
Gallatin 37 27 10 4.5% 584 4.6% 104,502 0.0%
Garfield 0 1 -1 0.2% 10 10.0% 1,310 0.1%
Glacier 19 13 6 2.2% 141 9.2% 13,694 0.1%
Golden Valley 2 0 2 0.0% 14 0.0% 831 0.0%
Granite 1 5 -4 0.8% 36 13.9% 3,368 0.1%
Hill 6 5 1 0.8% 152 3.3% 16,542 0.0%
Jefferson 4 1 3 0.2% 87 1.1% 11,853 0.0%
Judith Basin 1 2 -1 0.3% 15 13.3% 1,940 0.1%
Lake 40 27 13 4.5% 284 9.5% 29,758 0.1%
Lewis&Clark 35 32 3 5.4% 579 5.5% 67,282 0.0%
Liberty 1 2 -1 0.3% 18 11.1% 2,409 0.1%
Lincoln 4 3 1 0.5% 250 1.2% 19,259 0.0%
Madison 2 2 0 0.3% 96 2.1% 7,924 0.0%
McCone 0 0 0 0.0% 24 0.0% 1,700 0.0%
Meagher 1 1 0 0.2% 20 5.0% 1,827 0.1%
Mineral 2 3 -1 0.5% 61 4.9% 4,184 0.1%
Missoula 64 76 -12 12.7% 935 8.1% 116,130 0.1%
Musselshell 4 9 -5 1.5% 59 15.3% 4,589 0.2%
Park 3 13 -10 2.2% 157 8.3% 16,114 0.1%
Petroleum 2 1 1 0.2% 5 20.0% 489 0.2%
Phillips 4 3 1 0.5% 42 7.1% 4,133 0.1%
Pondera 1 1 0 0.2% 78 1.3% 6,084 0.0%
Powder River 0 1 -1 0.2% 20 5.0% 1,746 0.1%
Powell 1 6 -5 1.0% 92 6.5% 6,858 0.1%
Prairie 1 2 -1 0.3% 24 8.3% 1,182 0.2%
Ravalli 25 20 5 3.3% 474 4.2% 42,088 0.0%
Richland 7 3 4 0.5% 91 3.3% 11,482 0.0%
Roosevelt 12 12 0 2.0% 132 9.1% 11,305 0.1%
Rosebud 6 9 -3 1.5% 79 11.4% 9,287 0.1%
Sanders 4 2 2 0.3% 144 1.4% 11,534 0.0%
Sheridan 4 1 3 0.2% 48 2.1% 3,648 0.0%
Stillwater 4 6 -2 1.0% 87 6.9% 9,406 0.1%
Sweet Grass 4 4 0 0.7% 47 8.5% 3,623 0.1%
Teton 1 3 -2 0.5% 74 4.1% 6,056 0.0%
Toole 0 5 -5 0.8% 48 10.4% 4,977 0.1%
Treasure 1 0 1 0.0% 9 0.0% 692 0.0%
Valley 4 0 4 0.0% 80 0.0% 7,539 0.0%
Wheatland 2 0 2 0.0% 16 0.0% 2,117 0.0%
Wibaux 0 1 -1 0.2% 18 5.6% 1,093 0.1%
Yellowstone 122 122 0 20.4% 1509 8.1% 158,437 0.1%
Grand Total 575 598 -23 100% 9921 6.0% 1,042,520 0.06%
9 Montana Department of Justice, Forensic Science Division Annual Report - 2017
June 11, 2018
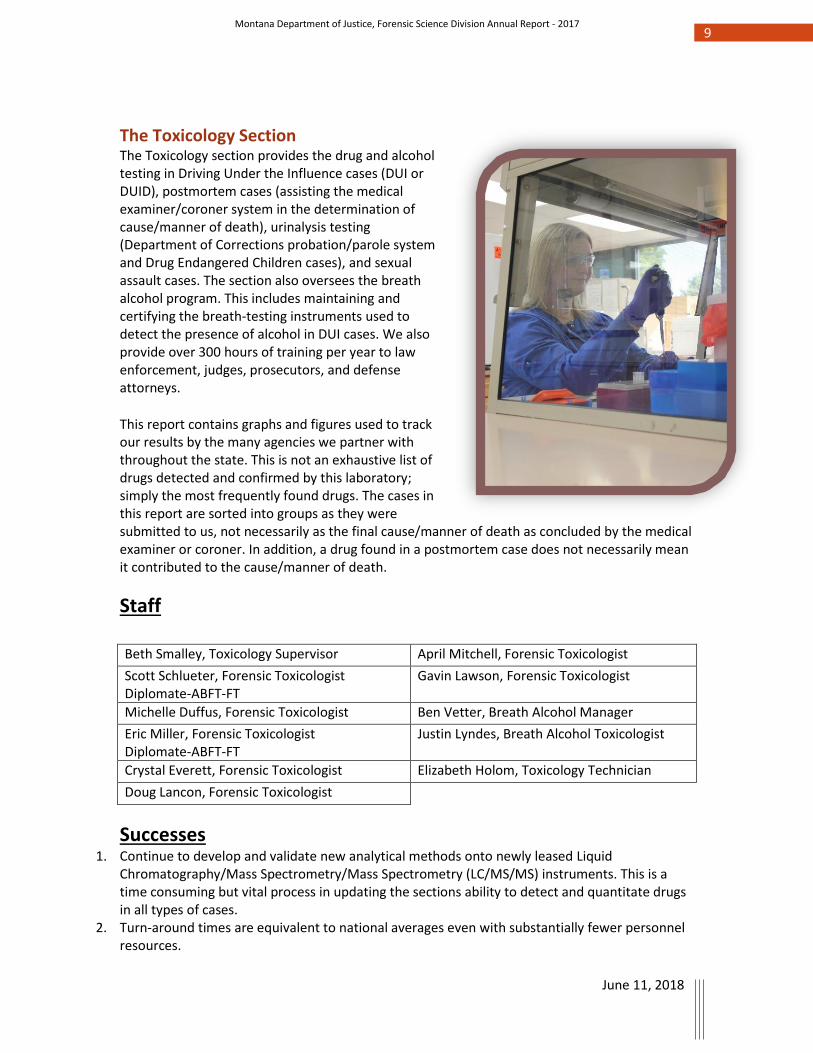
The Toxicology Section The Toxicology section provides the drug and alcohol testing in Driving Under the Influence cases (DUI or DUID), postmortem cases (assisting the medical examiner/coroner system in the determination of cause/manner of death), urinalysis testing (Department of Corrections probation/parole system and Drug Endangered Children cases), and sexual assault cases. The section also oversees the breath alcohol program. This includes maintaining and certifying the breath-testing instruments used to detect the presence of alcohol in DUI cases. We also provide over 300 hours of training per year to law enforcement, judges, prosecutors, and defense attorneys.
This report contains graphs and figures used to track our results by the many agencies we partner with throughout the state. This is not an exhaustive list of drugs detected and confirmed by this laboratory; simply the most frequently found drugs. The cases in this report are sorted into groups as they were submitted to us, not necessarily as the final cause/manner of death as concluded by the medical examiner or coroner. In addition, a drug found in a postmortem case does not necessarily mean it contributed to the cause/manner of death.
Staff Beth Smalley, Toxicology Supervisor April Mitchell, Forensic Toxicologist
Scott Schlueter, Forensic Toxicologist Diplomate-ABFT-FT
Gavin Lawson, Forensic Toxicologist
Michelle Duffus, Forensic Toxicologist Ben Vetter, Breath Alcohol Manager
Eric Miller, Forensic Toxicologist Diplomate-ABFT-FT
Justin Lyndes, Breath Alcohol Toxicologist
Crystal Everett, Forensic Toxicologist Elizabeth Holom, Toxicology Technician
Doug Lancon, Forensic Toxicologist
Successes
1. Continue to develop and validate new analytical methods onto newly leased Liquid Chromatography/Mass Spectrometry/Mass Spectrometry (LC/MS/MS) instruments. This is a time consuming but vital process in updating the sections ability to detect and quantitate drugs in all types of cases.
2. Turn-around times are equivalent to national averages even with substantially fewer personnel resources.
10 Montana Department of Justice, Forensic Science Division Annual Report - 2017
June 11, 2018
Challenges
1. Cases continue to become more complex with the release of synthetic drugs, many of which are difficult to detect with our current instrumentation and analytical methods.
2. Balancing the time needed to fully train new toxicologists with the need to develop and validate new analytical methods.
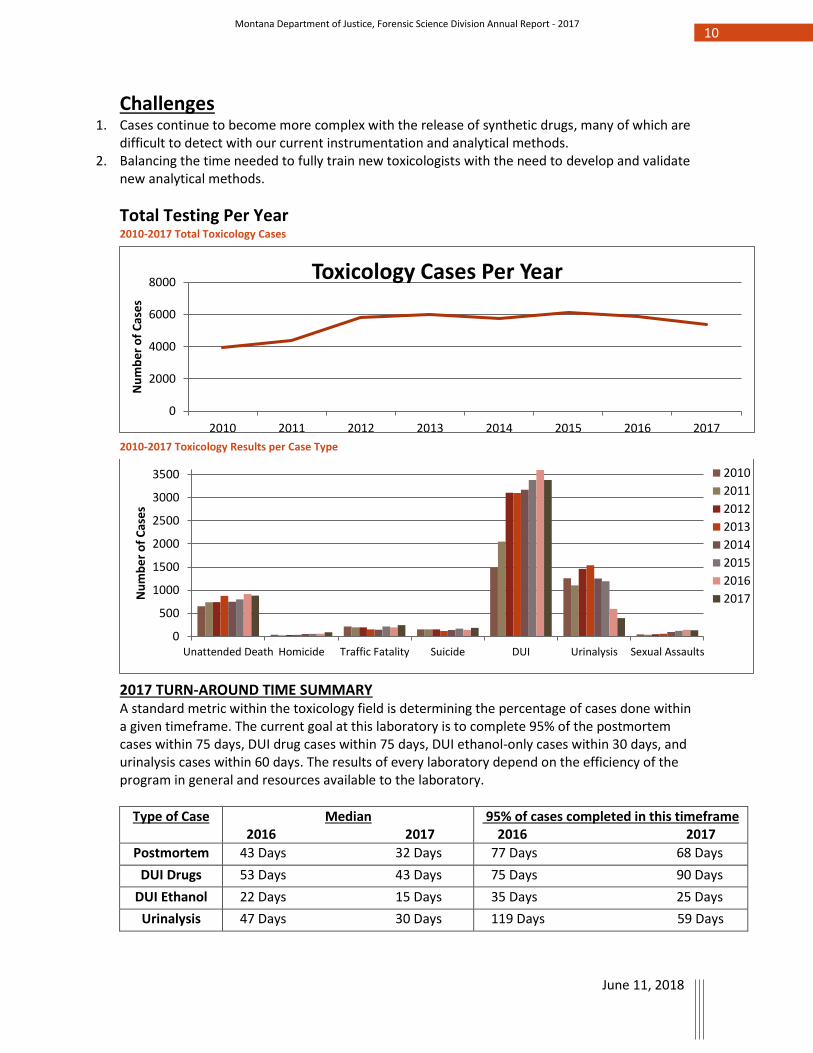
Total Testing Per Year 2010-2017 Total Toxicology Cases
2010-2017 Toxicology Results per Case Type
2017 TURN-AROUND TIME SUMMARY A standard metric within the toxicology field is determining the percentage of cases done within a given timeframe. The current goal at this laboratory is to complete 95% of the postmortem cases within 75 days, DUI drug cases within 75 days, DUI ethanol-only cases within 30 days, and urinalysis cases within 60 days. The results of every laboratory depend on the efficiency of the program in general and resources available to the laboratory.
Type of Case Median 2016 2017
95% of cases completed in this timeframe 2016 2017
Postmortem 43 Days 32 Days 77 Days 68 Days
DUI Drugs 53 Days 43 Days 75 Days 90 Days
DUI Ethanol 22 Days 15 Days 35 Days 25 Days
Urinalysis 47 Days 30 Days 119 Days 59 Days
0
2000
4000
6000
8000
2010 2011 2012 2013 2014 2015 2016 2017
Nu
mb
er
of
Cas
es
Toxicology Cases Per Year
0
500
1000
1500
2000
2500
3000
3500
Unattended Death Homicide Traffic Fatality Suicide DUI Urinalysis Sexual Assaults
Nu
mb
er
of
Cas
es
2010
2011
2012
2013
2014
2015
2016
2017
11 Montana Department of Justice, Forensic Science Division Annual Report - 2017
June 11, 2018
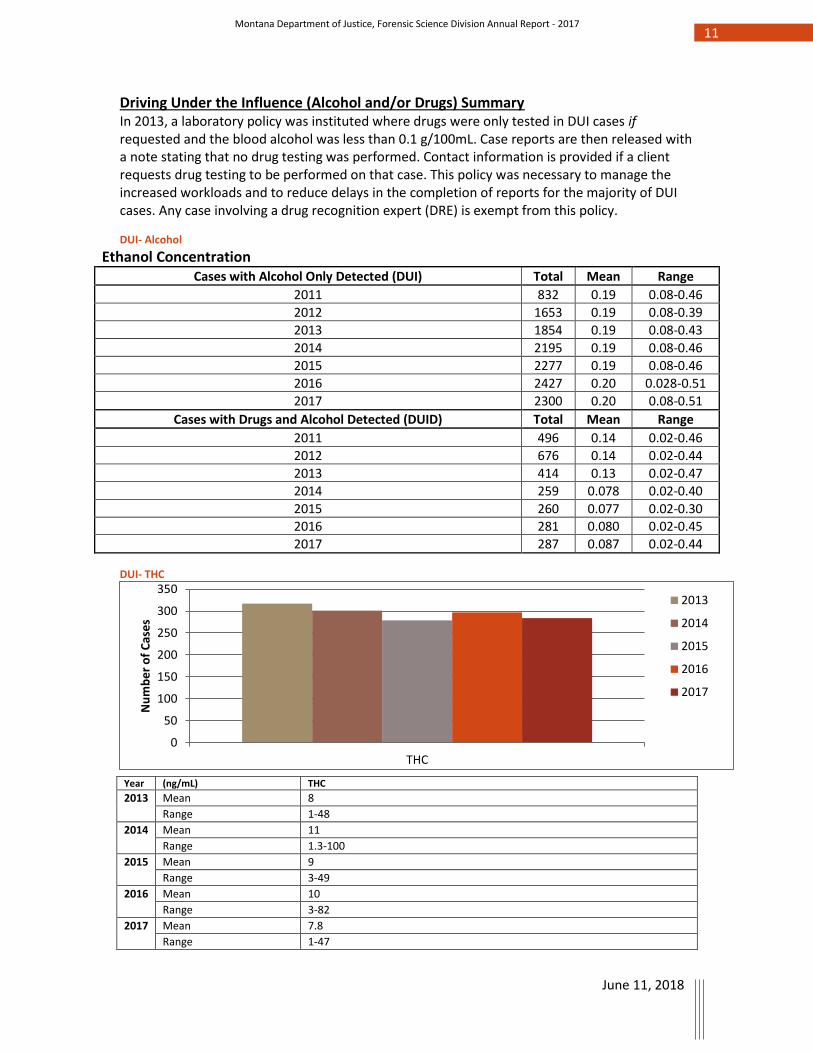
Driving Under the Influence (Alcohol and/or Drugs) Summary In 2013, a laboratory policy was instituted where drugs were only tested in DUI cases if requested and the blood alcohol was less than 0.1 g/100mL. Case reports are then released with a note stating that no drug testing was performed. Contact information is provided if a client requests drug testing to be performed on that case. This policy was necessary to manage the increased workloads and to reduce delays in the completion of reports for the majority of DUI cases. Any case involving a drug recognition expert (DRE) is exempt from this policy.
DUI- Alcohol
Ethanol Concentration Cases with Alcohol Only Detected (DUI) Total Mean Range
2011 832 0.19 0.08-0.46
2012 1653 0.19 0.08-0.39
2013 1854 0.19 0.08-0.43
2014 2195 0.19 0.08-0.46
2015 2277 0.19 0.08-0.46
2016 2427 0.20 0.028-0.51
2017 2300 0.20 0.08-0.51
Cases with Drugs and Alcohol Detected (DUID) Total Mean Range
2011 496 0.14 0.02-0.46
2012 676 0.14 0.02-0.44
2013 414 0.13 0.02-0.47
2014 259 0.078 0.02-0.40
2015 260 0.077 0.02-0.30
2016 281 0.080 0.02-0.45
2017 287 0.087 0.02-0.44
DUI- THC
Year (ng/mL) THC
2013 Mean 8
Range 1-48
2014 Mean 11
Range 1.3-100
2015 Mean 9
Range 3-49
2016 Mean 10
Range 3-82
2017 Mean 7.8
Range 1-47
0
50
100
150
200
250
300
350
THC
Nu
mb
er
of
Cas
es
2013
2014
2015
2016
2017
12 Montana Department of Justice, Forensic Science Division Annual Report - 2017
June 11, 2018
DUI- Narcotic Analgesics
Year mg/L FENTANYL* HYDROCODONE METHADONE MORPHINE OXYCODONE TRAMADOL
2013 Mean 2.2 0.57 0.19 0.05 0.10 0.67
Range 2.2 0.02-22 0.04-0.79 0.02-0.14 0.02-0.51 0.03-3.4
2014 Mean 2.7 0.07 0.27 0.05 0.1 0.69
Range 0.69-9.5 0.03-0.2 0.03-0.64 0.02-0.15 0.02-0.29 0.02-3.3
2015 Mean 3 0.07 0.24 0.06 0.11 0.45
Range 0.62-6.3 0.02-0.25 0.03-0.92 0.02-0.33 0.02-0.44 0.03-3.1
2016 Mean 1.9 0.06 0.26 0.05 0.11 0.4
Range N/A 0.02-0.18 0.02-0.91 0.02-0.15 0.02-0.61 0.03-2
2017 Mean 40 0.11 0.16 0.05 0.12 0.24
Range 6.6-74 0.03-0.46 0.03-0.44 0.02-0.12 0.02-0.97 0.03-0.93
*All concentrations are in mg/L except Fentanyl which is in ng/mL DUI- Central Nervous System Stimulants
Year mg/L METHAMPHETAMINE
2013 Mean 0.26
Range 0.02-2
2014 Mean 0.33
Range 0.02-1.9
2015 Mean 0.36
Range 0.02-2.6
0
10
20
30
40
50
60
70
FENTANYL HYDROCODONE METHADONE MORPHINE OXYCODONE TRAMADOL
Nu
mb
er
of
Cas
es
2013
2014
2015
2016
2017
0
0.05
0.1
0.15
0.2
0.25
0.3
0.35
0.4
0
50
100
150
200
250
300
350
2009 2010 2011 2012 2013 2014 2015 2016 2017
Methamphetamine
Cases per Year Concentration (mg/L)
Concentration (mg/L)# Cases
13 Montana Department of Justice, Forensic Science Division Annual Report - 2017
June 11, 2018
2016 Mean 0.34
Range 0.02-1.8
2017 Mean 0.33
Range 0.02-2.2
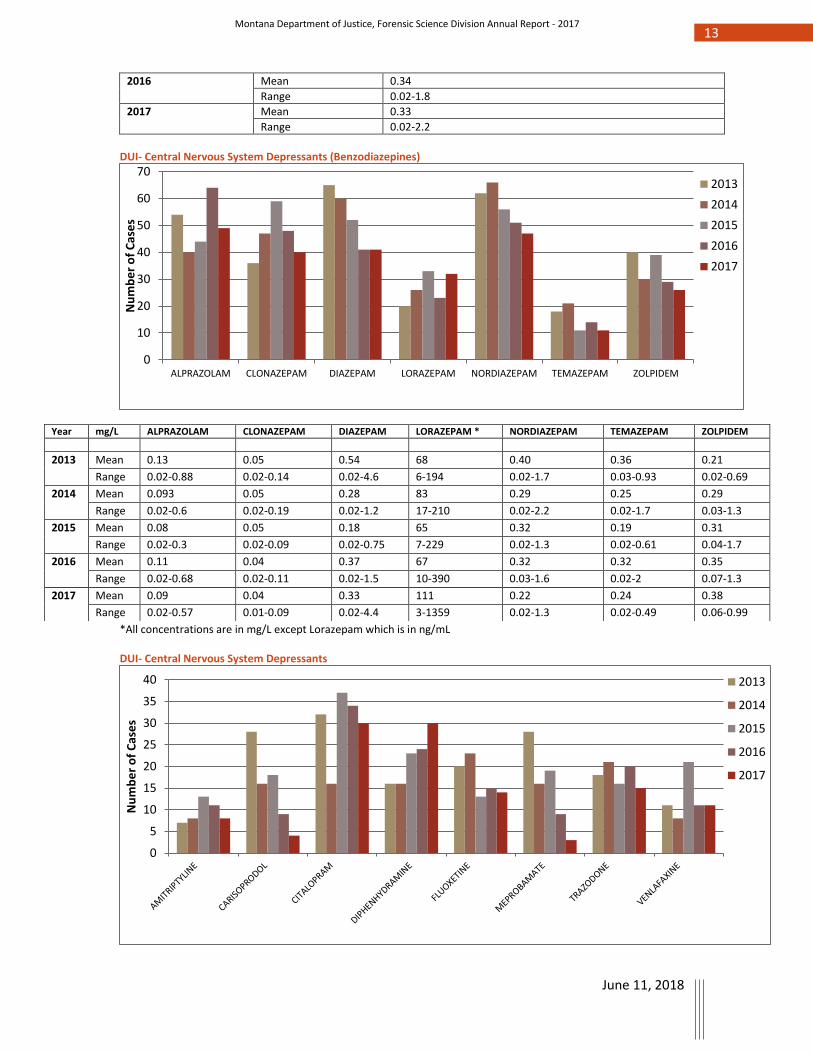
DUI- Central Nervous System Depressants (Benzodiazepines)
*All concentrations are in mg/L except Lorazepam which is in ng/mL DUI- Central Nervous System Depressants
0
10
20
30
40
50
60
70
ALPRAZOLAM CLONAZEPAM DIAZEPAM LORAZEPAM NORDIAZEPAM TEMAZEPAM ZOLPIDEM
Nu
mb
er
of
Cas
es
2013
2014
2015
2016
2017
0
5
10
15
20
25
30
35
40
Nu
mb
er
of
Cas
es
2013
2014
2015
2016
2017
Year mg/L ALPRAZOLAM CLONAZEPAM DIAZEPAM LORAZEPAM * NORDIAZEPAM TEMAZEPAM ZOLPIDEM
2013 Mean 0.13 0.05 0.54 68 0.40 0.36 0.21
Range 0.02-0.88 0.02-0.14 0.02-4.6 6-194 0.02-1.7 0.03-0.93 0.02-0.69
2014 Mean 0.093 0.05 0.28 83 0.29 0.25 0.29
Range 0.02-0.6 0.02-0.19 0.02-1.2 17-210 0.02-2.2 0.02-1.7 0.03-1.3
2015 Mean 0.08 0.05 0.18 65 0.32 0.19 0.31
Range 0.02-0.3 0.02-0.09 0.02-0.75 7-229 0.02-1.3 0.02-0.61 0.04-1.7
2016 Mean 0.11 0.04 0.37 67 0.32 0.32 0.35
Range 0.02-0.68 0.02-0.11 0.02-1.5 10-390 0.03-1.6 0.02-2 0.07-1.3
2017 Mean 0.09 0.04 0.33 111 0.22 0.24 0.38
Range 0.02-0.57 0.01-0.09 0.02-4.4 3-1359 0.02-1.3 0.02-0.49 0.06-0.99
14 Montana Department of Justice, Forensic Science Division Annual Report - 2017
June 11, 2018
Year mg/L AMITRIPTYLINE CARISOPRODOL CITALOPRAM DIPHENHYDRAMINE
2013 Mean 0.14 6.4 0.13 0.54
Range 0.07-0.21 2.5-13 0.04-0.46 0.53-2.2
2014 Mean 0.06 5.1 0.098 0.37
Range 0.021-0.12 2.0-15 0.04-0.21 0.02-2.7
2015 Mean 0.05 6.5 0.03 0.11
Range 0.02-0.10 2.4-13 0.02-0.05 0.02-0.77
2016 Mean 0.12 5.7 N/A 0.21
Range 0.03-0.36 2.1-12 N/A 0.02-1
2017 Mean 0.43 3.1 N/A 0.27
Range 0.02-1.5 2-4.1 N/A 0.03-2.1
Year mg/L FLUOXETINE MEPROBAMATE TRAZODONE VENLAFAXINE
2013 Mean 0.19 11 0.56 0.38
Range 0.07-0.43 2-28 0.12-1.6 0.05-1.4
2014 Mean 0.36 13 0.57 0.44
Range 0.91-1.8 2.4-52 0.06-1.4 0.06-2
2015 Mean 0.25 12 0.3 N/A
Range 0.12-0.38 2.3-31 0.09-0.53 N/A
2016 Mean N/A 16 0.81 0.8
Range N/A 3-49 0.07-1.8 0.12-2
2017 Mean N/A 9.5 0.69 N/A
Range N/A 3.9-15 0.23-1.3 N/A
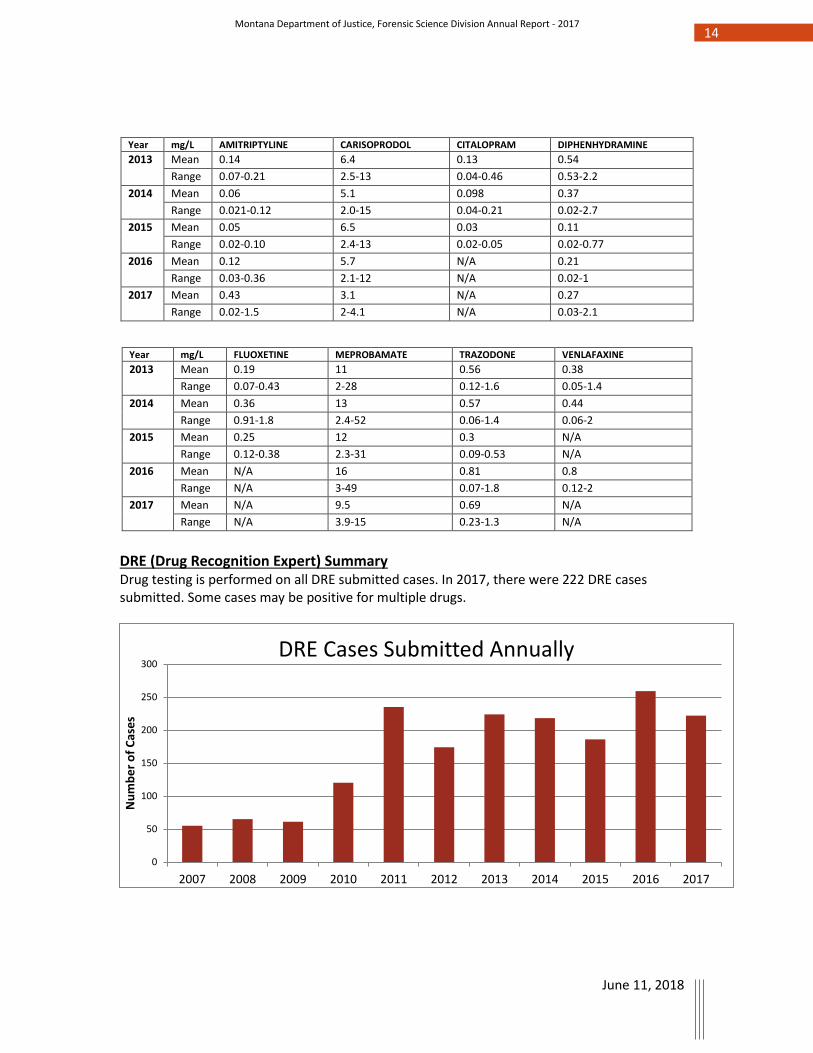
DRE (Drug Recognition Expert) Summary Drug testing is performed on all DRE submitted cases. In 2017, there were 222 DRE cases submitted. Some cases may be positive for multiple drugs.
0
50
100
150
200
250
300
2007 2008 2009 2010 2011 2012 2013 2014 2015 2016 2017
Nu
mb
er
of
Cas
es
DRE Cases Submitted Annually
15 Montana Department of Justice, Forensic Science Division Annual Report - 2017
June 11, 2018
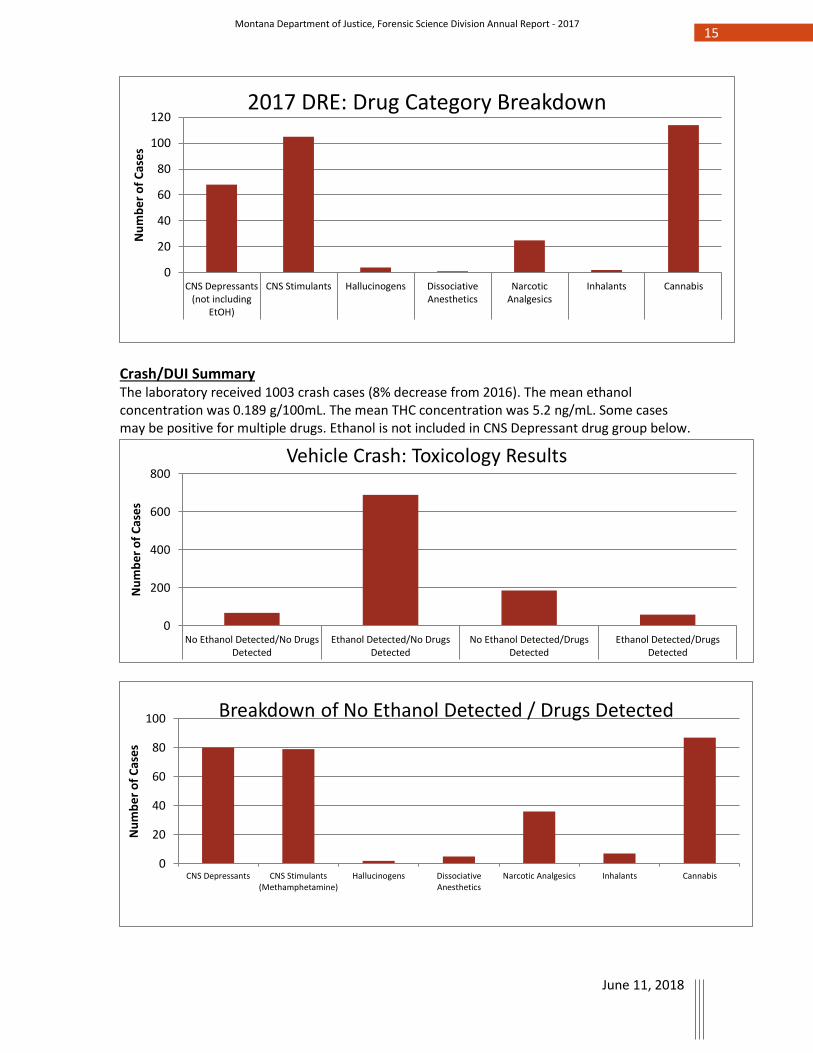
Crash/DUI Summary The laboratory received 1003 crash cases (8% decrease from 2016). The mean ethanol concentration was 0.189 g/100mL. The mean THC concentration was 5.2 ng/mL. Some cases may be positive for multiple drugs. Ethanol is not included in CNS Depressant drug group below.
0
20
40
60
80
100
120
CNS Depressants(not including
EtOH)
CNS Stimulants Hallucinogens DissociativeAnesthetics
NarcoticAnalgesics
Inhalants Cannabis
Nu
mb
er
of
Cas
es
2017 DRE: Drug Category Breakdown
0
20
40
60
80
100
CNS Depressants CNS Stimulants(Methamphetamine)
Hallucinogens DissociativeAnesthetics
Narcotic Analgesics Inhalants Cannabis
Nu
mb
er
of
Cas
es
Breakdown of No Ethanol Detected / Drugs Detected
0
200
400
600
800
No Ethanol Detected/No DrugsDetected
Ethanol Detected/No DrugsDetected
No Ethanol Detected/DrugsDetected
Ethanol Detected/DrugsDetected
Nu
mb
er
of
Cas
es
Vehicle Crash: Toxicology Results
16 Montana Department of Justice, Forensic Science Division Annual Report - 2017
June 11, 2018
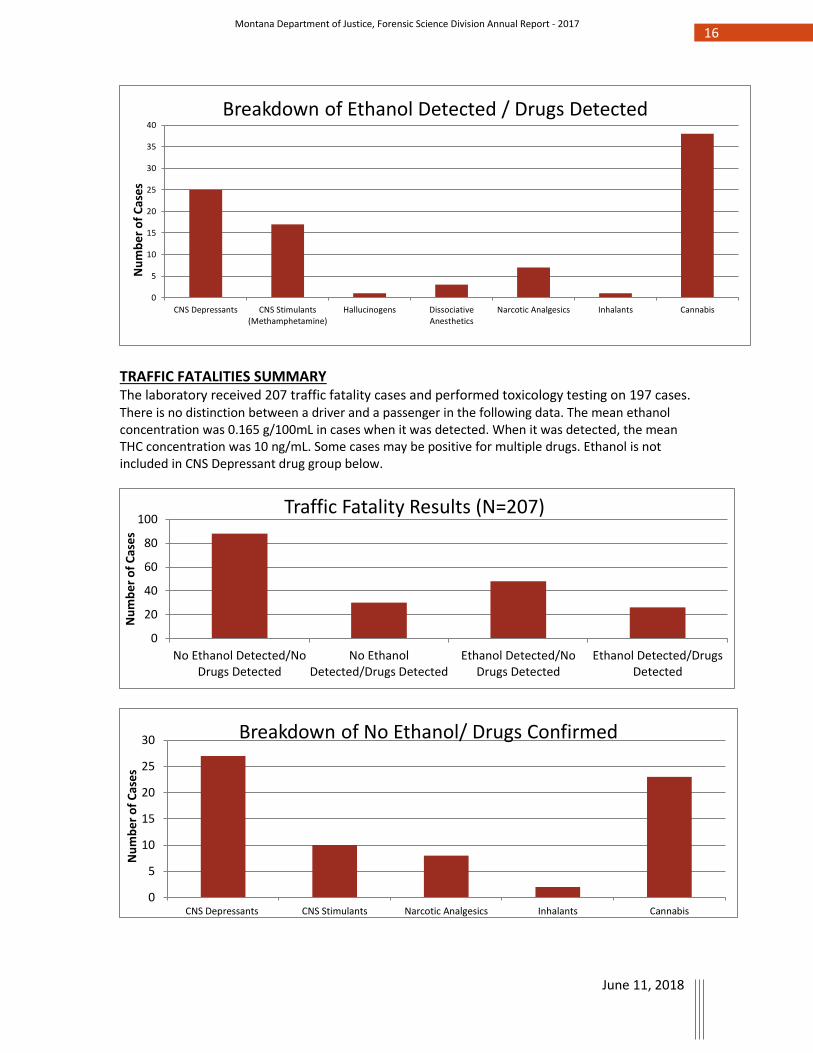
TRAFFIC FATALITIES SUMMARY The laboratory received 207 traffic fatality cases and performed toxicology testing on 197 cases. There is no distinction between a driver and a passenger in the following data. The mean ethanol concentration was 0.165 g/100mL in cases when it was detected. When it was detected, the mean THC concentration was 10 ng/mL. Some cases may be positive for multiple drugs. Ethanol is not included in CNS Depressant drug group below.
0
5
10
15
20
25
30
35
40
CNS Depressants CNS Stimulants(Methamphetamine)
Hallucinogens DissociativeAnesthetics
Narcotic Analgesics Inhalants Cannabis
Nu
mb
er
of
Cas
es
Breakdown of Ethanol Detected / Drugs Detected
0
20
40
60
80
100
No Ethanol Detected/NoDrugs Detected
No EthanolDetected/Drugs Detected
Ethanol Detected/NoDrugs Detected
Ethanol Detected/DrugsDetected
Nu
mb
er
of
Cas
es
Traffic Fatality Results (N=207)
0
5
10
15
20
25
30
CNS Depressants CNS Stimulants Narcotic Analgesics Inhalants Cannabis
Nu
mb
er
of
Cas
es
Breakdown of No Ethanol/ Drugs Confirmed
17 Montana Department of Justice, Forensic Science Division Annual Report - 2017
June 11, 2018
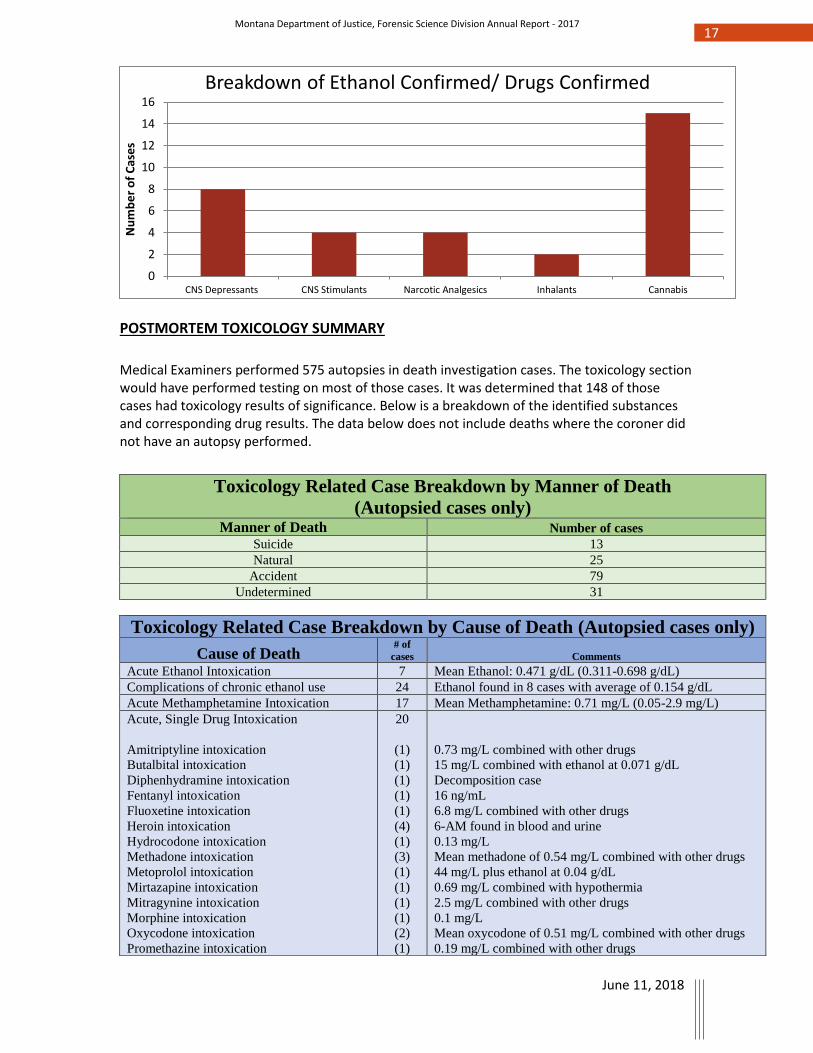
POSTMORTEM TOXICOLOGY SUMMARY
Medical Examiners performed 575 autopsies in death investigation cases. The toxicology section would have performed testing on most of those cases. It was determined that 148 of those cases had toxicology results of significance. Below is a breakdown of the identified substances and corresponding drug results. The data below does not include deaths where the coroner did not have an autopsy performed.
0
2
4
6
8
10
12
14
16
CNS Depressants CNS Stimulants Narcotic Analgesics Inhalants Cannabis
Nu
mb
er
of
Cas
es
Breakdown of Ethanol Confirmed/ Drugs Confirmed
Toxicology Related Case Breakdown by Manner of Death
(Autopsied cases only) Manner of Death Number of cases
Suicide 13
Natural 25
Accident 79
Undetermined 31
Toxicology Related Case Breakdown by Cause of Death (Autopsied cases only)
Cause of Death # of
cases Comments
Acute Ethanol Intoxication 7 Mean Ethanol: 0.471 g/dL (0.311-0.698 g/dL)
Complications of chronic ethanol use 24 Ethanol found in 8 cases with average of 0.154 g/dL
Acute Methamphetamine Intoxication 17 Mean Methamphetamine: 0.71 mg/L (0.05-2.9 mg/L)
Acute, Single Drug Intoxication
1. Amitriptyline intoxication
2. Butalbital intoxication
3. Diphenhydramine intoxication
4. Fentanyl intoxication
5. Fluoxetine intoxication
6. Heroin intoxication
7. Hydrocodone intoxication
8. Methadone intoxication
9. Metoprolol intoxication
10. Mirtazapine intoxication
11. Mitragynine intoxication
12. Morphine intoxication
13. Oxycodone intoxication
14. Promethazine intoxication
20
(1)
(1)
(1)
(1)
(1)
(4)
(1)
(3)
(1)
(1)
(1)
(1)
(2)
(1)
0.73 mg/L combined with other drugs
15 mg/L combined with ethanol at 0.071 g/dL
Decomposition case
16 ng/mL
6.8 mg/L combined with other drugs
6-AM found in blood and urine
0.13 mg/L
Mean methadone of 0.54 mg/L combined with other drugs
44 mg/L plus ethanol at 0.04 g/dL
0.69 mg/L combined with hypothermia
2.5 mg/L combined with other drugs
0.1 mg/L
Mean oxycodone of 0.51 mg/L combined with other drugs
0.19 mg/L combined with other drugs
18 Montana Department of Justice, Forensic Science Division Annual Report - 2017
June 11, 2018
Unattended Death Toxicology Results: A routine postmortem toxicology testing panel consists of the analysis of volatile compounds (ethanol, methanol, acetone, and isopropanol), illicit drugs, and prescription medications. Case history and requests from the submitting agency decides the final testing panel of each case. All positive drug results have been screened and confirmed by different scientific methods. All significant drug results were quantitated unless directed otherwise. The following disclaimers apply:
1. The data found in the following tables are only results from the various unattended death cases in our lab and should not be used in any type of postmortem drug interpretation.
2. The ethanol and drugs found in the following postmortem cases do not necessarily mean they were attributed to the cause or manner of death.
3. The cases in the graphs below are sorted into groups as they were submitted to us, not necessarily as the final cause/manner of death as concluded by the medical examiner or coroner.
Unattended Death- Ethanol
Year g/100mL ETHANOL-BLOOD ETHANOL-VITREOUS
2013 Mean 0.17 0.20
Range 0.02-0.50 0.03-0.53
2014 Mean 0.17 0.20
Range 0.02-0.45 0.02-0.50
2015 Mean 0.18 0.27
Range 0.02-0.66 0.02-0.60
2016 Mean 0.18 0.20
Range 0.02-0.59 0.02-0.60
2017 Mean 0.17 0.21
Range 0.02-0.70 0.02-0.86
Acute, Multi-Drug Combinations
37
Ethanol found in 11 cases (0.19 g/dL average)
Methamphetamine found in 4 cases
Heroin use found in 7 cases
Fentanyl found in 2 cases
Oxycodone found in 11 cases (0.38 mg/L average)
Hydrocodone found in 5 cases (0.1 mg/L average)
Methadone found in 4 cases (0.4 mg/L average)
Carbon Monoxide Poisoning
12
Mean carboxyhemoglobin at 57%
2 cases positive for methamphetamine (Mean: 1.6 mg/L)
4 cases positive for THC (Mean: 9.7 ng/mL)
Inhalant Intoxication 3
2 cases with 1,1-Difluoroethane
1 cases with Tetrafluoroethane
Undetermined 28 -
19 Montana Department of Justice, Forensic Science Division Annual Report - 2017
June 11, 2018
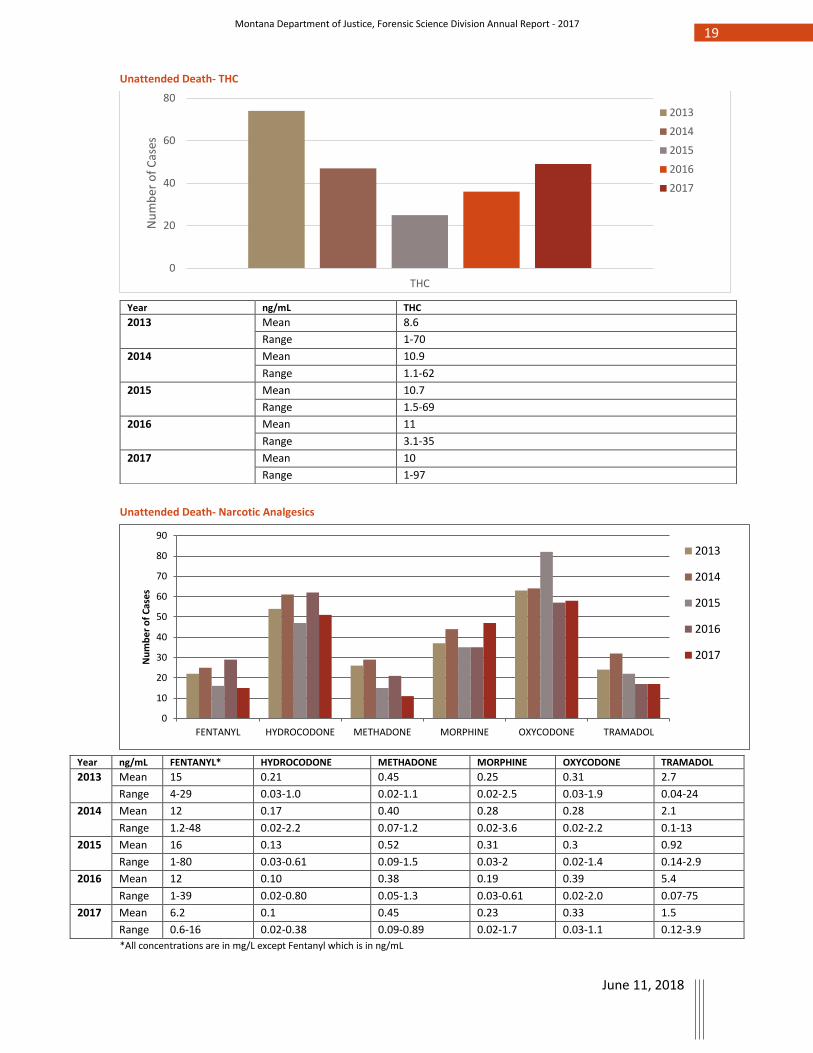
Unattended Death- THC
Unattended Death- Narcotic Analgesics
Year ng/mL FENTANYL* HYDROCODONE METHADONE MORPHINE OXYCODONE TRAMADOL
2013 Mean 15 0.21 0.45 0.25 0.31 2.7
Range 4-29 0.03-1.0 0.02-1.1 0.02-2.5 0.03-1.9 0.04-24
2014 Mean 12 0.17 0.40 0.28 0.28 2.1
Range 1.2-48 0.02-2.2 0.07-1.2 0.02-3.6 0.02-2.2 0.1-13
2015 Mean 16 0.13 0.52 0.31 0.3 0.92
Range 1-80 0.03-0.61 0.09-1.5 0.03-2 0.02-1.4 0.14-2.9
2016 Mean 12 0.10 0.38 0.19 0.39 5.4
Range 1-39 0.02-0.80 0.05-1.3 0.03-0.61 0.02-2.0 0.07-75
2017 Mean 6.2 0.1 0.45 0.23 0.33 1.5
Range 0.6-16 0.02-0.38 0.09-0.89 0.02-1.7 0.03-1.1 0.12-3.9
*All concentrations are in mg/L except Fentanyl which is in ng/mL
0
20
40
60
80
THC
Nu
mb
er o
f C
ases
2013
2014
2015
2016
2017
0
10
20
30
40
50
60
70
80
90
FENTANYL HYDROCODONE METHADONE MORPHINE OXYCODONE TRAMADOL
Nu
mb
er
of
Cas
es
2013
2014
2015
2016
2017
Year ng/mL THC
2013 Mean 8.6
Range 1-70
2014 Mean 10.9
Range 1.1-62
2015 Mean 10.7
Range 1.5-69
2016 Mean 11
Range 3.1-35
2017 Mean 10
Range 1-97
20 Montana Department of Justice, Forensic Science Division Annual Report - 2017
June 11, 2018
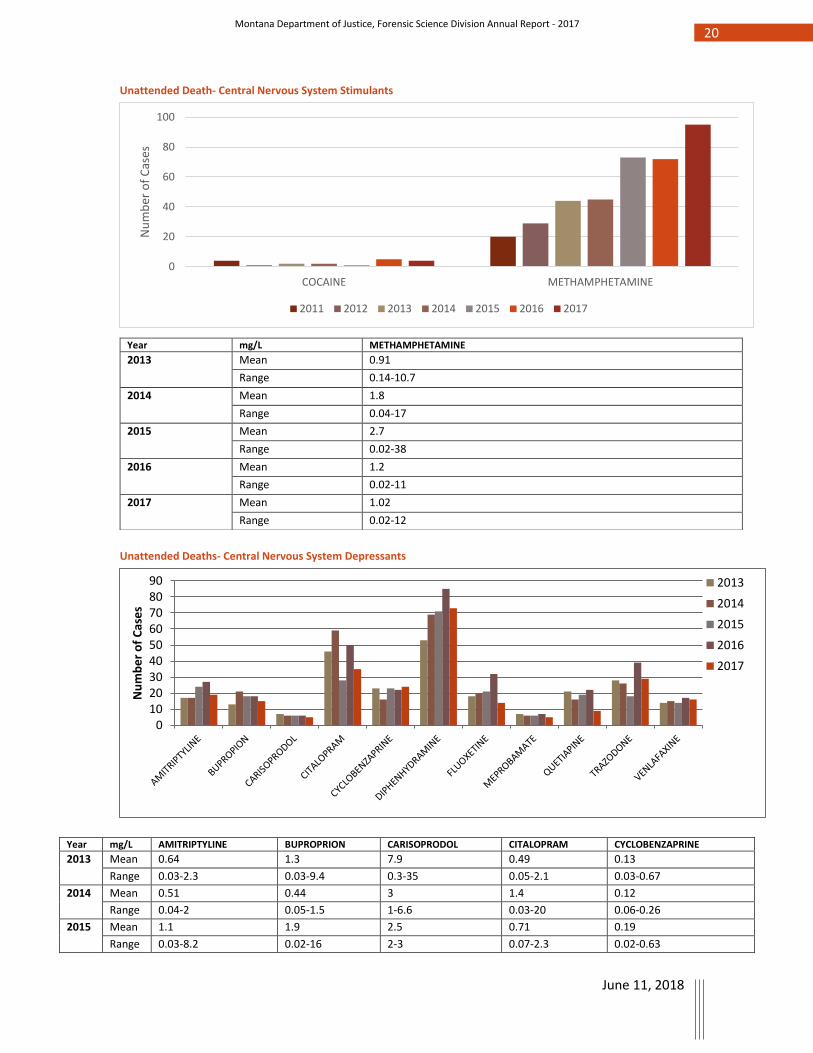
Unattended Death- Central Nervous System Stimulants
Unattended Deaths- Central Nervous System Depressants
Year mg/L AMITRIPTYLINE BUPROPRION CARISOPRODOL CITALOPRAM CYCLOBENZAPRINE
2013 Mean 0.64 1.3 7.9 0.49 0.13
Range 0.03-2.3 0.03-9.4 0.3-35 0.05-2.1 0.03-0.67
2014 Mean 0.51 0.44 3 1.4 0.12
Range 0.04-2 0.05-1.5 1-6.6 0.03-20 0.06-0.26
2015 Mean 1.1 1.9 2.5 0.71 0.19
Range 0.03-8.2 0.02-16 2-3 0.07-2.3 0.02-0.63
0
20
40
60
80
100
COCAINE METHAMPHETAMINE
Nu
mb
er o
f C
ases
2011 2012 2013 2014 2015 2016 2017
0102030405060708090
Nu
mb
er
of
Cas
es
2013
2014
2015
2016
2017
Year mg/L METHAMPHETAMINE
2013 Mean 0.91
Range 0.14-10.7
2014 Mean 1.8
Range 0.04-17
2015 Mean 2.7
Range 0.02-38
2016 Mean 1.2
Range 0.02-11
2017 Mean 1.02
Range 0.02-12
21 Montana Department of Justice, Forensic Science Division Annual Report - 2017
June 11, 2018
2016 Mean 0.55 0.55 5.5 0.43 0.2
Range 0.06-1.5 0.04-3.0 0.5-15 0.06-1.5 0.03-0.97
2017 Mean 0.75 1.2 2 0.49 0.08
Range 0.03-1.2 0.06-6.9 2-2 0.1-2.5 0.02-0.16
Year mg/L DIPHENHYDRAMINE FLUOXETINE MEPROBAMATE QUETIAPINE TRAZODONE VENLAFAXINE
2013 Mean 1.3 0.95 9.8 2.3 0.96 1.3
Range 0.04-24 0.3-3.8 2.4-31.0 0.13-11 0.07-9.7 0.1-5.6
2014 Mean 0.54 0.63 9.2 1.7 0.52 0.85
Range 0.03-6 0.03-2.1 4-23 0.1-8.8 0.04-2.6 0.08-4.1
2015 Mean 0.62 0.68 8.5 2.1 1.3 2.9
Range 0.02-6.4 0.08-1.7 1.8-18 0.23-9.5 0.04-8.1 0.45-17
2016 Mean 0.60 1.4 15 1.2 2.2 3.8
Range 0.03-4.7 0.15-6.5 0.2-50 0.06-5.4 0.07-33 0.06-27
2017 Mean 1.5 2.2 6.5 7.3 2.1 1.3
Range 0.04-17 0.42-6.8 3-10 0.14-45 0.08-13 0.08-3.8
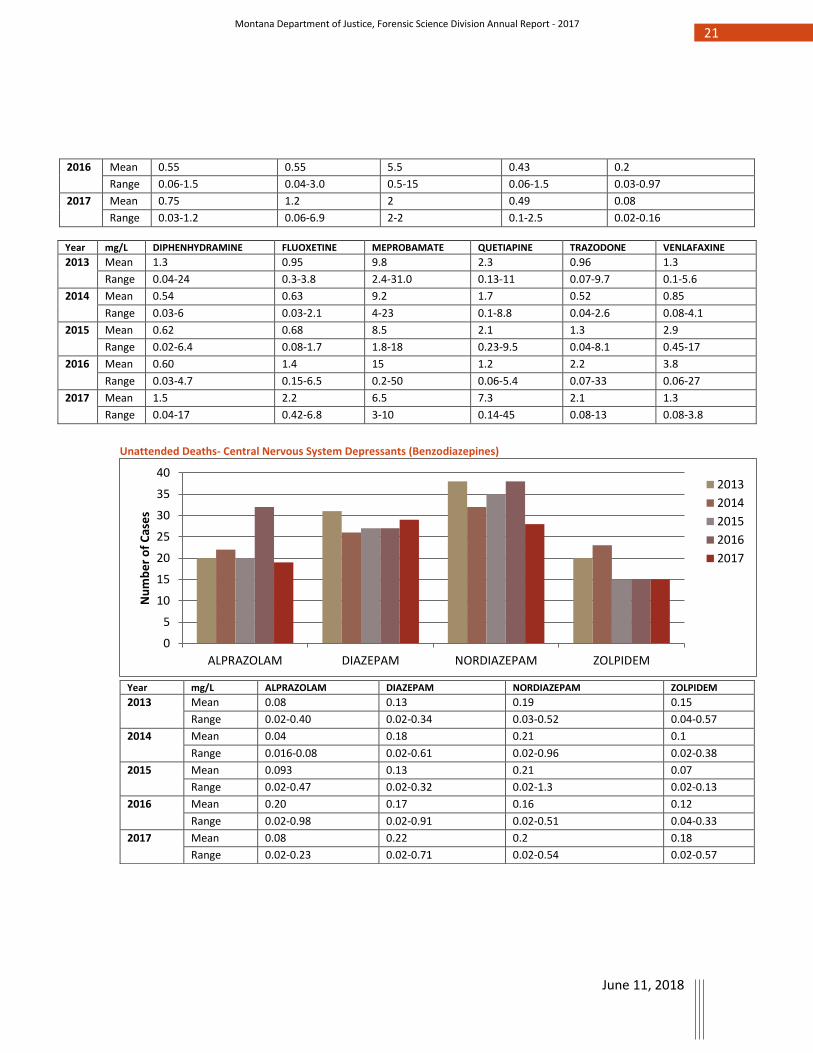
Unattended Deaths- Central Nervous System Depressants (Benzodiazepines)
0
5
10
15
20
25
30
35
40
ALPRAZOLAM DIAZEPAM NORDIAZEPAM ZOLPIDEM
Nu
mb
er
of
Cas
es
2013
2014
2015
2016
2017
Year mg/L ALPRAZOLAM DIAZEPAM NORDIAZEPAM ZOLPIDEM
2013 Mean 0.08 0.13 0.19 0.15
Range 0.02-0.40 0.02-0.34 0.03-0.52 0.04-0.57
2014 Mean 0.04 0.18 0.21 0.1
Range 0.016-0.08 0.02-0.61 0.02-0.96 0.02-0.38
2015 Mean 0.093 0.13 0.21 0.07
Range 0.02-0.47 0.02-0.32 0.02-1.3 0.02-0.13
2016 Mean 0.20 0.17 0.16 0.12
Range 0.02-0.98 0.02-0.91 0.02-0.51 0.04-0.33
2017 Mean 0.08 0.22 0.2 0.18
Range 0.02-0.23 0.02-0.71 0.02-0.54 0.02-0.57
22 Montana Department of Justice, Forensic Science Division Annual Report - 2017
June 11, 2018
Unattended Death- Carboxyhemoglobin
Year %COHB CARBOXYHEMOGLOBIN
2013 Mean 34%
Range 0.2-70% (4 cases were greater than upper limit of detection of 75%)
2014 Mean 43%
Range 1.2-75% (4 cases were greater than upper limit of detection of 75%)
2015 Mean 35%
Range 1.1-74% (4 cases were greater than upper limit of detection of 75%)
2016 Mean 39%
Range 0.0-77% (4 cases were greater than upper limit of detection of 75%)
2017 Mean 29%
Range 0.0-84%
Emerging Drug Trends Methamphetamine: A central nervous system stimulant that has steadily increased in prevalence over the last few years in the state of Montana. In 2011, the lab received 73 methamphetamine positive DUI cases. By 2017, that number jumped to 310. Similarly, there has been a dramatic increase in unattended death postmortem cases. In 2011, the lab received 20 methamphetamine postmortem cases. By 2017, that number jumped to 95. The percentage of positive urine methamphetamine cases from the Department of Corrections have also increased from 10% in 2009 up to 60% in 2017. These are three different subsets of the population that have all shown a significant increase in methamphetamine use, in addition to large increases in concentration. Heroin (6-Monoacetylmorphine): 6-Monoacetylmorphine is a metabolite of heroin that is found in low levels in the blood and urine. In 2017, the lab detected this compound (blood or urine) in fifteen unattended death cases (morphine was found in every case). It was also found in eight probation/parole urinalysis cases. In 2016, the lab detected this compound (blood or urine) in six unattended death cases (morphine was found in every case). It was also found in three probation/parole urinalysis cases in 2016.
0
5
10
15
20
25
30
Nu
mb
er o
f C
ases
2013 2014 2015 2016 2017
23 Montana Department of Justice, Forensic Science Division Annual Report - 2017
June 11, 2018
Designer Opiates U-47700 is a synthetic opioid agonist that was developed by a pharmaceutical company in the early 1970’s. It has been demonstrated to have a 7-8 fold increase in potency over morphine in mice but was never studied in humans. It can be used as an alternative to heroin. It began to appear in late 2015 and into 2016. There have been reports of overdoses in at least eleven states including Montana. There were two accidental overdoses in 2016 and one in 2017. Furanyl Fentanyl is an analog that is similar to pharmaceutical fentanyl but has never been tested on humans. Over 125 fatalities in at least 24 states have been connected to this drug. Montana had one documented accidental overdose in 2016 and one in 2017. Carfentanil is an analog that is similar to pharmaceutical fentanyl that is 10,000 times more potent than morphine. It is regularly being mixed with Heroin and sold throughout the United States. Montana had two documented accidental overdose last year.
Buprenorphine: Synthetic opiate used for pain management and the treatment of opiate addiction.
Case Type Number of Cases Mean (ng/mL) Range (ng/mL)
Unattended Death 5 2.6 1-5
DUID 6 2.1 1-5.5
Mitragynine (Kratom): This is an alkaloid herbal drug that is extracted from the leaves of plants commonly found in southeast Asia. It is marketed as a dietary supplement due to its stimulant effects (when used in low doses) but it can have significant sedative and euphoric effects (when used in higher doses). It is currently legal in the United States and can be purchased easily at local businesses in Montana.
Case Type 2016 Cases 2017 Cases
Unattended Death 4 7
DUID 2 2
Urinalysis 1 0
Etizolam: A designer benzodiazepine that is not approved for use in the United States (can be purchased over the internet). It can produce euphoria, drowsiness, sedation, depression, and slurred speech when used at higher concentrations. In 2016, there were two DUI cases. In 2017, there were seven DUI cases (mean concentration of 250 ng/mL) and found in one accidental mixed drug overdose. Inhalants: 1,1-Diflouroethane and Tetraflouroethane are compounds found in “canned air” and regularly used for huffing. Dimethyl ether is found in air spray.
Case Type 1,1-Diflouroethane Dimethyl Ether Tetraflouroethane
Unattended Death 6 0 1
DUID 20 2 0
Traffic Fatality 4 0 0
Sexual Assault 0 1 0
24 Montana Department of Justice, Forensic Science Division Annual Report - 2017
June 11, 2018
Gabapentin: Gabapentin has been prescribed as an alternative or in conjunction with opiates for a few years now. We have found it in an increasing number of unidentified deaths over the last three years (2015 – 8 cases, 2016- 16 cases, and 2017 – 36 cases). Of those 36 cases last year there were 20 with opiates also on board. Nine of those had autopsies and six were determined to be mixed drug intoxications (the other three were naturals).
Case Type 2016 2017
Unattended Death 16 36
DUID 2 3
Traffic Fatality 1 2
URINALYSIS SUMMARY Our policy is to confirm drugs the submitting agency requested on the submission form based on their screening results. The following list contains the drugs regularly tested for in Urinalysis cases. This is not a complete list but the majority of drugs probation/parole agencies are interested in are included. There can be overlap between the Immunoassay and the Basic Drug Screen depending on the drug. This list will only include some of that overlap. The detection of all drugs is concentration dependent. There is no quantitation on urine specimens. There was a large decrease in submitted cases from 2015 (1192) to 2017 (397). Of the 397 urine specimens submitted for analysis, 4 (1%) were reported out as no drugs detected. This is a major difference from 2015 when 246 (20.6%) were reported out as no drugs detected. 1. Immunoassay Screen (Further testing needed for confirmation)
a. Cocaine/Metabolites b. Benzodiazepines c. Barbiturates d. Opiates (Morphine) e. Oxycodone f. THC/Metabolites g. Amphetamine h. Methamphetamine
2. Full Scan Basic Drug Screen (GC/MS or LC/MS) a. Opiate related drugs: Methadone/Tramadol/Hydrocodone/ Fentanyl/Oxycodone b. Cocaine c. Benzodiazepines d. Amphetamine e. Methamphetamine f. Anti-depressants
3. Ethanol 4. THC-COOH Confirmation (Inactive metabolite of THC)
25 Montana Department of Justice, Forensic Science Division Annual Report - 2017
June 11, 2018
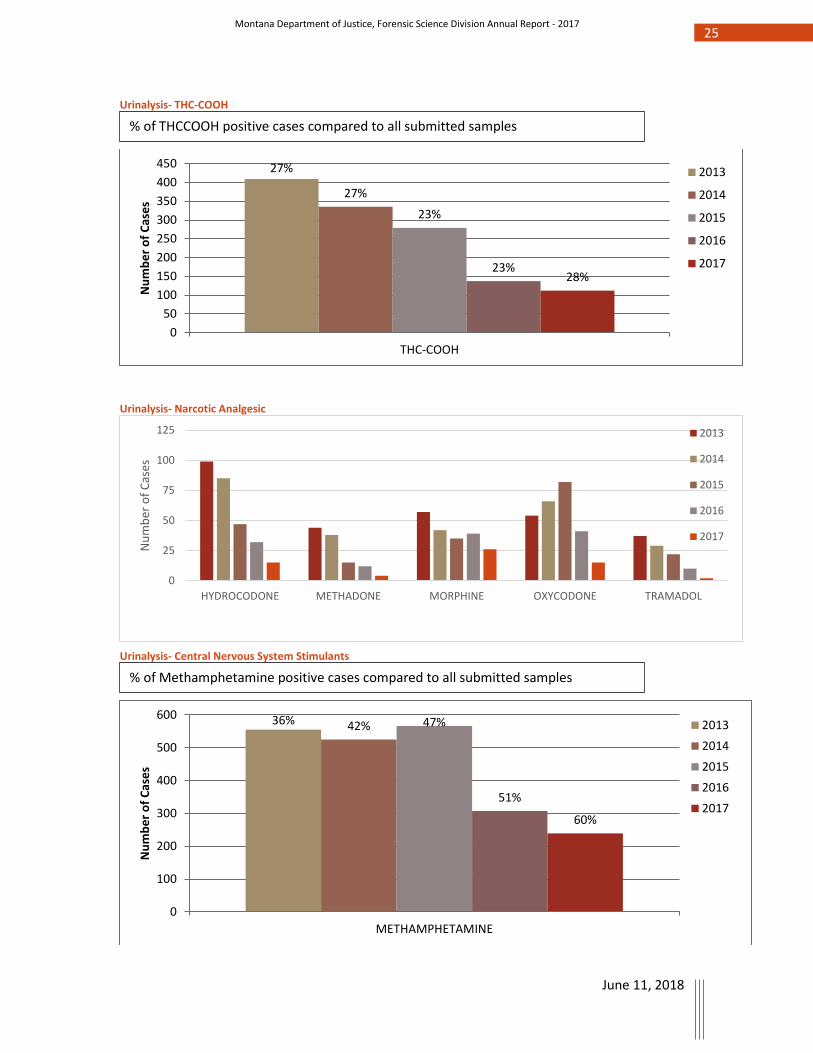
Urinalysis- THC-COOH
Urinalysis- Narcotic Analgesic
Urinalysis- Central Nervous System Stimulants
27%
27%
23%
23%28%
0
50
100
150
200
250
300
350
400
450
THC-COOH
Nu
mb
er
of
Cas
es
2013
2014
2015
2016
2017
0
25
50
75
100
125
HYDROCODONE METHADONE MORPHINE OXYCODONE TRAMADOL
Nu
mb
er o
f C
ases
2013
2014
2015
2016
2017
36% 42% 47%
51%
60%
0
100
200
300
400
500
600
METHAMPHETAMINE
Nu
mb
er
of
Cas
es
2013
2014
2015
2016
2017
% of THCCOOH positive cases compared to all submitted samples
% of Methamphetamine positive cases compared to all submitted samples
26 Montana Department of Justice, Forensic Science Division Annual Report - 2017
June 11, 2018
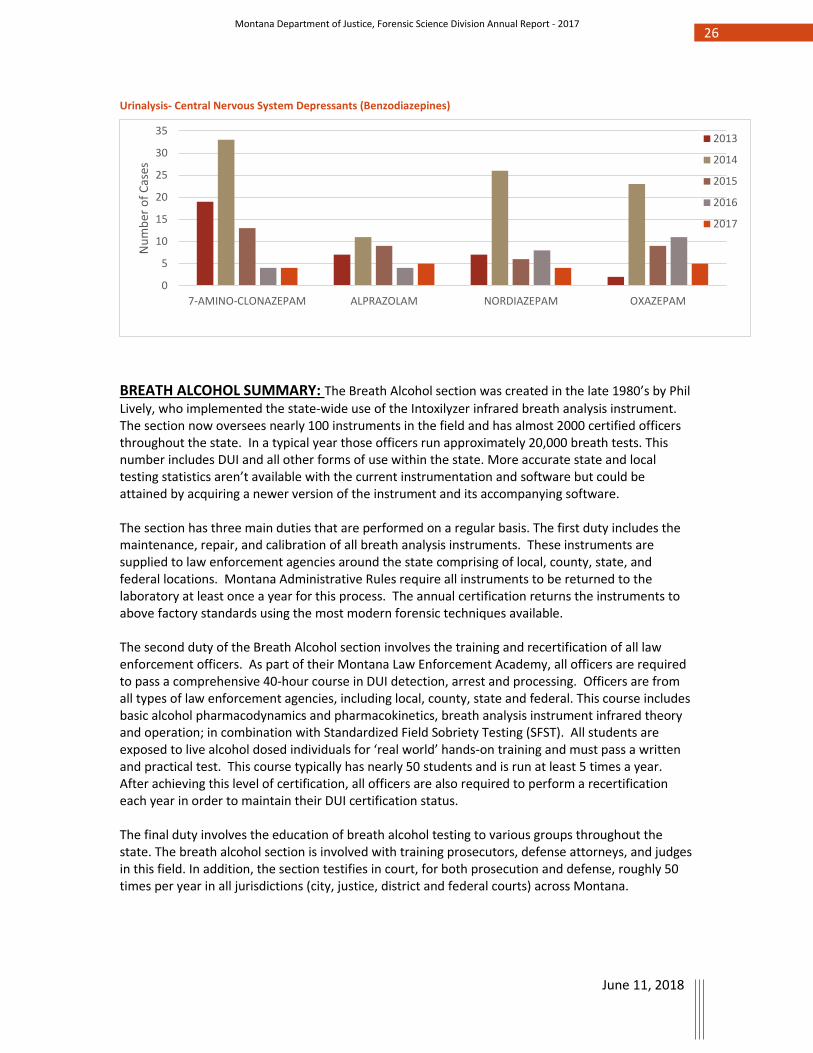
Urinalysis- Central Nervous System Depressants (Benzodiazepines)
BREATH ALCOHOL SUMMARY: The Breath Alcohol section was created in the late 1980’s by Phil
Lively, who implemented the state-wide use of the Intoxilyzer infrared breath analysis instrument. The section now oversees nearly 100 instruments in the field and has almost 2000 certified officers throughout the state. In a typical year those officers run approximately 20,000 breath tests. This number includes DUI and all other forms of use within the state. More accurate state and local testing statistics aren’t available with the current instrumentation and software but could be attained by acquiring a newer version of the instrument and its accompanying software. The section has three main duties that are performed on a regular basis. The first duty includes the maintenance, repair, and calibration of all breath analysis instruments. These instruments are supplied to law enforcement agencies around the state comprising of local, county, state, and federal locations. Montana Administrative Rules require all instruments to be returned to the laboratory at least once a year for this process. The annual certification returns the instruments to above factory standards using the most modern forensic techniques available. The second duty of the Breath Alcohol section involves the training and recertification of all law enforcement officers. As part of their Montana Law Enforcement Academy, all officers are required to pass a comprehensive 40-hour course in DUI detection, arrest and processing. Officers are from all types of law enforcement agencies, including local, county, state and federal. This course includes basic alcohol pharmacodynamics and pharmacokinetics, breath analysis instrument infrared theory and operation; in combination with Standardized Field Sobriety Testing (SFST). All students are exposed to live alcohol dosed individuals for ‘real world’ hands-on training and must pass a written and practical test. This course typically has nearly 50 students and is run at least 5 times a year. After achieving this level of certification, all officers are also required to perform a recertification each year in order to maintain their DUI certification status. The final duty involves the education of breath alcohol testing to various groups throughout the state. The breath alcohol section is involved with training prosecutors, defense attorneys, and judges in this field. In addition, the section testifies in court, for both prosecution and defense, roughly 50 times per year in all jurisdictions (city, justice, district and federal courts) across Montana.
0
5
10
15
20
25
30
35
7-AMINO-CLONAZEPAM ALPRAZOLAM NORDIAZEPAM OXAZEPAM
Nu
mb
er o
f C
ases
2013
2014
2015
2016
2017
27 Montana Department of Justice, Forensic Science Division Annual Report - 2017
June 11, 2018
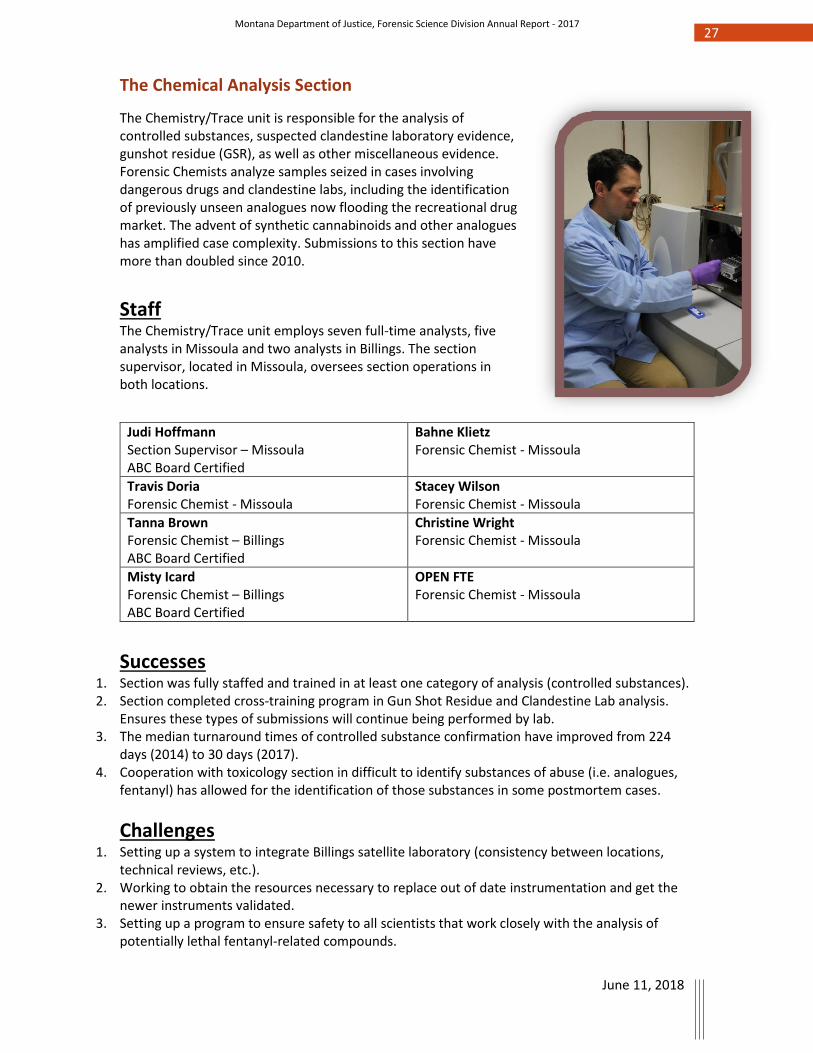
The Chemical Analysis Section
The Chemistry/Trace unit is responsible for the analysis of controlled substances, suspected clandestine laboratory evidence, gunshot residue (GSR), as well as other miscellaneous evidence. Forensic Chemists analyze samples seized in cases involving dangerous drugs and clandestine labs, including the identification of previously unseen analogues now flooding the recreational drug market. The advent of synthetic cannabinoids and other analogues has amplified case complexity. Submissions to this section have more than doubled since 2010.
Staff The Chemistry/Trace unit employs seven full-time analysts, five analysts in Missoula and two analysts in Billings. The section supervisor, located in Missoula, oversees section operations in both locations.
Judi Hoffmann Section Supervisor – Missoula ABC Board Certified
Bahne Klietz Forensic Chemist - Missoula
Travis Doria Forensic Chemist - Missoula
Stacey Wilson Forensic Chemist - Missoula
Tanna Brown Forensic Chemist – Billings ABC Board Certified
Christine Wright Forensic Chemist - Missoula
Misty Icard Forensic Chemist – Billings ABC Board Certified
OPEN FTE Forensic Chemist - Missoula
Successes
1. Section was fully staffed and trained in at least one category of analysis (controlled substances). 2. Section completed cross-training program in Gun Shot Residue and Clandestine Lab analysis.
Ensures these types of submissions will continue being performed by lab. 3. The median turnaround times of controlled substance confirmation have improved from 224
days (2014) to 30 days (2017). 4. Cooperation with toxicology section in difficult to identify substances of abuse (i.e. analogues,
fentanyl) has allowed for the identification of those substances in some postmortem cases.
Challenges 1. Setting up a system to integrate Billings satellite laboratory (consistency between locations,
technical reviews, etc.). 2. Working to obtain the resources necessary to replace out of date instrumentation and get the
newer instruments validated. 3. Setting up a program to ensure safety to all scientists that work closely with the analysis of
potentially lethal fentanyl-related compounds.
28 Montana Department of Justice, Forensic Science Division Annual Report - 2017
June 11, 2018
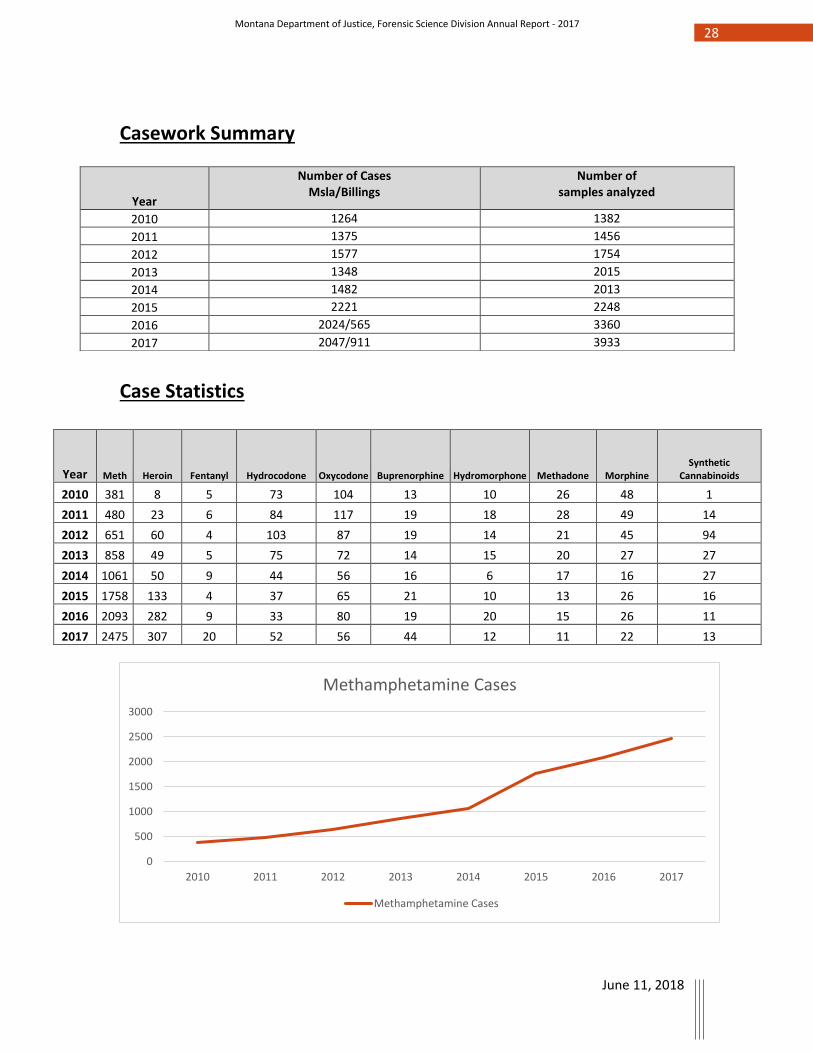
Casework Summary
Case Statistics
Year Meth Heroin Fentanyl Hydrocodone Oxycodone Buprenorphine Hydromorphone Methadone Morphine
Synthetic Cannabinoids
2010 381 8 5 73 104 13 10 26 48 1
2011 480 23 6 84 117 19 18 28 49 14
2012 651 60 4 103 87 19 14 21 45 94
2013 858 49 5 75 72 14 15 20 27 27
2014 1061 50 9 44 56 16 6 17 16 27
2015 1758 133 4 37 65 21 10 13 26 16
2016 2093 282 9 33 80 19 20 15 26 11
2017 2475 307 20 52 56 44 12 11 22 13
0
500
1000
1500
2000
2500
3000
2010 2011 2012 2013 2014 2015 2016 2017
Methamphetamine Cases
Methamphetamine Cases
Year
Number of Cases Msla/Billings
Number of samples analyzed
2010 1264 1382
2011 1375 1456
2012 1577 1754
2013 1348 2015
2014 1482 2013
2015 2221 2248
2016 2024/565 3360
2017 2047/911 3933
29 Montana Department of Justice, Forensic Science Division Annual Report - 2017
June 11, 2018
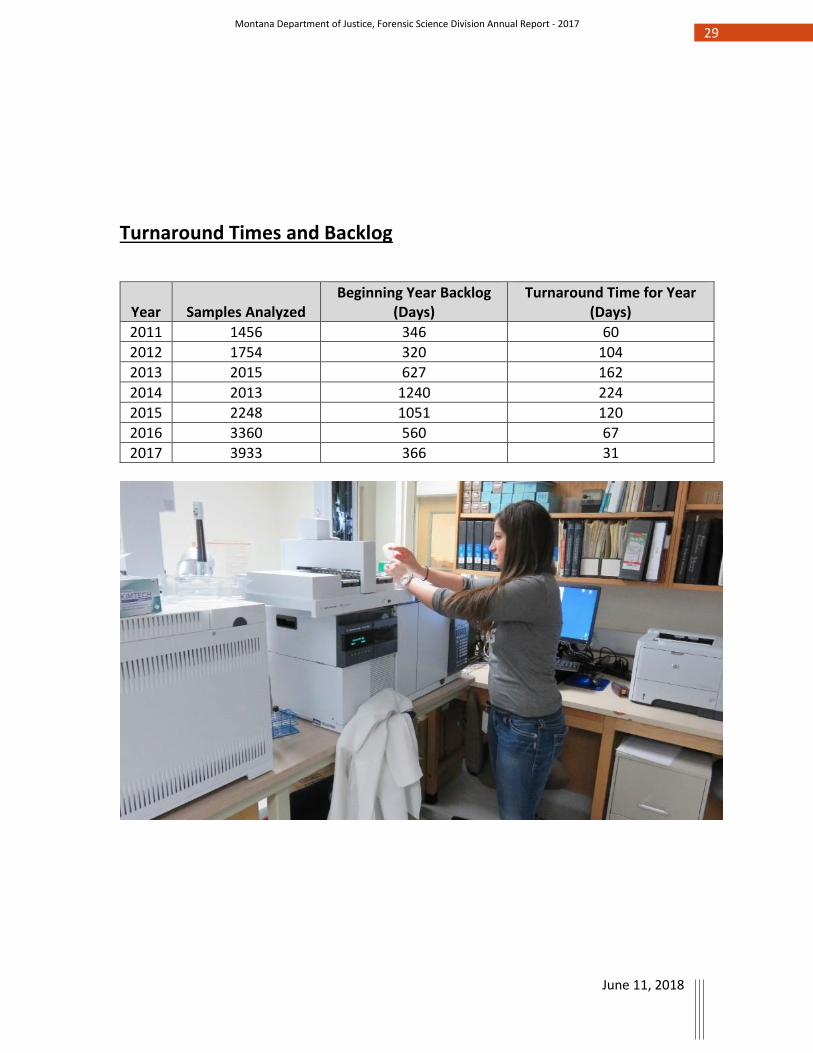
Turnaround Times and Backlog
Year Samples Analyzed Beginning Year Backlog
(Days) Turnaround Time for Year
(Days)
2011 1456 346 60
2012 1754 320 104
2013 2015 627 162
2014 2013 1240 224
2015 2248 1051 120
2016 3360 560 67
2017 3933 366 31
30 Montana Department of Justice, Forensic Science Division Annual Report - 2017
June 11, 2018
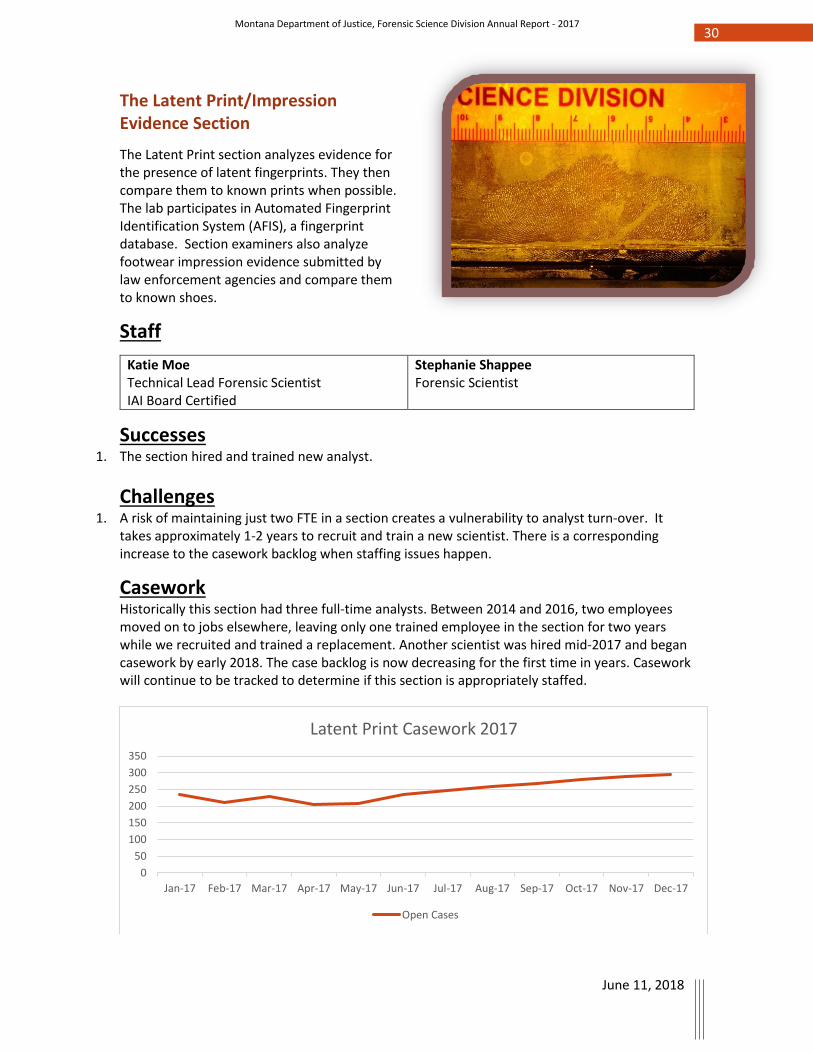
The Latent Print/Impression Evidence Section
The Latent Print section analyzes evidence for the presence of latent fingerprints. They then compare them to known prints when possible. The lab participates in Automated Fingerprint Identification System (AFIS), a fingerprint database. Section examiners also analyze footwear impression evidence submitted by law enforcement agencies and compare them to known shoes.
Staff
Katie Moe Technical Lead Forensic Scientist IAI Board Certified
Stephanie Shappee Forensic Scientist
Successes 1. The section hired and trained new analyst.
Challenges 1. A risk of maintaining just two FTE in a section creates a vulnerability to analyst turn-over. It
takes approximately 1-2 years to recruit and train a new scientist. There is a corresponding increase to the casework backlog when staffing issues happen.
Casework Historically this section had three full-time analysts. Between 2014 and 2016, two employees moved on to jobs elsewhere, leaving only one trained employee in the section for two years while we recruited and trained a replacement. Another scientist was hired mid-2017 and began casework by early 2018. The case backlog is now decreasing for the first time in years. Casework will continue to be tracked to determine if this section is appropriately staffed.
0
50
100
150
200
250
300
350
Jan-17 Feb-17 Mar-17 Apr-17 May-17 Jun-17 Jul-17 Aug-17 Sep-17 Oct-17 Nov-17 Dec-17
Latent Print Casework 2017
Open Cases
31 Montana Department of Justice, Forensic Science Division Annual Report - 2017
June 11, 2018
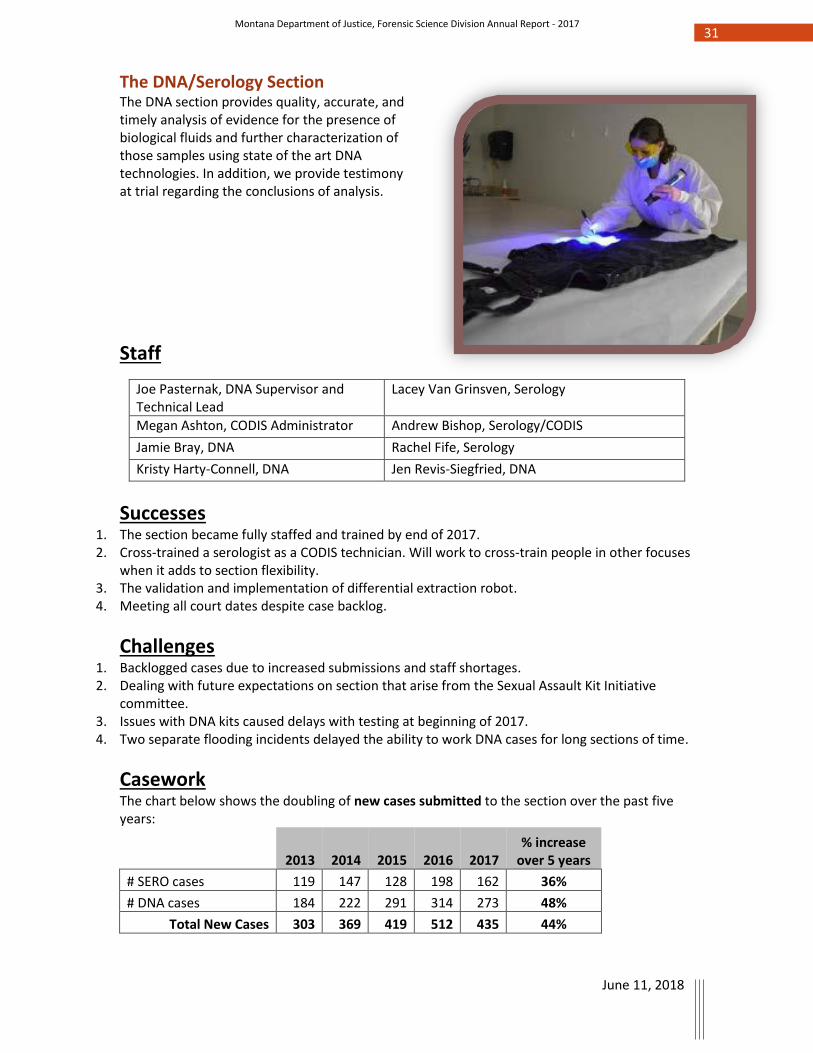
The DNA/Serology Section The DNA section provides quality, accurate, and timely analysis of evidence for the presence of biological fluids and further characterization of those samples using state of the art DNA technologies. In addition, we provide testimony at trial regarding the conclusions of analysis.
Staff
Joe Pasternak, DNA Supervisor and Technical Lead
Lacey Van Grinsven, Serology
Megan Ashton, CODIS Administrator Andrew Bishop, Serology/CODIS
Jamie Bray, DNA Rachel Fife, Serology
Kristy Harty-Connell, DNA Jen Revis-Siegfried, DNA
Successes 1. The section became fully staffed and trained by end of 2017. 2. Cross-trained a serologist as a CODIS technician. Will work to cross-train people in other focuses
when it adds to section flexibility. 3. The validation and implementation of differential extraction robot. 4. Meeting all court dates despite case backlog.
Challenges 1. Backlogged cases due to increased submissions and staff shortages. 2. Dealing with future expectations on section that arise from the Sexual Assault Kit Initiative
committee. 3. Issues with DNA kits caused delays with testing at beginning of 2017. 4. Two separate flooding incidents delayed the ability to work DNA cases for long sections of time.
Casework The chart below shows the doubling of new cases submitted to the section over the past five years:
2013 2014 2015 2016 2017 % increase
over 5 years
# SERO cases 119 147 128 198 162 36%
# DNA cases 184 222 291 314 273 48%
Total New Cases 303 369 419 512 435 44%
32 Montana Department of Justice, Forensic Science Division Annual Report - 2017
June 11, 2018
The chart found below shows the increase in cases completed by the section over the past five years:
2013 2014 2015 2016 2017 % increase
over 5 years
# SERO cases AR 100 147 153 270 281 181%
# DNA cases AR 197 207 275 235 235 19%
Total Cases Completed 297 354 428 505 516 42%
The following chart shows the increase in CODIS samples received and processed over the past five years:
2013 2014 2015 2016 2017 % increase
over 5 years
# new CODIS samples received 2298 2454 3279 3203 2918 27%
# CODIS samples entered 1442 3740 5799 2617 1461 1%
Analysis of sex assault cases is significantly more time-intensive than other offenses because those cases typically involve more complex DNA mixtures requiring advanced interpretation techniques. Sex assaults represent approximately 40% of annual casework. This chart reflects the doubling of sex assault cases submitted to the lab over the past five years:
2013 2014 2015 2016 2017
% increase over 5 years
Sex Assault Offense Cases Received 109 170 175 206 203 86%
33 Montana Department of Justice, Forensic Science Division Annual Report - 2017
June 11, 2018
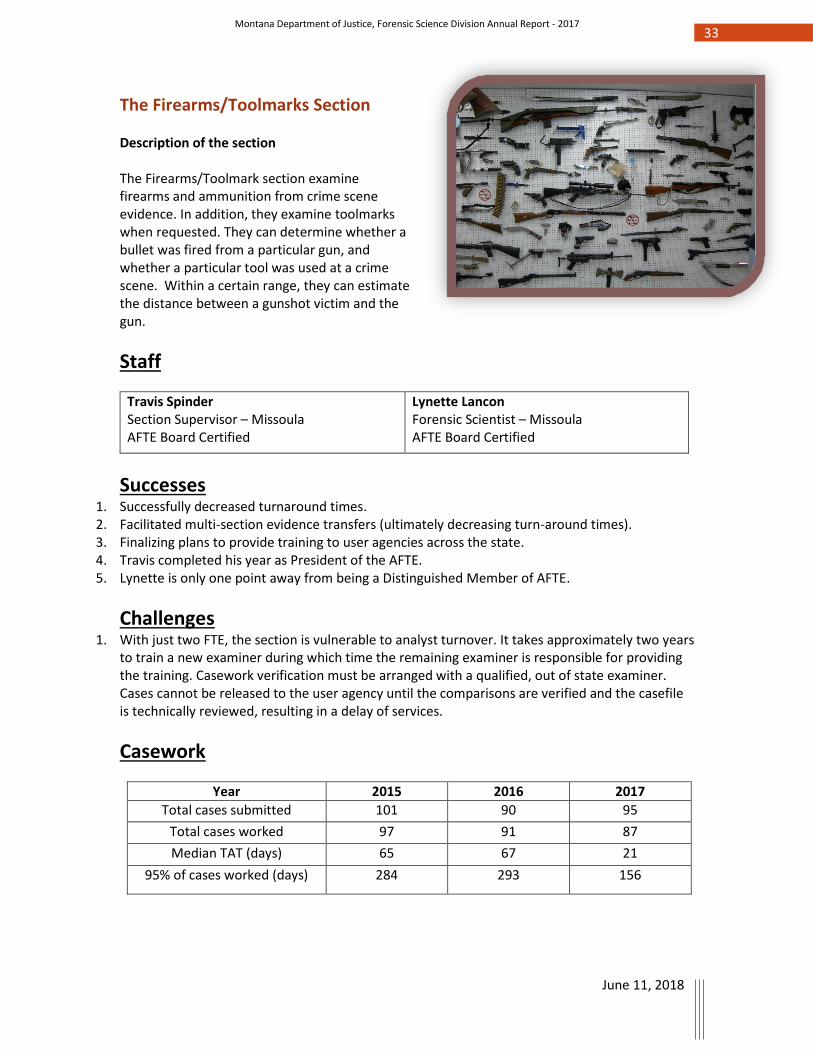
The Firearms/Toolmarks Section Description of the section The Firearms/Toolmark section examine firearms and ammunition from crime scene evidence. In addition, they examine toolmarks when requested. They can determine whether a bullet was fired from a particular gun, and whether a particular tool was used at a crime scene. Within a certain range, they can estimate the distance between a gunshot victim and the gun.
Staff
Travis Spinder Section Supervisor – Missoula AFTE Board Certified
Lynette Lancon Forensic Scientist – Missoula AFTE Board Certified
Successes 1. Successfully decreased turnaround times. 2. Facilitated multi-section evidence transfers (ultimately decreasing turn-around times). 3. Finalizing plans to provide training to user agencies across the state. 4. Travis completed his year as President of the AFTE. 5. Lynette is only one point away from being a Distinguished Member of AFTE.
Challenges 1. With just two FTE, the section is vulnerable to analyst turnover. It takes approximately two years
to train a new examiner during which time the remaining examiner is responsible for providing the training. Casework verification must be arranged with a qualified, out of state examiner. Cases cannot be released to the user agency until the comparisons are verified and the casefile is technically reviewed, resulting in a delay of services.
Casework
Year 2015 2016 2017
Total cases submitted 101 90 95
Total cases worked 97 91 87
Median TAT (days) 65 67 21
95% of cases worked (days) 284 293 156
34 Montana Department of Justice, Forensic Science Division Annual Report - 2017
June 11, 2018
Quality Assurance/Evidence Section
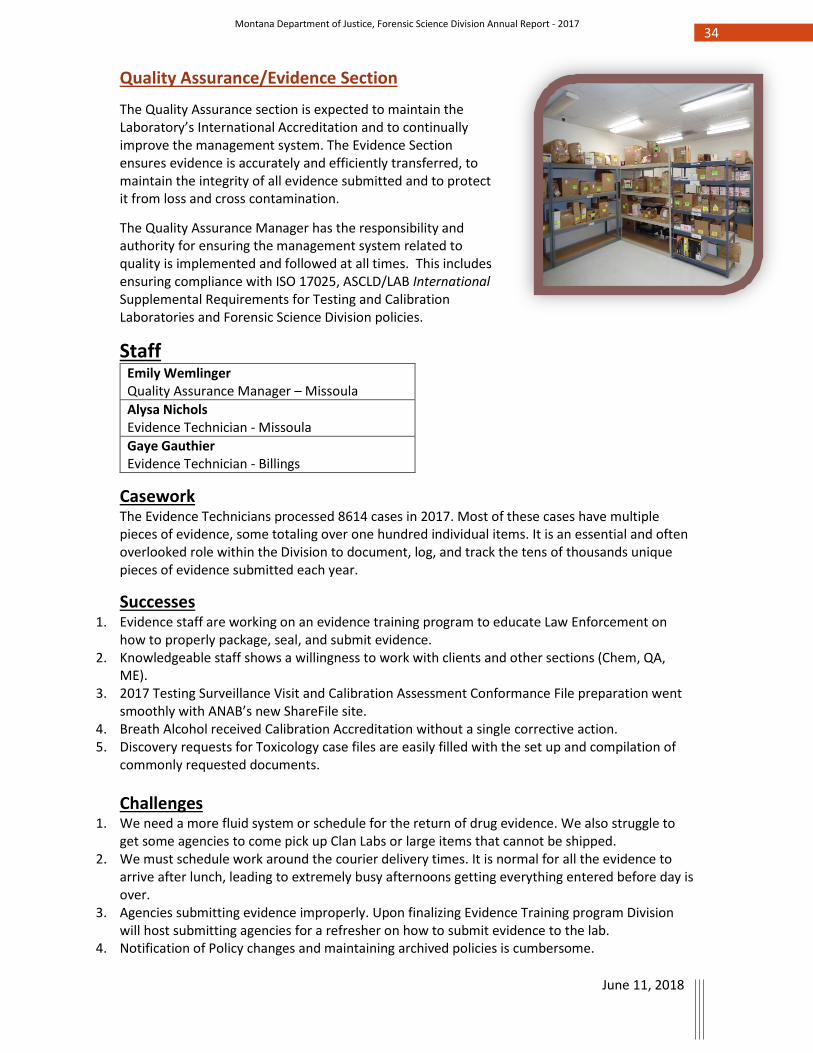
The Quality Assurance section is expected to maintain the Laboratory’s International Accreditation and to continually improve the management system. The Evidence Section ensures evidence is accurately and efficiently transferred, to maintain the integrity of all evidence submitted and to protect it from loss and cross contamination.
The Quality Assurance Manager has the responsibility and authority for ensuring the management system related to quality is implemented and followed at all times. This includes ensuring compliance with ISO 17025, ASCLD/LAB International Supplemental Requirements for Testing and Calibration Laboratories and Forensic Science Division policies.
Staff Emily Wemlinger Quality Assurance Manager – Missoula
Alysa Nichols Evidence Technician - Missoula
Gaye Gauthier Evidence Technician - Billings
Casework The Evidence Technicians processed 8614 cases in 2017. Most of these cases have multiple pieces of evidence, some totaling over one hundred individual items. It is an essential and often overlooked role within the Division to document, log, and track the tens of thousands unique pieces of evidence submitted each year.
Successes 1. Evidence staff are working on an evidence training program to educate Law Enforcement on
how to properly package, seal, and submit evidence. 2. Knowledgeable staff shows a willingness to work with clients and other sections (Chem, QA,
ME). 3. 2017 Testing Surveillance Visit and Calibration Assessment Conformance File preparation went
smoothly with ANAB’s new ShareFile site. 4. Breath Alcohol received Calibration Accreditation without a single corrective action. 5. Discovery requests for Toxicology case files are easily filled with the set up and compilation of
commonly requested documents.
Challenges 1. We need a more fluid system or schedule for the return of drug evidence. We also struggle to
get some agencies to come pick up Clan Labs or large items that cannot be shipped. 2. We must schedule work around the courier delivery times. It is normal for all the evidence to
arrive after lunch, leading to extremely busy afternoons getting everything entered before day is over.
3. Agencies submitting evidence improperly. Upon finalizing Evidence Training program Division will host submitting agencies for a refresher on how to submit evidence to the lab.
4. Notification of Policy changes and maintaining archived policies is cumbersome.