Monroe County’s DMC Final Report December 13, 2011 Monroe County Probation Leslie S. Barnes,...
25
Monroe County’s DMC Final Report December 13, 2011 Monroe County Probation Leslie S. Barnes, Deputy Chief Probation Officer Anne Goewey, Probation Supervisor Hattie M. Henderson, DMC Coordinator
-
Upload
alexis-small -
Category
Documents
-
view
220 -
download
3
Transcript of Monroe County’s DMC Final Report December 13, 2011 Monroe County Probation Leslie S. Barnes,...

Monroe County’sDMC Final Report
December 13, 2011
Monroe County Probation Leslie S. Barnes, Deputy Chief Probation Officer
Anne Goewey, Probation Supervisor
Hattie M. Henderson, DMC Coordinator
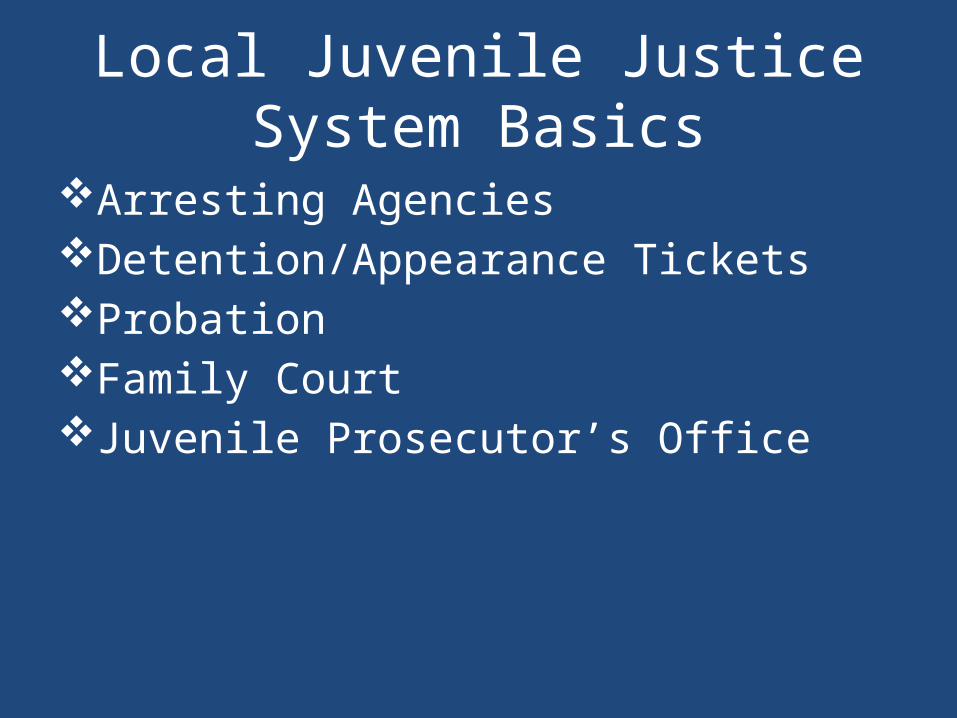
Local Juvenile Justice System Basics
Arresting AgenciesDetention/Appearance Tickets ProbationFamily CourtJuvenile Prosecutor’s Office

Local Juvenile Justice System BasicsWhat are the key components of the system?
• Monroe County Probation Family Service Division (FSD) Overview:
• Family Access and Connection Team (Fact) (pre-diversion PINS)
• Intake/Diversion (non-adj. PINS/JD’s)• PDI’s (Pre-Dispositional Investigations)• General Supervision• Family Court Liaison and ATD Officers - HOJ• Intensive supervision

Total Monroe County Population(2009 USCB)
• Population: 733.703• Race/Ethnicity• 81% White• 14% Black:• 6% Hispanic Origin

Total Number of Youth In Monroe County (ages 10-17); 80,125
African American 17,914 American Indian 352
Asian Indian 2,289
Caucasian 59,570
Latino/Hispanic 7,065*
Includes 17 year olds in numbers

Overview of Local DMC ProblemWhat does the issue look like within this jurisdiction?
Black youth comprise 21% youth population age 10 -16, but represented 58% of arrests
Black youth made up 76% of detention admissions
Black youth were 5 times more likely than whites to be arrested
Black youth were 20 times more likely to be admitted to secure detention
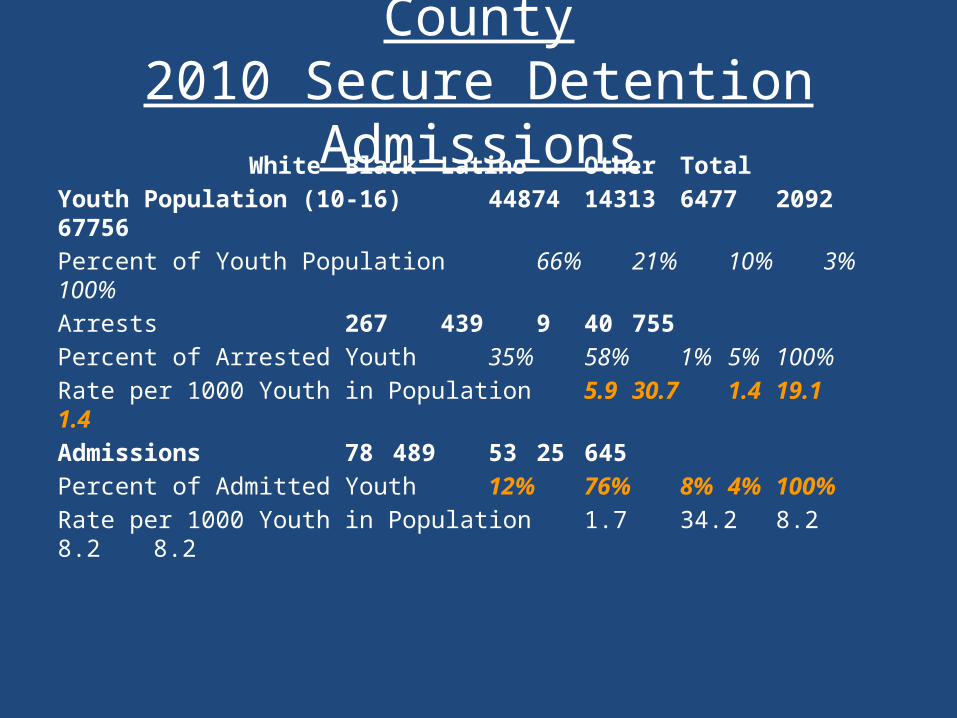
Overview of DMC in Monroe County2010 Secure Detention Admissions
White Black Latino Other Total
Youth Population (10-16) 44874 14313 6477 2092 67756
Percent of Youth Population 66% 21% 10% 3% 100%
Arrests 267 439 9 40 755
Percent of Arrested Youth 35% 58% 1% 5% 100%
Rate per 1000 Youth in Population 5.9 30.7 1.4 19.1 1.4
Admissions 78 489 53 25 645
Percent of Admitted Youth 12% 76% 8% 4% 100%
Rate per 1000 Youth in Population 1.7 34.2 8.2 8.2 8.2

Project Goals What were we hoping to do?
• Bring Recognition to Disparities In JJ & CW• Obtain Accurate Local Data• Partnership with a committee of local
stakeholders to Formulating Strategies • To work with Burns Institute to Develop a
Comprehensive Strategic Plan to Improve and Eliminate Racial and Ethnic Disparities
• Incorporating the voices of youth and families

Project Goals (cont.)
DMC/DMR cross systems collaboration (DHS)DMC/DMR Work groupStrategy TeamIdentify a Target PopulationConnecting ATD with DMCMoving in a parallel directions with DHS Providing Fair and Equal Treatment to ALL
Youth and Families
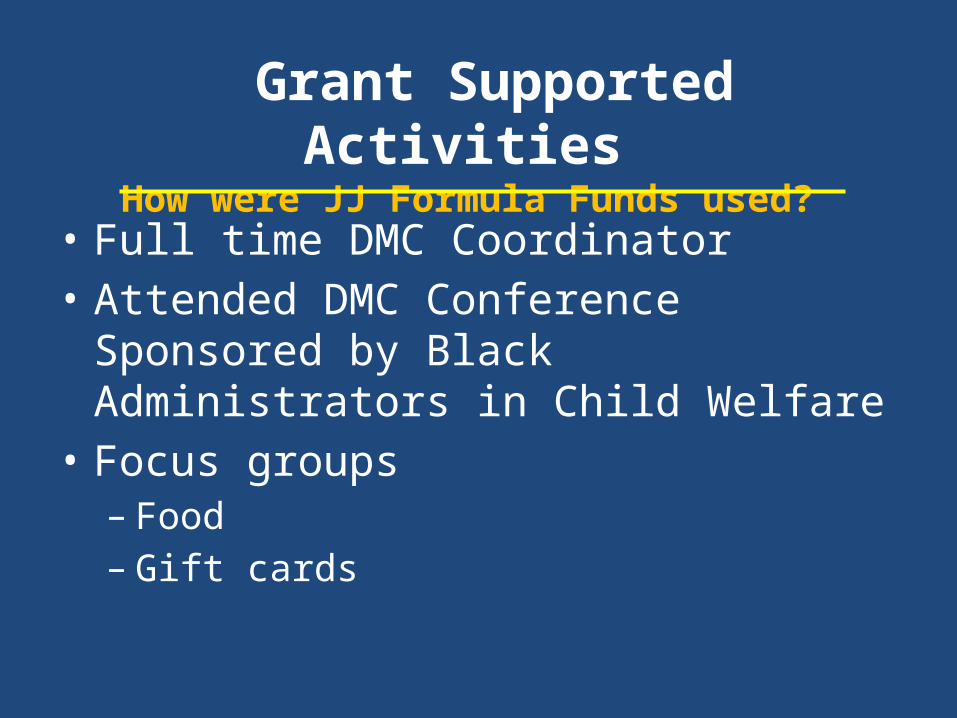
Grant Supported Activities How were JJ Formula Funds used?
• Full time DMC Coordinator• Attended DMC Conference Sponsored by Black
Administrators in Child Welfare • Focus groups
– Food– Gift cards

Other DMC Related Activities
Attendance at Community Conferences• Disparities in Health Care• Rochester Black Boys and Men's
Symposium Rochester City School District• DMR Casey Family Foundation Training Institutional Analysis Literature Review Group Presentations & Individual Contact
With Stakeholders , Youth and Families

Local DMC WorkgroupWhat structural framework supported the work?
Planning Committee was to act in an advisory capacity and was comprised of:
– Chief Probation Officer– Director of Child & Family Services (DHS)– Deputy Chief Probation Officer– DHS Administrators– Probation Supervisor– Local DMC Coordinator
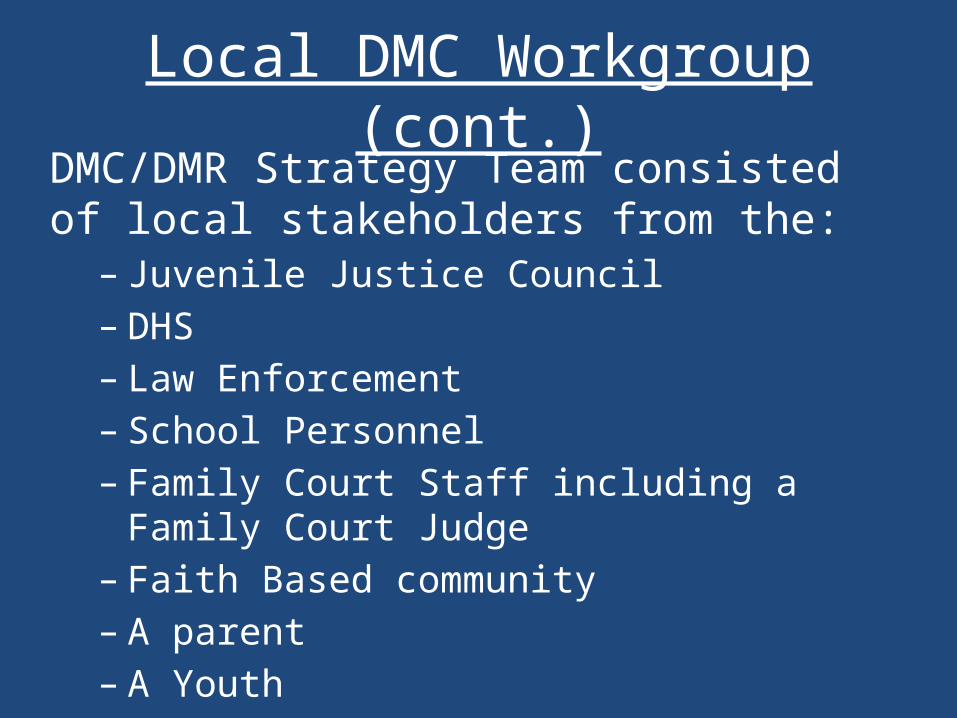
Local DMC Workgroup (cont.)DMC/DMR Strategy Team consisted of local stakeholders from the:
– Juvenile Justice Council– DHS– Law Enforcement– School Personnel– Family Court Staff including a Family Court Judge– Faith Based community– A parent– A Youth

Local DMC Workgroup (cont.)
Strategy Team Local Stakeholder – Mental Health Staff– Legal Aid Society (attorneys for the child)– Juvenile Prosecutor’s Office– Office of Children and Family Services Planning committee met bi-weeklyStrategy Team met monthlyIdentified Target Population: Secure Detention led to merger with ATD Steering Committee

Quantitative Data AnalysisWhat has “digging deeper” revealed?
• Target Population Identified: Secure Detention• DHS Detention Data: Detention Admissions in 2010
White Black Latino Other TotalTotal Admissions
78 489 53 25 645
MCFC Remands 27 191 28 11 257
Percent Of Admissions that are Remands
35% 39% 53% 44% 40%
Race/Ethnicity 11% 74% 11% 4% 100%
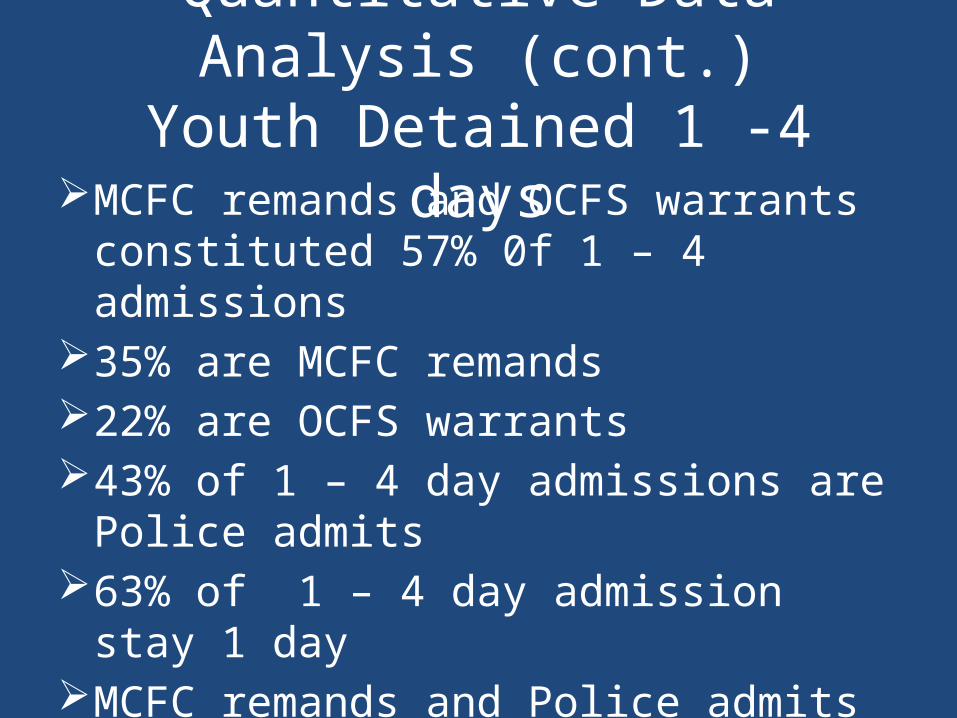
Quantitative Data Analysis (cont.)Youth Detained 1 -4 days
MCFC remands and OCFS warrants constituted 57% 0f 1 – 4 admissions
35% are MCFC remands22% are OCFS warrants43% of 1 – 4 day admissions are Police admits63% of 1 – 4 day admission stay 1 dayMCFC remands and Police admits comprise
78%of 1 day admissions (each are at 39%)

Quantitative Data Analysis (cont.)Youth with a Low RAI Score
RAI outcome Jan-Dec 2010 DHSJan Feb Mar Apr May Jun First 6
months of 2010
Percent of youth detained with RAI risk Level
Low 6 10 9 10 12 10 57 50%
Med 2 2 4 3 2 1 14 12%
High 5 5 3 8 13 10 44 38%
Total 13 17 16 21 27 21 115 100%

Quantitative Data Analysis (cont.)Youth With A Low RAI
• Risk Assessment Instrument (RAI) Tool to help guide juvenile detention decisions• RAI designed to determine youth risk of re-
offending or failing to appear in court• Further analyze the reasons for judicial use of
detention• Why youth with low RAI scores comprise
almost half of admission detentions

Qualitative Data Collection How did the project gain qualitative information?
• Focus Groups/Youth– Personal Safety concerns– Easy access to drugs and guns– Feeling of disconnection and struggle to find
positive role models– High levels of violence in the home & community– Expected to be treated badly by local police– Negative experiences in secure detention
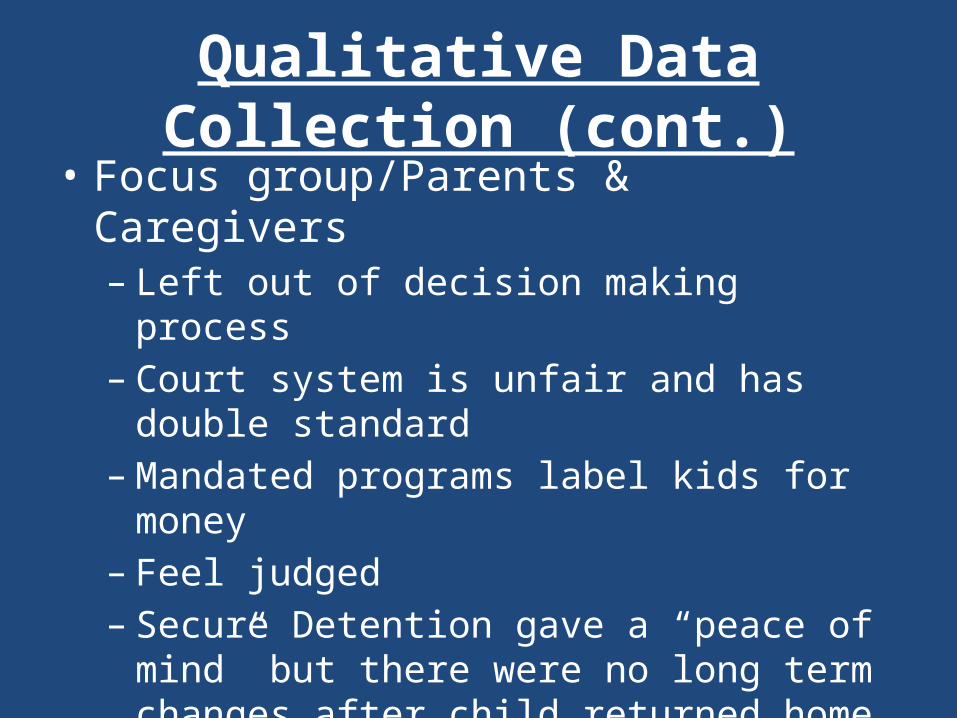
Qualitative Data Collection (cont.)• Focus group/Parents & Caregivers
– Left out of decision making process– Court system is unfair and has double standard– Mandated programs label kids for money– Feel judged – Secure Detention gave a “peace of mind” but
there were no long term changes after child returned home

Qualitative Data Collection (cont.)
• Institutional Analysis Focus Group– Youth Group– Center for Youth Staff– Attorney for the Child – CPS Investigators– Public Defenders– CPS Management Caseworker– Parenting Groups– Court Observation

Summary & RecommendationsWhat can be done to address/support key findings?
• Black youth are overrepresented in Monroe County’s juvenile justice system
• Stakeholders should: Ensure that there is a consistent and accurate
methodology that allows youth to self-identify ethnicity as well as their race Departments and agencies should engage in a discussion on collecting race and ethnicity, Identify racial/ethnic categories that will be collected - as an example, pulling out Latino as a stand alone category

Summary & Recommendations
• Development of a program/process to enable access to the three major data systems (probation, detention and UCMS)
• Develop a Community Service Matrix• County commitment to coach staff and begin
an open dialogue with youth and families• Revisit the use of detention• RAI completed for all youth 24 hours daily

Next StepsHow will the DMC initiative be sustained?
Enhanced ATD Team Improved Data Collection DMC/DMR Mission/Vision statement Displayed , Posted and
Shared Within the Community RAI completed 24 hours daily 7 days on all youth at the point
of arrest

Final Thoughts What should the JJAG know about the process?
• Only the first step in a long process for change• There is a great deal of work needed to
provide staff with awareness of DMC and its impact on youth and families
• Paradigm shift working with families of color from What’s wrong with you? to
What happened to you?• Race Matters