Monroe County Adult Health Survey, 2012 AHS results... · Monroe County Adult Health Survey, 2012...
38
Monroe County Adult Health Survey, 2012 Excellus BlueCross BlueShield Greater Rochester Health Foundation Highland Hospital Lakeside Health System Monroe County Department of Public Health Rochester General Health System Unity Health System University of Rochester - Center for CommunIty Health University of Rochester Medical Center September, 2013
Transcript of Monroe County Adult Health Survey, 2012 AHS results... · Monroe County Adult Health Survey, 2012...

Monroe County
Adult Health Survey, 2012
Excellus BlueCross BlueShield
Greater Rochester Health Foundation
Highland Hospital
Lakeside Health System
Monroe County Department of Public Health
Rochester General Health System
Unity Health System
University of Rochester - Center for CommunIty Health
University of Rochester Medical Center
September, 2013


Table of Contents
EXECUTIVE SUMMARY ........................................................................................................................ 1
INTRODUCTION ...................................................................................................................................... 2
HEALTH STATUS .................................................................................................................................... 7
MENTAL HEALTH ................................................................................................................................. 10
ACCESS TO CARE ................................................................................................................................ 13
IMMUNIZATIONS .................................................................................................................................. 17
CANCER SCREENING ......................................................................................................................... 19
CHRONIC DISEASES AND CONDITIONS ..................................................................................... 21
WEIGHT, PHYSICAL ACTIVITY AND NUTRITION ..................................................................... 27
SMOKING ................................................................................................................................................ 33
ALCOHOL AND MARIJUANA ............................................................................................................ 35

1
EXECUTIVE SUMMARY
The Adult Health Survey (AHS) is a landline/cell phone survey of over 1,800 Monroe County adults that was conducted in the spring and summer of 2012. The purpose of the survey is to provide information about the prevalence of health behaviors and health status indicators among adult residents of the county. Previous Monroe County surveys were conducted in 1997, 2000 and 2006. The response rate of the 2012 survey was comparable to similar health surveys conducted in the US.
Key findings of the 2012 survey include:
14% reported fair/poor health status
9% reported frequent mental distress
8% of adults age 18-64 do not have health insurance
75% of older adults (age 65+) received a flu shot in the past year
81% of older adults (age 65+) ever received a pneumonia shot
83% of women 40 and older had a mammogram in the past two years
76% of adults aged 50+ had appropriate screening for colorectal cancer
10% of all adults have diabetes (13% of those ages 35 and older)
32% of all adults have high blood pressure (41% of those ages 35 and older)
33% have high cholesterol
66% are obese or overweight (30% are obese and another 36% are overweight)
84% engaged in leisure-time physical activity in the past month
28% consumed fruit or fruit juice less than one time per day, in the past month
20% consumed vegetables less than one time per day, in the past month
16% smoke cigarettes
There are significant differences by residence (city/suburbs) and race/ethnicity as shown below.
Health indicator City/Suburbs African American/White Latino/White
Fair or poor health status 21% vs. 11% 20% vs. 13% 20% vs. 13%
Worked less carefully due to emotional problems all/most of time, in past month 9% vs. 3% 10% vs. 3% 10% vs. 3%
Do not have health insurance coverage (age 18-64) 14% vs. 5% 15% vs. 6% 15% vs. 6%
Have diabetes (age 35 and older) 19% vs. 12% 24% vs. 12% 19% vs. 12%
Have high blood pressure (age 35 and older) 50% vs. 39% 64% vs. 39% 42% vs. 39%
Are obese 36% vs. 27% 38% vs. 27% 41% vs. 27%
Engaged in leisure-time physical activity in past month 75% vs. 87% 70% vs. 88% 74% vs. 88%
Consume less than one fruit/juice per day 33% vs. 26% 36% vs. 26% 42% vs. 26%
Consume less than one vegetable per day 30% vs. 16% 39% vs. 16% 31% vs. 16%
Smoke cigarettes 25% vs. 13% 23% vs. 15% No difference
Improving trends between 2000 and 2012 include: - A decline in the rate of smoking – county, suburbs
- An increase in the percentage who received counseling from their health care provider in the past year related to lifestyle changes
Worsening trends between 1997 and 2012 include: - An increase in those reporting fair or poor health- city - An increase in those reporting functional limitations due to health/mental health problems-city
- An increase in the rate of obesity - county, city and suburbs - Increases in the rates of diabetes and high blood pressure – county, city and suburbs
2
INTRODUCTION
Background
The Monroe County Department of Public Health (MCDPH) conducted the fourth Adult Health Survey with the generous support from the Greater Rochester Health Foundation, Excellus BlueCross BlueShield, Highland Hospital, Lakeside Health System, Rochester General Health System, Unity Health System and the University of Rochester Medical Center. Technical assistance was provided by the University of Rochester’s Center for Community Health and the Department of Public Health Sciences. Previous surveys were conducted in 1997, 2000 and 2006.
The purpose of conducting the Monroe County Adult Health Survey (AHS) is to provide information about the prevalence of health behaviors and health status indicators among adult residents of the county. While there are county-level data available from other sources including the Behavioral Risk Factor Surveillance System, the sample sizes of these surveys are not large enough to do sub-county analysis. County-wide survey results often mask serious health issues/inequities in our community. Conducting the AHS allows us to identify disparities at the sub-county level and provides data to support targeting of interventions.
The survey results are used to evaluate community programs, justify funding, and set priorities as part of the community health improvement initiative called HEALTH ACTION. This initiative incorporates the concepts of action based on data (health report cards), community participation in setting priorities for action, and collaboration among community-based agencies and health care providers to address common health goals and evaluate results.
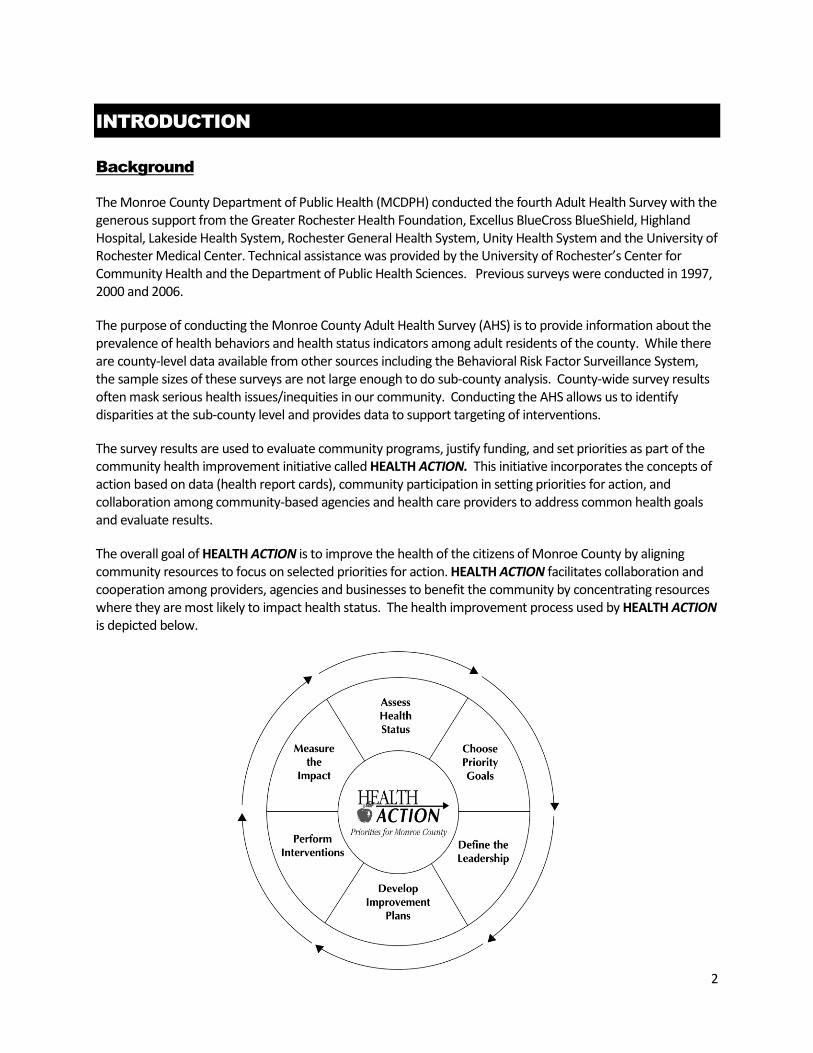
The overall goal of HEALTH ACTION is to improve the health of the citizens of Monroe County by aligning community resources to focus on selected priorities for action. HEALTH ACTION facilitates collaboration and cooperation among providers, agencies and businesses to benefit the community by concentrating resources where they are most likely to impact health status. The health improvement process used by HEALTH ACTION is depicted below.

3
Health “report cards” are available for three focus areas: Maternal/Child Health, Adolescent Health, and Adult Health (available at www.healthaction.org). These survey data will be included in the Adult Health Report Card. This report reviews the survey methodology and highlights the results of the 2012 survey, trends and comparisons to the New York State Behavioral Risk Factor Surveillance System (BRFSS) results (when available).
Survey Methodology
From May to July of 2012, Gilmore Research Group (GRG) administered the Adult Health Survey on behalf of the Monroe County Department of Public Health (MCDPH). The sample included completed interviews with 1,461 landline respondents and 355 cell phone respondents. The survey included questions from CDC’s Behavioral Risk Factor Surveillance System (BRFSS), the National Health Interview Survey and questions developed locally. A random sample of addresses was obtained from the US Postal Service’s Computerized Delivery Sequence File, which is a near-universal listing of all addresses in the county. We oversampled in zip codes within Monroe County with higher proportions of African American and Latino residents, and residents with limited income in order to obtain sufficient numbers of respondents in these populations. Landline telephone numbers were then matched to these addresses and pre-notification letters were sent from the Monroe County Department of Public Health explaining the survey. Households contacted by phone were screened for the number of adult males and females, and the computer randomly selected the member required to be interviewed. For the cell phone mode, a random cell phone sample was purchased from MSG/Genysys. This sample was drawn using switch-center-based construction. Switch-center based sampling frames for random digit dial (RDD) cell phone populations allows greater precision in targeting smaller, usually county-based, geographical targeting than traditional area code-based cellular sampling frames.
Switch
or wire centers refers to the organization of the local telephone exchange system, with each center serving a unique set of exchanges and their associated telephone numbers. Newly assigned cellular telephone numbers are assigned to the user’s nearest switch center, which has been proven to show a higher correlation between the cell phone owner and their home location than the alternative of area code based RDD cell phone populations. Because the number of switch centers in a given geographical region is directly proportionate to its population, this methodology favors densely populated metropolitan areas. Near the end of the fielding, there was difficulty in achieving a desired representation of Latino respondents. To enlarge this sample, an additional 900 sample records were pulled by Hispanic surname and introduced for landline calling. Response rates were calculated separately for landline and cell phone mode using the CASRO formula. The response rate for the landline mode was 22% and 24% for the cell phone mode. These rates are comparable to the rates from urban areas included in the California Health Interview Survey (CHIS), 2009.1 Results from the CHIS show that with increasing population density, there is a decline in the response rate. Therefore, given that we oversampled in city zip codes, which have denser populations,
1 CHIS Methodology Report Series: Report 4 – Response Rates, 2011. http://healthpolicy.ucla.edu/Documents/Newsroom%20PDF/CHIS2009_method4.pdf

4
our response rate is not surprising. The response rate in the 2006 Monroe County Adult Health Survey was 30%, 8 points higher than in 2012. It should be noted that response rates across all survey research modes, in general, have fallen dramatically over the last 10 years, so an 8 point decline since the 2006 survey is consistent with that trend. 2
Data Cleaning and Weighting The survey data were checked and analyzed for inconsistent skip patterns, out-of-range values and other anomalies. Following cleaning, a raking method using the XL STAT software was used to calibrate the sample to match Monroe County’s population composition of race/ethnicity, sex, age, and area of residence to the 2010 Census. Missing values for the weighting variables were imputed separately for males and females using SAS. The sample numbers and population used for the calibration are shown in the table below.
Variable Categories Sample County Sample Percentage
Population County
Population Percentage
Sex Male 693 38.2 273,039 47.4
Female 1123 61.8 302,606 52.6
Age Category 18-34 198 10.9 174,778 30.4
35-49 317 17.5 149,118 25.9
50-64 624 34.4 148,155 25.7
65-74 397 21.9 52,071 9.0
85+ 280 15.4 51,523 9.0
Race Latino 141 7.8 33,790 5.9
White, not Latino
1,384 76.2 440,890 76.6
African American, not Latino
224 12.3 73,531 12.8
All Other races, and Multiple races
67 3.7 27,434 4.8
Area of Residence
Rochester 825 45.4 158,332 27.5
Suburbs 991 54.6 417,313 72.5
2 http://www.people-press.org/2012/05/15/assessing-the-representativeness-of-public-opinion-surveys/

5
Limitations of the Data
People living in congregate-care facilities, those without landlines or cell phones, and those with a primary language other than English or Spanish were not included in the survey.
An additional limitation is that the AHS relies on self-reported data. Respondents tend to “under-report” such behaviors as alcohol or marijuana use but may “over-report” behaviors that seem desirable such as exercise or regular health screenings. The respondent’s ability to recall behaviors may also affect the accuracy of the responses.
Comparison to the Behavioral Risk Factor Surveillance System (BRFSS)
In this report, results from the Monroe County AHS are compared to results from the Behavioral Risk Factor
Surveillance System (BRFSS) for New York State. When the AHS was compared to the BRFSS, the
differences between the two rates were noted to be statistically significant if the 95% confidence
intervals for the percentages did not overlap. We compared AHS to either the 2011 or 2012 BRFSS.
Questions on the BRFSS are rotated, so results for each question are not available each survey year.
It should be noted that there are major differences in survey methodologies between the AHS and the BRFSS.
The BRFSS is conducted throughout the year, while the 2012 AHS was administered during spring and summer months, when people tend to be more active outside and there is increased accessibility to fruits and vegetables, which most likely impacted the responses to questions about physical activity, nutrition and mental health.
The AHS used an address based sampling methodology, while the BRFSS uses random digit dialing.
Different methodologies were utilized to calibrate the samples to the population. The AHS used the raking methodology to calibrate the sample to the population by race, gender and residence (city vs. suburbs). For the 2011 and 2012 BRFSS, the raking method was used, but several variables were included in the calibration that were not included in the AHS calibration. These included education level, marital status, homeowner status and phone source.3
BRFSS data are age adjusted to the 2000 US standard population. The AHS are not age adjusted, but are weighted to the Monroe County 2010 census population.
Comparability Between Sub-Populations in the AHS
Data are presented by the following subpopulations: age (18-64/65+), gender (male/female), residence (city/suburbs) and race/Latino origin (African American, Not Latino/Latino/White, not Latino).
Statistical testing between sub-population groups was done in SAS. An asterisk (*) by a percentage means there was a statistically significant difference between percentages in sub-populations. (P value less than 0.05) For differences by race/Latino origin, an asterisk means the percentage is different compared to the percentage for Whites.
The AHS results are not adjusted by age. Differences in the age distribution within sub-populations in Monroe County can have an impact on the results. City, African American and Latino populations are younger than Suburban and White populations.
3 CDC “Improving Survey Methodology”. http://www.cdc.gov/surveillancepractice/documents/DBS_BRFSS%20Improvements_12_232372_M_REM_5_25_2012.pdf

6
Comparability with Previous AHS
There are differences in the sampling methodologies between the 2012 Monroe County AHS and other years. In 2012, we used an address-based sampling frame, while in previous years, a random digit dial sample was utilized. In addition in 2012, we introduced cell phones into the sample.
The weighting methodology used in the 2012 AHS was different from previous surveys. The data for 1997, 2000 and 2006 were re-weighted using the same methodology in order to make them comparable. When a question was included in three or more surveys, trend analysis was completed in STATA. A significant trend was identified when the slope of the line was statistically different from 0 (P value <.05).
In each section of the report, there is a table that lists questions that were included in 3 or more survey years, along with a notation of whether or not there was an increasing trend (↑), a decreasing trend (↓) or no significant change over-time (NS) for Monroe County, city and suburbs. If a question is not included in the table, it means the question was not asked in 3 or more surveys.

7
12
23* 21*
11
20* 20* 13
0
10
20
30
40
50
Age 18-64 Age 65+ City Suburb AfricanAmerican
Latino White
Per
cen
t
*Statistical significance P<0.05: age 18-64 compared to age 65+, city compared to suburbs, African American & Latino compared to White Source: Monroe County Adult Health Survey, 2012
Fair or Poor Health, Self Reported Health Status, By Age, Residence, and Race/Latino Origin, Monroe County, 2012
HEALTH STATUS
Self- Reported Health Status
In 2012, 14% of Monroe County adults reported their health was “fair or poor”, which is lower than the percentage in NYS in 2012 (18%*).
Differences by age, residence and race/Latino origin are shown in the graphic to the right .
Functional Limitations Due to Physical Health
The table below shows the percentage of adults in Monroe County who reported various functional limitations due to physical health. For the most part, older adults were more likely to report limitations.
Rates of functional limitations are highest among city, African American and Latino populations even though they are younger than suburban and White populations.
Functional Limitations in the Past Month, Monroe County Adults, 2012 Age 18+
Age 18-64
Age 65+
Limited a lot in doing moderate activities like moving a table, pushing a vacuum, bowling or playing golf because of their health
8% 7% 14%*
Limited a lot in climbing stairs 9% 7% 15%*
Did not accomplish what they would have liked at work or in daily activities because of physical health – all or most of the time during the last 4 weeks
12% 10% 18%*
Limited in the kind of work or other activities because of physical health - all or most of the time during the last 4 weeks
10% 9% 13%*
Pain interfered extremely or quite a bit with normal work during past 4 weeks 10% 9% 13%*
Had a lot of energy – none or a little of the time during the past 4 weeks 16% 16% 17%
Physical/emotional health interfered with social activities - All/most of time 7% 8% 5%
*Statistical significance P<0.05 age 18-64 compared to age 65+
Source: Monroe County Adult Health Survey, 2012

8
Monroe County Adult Health Survey Indicators Survey Years
Trend
MC City Sub
Fair or poor health 1997, 2000, 2006, 2012 ↑ ↑ NS
Moderate activities - limited a lot 2000,2006,2012 NS NS NS
Climbing stairs - limited a lot 2000,2006,2012 NS ↑ NS
Accomplished less due To physical health- all/most of time 2000,2006,2012 NS NS NS
Limited in work- all/most of time 2000,2006,2012 NS ↑ NS
Pain interfered - extremely or quite a bit 1997, 2000, 2006, 2012 ↑ ↑ NS
Had a lot of energy - none or a little of the time 2000,2006,2012 ↑ ↑ NS
Physical/emotional health interfered with social activities - all/most of time 2000,2006,2012 NS ↑ NS
NS – no statistically significant trend, ↑statistically significant increase Source: AHS
11* 7
17*
10 16*
7
16*
8
22*
14
0
10
20
30
City Suburb City Suburb City Suburb City Suburb City Suburb
Per
cen
t
*Statistical significance P<0.05 city compared to suburbs
Monroe County Adult Health Survey, 2012
Functional Limitations Due to Physical Health Issues in the Past 4 Weeks By Residence, Monroe County, 2012
Limited in the kind of work or other activities
Limited a lot in doing moderate activites
Did not accomplish what they
would have
Pain interfered extremely/ quite a bit
with normal work
Had a lot of energy, none
or a little of the time
13* 10
7
18* 15*
8
17* 16*
8
27* 24*
14
0
10
20
30
AfricanAmerican
Latino White AfricanAmerican
Latino White AfricanAmerican
Latino White AfricanAmerican
Latino White
Per
cen
t
*Statistical significance P<0.05 compared to White residents
Monroe County Adult Health Survey, 2012
Functional Limitations Due to Physical Health Issues in the Past 4 Weeks By Race/Latino Origin, Monroe County, 2012
Limited in the kind of work or other activities
Limited a lot in doing moderate activites
Pain interfered extremely/quit
e a bit with normal work
Had a lot of energy, none
or a little of the time
Trends in Health Status and Functional Limitations
The percentages of residents reporting fair or poor health and various health limitations increased in the city, while there were no statistically significant changes in the suburbs.

9
Self Report Health Status Indicators City of Rochester, 1997-2012, with Trendlines
Source: AHS

10
12* 7 12*
5 9*
3
16* 10 9*
4
0
10
20
30
City Suburb City Suburb City Suburb City Suburb City Suburb
Per
cen
t
*Statistical significance P<0.05 city compared to suburbs
Monroe County Adult Health Survey, 2012
Mental Health Issues in the Past 4 Weeks By Residence, Monroe County, 2012
Worked less carefully due to emotional
problems
Frequent mental distress
Accomplished less due to emotional
Felt calm or peaceful none or a little of the
time
Felt downhearted or depressed all or most of
the time
13* 6 10*
3
19*
10 13*
4
0
10
20
30
Latino White Latino White Latino White Latino White
Per
cen
t
*Statistical significance P<0.05, Latino compared to White
Source: Monroe County Adult Health Survey, 2012
Mental Health Issues in the Past 4 Weeks By Race and Latino Origin, Monroe County, 2012
Worked less carefully due to emotional
problems
Accomplished Less due to emotional problems
Felt calm or peaceful none or a little of the
time
Felt downhearted or depressed all or most of
the time
MENTAL HEALTH
Mental Health Issues
Respondents to the survey were asked several questions related to their mental health and the effect mental health problems have on their functioning. As shown in the results below, younger residents were more likely to report some of the mental health issues.
Differences by residence and ethnicity are shown in the graphics below.
Mental Health Issues and Functioning in the Past 30 Days Monroe County Adults, 2012
Age 18+
Age 18-64
Age 65+
Have “Frequent Mental Distress” (FMD) - their mental health was not good during 14 or more of the past 30 days(Mental health=stress, depression and problems with their emotions)
9% 10%* 3%
Accomplished less than they would have liked due to emotional problems – all or most of the time 7% 7% 6%
Worked less carefully due to any emotional problems - all or most of the time 5% 5% 5%
Felt calm and peaceful – none or a little of the time 11% 13%* 5%
Felt downhearted and depressed - all or most of the time 5% 6%* 2% *Statistical significance P<0.05 age 18-64 compared to age 65 Source: Monroe County Adult Health Survey, 2012

11
29*
16
33*
24 21
32*
0
10
20
30
40
50
Age 18-64 Age 65+ City Suburb Male Female
Per
cen
t
*Statistical significance P<0.05: age 18-64 compared to age 65+, city compared to suburbs, male compared to female
Source: Monroe County Adult Health Survey, 2012
Ever Told by a Physician or Health Care Providrer that they have Depression or Anxiety
By Age, Residence, and Gender, Monroe County, 2012
African American residents were more likely than White residents to report that they worked less carefully due to emotional problems all or most of the time in the past 4 weeks (10% *vs. 3%). There were no other statistically significant differences in these results between African Americans and Whites.
Depression/Anxiety
Twenty-seven percent (27%) of Monroe County adults were ever told by a physician or health care provider that they have depression or anxiety. As shown in the graphic, there are differences by age, residence and gender.
Receiving Treatment for Mental Health Issues
Eighteen percent (18%) of adults reported they are now taking medicine or receiving treatment from a
physician or other health professional for any type of mental health condition or emotional problem.
Younger adults (19%*) were more likely than adults aged 65 and older (13%), and females (21%*) were
more likely than males (14%), to report they were receiving treatment. There was not a statistically
significant difference in this percentage between the city and suburbs.
Health Care Provider Discussed Mental Health Issues
Forty-two percent (42%) of adults who visited their health care provider for a check-up in the past year reported that their provider spoke with them about whether or not they experience mental health issues (depression, anxiety or stress). (Note: 73% of adults saw a health care provider for a checkup within the past year.)
Younger adults (45%) were more likely than adults age 65 and older (29%), and African American and Latino
residents (50%*) were more likely than White residents (39%) to report they had this conversation with their
health care provider.
Suicide Plan and Attempt
Two percent (2%) of adults reported they made a plan to attempt suicide in the past year, and 0.5% reported they made a suicide attempt.

12
0
25
50
75
100
2000 2006 2012
Per
cen
t
Source: AHS
Health Care Provider Talked with Them About Whether or
Not They Experience Depression, Anxiety and Stress
Monroe County
Trends in Mental Health Indicators
In the City of Rochester, there were increases in the percentages of residents reporting they accomplished less due to emotional problems and they felt calm or peaceful none or a little of the time, while in the suburbs, these percentages stayed the same. In the county, city and suburbs, there were increases in the percentage reporting that their health care provider discussed whether or not they experience mental health issues.
Monroe County Adult Health Survey Indicators Survey Years
Trend
MC City Sub
Frequent mental distress 1997, 2000, 2006, 2012 NS NS NS
Accomplished less due to emotional health- all/most of time 2000,2006,2012 ↑ ↑ NS
Worked less carefully due to emotional health- all/most of time 2000,2006,2012 NS NS NS
Felt calm and peaceful - none or a little of the time 2000,2006,2012 NS ↑ NS
Downhearted & depressed- all/most of time 2000,2006,2012 NS NS NS
Made a plan to attempt suicide in past year 2000,2006,2012 NS NS NS
Attempted suicide in past year 2000,2006,2012 NS NS NS
Health care provider talked with them whether or not they experience depression, anxiety or stress- past year 2000,2006,2012 ↑ ↑ ↑
NS – no statistically significant trend, ↑statistically significant increase, Source: AHS
Mental Health Status Indicators City of Rochester, 2000-2012, with Trendlines
Source: AHS
13
29*
11
34* 27*
13
0
10
20
30
40
City Suburb AfricanAmerican
Latino White
Per
cen
t
*Statistical significance P<0.05: city compared to suburbs, African American and Latino compared to White Source: Monroe County Adult Health Survey, 2012
Discontinuously Insured, Age 18-64 By Residence, and Race/Latino Origin, Monroe County, 2012
14*
5
15* 15*
6
0
10
20
30
40
City Suburb AfricanAmerican
Latino White
Per
cen
t
*Statistical significance P<0.05: city compared to suburbs, African American and Latino compared to White
Source: Monroe County Adult Health Survey, 2012
Do Not Have Health Insurance, Age 18-64 By Residence, and Race/Latino Origin, Monroe County, 2012
ACCESS TO CARE
Health Insurance Coverage
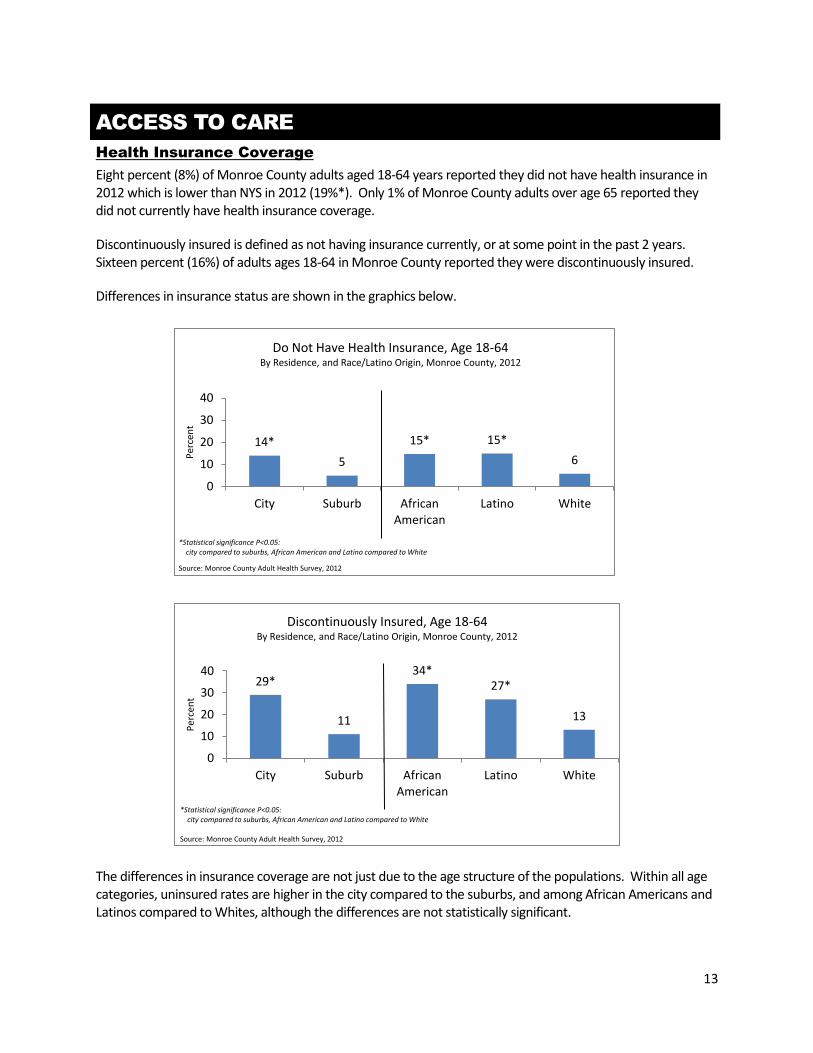
Eight percent (8%) of Monroe County adults aged 18-64 years reported they did not have health insurance in 2012 which is lower than NYS in 2012 (19%*). Only 1% of Monroe County adults over age 65 reported they did not currently have health insurance coverage.
Discontinuously insured is defined as not having insurance currently, or at some point in the past 2 years. Sixteen percent (16%) of adults ages 18-64 in Monroe County reported they were discontinuously insured.
Differences in insurance status are shown in the graphics below.
The differences in insurance coverage are not just due to the age structure of the populations. Within all age categories, uninsured rates are higher in the city compared to the suburbs, and among African Americans and Latinos compared to Whites, although the differences are not statistically significant.

14
9*
3
12* 7
15*
7
0
10
20
30
Age 18-64 Age 65+ City Suburb AfricanAmerican
White
Per
cen
t
*Statistical significance P<0.05: age 18-64 compared to age 65+, city compared to suburbs, African American compared to White
Source: Monroe County Adult Health Survey, 2012
Could Not Afford to See the Doctor When They Needed to in the Past Year By Age, Residence, and Race, Monroe County, 2012
0
10
20
30
40
City Suburb City Suburb City Suburb
Per
cen
t
Age 18-34 age 35-49 age 50-64
Do Not Have Health Insurance, Age 18-64 By Age and Residence, Monroe County, 2012
0
10
20
30
40
City Suburb City Suburb City Suburb
Per
cen
t
Age 18-34 age 35-49 age 50-64
Discontinuously Insured, Age 18-64 By Age and Residence, Monroe County, 2012
0
10
20
30
40
AA Latino WH AA Latino WH AA Latino WH
Per
cen
t
Age 18-34 age 35-49 age 50-64
Do Not Have Health Insurance, Age 18-64 By Age and Race/Latino Origin, Monroe County, 2012
0
10
20
30
40
AA Latino WH AA Latino WH AA Latino WH
Per
cen
t
Age 18-34 age 35-49 age 50-64
Discontinously Insured, Age 18-64 By Age and Race/Latino Origin, Monroe County, 2012
Could Not Afford Medical Care
Eight percent (8%) of Monroe County adults reported that there was a time in the past year when they needed to see the doctor but could not because of the cost.
Differences by age, residence and race are shown below.

15
72* 85
69* 70* 85
0
25
50
75
100
City Suburb AfricanAmerican
Latino White
Per
cen
t
*Statistical significance P<0.05: city compared to suburbs, African American and Latino compared to White
Source: Monroe County Adult Health Survey, 2012
Visited the Dentist in the Past Year By Residence, and Race/Latino Origin, Monroe County, 2012
88* 93
87* 73*
94
0
25
50
75
100
City Suburb AfricanAmerican
Latino White
Per
cen
t
*Statistical significance P<0.05: city compared to suburbs, African American and Latino compared to White
Source: Monroe County Adult Health Survey, 2012
Have One or More People They Think of As Their Personal Health Care Provider
By Residence, and Race, Monroe County, 2012
Access to a Personal Health Care Provider
Ninety-two percent (92%) of Monroe County residents have one or more people they think of as their personal health care provider. Differences are shown in the table below.
Eighty-percent (80%) of adults under age 35 have their own health care provider.
Visited a Health Care Provider for a Routine Check-up in the Past Year
Seventy-three percent (73%) of adults saw a health care provider for a checkup within the past year, which is better than the NYS rate in 2012 (68%*). In Monroe County:
African American residents (90%*) were more likely to have visited a health care provider in the past year for a check-up, compared to White (71%) and Latino (67%) residents
Males (68%*) were less likely to have a check-up compared to females (78%)
Dental Visits
Eighty-two percent (82%) of residents visited the dentist for any reason in the past year, which is better than the percentage in NYS in 2012 (68%*). In Monroe County, there are differences by residence and race/Latino origin.

16
Trends in Access to Care Indicators
The percentage of Monroe County residents reporting they visited the doctor in the past year for a routine
check-up declined from 78% in 2000 to 73% in 2012. Declines occurred in both the city and suburbs. Other
indicators did not change significantly.
Trend data were not available for dental visits.
Monroe County Adult Health Survey Indicators Survey Years
Trend
MC City Sub
Do not have health insurance, all ages 1997, 2000, 2006, 2012 NS NS NS
Do not have health insurance, age 18-64 1997, 2000, 2006, 2012 NS NS NS
Visited a health care provider for a routine check-up in the past year 2000, 2006, 2012 ↓ ↓ ↓
Needed to see the doctor, but couldn't because of cost-past year 1997, 2000, 2012 NS NS NS
NS – no statistically significant trend, ↓statistically significant decrease Source: AHS
NS – no statistically significant trend Source: MCAHS

17
68* 74* 77 83
0
25
50
75
100
Flu ShotPast Year
Pneumonia VaccinationEver
Per
cen
t
*Statistical significance P<0.05: city compared to suburbs Source: Monroe County Adult Health Survey, 2012
Immunization Rates, Age 65+ By Residence
Monroe County 2012
City Suburb
75* 81*
55 67
0
25
50
75
100
Flu ShotPast Year
Pneumonia VaccinationEver
Per
cen
t
* 95% Confidence intervals do not overlap, Monroe County compared to NYS
Source: Monroe County Adult Health Survey, 2012
Immunization Rates, Age 65+ Monroe County 2012, Compared to NYS in 2012
Monroe NYS
73 71
42*
63* 76
83
0
25
50
75
100
Flu ShotPast Year
Pneumonia VaccinationEver
Per
cen
t
*Statistical significance P<0.05: Latino compared to White
Source: Monroe County Adult Health Survey, 2012
Immunization Rates, Age 65+ By Race/Latino Origin
Monroe County 2012
African American Latino White
IMMUNIZATIONS
Older adults are at highest risk for developing complications from flu and pneumonia. As shown in the graphic to the right, immunization rates among older adults in Monroe County are higher than rates in NYS.
As shown in the graphics to the right and on the next page, there are differences by residence.
There were statistically significant differences in the rates between Latinos and Whites. While rates for African American residents were somewhat lower than Whites, the differences were not statistically significant.

18
Of Monroe County adults age 18-64 years old, 44% reported they had a flu shot in the past year and 25% ever had a pneumonia vaccination.
Trends in Immunization Rates
The percentage of Monroe County older adults who received a flu shot did not change significantly between 1997 and 2012, while the percentage who received the pneumonia shot increased from 53% in 1997 to 81% in 2012. Similar trends were seen in both the city and suburbs.
Monroe County Adult Health Survey Indicators Survey Years
Trend
MC City Sub
Had a flu shot in the past year, age 65+ 1997, 2000, 2006, 2012 NS NS NS
Ever had a pneumonia shot, age 65+ 1997, 2000, 2006, 2012 ↑ ↑ ↑
NS – no statistically significant trend, ↑statistically significant increase Source: AHS
NS – no statistically significant trend Source: MCAHS
0
25
50
75
100
1997 2000 2006 2012
Per
cen
t
Source: AHS
Had a Pneumonia Shot-Ever Age 65+, Monroe County, 2000-2012, with Trendline
19
64* 76*
84 89
0
25
50
75
100
Mammogram in the past 2 years – women age 40-64
PAP test in the past 3 years – women age 18-64
Per
cen
t
*Statistical significance P<0.05: uninsured compared to insured
Source: Monroe County Adult Health Survey, 2012
Breast and Cervical Cancer Screening By Insurance Status
Monroe County 2012
Uninsured Insured
86 80
88
0
25
50
75
100
Mammogram in the past 2 years – women age 50-74
Mammogram in the past 2 years – women age 40-49
PAP test in the past 3 years – women age 21-65
Per
cen
t
Source: Monroe County Adult Health Survey, 2012
Breast and Cervical Cancer Screening Monroe County 2012
CANCER SCREENING
Breast and Cervical Cancer Screening (Mammogram and PAP Test)
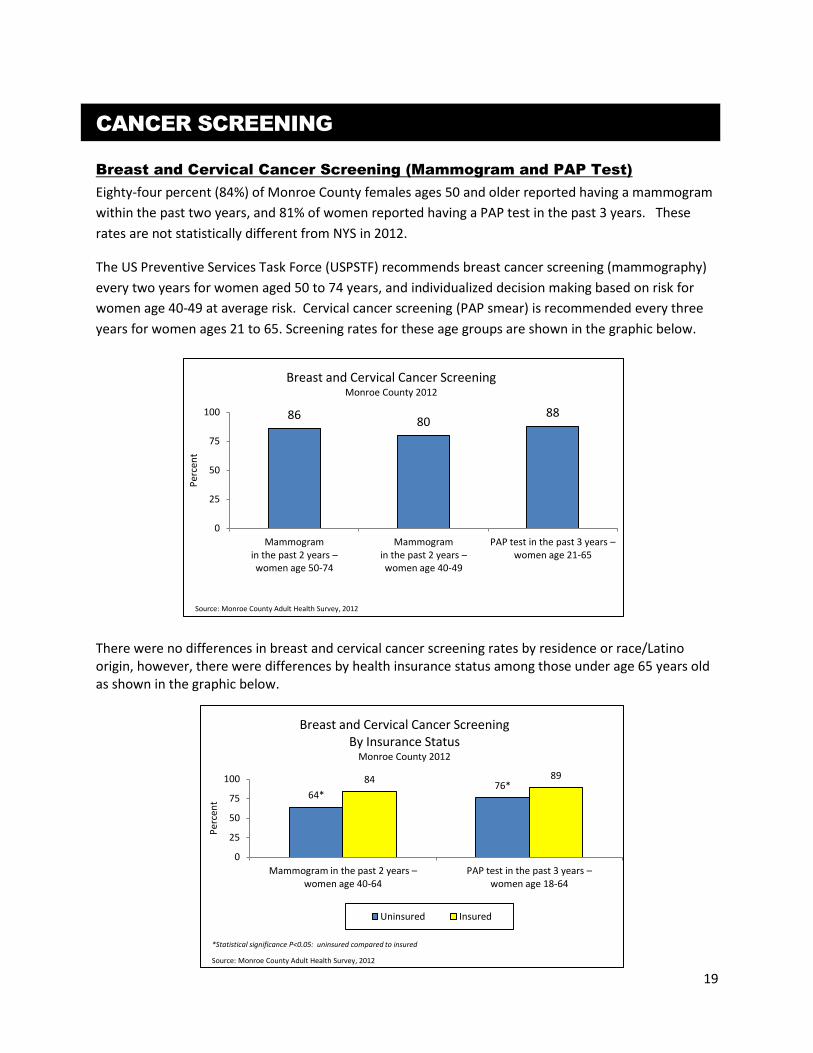
Eighty-four percent (84%) of Monroe County females ages 50 and older reported having a mammogram
within the past two years, and 81% of women reported having a PAP test in the past 3 years. These
rates are not statistically different from NYS in 2012.
The US Preventive Services Task Force (USPSTF) recommends breast cancer screening (mammography)
every two years for women aged 50 to 74 years, and individualized decision making based on risk for
women age 40-49 at average risk. Cervical cancer screening (PAP smear) is recommended every three
years for women ages 21 to 65. Screening rates for these age groups are shown in the graphic below.
There were no differences in breast and cervical cancer screening rates by residence or race/Latino origin, however, there were differences by health insurance status among those under age 65 years old as shown in the graphic below.

20
52*
73
0
25
50
75
100
Colonoscopy in Past 10 Years or Blood Stool Test Past Year (Age 50-64)
Pe
rce
nt
*Statistical significance P<0.05: uninsured compared to insured
Source: Monroe County Adult Health Survey, 2012
Colorectal Cancer Screening By Insurance Status
Monroe County 2012
Uninsured Insured
Colorectal Cancer Screening
The percentage of Monroe County residents aged 50 and older who ever had a colonoscopy (76%*) is similar to the percentage in NYS in 2012. The USPSTF recommends adults ages 50 to 75 have a colonoscopy every 10 years, or a blood stool test annually. Seventy-five percent (75%) of residents in Monroe County meet this recommendation. There were no differences by residence or race/Latino origin, however, there was a difference by health insurance status as shown in the graphic to the right.
Trends in Cancer Screening Rates
For breast cancer screening, trends were analyzed for ages 50-74 and ages 40-49. The screening rate declined among women ages 50-74 in Monroe County and the city. There was no change in the rate among women ages 40-49. Trend data were not available for cervical cancer screening and colorectal cancer screening.
Monroe County Adult Health Survey Indicators Survey Years
Trend
MC City Sub
Had a mammogram in the past 2 years all women age 50-74 2000,2006,2012 ↓ ↓ NS
Had a mammogram in the past 2 years all women age 40-49 2000,2006,2012 NS NS NS
NS – no statistically significant trend, ↓statistically significant decrease Source: AHS
0
25
50
75
100
2000 2006 2012
Per
cen
t
Source: AHS
Had a Mammogram in the Past 2 Years Women ages 50-74
Monroe County, 2000-2012, with Trendline
21
89* 91* 95 95
0
25
50
75
100
BP Past Year Chol Test Past 5 Years
Per
cen
t
*Statistical significance P<0.05: male compared to female
Source: Monroe County Adult Health Survey, 2012
Blood Pressure Check in Past Yr and Cholesterol Screening Past 5 Years By Gender, Monroe County, 2012
Male Female
CHRONIC DISEASES AND CONDITIONS
Blood Pressure and Cholesterol Screening
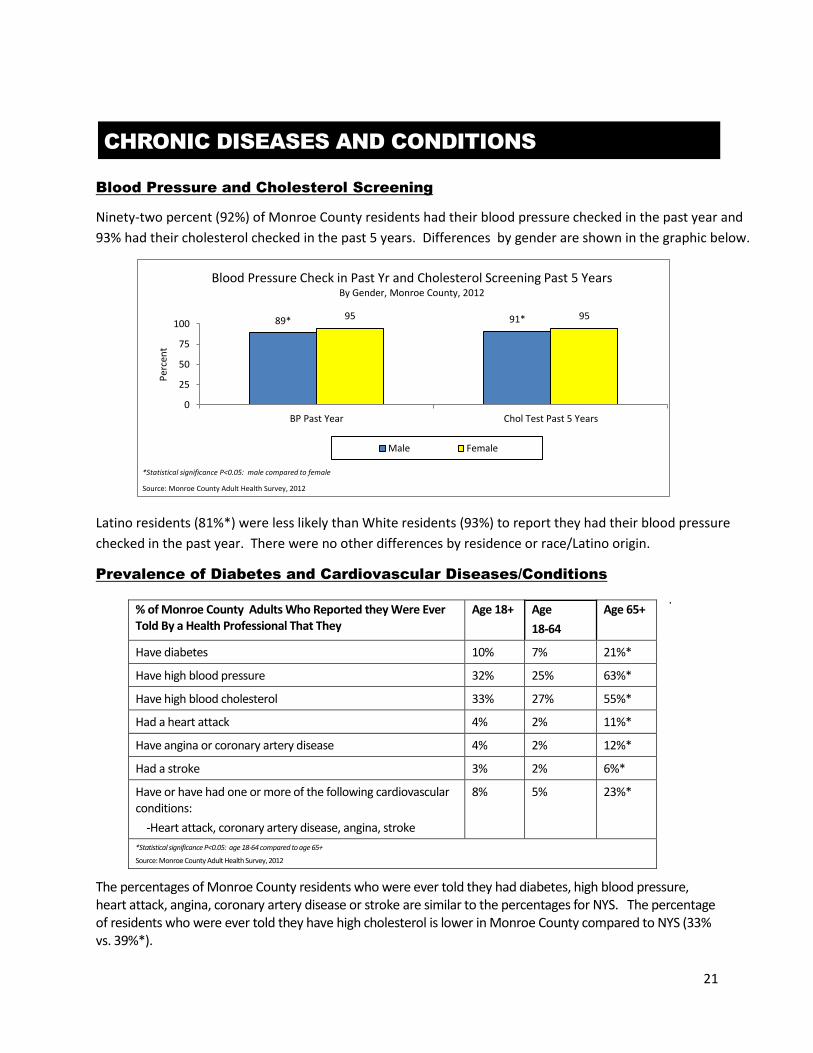
Ninety-two percent (92%) of Monroe County residents had their blood pressure checked in the past year and
93% had their cholesterol checked in the past 5 years. Differences by gender are shown in the graphic below.
Latino residents (81%*) were less likely than White residents (93%) to report they had their blood pressure
checked in the past year. There were no other differences by residence or race/Latino origin.
Prevalence of Diabetes and Cardiovascular Diseases/Conditions
.
The percentages of Monroe County residents who were ever told they had diabetes, high blood pressure, heart attack, angina, coronary artery disease or stroke are similar to the percentages for NYS. The percentage of residents who were ever told they have high cholesterol is lower in Monroe County compared to NYS (33% vs. 39%*).
% of Monroe County Adults Who Reported they Were Ever Told By a Health Professional That They
Age 18+ Age
18-64
Age 65+
Have diabetes 10% 7% 21%*
Have high blood pressure 32% 25% 63%*
Have high blood cholesterol 33% 27% 55%*
Had a heart attack 4% 2% 11%*
Have angina or coronary artery disease 4% 2% 12%*
Had a stroke 3% 2% 6%*
Have or have had one or more of the following cardiovascular conditions:
-Heart attack, coronary artery disease, angina, stroke
8% 5% 23%*
*Statistical significance P<0.05: age 18-64 compared to age 65+
Source: Monroe County Adult Health Survey, 2012

22
Since the populations of city residents and of African Americans and Latinos have high proportions of
adults under age 35, and the prevalence of these diseases/conditions increase with age, we calculated
rates for ages 35 and older by subpopulations. In this age category, there are some significant
differences by residence and race/Latino origin.
Blood Sugar Management and Control Among Those with Diabetes
Respondents who were ever told they had diabetes were asked if their blood sugar is usually 130 or less in the morning before they eat. This question provides an indication of diabetes management and control. Of those who were ever told they had diabetes, 15% responded they did not know if their blood sugar was usually 130 or below. Of those who knew, 74% reported their blood sugar was usually 130 or below.
Blood Pressure (BP) Checks and BP Control – Of Those with High Blood Pressure
Of those who were ever told they had high blood pressure, 96% had their blood pressure checked in the
past year. Seventy-two percent (72%) of those who had it checked, reported their blood pressure was
normal or low. The percentages were lower among adults under age 65 (67%*) compared to older
adults (79%), and among city residents (61%*) compared to the suburban residents (77%) .
24*
64*
5* 19*
42
4 12
39
3 0
25
50
75
100
Diabetes High Blood Pressure Stroke
Per
cen
t
*Statistical significance P<0.05: African American and Latino compared to White Source: Monroe County Adult Health Survey, 2012
Ever Been Told They Have Diabetes, High Blood Pressure or Had a Stroke By Race/Latino Origin, Adults Aged 35 Years and Older
Monroe County, 2012
African American Latino White
19*
50*
6* 12
39
2 0
25
50
75
100
Diabetes High Blood Pressure Stroke
Per
cen
t
*Statistical significance P<0.05: City compared to Suburb Source: Monroe County Adult Health Survey, 2012
Ever Been Told They Have Diabetes, High Blood Pressure, or Had a Stroke By Residence, Adults Aged 35 Years and Older
Monroe County, 2012
City Suburb

23
83
60 53
67
5
96
66 59
75
1 0
20
40
60
80
100
TakeMedicine
ReduceSalt
Intake
LoseWeight
Exercise Nothing
Per
cen
t
Source: Monroe County Adult Health Survey, 2012
Health Care Provider's Advice to Control HBP Reported by those Who Have High Blood Pressure
Monroe County, 2012
All with HBP Under A Physician's Care for HBP
78* 69*
96 94* 91 93 96 98
0
25
50
75
100
Advised to Take Meds Taking Meds Advised to Take Meds Taking Meds
Per
cen
t
*Statistical significance P<0.05: age 18-64 compared to age 65+
Source: Monroe County Adult Health Survey, 2012
Health Care Provider's Advice to Take Medication and Are Taking Medication to Control HBP- By Age
Reported by those Who Have High Blood Pressure Monroe County, 2012
age 18-64 age 65+
All with HBP Under a Physician's Care For HBP
Under a Physician’s Care for High Blood Pressure (HBP)
Seventy-six percent (76%) of adults who were ever told they had high blood pressure reported they
were currently under a physician’s care for the condition. A higher proportion of adults ages 65 and
older (88%*) were in care compared to younger adults (70%).
Health Care Provider Advice and Taking Action to Control HBP
Respondents who reported they were ever diagnosed with high blood pressure were asked if their
physician or another health care professional advised them to take certain steps to control their blood
pressure, and what steps they were taking currently to control their condition. Data were analyzed for
all respondents who were ever diagnosed with high blood pressure and only those under a physician’s
care for the condition. Those under a physician’s care were more likely to report receiving instruction
about how to control their blood pressure and for the most part to be taking steps to control their blood
pressure.
There were differences by age in medication recommendations and adherence. However, if respondents were under a physician’s care, the disparity in receiving advice about medication was eliminated, and in taking medication, the disparity was lessened.
77 63
45
68
4
96
70
51
71
<1 0
20
40
60
80
100
TakeMedicine
ReduceSalt
Intake
LoseWeight
Exercise Nothing
Per
cen
t
Source: Monroe County Adult Health Survey, 2012
Actions to Control HBP Reported by those Who Have High Blood Pressure
Monroe County, 2012
All with HBP Under a Physican's Care for HBP

24
71* 61*
77* 72* 85 81
97 97
0
25
50
75
100
Advised to Take Meds Taking Meds Advised to Take Meds Taking MedsP
erce
nt
*Statistical significance P<0.05: Latino compared to White
Source: Monroe County Adult Health Survey, 2012
Health Care Provider’s Advice to Take Medication and Are Taking Medication to Control HBP- By Latino Origin
Reported by those Who Have High Blood Pressure Monroe County, 2012
Latino White
All with HBP Under a Physician's Care For HBP
59* 55* 72 74
0
25
50
75
100
Reducing Salt Intake Exercising
Per
cen
t
*Statistical significance P<0.05: African American compared to White
Source: Monroe County Adult Health Survey, 2012
Taking Steps to Control Blood Pressure Of those Under A Physician's Care for HBP
By Race, Monroe County, 2012
African American White
Among those with high blood pressure, Latino residents were less likely than White residents to report they were advised to take medication and were taking medication. The differences remained even if they were under a physician’s care.
While there were no differences by race and residence in the proportion reporting their health care provider recommended lifestyle changes to control their blood pressure (reduce salt, lose weight, and exercise), there were differences in the percent of respondents reporting they were taking certain steps.
Of those under a physician’s care, African Americans were less likely than Whites to be reducing their salt intake and to be exercising to control their blood pressure.
City residents were less likely than suburban residents to report they are exercising/being physically active to control their blood pressure (62%* vs. 75%).
Under a Physician’s Care for High Cholesterol (HCH)
Sixty-two percent (62%) of adults who were ever told they had high cholesterol reported they were
currently under a physician’s care for the condition. Adults under age 65 (56%*) were less likely to be
under care than adults age 65 and older (74%). There were no differences by race/Latino origin,
residence or gender.

25
68 72
51
70
5
95
73
59
75
<1 0
25
50
75
100
Take meds ChangeDiet
LoseWeight
Exercise Nothing
Per
cen
t
Source: Monroe County Adult Health Survey, 2012
Health Care Provider’s Advice to Control High Cholesterol
Reported by those Who Have High Cholesterol Monroe County, 2012
All with High Cholesterol Under a Physician's Care for High Cholesterol
Health Care Provider Advice and Taking Action to Control HCH
Respondents ever diagnosed with high cholesterol were asked if their physician or another health care
professional advised them to take certain steps to control it, and if they were taking certain steps. Data
were analyzed for all respondents who were ever told they had high cholesterol and only those under a
physician’s care for the condition. Those under a physician’s care were more likely to report receiving
recommendations to take medicine and to be taking medicine to control their cholesterol. There were
not any other statistically significant differences.
Older adults were more likely to be taking medication to control their cholesterol compared to younger
adults, although the disparity was eliminated when respondents were under a physician’s care. Younger
adults were more likely to be making lifestyle changes to control their cholesterol compared to older
adults. There were no statistically significant differences in reported lifestyle changes to control
cholesterol by residence or race/Latino origin.
Asthma
Eighteen percent (18%) of Monroe County adults were ever told they have asthma and 11% reported
they have asthma now. These percentages are not different from the NYS BRFSS.
In Monroe County, Latino residents (20%*) were more likely than White residents (11%) to report they
currently have asthma.
Trends in Chronic Diseases and Conditions
Blood pressure and cholesterol screening rates, increased along with rates of diagnosed diabetes, and high blood pressure. The increase in the diabetes rate is most likely due in part to changes in screening recommendations between 2000 and 2006.4
4In 1996 USPSTF said there was insufficient evidence to recommend routine screening for diabetes in asymptomatic adults. In 2003, a recommendation was made to screen
for diabetes among those with high blood pressure and high cholesterol. http://biotech.law.lsu.edu/cphl/Practice/preventive_services.pdf http://archive.ahrq.gov/news/press/pr2003/diabscpr.htm
63 72
46
68
5
92
74
52
69
<1 0
25
50
75
100
Take meds ChangeDiet
LoseWeight
Exercise NothingP
erce
nt
Source: Monroe County Adult Health Survey, 2012
Actions to Control Cholesterol Reported by those Who Have High Cholesterol
Monroe County, 2012
All with High Cholesterol Under a Physician's Care for High Cholesterol

26
.
Monroe County Adult Health Survey Indicators Survey Years
Trend
MC City Sub
Ever diagnosed with diabetes 1997, 2000, 2006, 2012 ↑ ↑ ↑
Ever told Had high blood pressure 1997, 2000, 2006, 2012 ↑ ↑ NS
Had blood pressure checked in past year 1997, 2000, 2006, 2012 ↑ ↑ ↑
Ever told have high cholesterol 1997, 2000, 2006, 2012 NS NS NS
Had cholesterol checked in past 5 years 1997, 2000, 2006, 2012 ↑ ↑ ↑
NS – no statistically significant trend, ↑statistically significant increase - stable between 2006-2012 Source: AHS
Chronic Disease Indicators Monroe County, 1997-2012, with Trendlines
Source: AHS

27
36* 31
67
27 38*
66
0
25
50
75
100
Obese Overweight Obese or Overweight
Per
cen
t
*Statistical significance P<0.05: city compared to suburb
Source: Monroe County Adult Health Survey, 2012
Adults in Obese or Overweight Categories By Residence
Monroe County, 2012
City Suburbs
38* 37
75*
41*
23*
64
27 38
65
0
25
50
75
100
Obese Overweight Obese or Overweight
Per
cen
t
*Statistical significance P<0.05: African American and Latino compared to White
Source: Monroe County Adult Health Survey, 2012
Adults in Obese or Overweight Categories By Race/Latino Origin Monroe County, 2012
African American Latino White
WEIGHT, PHYSICAL ACTIVITY AND NUTRITION
Obesity and Overweight
As part of the AHS, respondents were asked to report their height and weight (without shoes). Based on this information, body mass index (BMI) was calculated and respondents were classified into the following categories: obese, overweight, and obese or overweight.5
Thirty-percent (30%) of Monroe County adults are in the obese weight category and an additional 36% are in the overweight category. The rate of obesity in Monroe County is higher than the rate in NYS in 2012 (24%*), while the rates of overweight are not statistically different.
There are significant differences by residence and race.
.
Males were more likely than females to be obese or overweight (70%* vs. 62%).
5 Obese – BMI>=30, Overweight-BMI>=25 and <30, Obese or Overweight-BMI>=25, Not obese or overweight-BMI<25

28
Weight Control
Sixty-eight percent (68%) of those in the obese or overweight categories reported they have tried to lose weight in the past year. Females were more likely than males to report they had tried to lose weight (75%* vs. 62%). Of adults in the obese/overweight category who visited the doctor for a check-up in the past year, 45% said their doctor advised them to lose weight.
There were no differences in these percentages by residence, race/Latino origin and gender.
Leisure-Time Physical Activity in Past Month
Leisure-time physical activity is defined as walking for exercise, golf, gardening, running or any other exercise or physical activity done during non-work time. Eighty-four percent (84%) of residents reported they participated in leisure-time physical activity in the past month. The percentage is higher than NYS in 2012 (75%*), however the 2012 Monroe County AHS was conducted during the summer months, when residents tend to be more active, and the NYS BRFSS was conducted year round.
The graphic below shows the differences in leisure time activity in Monroe County.
Aerobic Physical Activity
Survey respondents were asked how often and how much time they spend engaging in moderate or
vigorous physical activity. The National Recommendations for physical activity are for adults to engage
in 150 minutes of moderate-intensity aerobic activity or 75 minutes of vigorous-intensity aerobic activity,
or a combination of the two each week. According to the Monroe County Adult Health Survey, 65% of
residents meet these recommendations. This percentage is comparable to national results from analysis
of similar questions in the 2007 BRFSS.6
Differences by age, residence and race are shown in the graphic on the next page.
6 http://www.cdc.gov/mmwr/preview/mmwrhtml/mm5748a1.htm
85* 78 75*
87
70* 74*
88
0
25
50
75
100
Age 18-64 Age 65+ City Suburb AfricanAmerican
Latino White
Per
cen
t
*Statistical significance P<0.05: age 18-64 compared to age 65+, city compared to suburb, African American and Latino compared to White Source: Monroe County Adult Health Survey, 2012
Engaged in Leisure-Time Physical Activity in the Past Month By Age, Residence and Race/Latino Origin, Monroe County, 2012

29
Diet Practices/Intake
% of Monroe County Adults Reporting Diet Practices/Intake Monroe County
Age 18-64
Age 65+
Watching their salt intake 58% 55%* 74%
Consume soda or another sugar sweetened beverage one or more times per day 23% 25%* 15%
Eat fast food 3 or more times per week 11% 12%* 4% Source: Monroe County Adult Health Survey, 2012
Differences by residence and
race in soda/sugar sweetened
beverage and fast food
consumption are shown in the
graphics to the right.
30* 21
46*
20
0
25
50
75
100
City Suburb African American White
Per
cen
t
*Statistical significance p<0.05: city compared to suburb, African American compared to White
Source: Monroe County Adult Health Survey, 2012
Consume Soda/Sugar Sweetened Beverages 1+ Times/Day
By Residence and Race, Monroe County, 2012
20* 21*
8
0
25
50
75
100
African American Latino White
Per
cen
t
*Statistical significance p<0.05: African American and Latino compared to White Source: Monroe County Adult Health Survey, 2012
Consume Fast Food 3+ Times/Week By Residence and Race, Monroe County, 2012
69 64*
56
69*
49*
63 68
0
25
50
75
100
Age 18-64 Age 65+ City Suburb AfricanAmerican
Latino White
Per
cen
t
*Statistical significance P<0.05: age 18-64 compared to age 65+, city compared to suburb, African American and Latino compared to White Source: Monroe County Adult Health Survey, 2012
Meet the Recommendations for Physical Activity By Age, Residence and Race/Latino Origin, Monroe County, 2012

30
Fruit and Vegetable Intake
The survey included questions about past month consumption of 100% fruit juice, fruit, legumes (such as black
beans, chick peas), dark green vegetables, orange colored vegetables, and all other types of vegetables (including
potatoes, but not french fries). Responses were analyzed to determine the number of times per day fruit and
vegetables were consumed.
Twenty-eight percent (28%) reported consuming fruit less than one time per day and 20% reported consuming
vegetables less than once per day. Adults ages 18-64 were more likely to consume fruit less than one time per day
(30%*) compared to adults aged 65 and older (21%). There was not a difference in vegetable intake between these
age groups.
There were significant differences in fruit and vegetable intake by residence, race/Latino origin and gender.
33* 30* 26 16
0
25
50
75
100
Fruit/Fruit Juice Vegetables
Per
cen
t
*Statistical significance P<0.05: city compared to suburb
Source: Monroe County Adult Health Survey, 2012
Fruit/Fruit Juice and Vegetable Consumption Less than 1 Time/Day By Residence, Monroe County, 2012
City Suburb
36* 39* 42* 31* 26
16
0
25
50
75
100
Fruit/Fruit Juice Vegetables
Per
cen
t
*Statistical significance P<0.05: African American and Latino compared to White
Source: Monroe County Adult Health Survey, 2012
Fruit/Fruit Juice and Vegetable Consumption Less than 1 Time/Day By Race and Latino Origin, Monroe County, 2012
African American Latino White

31
Health Care Provider Counseling Related to Physical Activity and Nutrition
Of Monroe County adults who visited a health care provider for a routine check-up in the past year, 49% said
their provider spoke with them about their physical activity and 40% spoke with them about their eating
habits. There were no differences by residence, race/Latino origin or gender.
Trends in Weight, Physical Activity and Nutrition
There were increases in rates of obesity, obese/overweight and counseling related to nutrition and physical
activity. The percentage of adults engaging in leisure-time physical activity increased between 2000 and 2006,
however it may be due in part to the time of year the surveys were conducted. (2000 – Winter, 2006 and
2012- Spring and Summer)
The questions about meeting the physical activity recommendations, salt intake, sugar sweetened beverages
and fruit/vegetables were new in 2012, so there are no trend data.
33* 22* 23
17
0
25
50
75
100
Fruit/Fruit Juice Vegetables
Per
cen
t
*Statistical significance P<0.05: male compared to female
Source: Monroe County Adult Health Survey, 2012
Fruit/Fruit Juice and Vegetable Consumption Less than 1 Time/Day By Gender, Monroe County, 2012
Male Female
Monroe County Adult Health Survey Indicators Survey Years
Trend
MC City Sub
Obese 1997, 2000, 2006, 2012 ↑ ↑ ↑
Overweight 1997, 2000, 2006, 2012 NS NS NS
Obese or overweight 1997, 2000, 2006, 2012 ↑ ↑ ↑
Engaged in leisure-time physical activity in past month 2000,2006,2012 ↑ ↑ ↑
Health care provider talked with them about physical activity - past year 2000,2006,2012 ↑ ↑ ↑
Health care provider talked with them about eating habits - past year 2000,2006,2012 ↑ ↑ ↑
NS – no statistically significant trend, ↑statistically significant increase, - stable between 2006-2012 Source: AHS

32
Weight and Physical Activity Indicators Monroe County, 1997-2012, with Trendlines
Source: AHS
Health Care Provider Counseling – Physical Activity/Nutrition Monroe County, 2000-2012
Source: AHS

33
25* 13
23* 18 15
0
25
50
75
100
City Suburb African American Latino White
Per
cen
t
*Statistical significance P<0.05: city compared to suburb, African American compared to White
Source: Monroe County Adult Health Survey, 2012
Current Smokers By Residence, and Race/Latino Origin, Monroe County 2012
SMOKING
Current Smokers
Sixteen percent (16%) of Monroe County residents reported they currently smoke cigarettes, which is the
same as NYS in 2012 (16%).
Differences by sub-populations in Monroe County are shown in the graphic below.
Quit Attempts and Physician Counseling
Of current smokers, 51% reported they stopped smoking one or more days in the past year because they were
trying to quit. Eighty-two percent (82%) of current smokers who visited a health care provider for a check-up
in the past year reported that their provider advised them to quit smoking. Of all residents who visited a
health care provider for a routine check-up in the past year, 44% reported their provider talked with them
about whether or not they smoke cigarettes.
Trends in Smoking The proportion of residents who smoke declined in Monroe County and in the suburbs.
There was an increase in the percentage of residents who reported their health care provider talked with them
about smoking.
Monroe County Adult Health Survey Indicators Survey Years
Trend
MC City Sub
Current smoker- smoke daily or some days 1997, 2000, 2006, 2012 ↓ NS ↓
Daily smokers advised by their health care provider to quit smoking – past year 2000, 2006, 2012 ↑ NS NS
Health care provider talked with them about whether or not they smoke - past year 2000, 2006, 2012 ↑ ↑ ↑
NS – no statistically significant trend, ↑statistically significant increase, ↓statistically significant decrease Source: AHS

34
Smoking Indicators 1997-2012
Source: AHS

35
20*
4
9
32*
17 24*
11
0
25
50
75
100
Age 18-64 Age 65+ AfricanAmerican
Latino White Male Female
Per
cen
t
*Statistical significance P<0.05: age 18-64 compared to age 65+, Latino compared to White, male compared to female Source: Monroe County Adult Health Survey, 2012
Binge Drinkers By Residence, and Race/Latino Origin, Monroe County 2012
ALCOHOL AND MARIJUANA
Binge Drinking
Seventeen percent (17%) of Monroe County residents reported they engaged in binge drinking7 in the past
month, which is comparable to the rate in NYS in 2012.
In Monroe County, there were no differences in binge drinking by residence. There were differences by age,
Latino origin and gender as shown in the graphic below. The high rate among Latinos may be due in part to
the younger population distribution.
Marijuana Use
Eight percent (8%) of residents ages 18-64 reported they smoked marijuana in the past month. Males (13%)
were more likely than females (4%) to report smoking marijuana.
Trends in Alcohol Use
The only indicator that has trend data is related to whether or not a health care provider talked with them
about their alcohol use. This rate increased from 13% in 2000 to 28% in 2012.
7 Males had 5 or more drinks and females 4 or more drinks on one occasion
Monroe County Adult Health Survey Indicators Survey Years
Trend
MC City Sub
Health care provider talked with them about whether or not they drink alcohol- past year 2000,2006,2012 ↑ ↑ ↑
↑statistically significant Source: AHS