MONOCRYSTALLINE HIGH PURITY VANADIUM AT LOW - …
116
AN ABSTRACT OF THE THESIS OF Chun Tsin Wang for the Doctor of Philosophy (Name) (Degree) in METALLURGICAL ENGINEERING presented on /talus-I-1.0600 (Major) (bate) Title: DEFORMATION MECHANISM OF POLYCRYSTALLINE AND MONOCRYSTALLINE HIGH PURITY VANADIUM AT LOW TEMPERATURES --Redacted for Privacy Abstract approved: - - D. au4las W. Bainbridge High purity vanadium, both in the polycrystalline and monocrystalline form, was strained in tension in order to study the controlling deformation mechanism at temperatures between 77 and 293°K. The temperature and strain rate dependence of the flow stress for two grades of material, 99.99% and 99.93%, was evaluated using temp- erature change and strain rate change procedures. An abrupt change of yield and flow stresses, strain rate sensitivity, activation enthalpy and volume at approx- imately 200°K indicates that a change of rate controlling mechanism occurs at this temperature. It was found that at temperatures below 200°K, the activation enthalpy is less than 1 ev. and the activation volume is less than 30 b3. A high strain hardening rate
Transcript of MONOCRYSTALLINE HIGH PURITY VANADIUM AT LOW - …

AN ABSTRACT OF THE THESIS OF
Chun Tsin Wang for the Doctor of Philosophy(Name) (Degree)
in METALLURGICAL ENGINEERING presented on /talus-I-1.0600(Major) (bate)
Title: DEFORMATION MECHANISM OF POLYCRYSTALLINE AND
MONOCRYSTALLINE HIGH PURITY VANADIUM AT LOW
TEMPERATURES
--Redacted for PrivacyAbstract approved:- -D. au4las W. Bainbridge
High purity vanadium, both in the polycrystalline
and monocrystalline form, was strained in tension in
order to study the controlling deformation mechanism at
temperatures between 77 and 293°K. The temperature and
strain rate dependence of the flow stress for two grades
of material, 99.99% and 99.93%, was evaluated using temp-
erature change and strain rate change procedures.
An abrupt change of yield and flow stresses, strain
rate sensitivity, activation enthalpy and volume at approx-
imately 200°K indicates that a change of rate controlling
mechanism occurs at this temperature.
It was found that at temperatures below 200°K, the
activation enthalpy is less than 1 ev. and the activation
volume is less than 30 b3. A high strain hardening rate

in the early stages of straining and an orientation de-
pendence of flow stress were also noticed. Among all
possible controlling activation processes, the pseudo-
Peierls mechanism, i.e, the slightly dissociated screw
dislocation model, agrees best with the observations.
In the temperature range from 200 to 293°K, the
yield and flow stresses of vanadium were remarkably
affected by the level of impurity content. On the basis
of this observation, the controlling process in this
temperature range is most probably the interaction between
dislocations and impurities.
Mechanical twins were formed on single crystals at
77 and 120°K; twins occur on {2111 planes. Slip lines
could not in general be identified, but were noted in
one test. The slip plane determined on a single crystal
with <110> axis deformed at 160°K was f211} . Single
crystals generally showed a chisel edge type of ductile
fracture.

Deformation Mechanism of Polycrystalline andMonocrystalline High Purity Vanadium at
Low Temperatures
by
Chun Tsin Wang
A THESIS
submitted to
Oregon State University
in partial fulfillment ofthe requirements for the
degree of
Doctor of Philosophy
June 1971

APPROVED:
Redacted for PrivacyProfesscfof Metallurgical Enginokring
in charge of major
Redacted for PrivacyHeadAf Department of MetallurgicalEngineering
Redacted for Privacy
Dean of Graduate School
Date thesis is presented t3t /
Typed by Pat McCauley for Chun Tsin Wang

ACKNOWLEDGEMENTS
The author is very grateful to Dr. Douglas W.
Bainbridge, under whose guidance and constant discussion
this work was performed. He is also grateful to
Professors W.D. McMullen, J.A. McComb, R.D. 011eman
and O.G. Paasche for their helpful comments and
discussions.
The author wishes to thank Dr. T.A. Sullivan of
U.S. Bureau of Mines, Boulder City, Nevada, for kindly
donating the electrorefined vanadium and providing
a part of the chemical analysis of vanadium specimens.
Appreciation and hearty thanks are due Mr. Andy
Van Echo of U.S. Atomic Energy Commission, Head-
quarters, Germantown, Maryland, who showed enthusiasm
and encouragement and coordinated with this work so
that the zoning of single crystals could be performed
at the Oak Ridge National Laboratory. The same
appreciation and thanks are to Mr. P.L. Rittenhouse
and Dr. R.A. Reed of ORNL, who converted the vanadium
rods into single crystals by electron beam float zone
refining process using their excellant techniques and
equipment.
The research was partially supported by Teledyne
Wah Chang Corp., Albany, Oregon, to which the author
would like to express his appreciation. Special thanks
go to Messrs. S.W.H. Yih, S.A. Worcester, E.F. Baroch

and R.H. Nielsen. Among those who helped to work in
the present investigation, Messrs. M.B. Siddall,
M.M. Mills, J.V. Berry, R. D. Ayers, R.W. Griffin,
W.E. Anable, W.C. McBee, C.D. Dysle, P.E. Danielson,
J.L. Westling, J.I. Cosman and Mrs. M.J. Kappler and
P.E. McCauley are gratefully acknowledged.
The thesis is dedicated to the memory of the
author's parents, Teh Kwang and Cheng Wei-Y, and
grandmother, Tsung Lao, who taught and persistantly
encouraged him to strive for some academic achievement.

TABLE OF CONTENTS
Chapter Page
I. INTRODUCTION 1
II. THEORETICAL BACKGROUND 4
(A) Slip and twin systems in rcc metals 4(B) Yield Point Phenomena in BCC metals 7(C) The physical Origin of the Thermal
Component of the Shear Stress 10
III. PREVIOUS INVESTIGATIONS
IV. EXPERIMENTAL PROCEDURES
(A) Specimen Preparation(B) Tensile Testing Procedures
15
18
1827
V. EXPERIMENTAL RESULTS 35
(A) Determination of Youngs Modulus,Slip and Twinning Planes 35
(B) Yield, Necking, Twinning andFracture Phenomena 43
(C) Temperature Change and StrainRate Change Curves 47
(D) Temperature Dependence of the.Resolved Yield Stress, Flow Stress,Activation Enthalpy and ActivationVolume 54
VI. DISCUSSION OF RESULTS 65
(A) Slip and Twinning Systems 65
(B) Yield Phenomena 66(C) Rate Controlling Mechanism of
the Activation Process at LowTemperatures 67
(D) Comparison of Testing Materials 77(E) Suggestions for Future Invest-
igations 78
VII. CONCLUSIONS 80
BIBLIOGRAPHY 82

Chapter Page
APPENDIX
APPENDIX
APPENDIX III.
APPENDIX IV.
GROWING SINGLE CRYSTALSBY ELECTRON BEAM FLOATZONE REFINING
CALCULATION OF YOUNGSMODULI FOR SINGLE CRYSTALS
CALCULATION OF SHEAR STRESSAND STRAIN
89
92
95
RAW DATA AND CALCULATIONS 98

LIST OF TABLES
Table Page
1 Slip planes observed in BCC metals 6
2 Chemical and hardness data of vanadiumused in the present and previous invest-igations 26
I-1 Melting records of electron beam floatzone refining of vanadium 91
IV-1 Calculation of activation volume 102
LIST OF FIGURES
Figure Page
1 Schematic diagram of the force-distancerelationship for yielding or flow inBCC metals (Conrad, 1964).
2 Electropolish apparatus, including apolyethylene tank a motor driven stain-less steel wheel, another motor for ro-tating the specimen and a positioningdevice which can travel vertically andhorizontally
3 Back reflection Laue pattern of vanadiumsingle crystals
(a) (100) plane of a perfect crystalwith <110> axis
(b) (111) plane of an imperfect crystalwith <110> axis
13
21
23
4 Microphotographs of a 99.99% vanadium singlecrystal showing subgrain boundaries formedby dislocations (a) 150x; (b) 750x 24
5 Vanadium single crystal tensile specimensand grips. (a) Some single crystal tensile 29
specimens and grips.(b) Tensile specimen held by
grips.
6 Tensile grips and coolant container setmounted on the Instron Machine. 30
7 Typical chisel edge fracture crystalC-1, deformed at 77?K. Initial axis ofspecimen was <110>
(a) Top view, 30X,(b') Side view, 30X
8 Single crystal F-4, deformed at 160°K.Initial axis of specimen was <110>.
(a) View in <001> direction, 30x.(b) View in <110> direction, 30x.
9 Electron microscopic view of singlecrystal F-4, double replica. Axis ofspecimen was <110>.
(a) View in <100> direction, 21,000X(b) View in <110> direction, 21,000X
37
39
40

Figure Page
10 E-6 crystal with <211> axis deformed at 4277°K. Heavy markings are twins.(a) View at one end of the chisel edge.(b) View at 90° from the developing
chisel edge, showing slightnecking in this dimension
11 Longitudinal cross section view ofcrystal E-6 deformed at 77°K, coldmounted polished, and etched, showingdistinct twin markings. Initial axisof specimen was <211>.
12 Typical room temperature yield curvesof vanadium. <110> or <211> designatestensile axis of specimen.
13 Typical yield and necking phenomenaof vanadium. <110> designates tensileaxis of specimen.
14 Typical temperature change curves ofvanadium between 293 and 77°. <110>designates tensile axis of specimen
15 Typical temperature change curves ofvanadium, between 293 and 120°K. <110>or <211> designates tensile axis ofspecimen.
16 Typical temperature change curves ofvanadium between 293 and 200°K. <110>designates tensile axis of specimen.
17 Typical strain rate change curves ofvanadium. <110> or <211> designatestensile axis of specimen.
18 Resolved yield stress of vanadium Versustemperature. <110> or <211> designatestensiles axis of specimen.
19 Resolved flow stress of vanadium versustemperature. <110> or <211> designatestensile axis of specimen.
44
45
46
48
49
50
53
55
56

Figure Page
20 The strain rate sensitivity ofvanadium versus temperature.<110> or <211> designates tensileaxis of specimen.
21 Activation enthalpy of vanadium versustemperature <110> or <211>designatestensile axis of specimen.
22 Activation volume of vanadium versustemperature. <110> or <211> designatestensile axis of specimen
58
60
62
23 Activation volume versus effective shearstress of vanadium. <110> or <211> desig-nates tensile axis of specimen. 63
24 Theoretical stress versus temperatureplot for BCC metals at low temperatures. 73
25 Comparison of activation enthalpy withtheoretical energy to overcome Peierlsstress. <110> or <211> designatestensile axis of specimen. 75

THE DEFORMATION MECHANISM OF POLYCRYSTALLINEAND MONOCRYSTALLINE HIGH PURITY VANADIUM
AT LOW TEMPERATURES
I. INTRODUCTION
Vanadium, with an atomic number of 23 and a density
of 6.1 gm per cm3, belongs to Group V-A transition metals
and possesses a body centered cubic crystalline structure.
It has been well known as an alloying element for steel
since 1896 (Tietz and Wilson, 1965), and widely used in
aluminum and titanium industries in recent years. How-
ever, investigations relative to the deformation of
vanadium have been scarce as compared to other BCC tran-
sition metals, e.g., niobium and tantalum of Group V-A,
chromium, molybdenum and tungsten of Group VI-A and iron
of Group VIII. This is probably, at least partially,
attributed to the difficulties in obtaining the metal
in a high purity form.
Vanadium has been commercially produced by alumino-
thermic or calcium reduction, which yielded the metal
of the purity of from 80% to 95% and up to 99.8% respect-
ively (Rostoker, 1958; Tietz and Wilson, 1965). The
first successful attempt to produce ductile vanadium was
reported by Van Arkel who used the iodide decomposition
process and the product purity was approximately 99.9%
(Carlson and Owen, 1961).
Recent findings that vanadium base alloys might be
prospective fuel cladding materials for the next generation,

2
liquid metal cooled brecAr reactors (Yaggee, Gilbert
and Styles, 1969) have :!-_urreca Lnterest in high purity
vanadium preparations. :,loci:olytic refining process
was then developed by Sullivan (1c;:65) and the purity of
the product ranged from 99.9% to 99.99%. Carlson, Schmidt
and Krupp (1966) combined the processes of aluminothermic
reduction under inert atmosphere, high temperature sinter-
ing and electron-beam melting and were able to produce a
product of greater than 99.9% purity. Wang et al. (1970)
modified the process and scaled up the production with a
final product of 99.93% purity.
The body-centered cubic transition metals have
broadly similar deformation characteristics, although
there are differences in some respects. It is relatively
easy to purify the Group V-A metals, vanadium, niobium
and tantalum to ensure ductile behavior at low temperatures,
but very difficult to do this with the Group VI-A metals
chromium, molybdenum and tungsten. This difference seems
to arise from the equilibrium solubilities of usual inter-
stitial solutes, which are high for Group V metals and
very low for Group VI metals, but it may also be related
to the dislocation dynamics. An important factor in main-
taining ductility when the yield stress bec-mes high is
the dbility to blunt d crack by local plastic deformation,
and this depends on dislccdidon mobilities end dislocation
multiPlication rates. A further d'Lffer;.:nce bct \veen the

3
Group V and Group VI metals is that the former have a
low work-hardening rate, while the latter work harden
more readily at low temperatures. The characteristics
of iron seem to be intermediate between the two groups.
The general deformation characteristics common to
all BCC transition metals are as follows: (1) indis-
tinctive and controversial slip systems; (2) twinning
at very low temperatures; (3) strong temperature depen-
dence of the yield and flow stresses at sub-ambient
temperatures and the probability that this is due to a
common deformation mechanism.
The aim of the present work is to investigate the
deformation characteristics mentioned above by using
high purity vanadium and the emphasis will be placed
on the origin of the deformation mechanism in the low
temperature range. Two grades of polycrystalline
material and two orientations of single crystals were
used in order to study the effect of impurities and
orientation on the mechanism.

4
II. TEEGRETICAL i':>ACKCROUND
(A) Slip and Sysleft,s in BCC Metals
In most metals the Tlanee. fl-) which slip takes place
are usually those with quite dense atomic packing and
the slip direction is almost always the most closely
packed direction in the plane. In the hexagonal close-
packed structure the basal plane f00011 is the closest-
packed plane, which is the common slip plane in cadmium,
magnesium and zinc. However, slip on prismatic plane
r101 03 has also been observed frequently in HCP metals
(Honeycombe, 1968) .
The face-centered cubic metals, e.g., aluminum, copper,
gold, nickel, and silver, deform orimarily on the close-
packed octahedral 1-1111 planes in the <110> close-packed
directions. Except for aluminum at high temperatures, it
is rare to find a slip plane other than one of the octa-
hedral planes (Honeycombe, 1968).
The-body-centered cubic metals present a somewhat
more complicated and controversial picture. Although, in
general, they all slip in the closest-packed <111> direction,
the choice of slip .plane varies greatly. The planes with
the 'common zone axis <111> are, in order of density, with
which the atoms are packed, f110', , {112} and 1123)
planes. In fact, all these planes and the maximum resolved
shear stress plane have been repoy:ted to he operative slip

5
planes for iron, nicbi=1, tantalum, molybdenum and tungsten
(Table 1) . Recent inresigations in niobium (Foxall,
Duesbery and Hirsch, 196 7) refe-Dled that the slip system
is dependent upon orientation but the Schmid Law is not
obeyed. Due to the dissociation of a <ill> type screw
dislocation on (112) planes, there are hard and soft
directions for which different resolved shear stresses
are required for the slip system to be operative.
Twinning, which involves a small but well defined
volume within the crystal, is accompanied by energy release
in the form of sound, e.g., the cry of tin. The twinned
region is often bounded by parallel crystalline planes,
called twin habit planes or twinning planes.
While twinning is 1,ot a cloilii-ant mode of deformation
in metals which possess many possible slip systems, e.g.,
FCC metals, it is very significant in metals where the
possible slip systems are severely limited, e.g., the
HCP metals.
Mechanical twins form more readily in BCC metals as
the rate of deformation is increased; the tendency to twin
increases with decreasing temperatures and increasing
purity of the metal (McHargue, 1962).
Twins have been found in iron (Kelly, 1953), molyb-
denum, tungsten (Schaller, 1960), chromium, niobium
(McHargue, 1962) and tantalum (Barrett and Bakish, 1958).

6
TP,a1,E 1
SLIP PLANES OBSERVED IN METALS
METAL f110 (2111 (321Y Yin. TEMP. REFERENCE(°K)
Fe x 293 Taylor and Elam(1926)
Fe x 293 Jaoul and Gonza-lez (1961)
Fe x (x) x 293 Barett Ansel andMehl (1937)
Fe x x 293 Stein and Gorsuch(1961)
Nb x x 293 Taylor (1965)Nb x x 293 Duesbery and Foxall
(1965) (high purity)Nb x x x 293 Duesbery and Foxall
(1965) (low purity)Nb x x (x) (x) 293, Bowen,Christian
x x (x) (x) 158 and Taylor (1967)Ta x x 293 Mordike (1961)Ta x >77 Mitchell and
Spitzig (1965)Mo x 293; Tsien and Chow
x 573 (1937)Mo x x x 293 Maddin and Chen
(1954)Mo x x x x 293 Hoke and Maddin
(1956)W x x <293 Garlick and
Probst (1964)W x x 293 Kaun et al. ().965)W x 77, Schadler (1960)
x 20V x 77, Greiner and
x 298 Boulin (1967)V x 77, Mitchell, Fields
x 500 and Smialek (1970)
The plane of maximum resolved shear stress; it is usually
a non-crystallographic plane.

7
The twinning planes. ir most cas?s,[112) and the shear
displacement, 1/2a <111>, which is unidirectional. To
produce a twinned c):Ift:al the ouaration must be carried
out on each successive (112) plane to produce the stacking
sequence ABCDEFEDCBA; the shear strain produced is 0.707.
Due to the fact that a large shear strain is associated
with twinning in BCC metals, and a large amount of energy
is required to nucleate twins, they are usually long and
thin, rarely thicker than 5 x 10⁻⁴cm (Honeycombe, 1968).
(B) Yield Point Phenomena in BCC Metals
It has been generally accepted that the presence of
interstitial atoms or precipitates has a large effect on
the yield phenomena in BCC metals. This is mainly caused
by the interaction of the strain fields associated with
dislocations and nearby impurity atoms (Cottrell and
Bilby, 1949). If this interaction reduces the total free
energy of the crystal then the stress required to move
the dislocation is increased. After unlocking, and
tearing dislocations from their pinning points, the stress
drops sharply from the upper yield point to the lower
yield point, where the yield elongation occurs and a Liiders
band runs through the material at roughly constant stress.
However, recent investigations seem to show that the temp-
erature dependence of the yield point is not due to pinning
but is caused by a strong frictional stress acting on
unpinned dislocations.

8
For example, th ffect ct grain size, with diameter
d, on the lower yield F..t,:ess, (3.d is experimentally found
when`:to be 0": 4 whe.rr,-cL has interpreted as a
frictional stress acting on fre_e dislocations and k is
proportional to the ress to unlock dislocations (Cotrell,
1958). Heslop and Petch (1956) have shown that in d-iron
the frictional stress ez is strongly temperature dependent.
It has been also shown that if this interpretation of the
grain size effect on the yield stress is correct, then
the locking stress in of -iron is practically temperature
independent at temperatures between 110°K and 300°K.
Therefore, in this temperature range the temperature depen-
dence of yield stress is almost exclusively due to the
frictional stress. Furthermore, it has been shown that
the temperature dependence of the flow stress is the same
as that of the yield stress and that the thermal component
of the flow stress is independent of strain (Conrad and
Schoeck, 1960). The flow stress cannot be governed by
an unlocking mechanism at ambient and lower temperatures
where the pinning points are essentially stationary.
These difficulties direct attention to an alternative
view developed by Gilman and Johnston (1957). Their
studies show that LiF crystals exhibit a prominent yield
drop. Yet they find no evidence of unlocking. Grown in
dislocations remain locked. Dislocations responsible for

9
slip are heterogenecly nucl-,;ltd and multiply rapidly.
Johnston and Gilman (1Y59) account for the yield point drop
quantitatively simply in terms of the rapid multipli-
cation of dislocations and the stcss dependence of
dislocation velocity.
One mechanism which could produce large numbers of
dislocations and would he in accord with observations on
silicon-iron is the double cross-slip mechanism (Low and
Guard, 1959) originally proposed by Koehler (1952).
The overall picture of yielding may be explained as
follows: During the initial loading of the specimen,
some dislocations are torn from their Cottrell atmosphere
at regions of stress concentrations. As the stress is
increased their mobility increases and some multiplication
occurs by the double cross slip ifiechanism. This gives
the preyield microstrain. At a critical stress, first
reached near the specimen grips and representing the
upper yield stress, suddenand profuse multiplication occurs
giving a Laders band. At the lower yield stress this
multiplication continues at the stress concentration
existing at the band front. Once the L&Iers band has
traversed the length of the specimen, the number of dis-
locations contributing to the deformation remains essen-
tially constant. However, the total density continues
to increase because some dislocations are becoming stuck
or entangled giving strain hardening. (Conrad, 1961).

10
(C) The Phys- r:ricrin of the Thermal ComnInent
of the SI d trer 9
The yield or shar .stic,ss of mechanical defor-
mation consists of Lwo 1;rts: :11 athermal component *T-1:
which is the result () long range internal stress field
for a given structure and is proportional to the shear modulus;
and a thermal component-r*which depends sensitively on temp-
erature and strain rate.
To determine the physical origin of the thermal
component of the shear stress, it is generally necessary
to treat the problem as a thermally activated process.
Assuming that a single activation process is rate con-
trolling, the shear strain rate will be given by the
expression,
NA b P( 1 )
where N is the density of points of activation per cm3;
A is the area swept by the dislocation in one activated
jump; b is the Burger's vector; and V is the frequency of
activation which is related to the atomic frequency 1)0
as follows:
== -v? 10-( 2 )
where b1/4/ is the free energy of activation, k, Boitzmann's
constant and T, the .absolute tempera t.ure (Christian and .
Masters, 1964). The activation-energy is therefore,
T iv---4-7iT ( 3 )

11
Assume C AfA b and 45 is the activation entropy and
both terms are independent of stress and temperature.
Suppose the enthalpy of activation,AW is a function of
temperature and the thermal component of the shear stress.
We have,
4H =----.4H(7-)r**)( 4 )
Differentiating Equation (3) with respect to temp-
erature gives
)7; a7.44((5)
Therefore,
T T r (6)
Differentiating Eq. (3) with respect to inS gives
L°g...., ii).44') J12:::) _....47-.
( .;//2-') 0-r*-IT .9-67:- lr7- dSubstituting .--( -2-4-) obtained from Eq. (7) into Eq. (6),
. 4-1- br
( 7 )
we obtain--r*)
zq (4-4"*
nT TSince in general
( 8 )
( _-2Nar r*it follows from Eq. (8), (Conrad and Wiedersich, 1960),
that
( 9 )
12
Using the similay between the thermodynamical
pressure and the thermal component of shear stress, we
have the activation volume
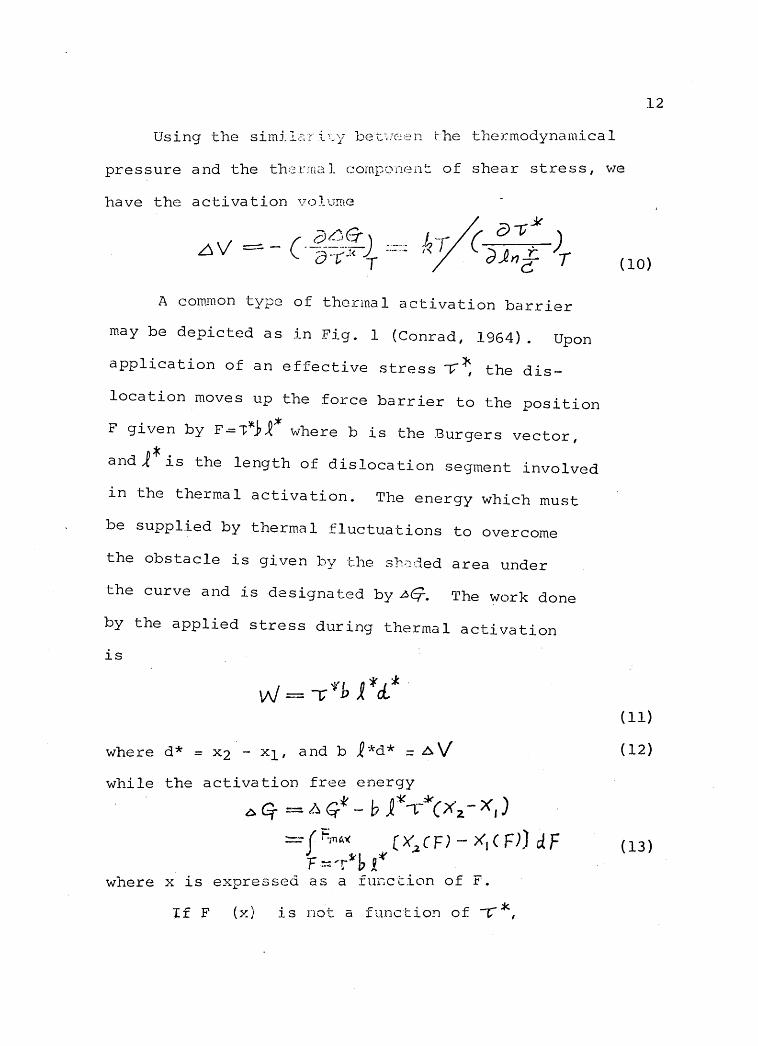
A common type of thermal activation barrier
may be depicted as in Fig. 1 (Conrad, 1964). Upon
application of an effective stress 174; the dis-
location moves up the force barrier to the position
F given by F-=T*Sfic where b is the Burgers vector,
and /4( is the length of dislocation segment involved
in the thermal activation. The energy which must
be supplied by thermal fluctuations to overcome
the obstacle is given by the shaded area under
the curve and is designated by 2sq-. The work done
by the applied stress during thermal activation
is
where d* = x2 - xi, and b Pd* =
while the activation free energy
A A CT4'i ir-LAx2-x,)f-0-100(
(12)
(x;cF)-xi(F)1dF (13)
where x is expressed as a function of F.
If F (x) is not a function of -V4`,

FA
FMCIX
F er*b I*
13
Fig. 1: Schematic diagram of the force-distancerelationship for yielding or flow inBCC metals (Conrad, 1964) .

14
differentiation of Eq. (13) wiLh -L'espect to l'icgives
?(2 ) (14)
From Eq. (10) and Eq. (14) we obtain
/ T= Tza.
/-(15)
The activation energy or enthalpy and activation
volume evaluated from the experimental data will generally
differ for different deformation mechanisms.
The deformation mechanism is generally different in
different temperature regions for a specific metal according
to its crystalline structure. There are essentially
three major temperature regions for each metal: (a) High
temperatures, approximate 0.5Tm < T < Tm, where Tm
designates the melting point temperature. (b) Intermediate
temperatures, approximate 0.25Tm < T < approximate 0.5Tm.
(c) Low temperatuees, T < approximate 0.25Tm.
At high temperatures the rate controlling mechanism
for BCC metals is most likely the climb of dislocations;
at intermediate temperatures the interaction of dislocations
with impurities. At low temperatures the problem is
more controversial and the suggested rate-controlling
mechanisms are nonconservative motion of jogs in screw
dislocdtions, the ove7_comi11,3 of inLel-LiLidl aLoms or
precipitates, the cross slip of screw dislocations and
the overcoming of the Pcierls stress (Conrad, 1964).

15
III. PREVIOUS INVESTIGATIONS
Pugh (1957) has studied the temperature dependence
of the tensile properties of vanadium in the temperature
range from 78 to 1300°K but the strain hardening exponent,
m, and the strain rate sensitivity, n, have been evaluated
only between 500 and 1300°K. A commercially pure calcium-
reduced vanadium was used by Clough and Pavlovic (1960)
to study the tensile properties and fracture and twinning
at temperatures between 77 and 573°K. They found a five-
fold increase in yield strength, a threefold increase in
tensile strength and a ductile to brittle transition in
this temperature range. Both the [100) and the (1101
were identified as active cleavage planes and mechanical
twins were formed on f 1121 planes by impact loading at
temperatures of 195°K and lower.
Using commercially pure polycrystalline vanadium,
Lindley and Smallman (1963) evaluated the effects of grain
size and strain rate on the yield stress and flow stress
between 20 and 293°K. At and above 77°K, the vanadium
deformed solely or predominantly by slip, while at
20°K, deformation was associated with twinning. Single
crystals of vanadium have been deformed in compression at
77°K by Edington and Smallman (1965) who found that twin
systems were (121) (ill) and (211) (ill).

16
The dislocation configuration and density produced
by plastic deformation of vanadium in the temperature
range 77 to 673°K have been investigated by Edington and
Smallman (1964). In material of constant grain size, the
dislocation density N is proportional to the strain E , and
5' is proportional to the flow stress-rover the whole
temperature range.
Using available data in previous literature, Conrad
and Hayes (1963) have included polycrystalline vanadium in
their work on thermally activated deformation of the BCC
metals at low temperatures. They found that the activation
volume was approximately 50b3 when the effective shear
stress was approximately 2 kg per sq mm and that this
volume decreased to 2 to 5 b3 at high stresses for all
BCC metals.
Christian and Masters (1964), in their extensive
studies of low temperature deformation of BCC metals, have
generated some data on activation energy and volume for
polycrystalline vanadium but stated that difficulties were
encountered in deforming vanadium single crystals. Because
of the low work hardening and high yield stress, vanadium
specimens tended to neck down immediately after yielding
at very low temperatures. No data for the change of flow
stress with strain rate and temperature have thus been
obtained for single crystals at low temperatures. They

17
also mentioned that a dependence of Cels) on purity was
found for vanadium, and this still persisted at 90°K ,
but results for impure vanadium could not be obtained at
low temperatures due to brittleness of the material.
Consequently, a systematic investigation of (2se).for
vanadium of two purities has not been made. They used
arguments based on the high value of the effective shear
stress and its high strain rate sensitivity to conclude
that most of the low temperature stress is probably due
to a lattice interaction of Peierls-Nabarro force. Further-
more, they stated that it seems improbable that the total
impurity level is sufficient to produce the very high
stresses at low temperatures. It is of special interest
to obtain flow stress measurements on very pure metals
in the very low temperature region and these experiments
should provide a final answer to this question.
Mitchell, Fields and Smialek (1970) obtained some
preliminary results on yield stresses and work hardening
characteristics as a function of purity for vanadium
single crystals deformed in tension. They used two grades
of materials, 99.8% and 99.98% respectively and stresses
were resolved onto the (011) <111> system which was the
identified slip system for the particular easy glide
orientation used in their work.

18
IV. EXPERIMENTAL PROCEDURES
A. Specimen Preparation
Two grades of high purity vanadium were used in the
present work. They are: (a) 99.99% purity produced by
Sullivan's (1965) process and supplied by U.S. Bureau of
Mines, Boulder City Metallurgical Laboratory, Boulder City,
Nevada; (b) 99.93% purity produced by the process developed
by Wang et.al. (1970) and supplied by Teledyne Wah Chang
Corporation, Albany, Oregon.
The 99.99% purity vanadium received was of dendritic
form (Sullivan, 1965) which was then electron beam melted
into a 3 in. diameter ingot. After a slight scalping,
the ingot was forged and swaged at room temperatures to
1/4 inch diameter rods. This material was partly used
for polycrystalline specimens and partly for mono-
crystalline specimens. In the former case, the rod was
machined into tensile specimens with the gauge dimension
of 0.140 in. dia. x 0.500 in length; both ends beyond
the gauge were of 0.225 in. dia. x 0.200 in. length
respectively. Machined specimens were then annealed in
a vacuum furnace at 870°C (1600°F) for one hour for re-
crystalization. The average grain size was 30 grains per
2mm.

19
The 99.99% purity usE:d for monocrystalline
specimens was grown inLo single crystals with predeter-
mined orientation by electron ::?_am floating zone technique
at Oak Ridge National L.-horatory, Oak Ridge, Tennessee.
(Appendix I), two passes c,,,re used in each case. The
first pass was ordinarily carried out in a vacuum of
10-7 to 10-8 torr range while the second pass was in the
10-9 to 10-10 torr range. By the seeding technique, two
particular orientations, Lee, <110> and <112>, of mono-
crystalline rods, each 0.225 in. diameter by 7 in. length,
were obtained. The <110> orientation was chosen because
the plastic flow stress is essentially independent of
past history. That is to say, the flow stress is essen-
tially constant after yielding in specimens with this
orientation (Rose, Ferriss and Wulff, 1962). It was
hoped that the differential flow stress due to change of
temperature or strain rate would be little affected at
different stages of straining. The orientation, <112>
axis, with less symmetry in relation to slip systems, was
chosen for comparison, expecting that the orientation
dependence of flow stress (Rose, Ferriss and Wulff,
1962; Bowen, Christian and Taylor, 1967) could be
examined.
it A -7/nwore CQWC...4 111%-%.1 I/0 incn.-"_
lengths using diamond impregnated copper abrasive

20
cutting wheel. During s(iwing, t11-- rod was held in position
by solidified resin in order Lo Lactd any macrostrain.
To prepare the gauge section, 0.40 in. dia. x 0.500
in. length, an electropplIshing apl;:aratus (Fig. 2 ) was
employed. The principle for construction was similar to
that of Avery, Ebner and Backofen (1958). A stainless
steel wheel, dipped into an aqueous solution of 15%
oxalic acid by weight, was used as the cathode. The
wheel was driven by a motor rotated at approximately 8 rpm.
The specimen, held directly by the chuck of the drill
motor, was rotating in the reverse direction at approx-
imately 2 rpm. With a total current of 0.5 amp. running
from the specimen to the wheel and then to the bath, the
voltage drop between t-L2 si)ccilc,:,n and the wheel was 2
volts and that between the latter and the bath was 4
volts. A shunt circuit was connected between the power
source and the wheel, and there was more current flowing
through it than between the specimen and the wheel, so that
the possible metal accumulation on the wheel face was
eliminated. Because of the continuous film of elec-
trolyte maintained between the specimen and the wheel, the
danger of sparking was reduced. The total operating time
for completing one specimen was about two hours. The
tolerance of the gauge so polished was plus and minus 0.002
in. diameter. At least two back reflection Laue diffraction

21
Figure 2
Electropolish Apparatus, including a polyethylenetank, a motor driven stainless steel wheel anothermotor for rotating the specimen and a positioningdevice which can travel vertically and hori-zontally.

22
patterns were taken at gauge section of each specimen
in order to evaluate perfection and orientation of
the crystal. The fir'3t cne 2.-:posed at a marked
position with the tensile axis perpendicular to the x-ray
beam and the second one was, performed after the specimen
was rotated 90 degrees from the original position using
the tensile axis as rotating axis. The accuracy of
orientation of the tensile axis of the specimens, both
for <110> and <112> crystals, was well within 2 degrees.
No imperfection or distortion was noticed except that a
portion of the <110> rod, designated C, which was reported
to have fluctuation of power during zoning, showed
distinctive subgrain boundaries with approximately 2
degrees of misorientation. These specimens were rejected
for tensile testing. The back reflection photographs
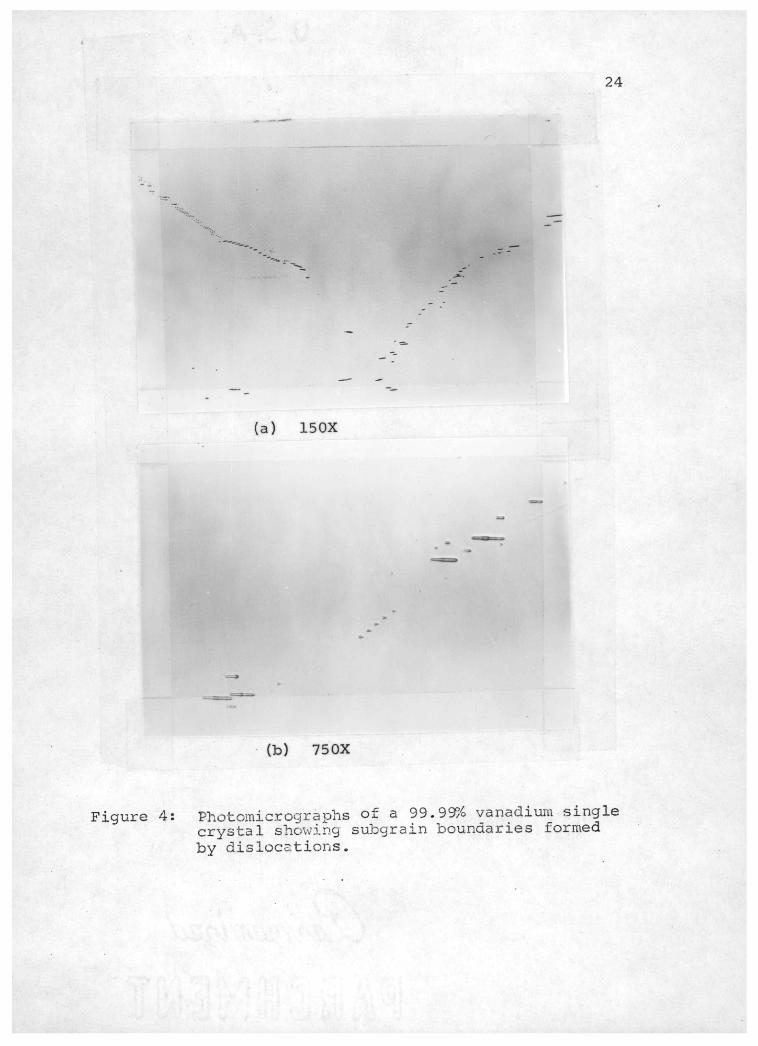
of perfect and imperfect crystals are shown in Fig. 3;
the photomicrographs of a normal single crystal are shown
in Fig. 4. It is apparent in the latter figure, that dis-
locations are lined up to form a small-angle subgrain-
boundary.
In order to improve the surface finish of monocrys-
talline specimens, they were then polished in a Buehler
1721-2 electropolif,hing cell. The specimen was surrounded
by a cylindrical stainless steel cathode, immersed in
aqueous electrolyte containing 10% sulfuric acid. The
electrolyte was constantly agitated during polishing and
the voltage and current maintained at 2 volts and 0.2 amperes

23
(100) Plane of a perfect crystal with<110> axis
(b) (111) Plane of an imperfect crystal with<110> axis
Figure 3: Back reflection laue pattern of vanadium singlecrystals.
(a) 150X
(b) 750X
%=1=111
.
24
Figure 4: Pho tomicrographs of a 99.9V) vanadium singlecrystal showing subgrain boundaries formed
by dislocations.
25
respectively. The tim:? for L1):;s final polishing was
approximately 10 seconds.
The 99.93% purity vanadium received was of rod
form with a diameter of 1/4 in. which was previously
forged, rod rolled and then swaged from a 9 in. diameter
electron beam melted ingot. The rods were machined into
tensile specimens the same as that mentioned for 99.99%
purity polycrystalline specimens. They were then
annealed in a vacuum furnace at 1090°C (2000°F) for
one hour for full recrystalization. The average grain
size obtained was 100 grains per mm2.
Chemical data for the materials used in the present
work are compared with those used for previous deforma-
tion investigations in Table 2. It is to be noted
that high purity vanadium is sensitive to interstitial
pick-up during handling, e.g., electron beam melting
or vacuum annealing under ordinary vacuum atmosphere,
10-4 torr. The nominal 99.99% polycrstalline material
was actually at the level of 99.98%. Single crystals
were of the highest purity among all materials used in
the present work. Analyses applied only to the starting
material such as 99.(_'8% vanadium indicated by Mitchell,
Fields and Smialek (1970) might be misleading.
These authors used two grades of vanadium and
studied the resolved yield stress as a function of
temperature from 77'K to 400°K Typical shear stress-

26
TABLE 2
Chemical and Har6ness Data of Vanadium Used inThe Present aril Prvious Investigations
Reference
Present
Pugh(1957)Clough andPavlovic (1960)Lindley andSmallman (1963)Conrad andHayes(1963)Christian andMasters (1964)Edington andSmallman(1965)Greimer andBoulin (1967)Mitchell, Fields,and Smialek(1970)
Purity Form Hardness ImpuritiesDPH Plm.(6)
C H N 0
99.99 Dend 12 43 2 18rites (1)
99.99 P.C. (2) 54 43 3 80 13099.99 S.C. (3) 43 7 8 35 5999.93 P.C. (4) 60 150 3 73 183
P.C. 900 4 700 570
99.9899.8
P.C.
S.C.
P.C.
360 40 830 700
170 <5 80 1700
470 43 520 700
P.C. (5) 115 (Not Indicated) 120
S.C.
S.C.
S.C.S.C.
100 700 300
300 200 300
20 <10 <10 70250 <5 184 368
Remarks: (1) Dendrites: Electrorefined before consolida-tion. Other impurites analyzed are:Al, 7ppm: Cu,<5; Mg,2; Mn,4: Ni,<4; Si,15.
(2) 99.99% P.C.: Polycrystals.(3) 99.99% S.C.: Single Crystals(4) 99.93% P.C.: Polycrystals. Other major
impurites: A1,92ppm; Si,188; Mg,35; Fe,<50.(5) Other major impurities: A1,60ppm; Fe,500;
Si,200; 17,1000.(6) ppm: parts per million by weight
27
shear strain curves at Lempr,ratuccs between 273 and 500°K
for vanadium single crstals we,: also investigated.
Materials used for delurmation tests by other invest-
igators all contained significant amounts of impurities.
Christian and Masters (1964) in their extensive work on
BCC metals including polycrystalline vanadium, did not
indicate the exact chemical analyses of carbon, hydrogen
nor nitrogen but mentioned that the microhardness was
115 DPH. According to the correlation between the hard-
ness and interstitial elements demonstrated by Bradford
and Carlson (1962) and Thompson and Carlson (1965), the
total interstitials should have been somewhere between
500 and 1000 ppm. However, with addition of 1000 ppm
of yttrium, (Table 2), an effective gettering agent, the
behavior of deformation of this material should be similar
to the 99.93% purity polycrystais used in the present work.
Because of the grain refining effect of yttrium, the grain
size of their polycrystalline specimens was 5000 grains
per mm2, although this was partly attributed to a lower
temperature, 1000°C, employed for recrystalization
annealing. Their data will be used for comparison in
later sections.
(B) Tensile Testing Procedures
The machined or elt,uLfopolished specimen was held
by a split-type holder which, in turn, was threaded in

28
a cap-nut. Some si_o,jle crystal specimens and the holder
set, which is made of stinless sF:eel, are shown in
Fig. 5. The holder s'st ccnnF-cted with a 1/4 in.
diameter pin to a grip brtr which, in turn, was mounted
on a floor model TT Instron Tensile Machine through a
ball joint. A stainless steel coolant container, 4 in.
diameter x 1/16 in. wall x 6 in. tall, was welded on
the lower grip bar so that the specimen and the holder
set would be well immersed in the coolant while it
was filled in the container. For intermediate temp-
erature tests, when liquid nitrogen and other liquid
coolants were used, three small cups, 1 in dia, x
1/16 in. wall x 7 in. tall, were placed inside the
container. The coolant contairrlr-and-cup set mounted
on the Instron Machine are shown in Fig. 6. The whole
coolant container set was encased inside a Styroform
case packed with glass wool between the former and the
latter so that the Styroform case would be held in
position by friction. The lid of the Styroform case
consisted of two halves, so that they could be removed
from the top of the case during filling.
There were holes at the bottom of the case for
the lower grip rod and drainage hoses to pass through.
Six temperatures were used for testing as follows:
(a) 77°K, liquid nitrogen boiling point; (b) 120°K,

29
111:1511
iiii 0!!
(a) Some single crystal tensile specimensand grips
(b) Tensile specimen held by grips
Figure 5. Vanadium single crystal tensile specimen and
grips.

Figure 6
Tensile grips and coolant containerset mounted on the Instron Machine.

31
freezing point of (c) 150°K, freezing point
of methyl alcohol; (d) 200°K, constant temperature
liquid methyl alcohol. cooled by liquid nitrogen; (3)
233°K, same as abov-; (f) 293°K, constant temperature
water in essential equilibrium with the atmosphere in the
laboratory which was air conditioned and maintained at
293°K.
A copper vs constantan thermocouple in contact
with the gauge section of the specimen was connected
to a potentiometer to measure the testing temperature.
The liquid coolant was constantly stirred and the exact
temperature was equilibrated for approximately 10 min.
before testing. The variation of temperature during tests
was within plus and minus 2°K.
Some polycrystalline material was machined into speci-
mens with a 1 in. reduced section, on which knife edges
positioned 1/2 in. apart were clamped and connected with
an extensometer to evaluate the Youngs Modulus at 293°K
and 77°K
Other tests for determination of slip planes and
twinning planes were performed at constant temperature
and constant strain rates for a total plastic strain of
few percent. The crystallographic aspects of the slip
and twinning planes were determined from the orientation
of traces of the planes on the crystal surface.

32
The technique that described by
Barrett (1966) and illusL ate l. by Schadler (1960).
Since both the direcLion and the shear dis-
placement for twinning have been well established for
BCC metals to be <111> (Honeycombe, 1968), no attempts
were made to determine the slip direction.
Two major types of experiment were carried out:
temperature change and strain-rate change. For the
temperature change experiments, 293°K was used as a
reference temperature and the specimen was deformed alter-
nately at 293°K and a second temperature. During the
temperature change the load was relaxed to about 80%
of the higher temperature flow stress in order to
prevent recovery due to the strain annealing effect.
The time for changing from one temperature to a second
one ranged from 15 minutes to 1 hour, depending upon
coolant manipulation problems. The strain rate was
-1maintained constant at approximately 6.67 x 10⁻⁵ sec.
In order to prevent necking down immediately after
yielding and to decrease the probability for twinning
at low temperatures, the specimen was prestrained at

33
293°K to about 4% elongation before changing to a
lower temperature (Christian and Masters, 1964). Then
the temperature was changed after each 2% elongation
until a total elongation of about 20% was reached.
Straining beyond this point usually resulted in necking
down and no homogeneous deformation could be obtained.
For the strain-rate change experiments, specimens
were prestrained at 293°K to about 2% of elongation for
the same reason as mentioned above for the temperature
change tests. The temperature was then changed to the
desired value and the specimen deformed at a strain rate
of approximate 6.67 x 10⁻⁵ sec.-1; the strain rate was
changed to 6.67 x 10⁻⁴ sec.-1, by simply flipping the
switch on the Instron Machine after each additional
elongation at the temperature. It should be noted that
the strain rate mentioned in the present paper is actu-
ally a calculated value based on the displacement of
the cross head of the tensile machine and the gauge
length of the specimen. When the moving speed of the
crc...shead changed from a low value to a high one,
which is 10 times greater, while the moving speed of
the recording chart maintained the same, the magni-
fication of the elongation on the chart was then 10
times smaller. In order to have a readable

34
curve on the chart, approximately 2% elongation of
strain was necessary at the higher strain rate, but,
only about 0.2% elongation of strain was needed at
the lower strain rate. Therefore, the tests were per-
formed at the higher strain rate for 2% elongation and,
then, at the lower rate for 0.2% elongation. The changing
of strain rate was repeated until a total elongation of
about 20% was reached.

35
E7:TEP17.1ENTILT, RESULTS
(A) DETEPcirTION OF YOU GS MODULUS SLIPAND TY::-` S,
As mentioned E:Lovo, some poly(:rystalline specimens
with a reduced section of 1 inch were used for Youngs
Modulus determinations. Knife edges positioned 1/2 in.
apart were clamped on the gauge section of the specimen
and connected to a microformer type of extensometer.
The latter, in turn, was connected with the chart
driven system of the Instron Machine so that the load-
elongation curve was directly recorded on the chart.
By measuring the slope of the initial line portion of
the curve, the Youngs Modulus for the polycrystalline
material was obtained. Experiments were performed both
at 77°K and 293°K and the results were 1.30 x 10⁴ kg/mm2
in both cases. This agrees fairly well with the data in
the literature (Foote Mineral Co, 1968).
Youngs Moduli for single crystals of <110> and <211>
tensile axes, hereafter referred to as <110> and
<211> crystals, were calculated from the elastic constants
detarmined by Bolef (1961) and they were 1.26 x 10⁴ and
1.27 x 10⁴ kg /mm2 respectively. (see Appendix II).
For all other -17Pngi, tests, no exi-PnsnmPi-Pr was
used and the recorded strain on the chart was actually
the displacement of the cross head of the tensile

36
machine. The displacement was the sum of the elongation
of the specimen and the strain of the parts of the
machine. The latter should be eliminated in order to
obtain the actual strain of the specimen. The Youngs
Moduli were used to calculate the initial strain at the
proportional limit and, therefore, the actual strain
was obtained (Appendix III). The maximum shear stresses
of polycrystalline specimens were obtained by multiplying
the axial normal stresses by 0.5 (Harding, 1969).
Among those experiments for slip plane deter-
mination, two <110> crystals deformed at 77°K showed
a ductile chisel edge type of fracture (Fig. 7), which
was observed by other investigators in BCC metals (Rose,
Ferriss and Wulff, 1962). By using the back reflection
Laue X-ray technique, it was found that the knife edge
was in the <110> direction. Other <110> crystals showed
the same tendency to neck down, i.e., to reduce symmetri-
cally in one dimension but remain the same width as it
was before deformation in the other dimension. Atkinson
et al. (1954) found the same results in tungsten when
deformed at high temperatures and claimed that this was
due to four active 0101 <111> slip systems operating
at roughly equal rates. However, the resolved shear
stress on the {211] planes is higher than that on the
(110) planes, by a ratio of 1.16 to 1. It is believed

(a) Top view, 30x
(b) Side view, 30x
37
Figure 7: Typical chisel edge fracture of crystal C-1,deformed at 77°K. Initial axis of specimenwas <110>.

38
that the chisel phenc,;:c_fnon was caused by a double slip
simultaneously on (112) (111) and (112) (111) systems.
The resultant slip diraction for these two is [110).
In general, no distinct slip lines were observed
for these tests except for 410> crystal F-4, which
showed some brittle fracture, when deformed at 160°K.
Slip lines on the surface viewed from (001) and (110)
disrections are shown in Fig. 8. Two sets of straight
slip lines symmetrical to the tensile axis are apparent
when viewed from the (110J direction, while a wavy
texture and cross slipping can be observed in the view
in the (001)direction. The predominant slip planes
were determined to be the f1121 and the active slip
systems (112) 1111) and (112) 1.11), which are conjugate
to each other.
Electron photomicrographs of the same crystal
viewed from two different directions are shown in Fig.
9. The fineness of the slip lines are revealed in
these highly magnified views, The tensile specimen
F-4, was then cold mounted in Areolite, ground, polished
and viewed microscopically. No trace of lines were
noticed. This indicates that these lines were slir)
lines rather than twins. Eecause-no misfit of atoms
will occur between either side of the slip plane after
slipping, no traces should be left underneath the surface.

a) View in <001> direction, 30X
(b) View in <110> direction, 30x
Figure 8: Single crystal F-4, deformed at 160°K.Initial axis of specimen was <110>.

t,s . '
*404-'44401(4,00124p.-
(a) View in <100> direction, 21,000X
(b) View in <110> direction, 21,000X
Figure 9: Electron Microscopic View of Single CrystalF-4, double replica. Axis of specimen was<110>
40
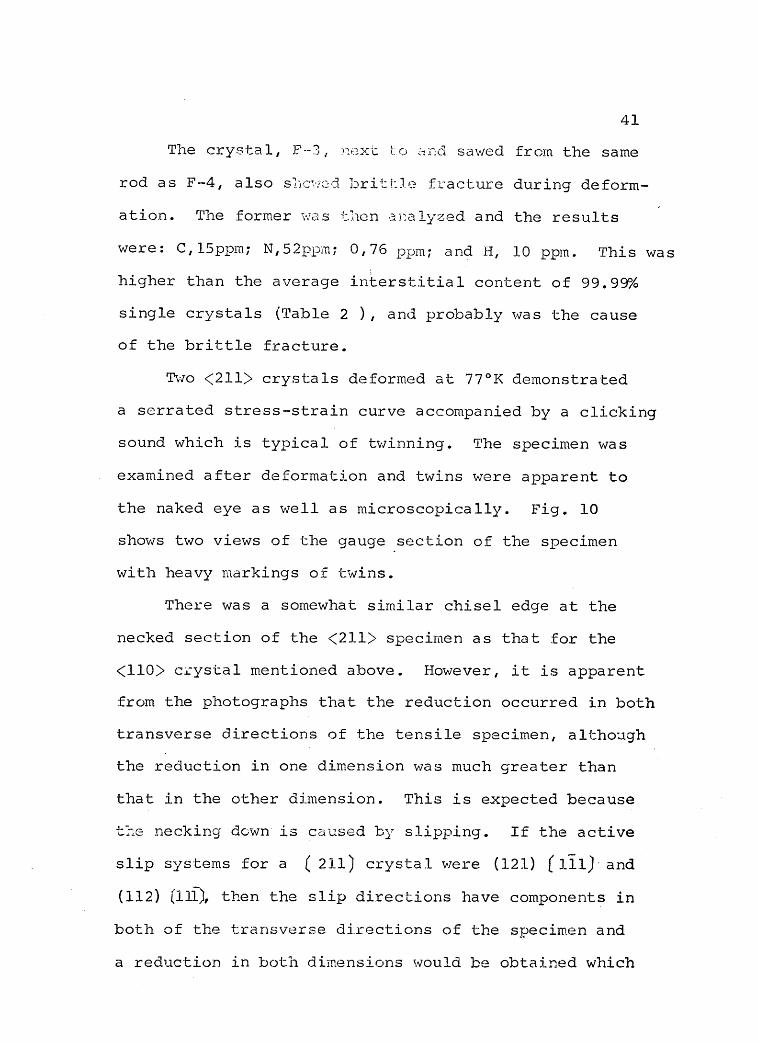
41
The crystal, F-3, 1.-xt fo sawed from the same
rod as F-4, also slic'ved britille fracture during deform-
ation. The former was nen analyzed and the results
were: C,15ppm; N,52ppm; 0,76 ppm; and H, 10 ppm. This was
higher than the average interstitial content of 99.99%
single crystals (Table 2 ), and probably was the cause
of the brittle fracture.
Two <211> crystals deformed at 77°K demonstrated
a serrated stress-strain curve accompanied by a clicking
sound which is typical of twinning. The specimen was
examined after deformation and twins were apparent to
the naked eye as well as microscopically. Fig. 10
shows two views of the gauge section of the specimen
with heavy markings of twins.
There was a somewhat similar chisel edge at the
necked section of the <211> specimen as that for the
<110> crystal mentioned above. However, it is apparent
from the photographs that the reduction occurred in both
transverse directions of the tensile specimen, although
the reduction in one dimension was much greater than
that in the other dimension. This is expected because
the necking down is caused by slipping. If the active
slip systems for a ( 211) crystal were (121) (iil) and
(112) OD, then the slip directions have components in
both of the transverse directions of the specimen and
a reduction in both dimensions would be obtained which

42
(a) View at one end of the chisel edge.
(b) View at 90° from the developing chiseledge,showing slight necking in thisdimension.
Figure 10: E-6 crystal with <211> axis deformed at 77°KHeavy markings are twins.

43
agrees with the observation.
The twinning planes detecminod from the markings
of a <211> crystal were found to be (214 The deformed
<211> crystal was then cold mounted in Areolite, ground,
polished and viewed microscopically. The markings could
also be detected in the polished specimen which confirms
their identification as twin boundaries. (Fig. 11)
(B) Yield, Necking, Twinnips, and FracturePhenomena
All polycrystalline specimens deformed at room
temperature (Fig. 12) showed sharp yield points or
yield drops followed by a short section of yield elong-
ation and then gradual work hardening. However, single
crystals of two orientations, which yielded at very low
stresses, showed a very smooth transition from elastic to
plastic deformation.
Comparing <110> with <211> crystals, the latter
had lower yield stress and an even lower work hardening
coefficient at room temperature. It is also interesting
to point out that at this temperature the yield stress
of the 99.93% polycrystalline specimen was about double
that of the 99.99% specimen.
Only a few specimens were used for staining at
low temperatures without prestraining at ambient temp_
erature and they are shown in Fig. 13. Again 99.99%
and 99.93% polycrys als showed slight yield drops at

44
Figure 11
Longitudinal cross section view of crystalE-6, deformed at 77°K, cold mounted, polishedand etched, showing distinct twin markings.Initial axis of specimen was <211>

NEE
IO
9
8
7
6
5
co
crI 4
45:
HP- S: 99.99% Single CrystalHP-P: 99.99% PolycrystalLP - P: 99.93% Polycrystal
2
I 2
SHEAR STRAIN %3
Fig. 12 Typical Room Temperature Yield Curves oi Vanadium<110> or< 211> designates tensile axis ofspecimen.

24
22
20
N 18EE
Yco
16U)U)WcrI-cr)
cr 144wi(/)
12
46
61/e0*49)
0)
C= 6.67 x 10⁻⁵ Sec-1e2= 6.67 x 10⁻⁴ Sec-I
10
o*Co
i I60°K LPP(Neckin
)
HP-S: 99.99% Single CrystalHP-P: 99.99% PolycrystalLP-13: 99.93% Polycrystal
t2 200° K HP-P
i
I _1
I 2
SHEAR STRAIN %Fig. 13 Typcica I Yield and Necking Phenomena of Vanadium.
<110 > designates tensile axis of specimen.

47
200°K and 160°K respectively; both were successfully
strained without quick necking down or fracturing. On
the other hand, 99.99% <110> single crystals necked
just beyond the yield point both at 160°K and 120°K.
In order to compare the results based on the same
procedure and to avoid a quick necking down, all ex-
periments for temperature change and strain rate change
were performed at low temperatures after prestraining
at ambient temperature.
Single crystals twinned readily at 77°K even after
prestraining at ambient temperature (Fig. 14).
Most single crystals gave ductile fractures, e.g.,
chisel edges as mentioned in the previous section, at
temperatures ranging from 293°K to 77°, except that
3 or 4 specimens showed some brittle fracture which was
probably due to interstitials picked up during handling,
as mentioned above.
(C) Temperature Change and Strain Rate ChangeCurves.
The typical shear stress versus shear strain curves
are shown in Figs. 14, 15 and 16. The shear strain for
polycrystals was obtained by multiplying the axial
strain by 2. At 293°K, the flow stress of the 99.93%
polycrystal was about double that of the 99.9V. poly-
crystal, but at 77°K the flow stresses of both materials

35
30
E 25E
20
cr)
cr1(7) 15
= 10U)
= 293° KT-2 =77° KHP-S: 99.99%Single CrystalHP- P: 99.99%PolycrystalLP- P 99.93%Polycrysta I
HP" P
HP- S I I 0 T
Twinning
T1
Fig.
5 10 15 20SHEAR STRAIN °A)
14 Typical Temperature Change Curves of Vanadium Between 293°K and 77°K.<110> designates tensile axis of specimen.

25
20
EEcp
15
wcr)
cn
cr
10
cr
wcn
Hp-S tt
HP-S
0 T
21
= 293° KT2= 120 °KHP -S: 99.99% Single Crystal
T2
Ti
Ti TiTt
5 10 15 20 25SHEAR STRAIN %
Fig. 15. Typical Temperature Change Curves of Vanadium Between 293°K and 120°K.<110>or <211> designates tensile axis of s/..ecimen.

TI = 293° KT2 = 200° KHP- S: 99.99% Single CrystalHP- P: 99.99% PolycrystalLP - P: 99.93% Polycrystal
T2
I
5 10 15 20 25SHEAR STRAIN °A
Fig. 16 Typical Temperature Change Curves of Vanadium between 293°K and 200°K.<110 > designates tensile axis of specimen.
01

51
were about the same. '±'i-lcrefor- the differential stress
due to temperature bet\ cs:,r1 293, and 77°K, was
greater for the 99.9/=, tLan for the 99.93% specimens.
The method of evalu,atioll of ti-)e str2ss change was
obtained by extrapolting linearly to the same strain
as illustrated in.Fig. 14. This should give the flow
stresses at different temperatures corresponding to the
same dislocation configuration, assuming unloading effects
to be negligible. The change in flow stress was always
measured for a decrement in temperature to avoid possible
annealing effects which are apparent in some curves when
the temperature is increased.
Except at the first few percent of straining,
was almost constant, i.e., independent of strain. The
value in the neighborhood of 16% shear strain was used
for later plotting and evaluation. 99.99% single crystals
tended to twin at 77°, even when prestrained at 293°,;
no data was obtained for these specimens. However, com-
paring the section of the curve before twinning for the
99.99% <110> crystal to that of the 99.99% polycrystal,
it is fair to say that zY-F for both materials was pro-
bably of the same magnitude. The data points for both
materials coincided in some cases as will be mentioned
later in this paper.

52
Referring to Fig. 15, the resolved yield and flow
stresses for the <211> crystal at 120 and 293°K lower
than that of the <110> crystal at the same temperatures;
AZ for the <211> crystal was also lower than that of the
<110> crystal.
At 200°, (Fig. 16), the flow stress of the 99.93%
polycrystal specimen was approximately the same as that
of the 99.99% polycrystal, but at 293°K the flow stress
of the former was much greater than that of the latter.
Hence,L-r between these two temperatures, of the former
much smaller than that of the latter. The AT" for
the 99.99% <110> crystal was approximately the same as that
for the 99.99% polycrystal for temperature tests between
these two temperatures.
Fig. 17 shows two polycrystalline strain rate change
curves at 77°K and two monocrystalline curves at 120'K.
Because the deformation was performed at the lower strain
rate, El approximately 0.2% and changed to the higher
strain rate E approximately 2% as mentioned above,
the flat portion of the original load-elongation curve
at E is not obvious after it is replotted into a shear
stress-strain curve. The differential shear stress due
to strain rate change is almost independent of strain
for all curves. The value of4aT was obtained by extra-
polating to the same strain at two different strain
rates and only the value for an increment in strain

40
35
30
25E
cp
20
!co
ac
w 15
10
5:3
i2 T3 Hp P
i2 T3 LP- P
6.67 x 10⁻⁵ Sec-If2= 6.67 x 10⁴ Sec-I
HP-S <110
E2
T2
HP-S 211
i2SI
= 293° KT2= 120° KT3= 77° KHP-S: 99.99% Single CrystalHP-P: 99.99% PolycrystalLP-P: 99.93% Polycrystal
10 20SHEAR STRAIN %
Fig. 17 Typical Strain Rate Change Curves of Vanadium.> or <21D designates tensile axis of
specimen.
54
rate was used. It is interesting to note that 2s` due
to strain rate change at 120°K gave the largest value
among the four curves.
(D) Temperature Dependence of the ResolvedYield Stress, Flow Stress, ActivationEnthalpy and Activation Volume.
With the exception of a few early specimens
strained directly at sub-ambient temperatures all
specimens were prestrained at 293°K and then additionally
strained at specific temperatures. The resolved yield
stresses were taken at the 0.2% offset from the section
of the curve strained at a certain temperature after
the mentioned prestraining (Appendix IV).
The resolved yield stress versus temperature curves
are shown in Fig. 18 and the effective flow stress, de-
fined as versus temperature plots are shown inT
Fig. 19.
For all materials the yield and flow stresses are
sharply increased just below 200°K and this is
more remarkable for the higher purity than the lower
purity. The difference between the stresses for <110>
and that for <211> crystals is probably due to the fact
the flow stress is dependent on the orientation of the
crystal. Rose, Ferriss and Wulff (1962) found the same
results in a single crystal of tungsten. The possibility

40
30E
5:
55
20
I0
°0 100 200TEMPERATURE °K
Fig. 18: Resolved yield stress of vanadium versustemperature. < 114 or < 211> designatestensile axis of specimen.
-10r 99.99% <110> Crystal-v- 99.99% <211> Crystal
99.99% Polycrystal-40- 99.93% Polycrystal--0- Christian & Masters (1964)
0
S.S.
sylib
\\\%\et
\\\ck\
:430,
0...0
300

t \\
--6--- 99.99% 110>u-- 99.99% 211>.
% \ ..\ -4 99.99 °A99.99 Polycrystal.. --*-- 99.93% Polycrystal
cm .. ---(>.- Cr-r T273° K) Christian iix
EEag) \---
.\ _ Masters (1964 )20. \ M M M .M Theoretical Peierls... Mechanism (Dorn a Rajnak,1964)
%ems.
100 200TEMPERATURE °K
Fig. 19: Resolved flow stress of vanadium versus temperature. 410 >or <211> c)
designates tensile axis of specimen.

57
of changes in slip system with orientation of the tensile
axis was considered. However, calculations show that
for both the <110> and <211> crystals, the resolved
shear strss onl 2111 planes is higher than that on
f110lj planes; the ratio is 1.16 to 1 for the former
case and is 1.035 to 1 for the latter. The orienta-
tion dependence of flow stress will be discussed in a
later section.
The increase of stresses just below 200°K for the
lower purity material, 99.93% polycrystals, is a mod-
erate one. This is probably due to the interference of
the low temperature deformation mechanism with that at
the neighborhood of ambient temperature, which is mainly
controlled by the interaction of impurities and disloca-
tions as will be discussed in a later section.
The similarity between the flow stress-versus-temp-
erature and that for the yield stress-versus-temperature
curves probably is an indication that the rate controlling
mechanisms at different temperature ranges for both
types of stress are the same.
The strain rate sensitivity of vanadium versus
temperature plot is shown in Fig. 20. where the rate
sensitivity is expressed as the difference in stress
due to change of strain rate at constant temperature
divided by the difference of the natural logarithms of

1.5
99.99% <110> Crystal--9- 99.99% <211> Crystal4- 99.99% Polycrystal
99.93% Polycrystal0-- Christian & Masters (1964)
oo100 200
TEMPERATURE °K300
Fig. 20: The strain rate sensitivity of vanadium versus temperature. cn
<110 > or <211>designates tensile axis of specimen. op

59
strain rates. The s3M0 explanation applied to Fig.
18 and 19 applies also to Fig. 20 except that the
sharp increase in sensiti started at 200°K
instead of below that temperature. This is because
changing from a lower strain rate to a higher rate
is equivalent to a change in the operating temperature
from 200°K to a lower temperature at constant strain
rate. The sensitivity_ to the strain rate increases
with the purity of the material. Hepce the increase is
more drastic in the neighborhood of 200°K for 99.99%
material than for 99.93% material. At 120°K and lower
temperatures the sensitivity still persists, but the
increase in stress with decreasing temperature is
very great. A given differences of strain rate change
is equivalent to a smaller difference of temperature
change at this temperature than at higher temperatures.
Therefore, the strain rate sensitivity tends to curve
down at this temperature range for most materials.
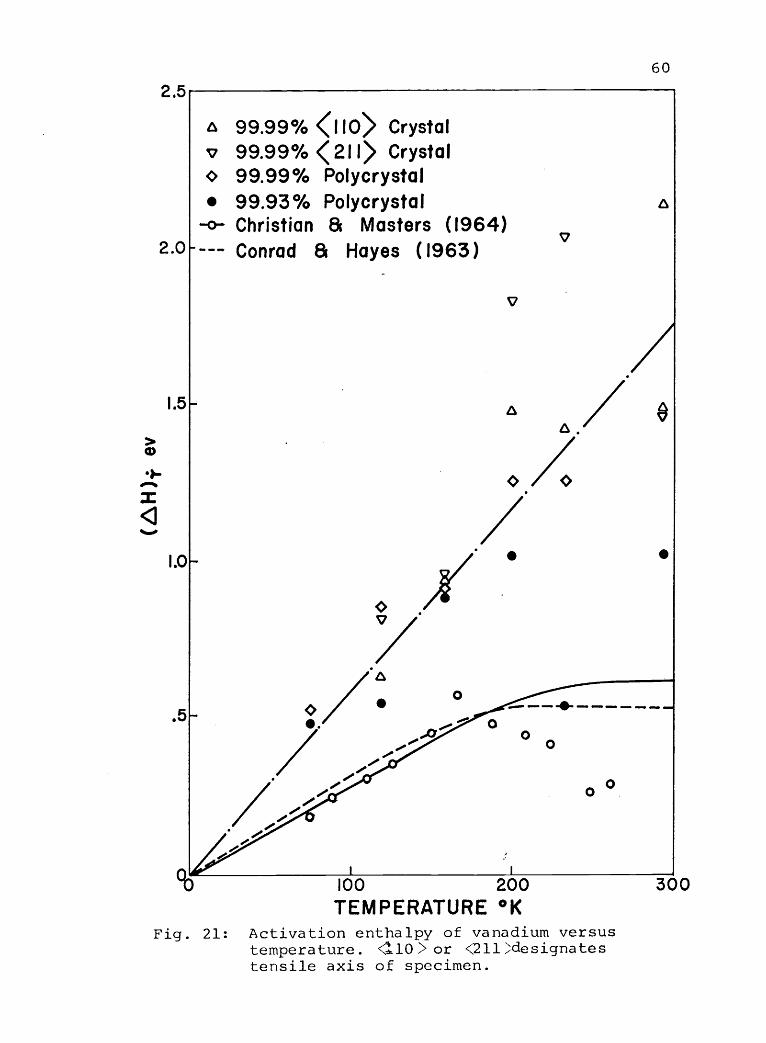
According to Equation (9), the activation enthalpy
or the heat of activation has been calculated (Appendix
IV) and plotted against temperature in Fig. 21, in which
data from Christian and Masters (1964) and Conrad and
Hayes (1963) are also sh'6wn. The difficulty involved
in the determination of the activation enthalpy is
mainly due to the difficulty in measuring the exact
2.5
2.0
60
a 99.99% <110> Crystalv 99.99% <211> Crystalo 99.99% Polycrystal
99.93% Polycrystal-0-- Christian & Masters (1964)
Conrad & Hayes (1963)V
A
.5
00 100 200TEMPERATURE °K
Fig. 21: Activation enthalpy of vanadium versustemperature. <110> or <211 ;designatestensile axis of specimen.
300
61
slope of the effective stress versus temperature curve
at a constant strain r:4te (Fig. 19 ) . More data points
are required in order to imptova the results of
measurements.
The agreement between the present work and previous
investigations at temperatures below 200°K was fairly
good, considering that different purity grades of vanadium
were used. The divergence of the value at temperatures
between 200 and 293°K may be, at least partially, due
to experimental or calculational error. When both strain
rate sensitivity and slope of shear stress versus
temperature plot at constant strain rate are small,
it is very difficult to calculate.6H(Appendix IV) .
Nevertheless, this might indicate a change of rate con-
trolling mechanism occurring at approximately 200°K.
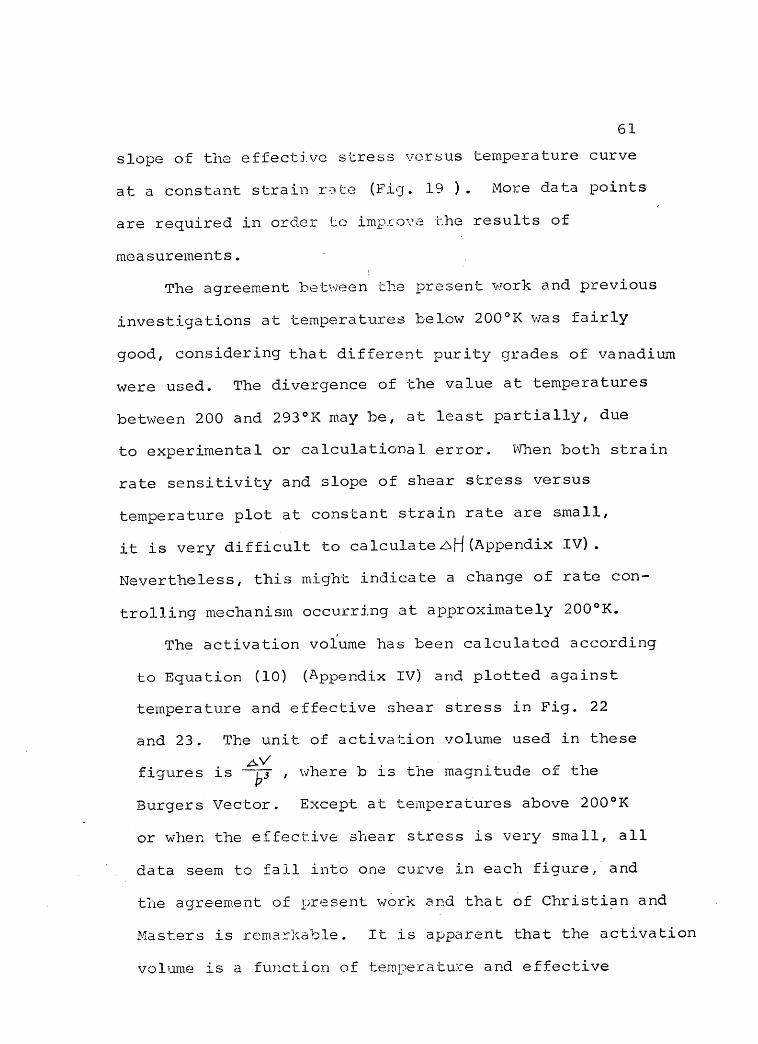
The activation volume has been calculated according
to Equation (10) (Appendix IV) and plotted against
temperature and effective shear stress in Fig. 22
and 23. The unit of activation volume used in these
z..0/ifigures is 123 , where b is the magnitude of the
Burgers Vector. Except at temperatures above 200°K
or when the effective shear stress is very small, all
data seem to fail into one curve in each figure, and
the agreement of present work and that of Christian and
Masters is remarkable. It is apparent that the activation
volume is a function of temperature and effective

400-
300
a 99.99% <110> Crystalv 99.99% <211> Crystalo 99.99% Polycrystal
99.93% Polycrystal
62
100
°0 100 200TEMPERATURE °K
Fig. 22: Activation volume of vanadium versustemperature. <110> or <211 >designatestensile axis of specimen.
300
90a
080,
70
2500
0 401-
(-) 30
20
I0
0
63
a 99.99% <110> Crystal99.99% <211> Crystal
o 99.99% Polycrystal99.93% Polycrystal
o Christian a Masters (1964)Theoretical Peierls Mechanism,a.=0Theoretical Peierls Mechanism,.3.=1 (Dorn & Rajnak, 1964)
10
T*, (TT -1'293), Kg/mm230
Fig. 23: Activation volume versus effective shearstress of vanadium. <110> or <211 > designatestensile axis of specimen.

64
shear stress.
In the evaluation of enthalpy and volume of acti-
vation, it was assumed that the effective shear stress
equals the shear stress at the specific temperature
minus that at 293°K. This is equivilant to the
suggestion that the thermal component of the applied
shear stress is zero at and above 293°K. The choice of
this critical temperature is somewhat arbitrary. Conrad
and Hayes (1963) used 450°K for this temperature; Dorn
and Rajnak (1964) used 273°K; Christian and Masters
(1964) selected the temperature of 250°K. However,
the stress change in the neighborhood of ambient
temperature is very small for 99.99% material and no
significant consequences are expected by the difference
of selection. On the other hand, for lower purity,
99.93%, material, different choices of the critical
temperature would give somewhat different results.

65
VI. DISCUSSIO OF RESULTS
(A) Slip and Twinning Systems
Since there are no controversial points of view as
to the shear direction znc tr pl:Ine of twinning in BCC
metals the twinning systems f 211) <111> are presumed
correct.
Although no general agreement has been reached for
slip planes for BCC metals, a theory that the slip system
is orientation dependent seems to be a more satisfactory
one than others (Foxall, Duesbery and Hirsch, 1967;
Bowen, Cristian and Taylor, 1967). These investigators
discovered that there was a discrepancy between the
theoretical orientation dependence of the operative slip
plane and that observed. The results of tensile ex-
periments deviated in the opposite way to those in com-
pression, which was attributed to the asymmetric nature
of the slip directions in the 1211} planes. The asymmetry
of slip increases with decreasing temperature. However,
the slip planes observed were predominantly of the f 110)
or {211} type.
In vanadium, Greiner and Boulin (1967) found that the
slip plane was f 211} in their bending and compression
tests in single crystals of <110> direction. The tensile
axis of vanadium single crysta]s used by Mitchell, Fields
and Smialek was at the center of the stereographic triangle
and the slip plane observed was 1110). All these results

66
are in agreement with the thcottcal orientation de-
pendence and with the results of Foecall, Duesbery and
Hirsch (1967) in niobium single crystals.
The theoretical slip plane for a <211> crystal should
be (211), but it was on The border line between (1101 and
f2ilaccording to the slistcmatic observations in niobium
crystals mentioned above. However, the shear stress re-
solved in both planes is approximately the same as
mentioned above; the resolved shear stress calculated on
the (211) plane as was applied in the present work would
cause no serious error.
(B) Yield Phenomena
The yield strength at 293°K for vanadium was strongly
dependent on the interstitial content of the material.
Although only slight yield drops were observed for some
of the specimens, it was a general phenomenon that the
yield point for lower purity material was a sharp one while
that for the higher purity material was a gradual transition
from elastic to plastic deformation. The yield drop was
noticed for a 99.93% polycrystal even at a low temperature
of 160°K, while there was no such drop for a 99.99% <110>
crystal at the same temperature or lower. Cottrell
locking is dominant at ambient temperature and for lower
purity materials, but the effect is relatively slight at
lower temperatures and for higher purity materials.

67
In general, the p11-,Lia might be stated as
follows: During the initial loadlng of the specimen,
some dislocations arn torn from -CI-lair Cottrell at-
mosphere. As the stress is increased, the mobility of
the dislocations increases and some multiplication
occurs by the double cross slip mechanism. For a high
purity specimen, the pinning of dislocations is in-
effective, the multiplication takes place gradually as
strain hardening proceeds.
The orientation and temperature dependence of
yield stress was found by Rose, Ferriss and Wulff (1962)
in tungsten and by Bowen, Christian, and Taylor (1967)
in niobium. Their curves at various temperatures were
similar to some of the curves cf the present work. High
yield stresses and little work hardening were the common
characteristics of the stress strain curve for <110>
crystals.
(C) Rate Controlling Mechanism of the ActivationProcess at Low Temperatures
Due to an abrupt change of yield and flow stresses
and the strain rate sensitivity at approximately 200°K,
at and above which the activation enthalpy changes to
a great extent, it is strongly believed that a change
of controlling mechanism takes place at this temperature.
It is also clear frcm the present work that the effect

68
of impurities is great at temperatures above 200°K,
substantiated by the well established observations that
the resolved flow stress is proportional to the total
interstitial content of vanadium at ambient temperature
(Reed, 1970). The rate controlling mechanism at
temperatures above 200°K is probably the interaction
between dislocations and impurities.
The rate controlling mechanism at low temperatures
for BCC metals has been studied by many investigators
and categorized in the following (Conrad, 1961):
1. Interaction between dislocations and impurities,
2. Intersection of dislocations;
3. Nonconservative motion of jogs in screw dis-
locations;
4. Overcoming of the Peierls stress;
5. Cross slip of screw dislocations.
According to the results ,aentioned above the differ-
ential flow stress and strain rate sensitivity are even
higher for 99.99% material than that of 99.93% material
at temperatures below 200°K. -It is apparent that the
deformation mechanism controlled by the interaction
between dislocations and impurities is not effective.
Of the last four mechanisms mentioned above, the intersection
of dislocations, or cutting of the forest, can also be
eliminated. This is because the experimental volume of

69
activation is in the y.31-.0,e of S co 30 b3, while that
expected for this 1"e(-:-,afitsm is several orders of magnitude
greater (Seeger, 1954). Furth more, if it were this
mechanism controllina, the difference of shear stress
due to change of strain rate should have increased
with the increasing of strain and the activation volume
should have decreased with the increasing of strain
(Conrad and Schoeck, 1960; Conrad, 1961). Both of
these did not occur.
Comparing the enthalpy and volume of activation
of the last three mechanisms mentioned above with those
obtained from the present experiments, they all seem com-
parable to each other. However, the supporters for the
nonconservative motion of jogs in screw dislocations
(Schoeck, 1961; Rose, Ferriss and Wulff, 1962) revealed
that the activation enthalpy was about 1.5 ev, being
half of the self diffusion energy, and the distance
between jogs was approximately 50b. According to Eq.
(12) ,zw,ber the activation volume will be approximately
50b3, supposing the distance of activation, de, is of the
magnitude of b. This is slightly greater than the
results of the present investigation; also the enthalpy
of activation is greater than the value of the experiments
at the temperatures between 77°K and 200°K, 0.5 to approx-

70
imate 1.0 ev.
There were no slious calcul,tions of the activa-
tion enthalpy for the cr-)ss slip mechanism and that of
overcoming Peierls F=t_cess (Cc =ad, 1961), but the dislo-
cation segment involved in the thermal activation (Seeger,
1956; Schoeck and Seeger, 1958) hc-s teen found to be in the
range of 10 to 50b in both cases. Therefore, the acti-
vation volume for both mechanisms is approximately 10
to 50b3, which is in agreement with the results of
the present experiments. Johnston and Gilman (1959)
and Schoeck (1961) claimed the cross slip mechanism was
rate controlling for yield as well as flow for BCC
metals while Conrad (1961) and Christian and Masters
(1964) supported the idea of the Peierls mechanism. How-
ever, the recent development in the theory of slightly
dissociated screw dislocations in BCC metals (Duesbery
and Hirsch, 1968; Darr) 1968) seems to favor the mech-
anism based on the cross slip of screw dislocations
model over others.
It is believed, in the dissociation model, that
the core energy of a screw dislocation is decreased
slightly by a minor separation of its partials rather
than assuming that a true stacking fault is present.
This implies that before such a mildly dissociated screw
dislocation can cross slip, its core energy must be

71
increased somewhat. Such a screw dislocation will then
exhibit a periodic variation in energy as it is dis-
placed and behave like one moving to overcome the energy
hills of the Peierls mechanism.
The differences between the true Peierls mechanism
and the dissociation model, i.e., pseudo-Peierls
mechanism are: (1) The former applies to any dislocation
in any orientation parallel to close-packed rows of
atoms on the slip plane, the latter applies only to
dislocations in screw orientation that dissociate very
little on secondary planes. The orientation dependence
of the flow stress can be explained in the latter mech-
anism. (2) The former is expected to be operative in
the early stages of straining; some prestraining is re-
quired to place dislocations in screw orientation before
the latter can be controlling. The rate of strain hard-
ening is expected to be high in the early stage of
straining.
In view of the fact that the edge components of
dislocation loops move considerably faster than the
screw components in BCC crystals (Johnston and Gilman,
1959) and that the present investigation shows an orien-
tation dependence of shear stress and a high rate of
strain hardening in the early stage of straining, the
pseudo-Peierls mechanism is most probably to be the rate

72
controlling mechani,,!!q tern-cz:tlires below 200°K.
The overall stress versus temperature picture is
depicted in Fig. 24, winrelys tlle critical temperature,
above which the therm:,,1 stress to overcome the pseudo-
Peierls stress is zero, Tc is the equivalent for
overcoming the interaction energy between dislocations
and impurities. For high purity vanadium, the former
is probably 200°K and the latter, 300°K. However, these
critical temperatures are overshadowed by the interaction
mechanism for low purity materials as also shown in the
figure. This is the difficulty encountered in evaluating
the deformation mechanism by using low purity materials.
Dorn and Rajank (1964) have developed a theoretical
model for the Peierls mechanim, which should apply both
to the true Peierls as well as the Pseudo-Peierls mech-
anisms mentioned above. They assumed that the energy,
r (y), per unit length of a dislocation line in the
direction y, perpendicular to the dislocation with a
periodnall, the space between parallel rows of close-
packed atoms on the slip plane, was approximated by
n,J) 11 -i-(9i+cos271"92. 2 CL
21 Coss 4-
(16)
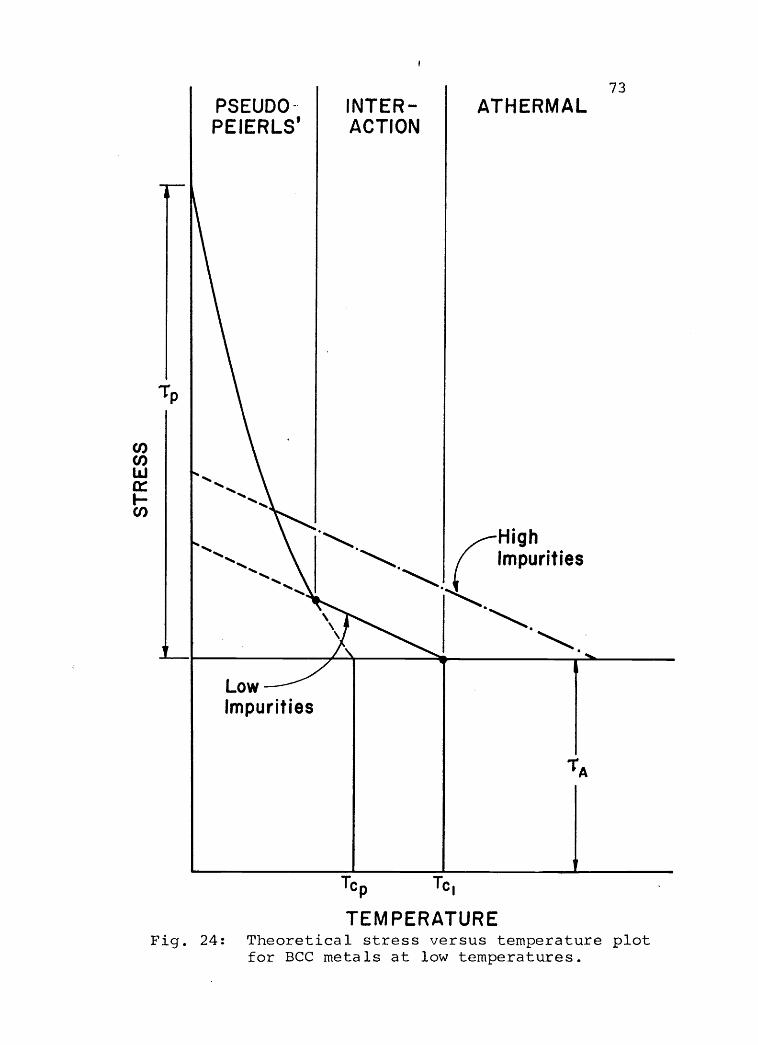
PSEUDOPEIERLS'
INTER-ACTION
73
ATHERMAL
HighImpurities
LowImpurities
Tcp Tc,
TEMPERATUREFig. 24: Theoretical stress versus temperature plot
for BCC metals at low temperatures.

74
where rand P are the energies per unit length of a
dislocation lying at the top and bottom of the Peierls
hill respectively, ando/is a factor that varies between
-1 and 1. By extensive mathematical manipulations, they
obtained the following equations:
Un
z4U D-c4'
.6 Uri T
(17)
and 24 U Te p(18)
Where 17 is the Peierls stress at 0°K,174feffective shear
stress, Atiit is the every for a kink in a dislocation line
and Q Un,the energy to nucleate a pair of kinks, which is
assumed to be the process for the dislocation line to
move over the Peierls hill. T in Eq. (18) is the exper-
imental temperature and Tc is the critical temperature,
.
above which the effective shear stress,17 I, is zero.
There are theoretical curves for effective shear
stress, ti versus left side terms of Eq. (17) and (18).
By plotting the empirical curves of effective shear stress
versus right side terms, the theoretical and empirical
plots can easily be compared. The theoretical activation
volume versus effective shear stress curve is shown with
the empirical results of vanadium in Fig. 23/and the
equivalent plots for activation enthalpy versus shear
stress are shown in Fig. 25, assuming 7 is 200°K.
(Appendix IV)
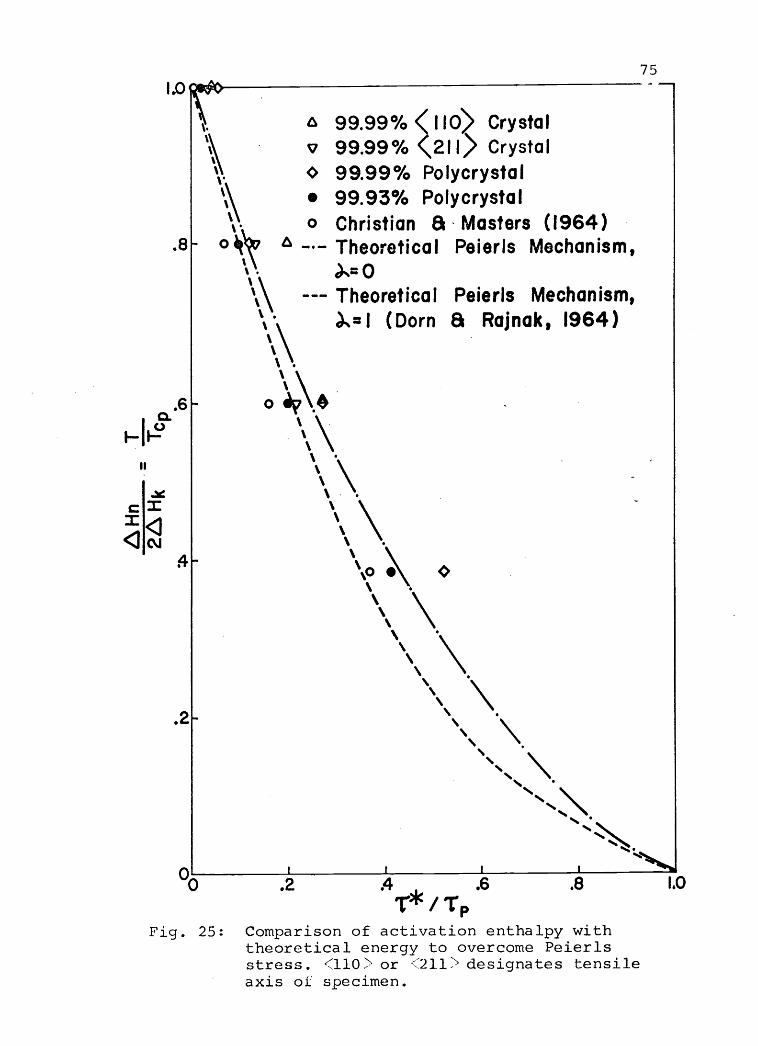
I.0
.8
C
4
.2
00 .4 .6ri` p
Fig. 25: Comparison of activation enthalpy withtheoretical energy to overcome Peierlsstress. <110> or <211> designates tensileaxis of specimen.
75
0
99.99% 110> Crystal99.99% 211> Crystal
o 99.99% Polycrystal99.93% Polycrystal
o Christian a Masters (1964)a Theoretical Peierls Mechanism,
X=0--- Theoretical Peierls Mechanism,
.,=1 (Dorn a Rajnak, 1964)
A.
\
\\
.8 I0

76
The agreement I_Ict.c,en th,F, tlieory and the experimental
results is fairly good considering that the possible
effects of interstitials on the mechanism were neglected
and that other sirup._-Ai7jc;71ticris `:ore made in the theory. The
theoretical stress L- versus tamrJerature T, curve pre-
sented by Dorn and Rajnak (1964) is also shown with
empirical results in Fig. 19. However, this was based
on the assumption thatTcp is 273°K. If the assumed Tcpis
200°K, the theoretical curve will shift to the left and
agree with the curves for 99.99% vanadium very well.
Some remarks on the activation equation (3), are in
order, Since the plot of activation enthalpy at con-
stant strain rate versus temperature is a straight line
below 200°K (Fig. 21) , the assu mption that C is inde-
pendent of stress and temperature is justified in this
range. It is a poor approximation at temperatures above
200°K. The assumption that the enthalpy of activation is
a function of temperature and effective shear stress is
justified. The relation between activation enthalpy and
effective shear stress is generally expressed as 4.H=_,6/44-Aer*
(Conrad, 1961). In the neighborhood of 200°K, however,
there is more than one single mechanism controlling, and
the enthalpy data based on a single activation process
may not be quite accurate.

77
(D) Comparison of Testing Materials
The very high purity material, 99.99% vanadium,
seems to demonstrate the following characteristics in
general: (1) Very fine or indistinct slip lines were
observed. This is probably due to the fact that the
slip bands are so closely spaced that no slip lines
could be observed. (2) It is very ductile even at
77°K. This is contrary to some of the previous ob-
servations that vanadium was brittle at low temperatures.
(3) The higher the purity of the metal, the greater
will be the tendency for twinning. Some tensile spec-
imens twinned at 120°K in the present investigation
as compared to a 20°K in a previous investigation
(Lindley and Smallman, 1963). (4) The effect of im-
purities on the flow stress for high purity metal is
slight so that the deformation mechanism at low temp-
eratures could be distinguished from that at ambient
temperature. A dividing line between the two mechanisms
at 200°K is recognized for the first time.
Comparing 99.99% purity <110> single crystals with
<211> crystals, an orientation dependence of flow stress
has been established which helps to identify the rate
controlling mechanism at temperatures below 200°K.
Comparing single crystals and polycrystals of
similar purity 99.99% vanadium, the differences in yield,

78
flow stresses and the strain rate sensitivity were less
pronounced than that between single crystals of differing
orientation. This is the equivalent of saying that the
effect of grain size is a minor one, which is the charac-
teristic of the Peierls or pseudo-Peierls mechanism
where the activation volume is tiny as compared to the
metallographic grain sizes.
(E) Suggestions for Future Investigations
In view of the experimental results obtained in the
present work, the following recommendations are suggested
for future investigations in the field of deformation
mechanisms for BCC metals at low temperatures.
1. Very high purity metal should be used in order
to avoid interference from the effects of impurities.
Using different grades of purity of the same metal is
desirable for comparison purposes, but the impurity
content should be a single element or interstitial alone
at various levels.
2. More closely spaced data are required to obtain
more accurate evaluations, especially in the calculations
for activation enthalpy.
3. Larger temperature ranges should be covered,
for instance from 4°K to 400°K, if the difficulties due
to twinning and necking down can be overcome.

79
4. More accurate chemical and analytical techniques
are needed so that no e>.act impurity content is known
and the evaluation of the results will not mislead due
to inaccurate information.
5. More precise and accurate equipment will faci-
litate the type of experiments used in the present work
and give better results. For example, a stress-strain
recorder of very high magnification is required so that
the differential change of stress can be accurately
recorded. Another apparatus improvement would be a
specially built coolant container which permits rapid
changes of temperature.

80
CONCLUSIONS
(A) Mechanical 'twins ar(.,! formed in tensile testing,
of <110> and <211> single crystals of 99.99% purity
vanadium at 77°K and 120°K. Twins occur on f211)- planes.
(B) In general, slip lines could not be identified
on 99.99% vanadium single crystals. The slip plane
determined on a <110> single crystal deformed at 160°K
by tension is f2111.
(C) 99.99% purity vanadium single crystals deformed
at temperatures from 77°K to 293°K generally show a
chisel edge type of ductile fracture.
(D) The yield and flow stre3es of vanadium are
affected to a great extent by impurities at temperatures
between 200°K and 293°K, but are little affected at
temperatures between 77°K and 200°K.
(E) The resolved flow stresses of single crystals
of 99.99% purity vanadium are dependent on orientation.
(F) There is an apparent change of rate controlling
mechanism at approximately 200°K on the basis of an
abrupt change of yield and flow stresses, the strain
rate sensitivity, ne activation volume and activation
enthalpy at this temp:-_ature. The change for 99.99%
purity vanadium is remark?tble but for 99.93% metal it
is less distinct.

81
(G) The rate controlling mechanism for the
deformation of high purity vanadium at temperatures
between 200°K and 293°K is most likely the interaction
between dislocations and impurities. At temperatures
below 200°K, the deformation is probably controlled
by slightly dissociated screw dislocation model, i.e., the
pseudo-Peierls mechanism.
82
BIBILIOGRAPHY
1. Atkinson, R.H. and Staff. 1960. Physical metallurgyof tungsten and tungsten alloys. 233p. (U.S. Air ForceContract No. AF 33(616)-56321 WADD-TR-60-37)
2. Avery, D.H., M.L., Ebner and W.A. Backofen. 1958.
Electroshaping of copper single crystals. Trans-actions of the Metallurgical Society of the AIME
220:256
3. Barrett, C.S. Structure of metals, 1966. 3d ed.New York, McGraw-Hill Book Co. 654p.
4. Barrett, C.S., G. Ansel and R.F. Mehl. 1937. Slip.twinning and cleavage in iron and silicon ferrite.Transactions of American Society for Metals 25: 703-736.
5. Barrett, C.S., and R. Bakish. 1953. Twinning andcleavage in tantalum. Transactions of the AIME212: 122-123.
6. Bolef, D.I. 1961. Elastic constants of single crystalsof the bcc transition elements V, Nb and Ta. Journalof Applied Physics 32: 100-105.
7. Bowen, D.K. and J.W. Christian. 1965. The calculationof shear stress and shear strain for double glide intension and compression. Philosophical Magazine,ser. A, 12: 369-378.
8. Bowen, D.K. J.W. Christian and G. Taylor. 1967.Deformation properties of niobium single crystals.Canadian Journal of Physics 45:903-938.
9. Bradford, S.A. and O.N. Carlson. 1962. Effect ofoxygen on the lattice constant, hardness and ductilityof vanadium. Transactions of the American Societyfor Metals 55: 169-178.
10. Calnan, E.A. and C.J.B. Clews. 1951. The developmentof deformation texture in metals, Part II: Body-centered cubic metals. Philosophical Magazine, ser.
7, 42:616-635.
83
11. Carlson, O.N. and C.V. Owen. 1961. Preparation ofhigh-purity vanadium metal by the iodide refiningprocess. Journal of Electrochemical Society 108:88-93.
12. Carlson, O.N., F.A. Schmidt and W.E. Krupp. 1966.A process for preparing high-purity vanadium. Journalof Metals 18:320-323.
13. Christian, J.W. and B.C. Masters. 1964. Lowtemperature deformation of body-centered cubicmetals, Proceedings of Royal Society, (London)A, 281:233-257.
14, Clough, W.R. and A.S. Pavlovic. 1960. The flow,fracture and twinning of commercially pure vanadium.Transactions of the American Society for Metals52: 948-970.
15. Conrad, 1961. On the mechanism of yielding and flowin iron. Journal of the Iron and Steel Institute198: 364-375.
16. Conrad, 1964. Thermal activated deformation of metals.Journal of Metals 16: 582-588.
17. Conrad, H. and W. Hayes. 1963. Thermally-activateddeformation of the BCC metals at low temperatures.Transactions of the American Society for Metals 56:249-262.
18. Conrad, H. and G. Schoeck. 1960. Cottrell lockingand the flow stress in iron. Acta Metallurgica8: 791-796.
19. Conrad, H. and H. Wiedersich. 1960. Activationene3a, for deformation of metals at low temperatures.Acta Metallurgica 8: 128-130.
20. Cottrell, A.H. 1948. Effect of solute atoms on thebehavior of dislocations. In: Report of a Conferenceon Strength of Solids, University of Bristol,July, 1947.London, Physical Society. p. 30-38.
21. Cottrell, A.H. 1958. Theory of brittle fracture insteel and similar metals. Transactions of the AIME212: 192-203.
22. Cotrell, A.H. 1964. The mechanical properties ofmatter. New York, John Wiley. 430p.
23. Cottrell, A.H. and B.A. Bilby. 1949. Dislocationtheory of yielding and strain aging of iron.Proceedings of Physical Society 62-A: 49-62.

84
24. Dorn, J.E. 1968. t:perc!t;.-3 dislocation mech-anisms. In: Dislocation ed. A.R. Rosenfieldet a l . Columbus, ttel 1:? r':,_moria 1 Institute.p. 27-55. (Battelle Ins Lute Science Colloquia1967) .
25. Dorn, J.E. and S. Rajnak. 1964. Nucleation of kink pairsand the Peierls mechanism of plastic deformation. Trans-actions of the Metallurgical Society of AIME 230:1052-1064.
26. Duesbery, M.S. and R.A. Foxall. 1965. Symposium Rein-stoffe in Wissenschaft and Technik, Dresden. Cited in:Deformation properties of niobium single crystals, byBowen, D.K., J.W. Christian and G. Taylor. CanadianJournal of Physics. 45:903-938. 1967.
27. Duesbery, M.S. and P.B. Hirsch. 1968. Effect of corestructure on dislocation mobility with special referenceto BCC metals. In: Dislocation dynamics, ed A.R.Rosenfield et al. Columbus, Ohio, Battelle MemorialInstitute. p. 57-85. (Battelle Institute Materials ScienceColloquia, 1967)
28. Edington, J.W. and R.E. Smallman. 1964. The relation-ship between flow stress and dislocation density indeformed vanadium. Acta Metallurgica 12:1313-1328.
29. Edington, J.W. and R.E. Smallman. 1965. On mechanicaltwinning in single crystals of vanadium. Acta Metallurgica13:765-770.
30 Foote Mineral Co., Technical Staff. 1968. Vanadium.In: The Encyclopedia of the Chemical Elements, ed byC.A. Hampel, New York. Reinhold Book Corporation.p. 787-795.
31. Foxall, R.A., M.S. Duesbery and P.B. Hirsch. 1967. Thedeformation of niobium single crystals. CanadianJournal of Physics 45:607-629.
32. Garlick, R.G. and H.R. Probst. 1964. Investigation ofroom temperature slip in zone melted tungsten singlecrystals. Transactions of Metallurgical Society ofAIME 230:1120-1125.
33. Gilman, J.J. and W.G. Johnston. 1957. The origin andgrowth of glide bands in lithium fluoride crystals. In:Dislocations and mechanical properties of crystals, ed.J.C. Fisher et al.. New York, John Wiley & Sons.p. 116-163. (An International Conference, Lake Placid,September 1956) .

85
34. Greiner, E.S. and D.M. Boulin. 1967. The plasticdeformation of single crystals of vanadium at 298° and77°K. Transactions of the Metallurgical Society ofAIME 239:965-969.
35. Harding, J. 1969. The effect of grain size and strainrate on the lower yield stress of pure iron at 288°K.Acta Metallurgica 17:949-958.
36. Heslop, J. and N.J. Petch. 1956. The stress to movea free dislocation in alpha iron. Philosophical Mag-azine. ser. 8, 1:866-873.
37. Hoke, J.H. and R. Maddin. 1956. The deformation ofmolybdenum single crystals in compression. Journal ofMechanics and Physics of Solids 5:26-40.
38. Honeycombe, R.W.K. 1968. The plastic deformation ofmetals. New York, St. Martin's Press. 477p.
39. Jaoul, B. and D. Gonzalez. 1961. Deformation plastiquede monocristaux de fer. Journal of Mechanics and Physicsof Solids 9:16-38.
40. Johnston, W.G. and J.J. Gilman. 1959. Dislocationvelocities, dislocation densities and plastic flow inlithium fluoride crystals. Journal of Applied Physics30:129-144.
41. Kaun, L. A. Luft, J.Richter and D. Schulze. 1965.Symposium Reinstoffe in Wissenschaft and Technik,Dresden. cited in: Deformation properties of niobiumsingle crystals. by Bowen, D.K., J.W. Christian andG. Taylor. Canadian Journal of Physics 45:903-9081967.
42. Kelly, A. 1953. Neumann bands in pure iron. TheProceedings of the Physical Society A66:403-405.
43. Koehler, J.S. 1952. The nature of work-hardening.Physical Review 86:52-63.
44. Lindley, T.C. and R.E. Smallman. 1963. The plasticdeformation of polycrystalline vanadium at low temp-eratures. Acta Metallurgica 11:361-371.
45 . Low, J.R. and R.W. Guard. 1959. The dislocationstructure of slip bands in iron. Acta Metallurgica7:171-179.

86
46. Maddin, R. and N.K. Chen. 1954. Geometrical aspects ofthe plastic deformation of metal single crystals.Progress in Metal 5:53-95.
47. McHargue, C.J. 1962. Twinning in Columbium. Trans-actions of the Metal_Largical Society of AIME 224:334-339.
48. Mitchell, T.E., R.J. Fields and R.L. Smialek. 1970.Three-stage hardening in vanadium single crystals.Journal of the Less-Common Metals 20:167-170.
49. Mitchell, T.E. and W.A. Spizig. 1965. Three-stagehardening in tantalum single crystals. Acta Metallurgica13:1169-1179.
50. Mordike, B.L. 1961. Herstellung von Tantal-Einkristallendurch Elektronenstrahlschmelzen. Zeitschrift fur Metal-lkunde 52:587-591.
51. Nabarro, F.R. N. and T.R. Duncan. 1967. Dissociateddislocations and the Schmid Law of resolved shearstress in B.C.C. Metals. Canadian Journal of Physics45:939-943.
52. Orowan, E. 1954. Dislocations and mechanical propertiesIn: Dislocations in metals, ed, by M. Cohen. New York,AIME. Chapter 3.
53_ Paxton, H.W. 1953. Experimental verification of twinsystem in alpha iron. Acta Metallurgica 1:141-143.
54. Petch, N.J. 1953. The cleavage strength of poly-crystals. Journal of the Iron and Steel Institute174:25-28.
55. Pugh, J.W. 1957. Temperature dependence of the tensileproperties of vanadium. Transactions of the AIME209: 1243-1244.
56. Reed, R.E. 1970. Electron beam float zone and vacuumpurification of vanadium. Paper presented before theInternational Vacuum Metallurgy Conference and ThirdAnnual Southwest Section Symposium, American VacuumSociety, Anaheim, California, June 15-19, 1970.
57. Rose, R.M., D.P. Ferriss and J. Wulff. 1962. Yieldingand plastic flow in single crystals of tungsten. Trans-actions of the Metallurgical Society of AIME 224:981-
990.

87
58. Rostoker, W. 1958. The metallurgy of vanadium. NewYork, John Wiley. 185p.
59. Schadler D.W. 1960. Deformation behavior of zone-melted tungsten single crystals. Transactions of theMetallurgical Society of AIME 218:649-655.
60. Schmid, E. and I. W. Boas. 1968. Plasticity of crystals.London, Chapman and Hall. 353p.
61. Schoeck, G. 1961. On the yield stress in BCC metals.Acta Metallurgica 9:382-384.
62. Schoeck, G. and A. Seeger. 1955. Activation energyproblems associated with extended dislocations. In:
Report of the Conference on Defects in Crystalline Solids,University of Bristol, July, 1954. London, PhysicalSociety. p. 340-346.
63. Schwartzbart, H. and J.R. Low, Jr. 1949. The yield andstrain aging of carburized and nitrided single crystalsof iron. Transactions of the AIME 185:637-645.
64. Seeger, A. 1954. Theorie der Kristallplastizitgt.Zeitschrift fur Naturforschung 9a: 758-775, 856-869.
65. Seeger, A. 1956. On the theory of the low temperatureinternal friction peak observed in metals. PhilosophicalMagazine, ser. 8, 1:651-662.
66. Stadelmaier, H.H., W.M. Pritchard and J.E. Grund. 1955.The elastic coefficients of the cubic system with tablesfor simplified calculation. Raleigh, North CarolinaState College, 1955. 9p. (Engineering School BulletingNo. 60)
67. Stein, D.F. 1967. The effect of orientation and impuritieson the mechanical properties of molybdenum single crystals.Canadian Journal of Physics 45:1063-1074.
68. Stein D.F. and P.D. Gorsuch. 1961. Etch pit evidenceof (112) in iron, Acta Metallurgica 9:904.
69. Sullivan, T.A. 1965. Electrorefining vanadian. Journalof Metals 17: 45-48.
70. Taylor, G. 1965. Doctor of Philosophy Thesis,Oxford,England, Oxford University. Cited in; Deformationproperties of niobium single crystals, by D.K. Bowen,J.W. Christian and G. Taylor. Canadian Journal ofPhysicas 45:903-938. 1967.

88
71. Taylor, G.I. and C.F. Elam. 1926. The distortion ofiron crystals, Proceedings of Royal Society (London),
A, 112:337-361.
72. Thompson, R.W. and O.N. Carlson. 1965. Effect ofnitrogen and carbon on the low-temperature embrittle-ment of vanadium. Journal of the Less-Common Metals9:354-361.
73. Tietz, T.E. and J.W. Wilson. 1965. Behavior andproperties of refractory metals, Stanford, California.Standford University Press. 419p.
74. Tsien, L.C. and Y.S. Chow. 1937. The glide of singlecrystals of molybdenum. Proceedings of Royal Society(London), Ser. A, 163: 19-28.
75. Wang, C.T., E.F. Baroch, S.A. Worcester and Y.S. Shen.
1970. Preparation and properties of high-purityvanadium and V-15Cr-5Ti. Metallurgical Transactions1:1683-1689.
76. Yaggee, F.L., E.R. Gilbert and J.W. Styles. 1969.Thermal conductivities and densities of vanadium,titanium, chromium and some vanadium base alloys.Journal of the Less-Common Metals 19:39-51.

APPENDICES

89
APPENDIX I
GROWING SINGLE CRYSTALS BY ELECTRON BEAM FLOATZONE REFINING
The electron beam zone refiner is a greatly modified
Materials Research EBZ-94 model. It consists of an 18-inch
stainless steel bell jar which has a wheeler copper crush
gasket seal. All feed-throughs into the chamber are bakeable
to 400°C and also have copper gasket flanges. The chamber is
baked at 250°C for 16 hours on each pump down cycle. The
pumping system is an NRC 10 inch stainless steel diffusion
pump which has a water baffle and a liquid nitrogen trap
between it and the chamber. The foreline to the 10-inch
pump is kept about 1 x 10⁻⁶ torr pressure during operation
by a waterbaffled 4-inch diffusion pump. An activated
alumina trap is in the foreline of the 4-inch pump leading to
the mechanical pump. After baking, the chamber was at 2-5
-9x 10 torr (see records under blank-off pressure). The
first pass was often done in 10-7 - 10-8 torr vacuum but
the second pass was in 10-9 torr range, sometimes getting on
the 10-10 torr range.
The electron gun scanner was constructed of stainless
steel. The drive screws used ball bearing nuts while the
guide rods had linear ball bushings in the moveable cross-
heads. The gun used an annular 20 mil tungsten wire about
40mm in diameter for the electron emitter. The tantalum
focusing plates were 10mm apart with 25 mm diameter apertures.

90
The gun was work accelerated with the specimen at high positive
potential. The power used for the 1/4 inch diameter vanadium
rods was 6000 volts x 36 milliamps or 216 watts. The zoning
direction was upward at 10 cm/hr zoning speed. The melt
records give most of this latter information for each specimen.
The seed material was Bureau of Mines electrodeposited
vanadium for the <110> orientation. The <211> seed was
material from the Pratt-Whitney CANEL project. Both of
these starting materials had been zone refined prior to making
the seeds. There should be little if any impurity pickup
from the seeds.
A Veeco GA-4 residual gas analyzer was connected to
the system and the most prominent gas during zoning was H2.
The melt records for vanadium single crystal rods are
shown in Table I-11(Information provided by Dr. R.A. Reed,
Oak Ridge National Laboratory, Oak Ridge, Tenn.)

Table I-1 Melting Records of Electron Beam Float Zone
Refining of Vanadium
Pass No. Beam Beam .-Filament Scan Pressure, Torr TimeVoltage Current Current Speed Blank off Start Finish Hr.1000V AMP AMP in/hr
(1) Rod-A, axis of crystal <110>
1 6 37 11.6 3.9 5.0x10⁻⁷ 1.0x10⁻⁷ 3.1x10⁻⁹ 2:112 6 37 11.6 3.9 1.2x10⁻⁹ 8.5x10-101.0x10⁻⁹ 1:59
(2) Rod-B, axis of crystal <110>
1 6 34 12.9 3.9 3.9x10⁻⁹ 7.0x10⁻⁷ 5.0x10⁻⁹ 1:582 6 34 11.6 3.9 2.5x10⁻⁹ 1.6x10⁻⁹ 1.6x10⁻⁹ 1:49
(3) Rod-C, axis of crystal <110>
1 6 34 12.0 3.9 1.8x10⁻⁹ 3.0x10⁻⁸ 3.5x10⁻⁹ 2:152 6.4 30 14.4 3.9 6.5x10⁻¹⁰ 3.0x10⁻⁹ 2.5x10⁻⁹ 2:05
(4) Rod-E, axis of crystal <211>
1 6 37 11.8 3.9 4.4x10⁻⁹ 5.3x10⁻⁷ 6.6x10⁻⁹ 2:052 6 37 11.4 3.9 5.0x10⁻⁹ 4.5x10⁻⁹ 1.2x10⁻⁹ 2:00
(5) Rod-G, axis of crystal <211>
1 6-6.5 35-40 14.0-15.1 3.8 1.7x10⁻⁹ 2.4x30-7 5.2x10-102:10
2 6-6.4 34-37 15.0-15.4 3.8 7.0x10⁻¹¹ 6.5x10⁻¹°1.3x10⁻¹°2:14

APPENDIX II
CALCULATION OF YOUNGS MODULI FOR SINGLE CRYSTALS
Suppose the reference frame for the equations of the
theory of elasticity be (x1,17;z) and the crystal axis of
the cubic system be (x,y,z). According to Stadelmaier,
Pritchard and Grund (1955), the elastic coefficients will
be functions of the fourth degree of the direction cosines
that are defined by the following scheme:
XX'
Y'
a, az a3
1132 3
11 Yz Y3
Use the following abbreviations:
A 2 z 2 ZQa
= al a2 4 a2 a3 a3
a/ etc .
Qa13y =
oaya =
C =
Qa- Q13-
Q
Qa
c11 c12
etc.
2c44
92
(19)
(20a)
(20b)
(21)
Then the constants of the new coordinates are related
to the constants of crystal axes as follows:
CI 11 = C11- 2C C2a
C 22 = c11-2 C
CI 33 = C11-2 C SAY
3 2 2 C C2c4,y
C113 = t'31 = C-12 C
C'12 = C'21 C- 12- C yaf3
(22a)
(22b)
(22c)
(23a)
(23b)
(23c)

We have, for vanadium (Bolef, 1961)
cli = 22.7 x 10¹¹ dynes/cm2c12 = 11.9 x 10¹¹ dynes/cm2c44 = 4.26 x 10¹¹ dynes/cm2
(24a)
(24h)
(24c)
In the case of an uniaxial tensile stress, the stress-
strain equations are as follows:
22 CZ/
a =33
C3/
C ,/
6/1
EH
CL 6 zz + C/3 C 33
+ (-.22 s 22 -I- C.2,3 s 33
+ C32/ 21 + C.3.; 633
=
=
0
0
(25a)
(25b)
(25c)
Solving aL in terms of c21, then we obtain the Youngs
Modulus for this direction,a
E22lz
(26)
93
For <110> crystal, X' = (1003 , Y' = j 110) Z' = th10)
we have,
a/ = 1
/ = 0
Y/
= 0
a 2 = 0 a3 = 0
=z 2
1
2 2
133
1
ZT1
=3 f 2
Substituting all these values in Eq. (19) and (20)
and carry out the calculations from Eq. (22a) through (26),
we obtainE22
= 1.26 x 10⁴kg/mm2
For <211> crystal, X' - (01I), Y' = (211) , Z' = (11E)
a/ = Cos 45° , a2 = 0 a3 --Cos 45°
= Cos 65.9° , = -Cos 35.26°133 = Cos 65.9°
y/
= Cos 54.74° yz = Cos 54.74°13 7. Cos 54.74°

94
Applying the same calculations as mentioned above, we obtain
E22 = 1.27 x 10⁴ kg/mm2

95
APT-ENDIX III
CALCULATION OF SHEAR STRESS AND STRAIN
(A) For Polycrystals
Let Ao = Original cross sectional area
L/- Load in the region where the material is behai/ing
in an essentially eleastic manner. The corresponding
strain is
where E
LIE =/ Ao E
Youngs Modulus = 1.3 x 10⁴ kg/mm2
The apparent strain is
= E -F =-to
Where elongations are
ei =
-e
is the gauge length . when the load is L1 .44 and
are the original and final gauge lengths respectively.
We have the true strain
*P16 = d =
Jo
and true stress
=
In IfIo
( 1 + ) (27)
L Ao = L IfA/ Ao Al Ao
L (1 +Ao
Therefore the shear stress is
T = + 6))2 Ao
(28)
(28a)

(B) For _.<211> Crystals
For a (1121 crystal, 27:Lp cccnrs on (211) 111)
and (121) (111) systolus.
According to Bowen and Christian (1965)
3/2 in 3 + Cot (3
3 +;(2 Co t: (30
96
(21
T = L COS (3 cos (64.77°- IS) (30)A° 10 6
where = 35.26° is the angle between (112) and 1001).
(112) is the tensile axis and (0011 is the resultant
slip direction, and
= Sin-1
1
(
7-Sin j
-1 ( sin /
( 1+ E')(C) For <110> Crystals
For a (0111 crystal, slip occurs on (211) and
/ N(211) 0_11) systems. The resultant slip direction is
(011); no rotation is involved. We have,
T =A°
(1 + 6) Cos 35.26° Cos 54.74°
= L 2 (1 +A° 3
According to Schmid and Boas (1968),(31)
Y = 1 Sin2 -1- co..- (32)
cos 54.74.W /
Take the derivative,d = cos 54.7' cos 0 dy (33)
Here 0 = 00= 35.26 Integrating (33) , we have
Y = ---cos 54.74' cos 35.26
= 3 In (1 + 6)

Alternative Method (Bowen and Christian, 1965)
T= L cos 2(35)A9 4 5
Y Cot 132 Cot k) (36)
Where
Here
and
Sin i3
Cos f3
130 =
Cot 13
Cot 130=
JO
ISin Ro
12- ioz cos2J2
= 0
Cos 13 =
2 /02 (1''COS2 130)14) 1 sink,
iz lb sin a Cos a0 0
(37)
have
= = 1 4- /
Substituting (37) in (35) and (36) , we
T- 13 2
Y = 3 In (1 + el )V2
97

APPENDIX IV
RAW DATA AND CALCULATIONS
(A) Resolved Yield Stress of Vanadium
Specimen PurityDesignation %
1. 293°K
Specimcp)Type i
Strain Rate10-5 Sec-1
Resolved Yield Stress, kq/mm2Proportional 0.2%Limit Offset
13-322 99.93 P.C. 6.50 8.35 8.9399-223 99.99 P.C. 6.50 3.67 3.80F-6 99.99 S.C.<110> 6.30 1.48 1.74G-4 99.99 S.C.<211> 6.41 0.86 1.10
2. 233°K
13-230 99.99 P.C. 6.67 9.6 10.3F-6 99.99 S.C.<110> 6.30 2.48 3.10G-5 99.99 S.C.<211> 7.25 2.70 2.96
3. 200°K
13-225 99.93 P.C. 6.67 12.80 13.9599-217 99.99 P.C. 6.67 8.45 8.60A-1 99.99 S.C.<110> 7.25 4.90 5.32E-2 99.99 S.C.<211> 6.30 2.54 4.57
4. 160°K
13-19A 99.93 P.C. 6.67 13.6 14.399-218 99.99 P.C. 6.80 11.6 13.4D-5 99.99 S.C.<110> 6.67 7.28 10.9G-2 99.99 S.C.<211> 6.18 6.61 8.5
continued on next page

SpecimenDesignation
5. 120°K
13-220A99-226D-4E-4
6. 77°K
13-32299-222
Notes:
Purity Specimen Strain Rate Resolved Yield Stress, kg /m2Type 10-5 Sec-1 Proportional
Limit
99.93 P.C. 6.67 16.799.99 P.C. 6.53 17.199.99 S.C.<110> 7.11 12.799.99 S.C.<211> 6.3 10.7
99.93 P.C. 6.53 22.499.99 P.C. 6.67 32.4
(1) P.C.: Polycrystals; S.C.: Single Crystals;are orientations of tensile axis.
<110>,
0.2%Offset
18.119.517.512.0
29.233.1
<211>
(2) For polycrystals, assuming -17= 0.5e.
(3) All yield stresses for temperatures below 293°K wereobtained after prestraining for about 2% at 293°K.
(4) 0.2% offset values were used for plotting (Fig. 18).
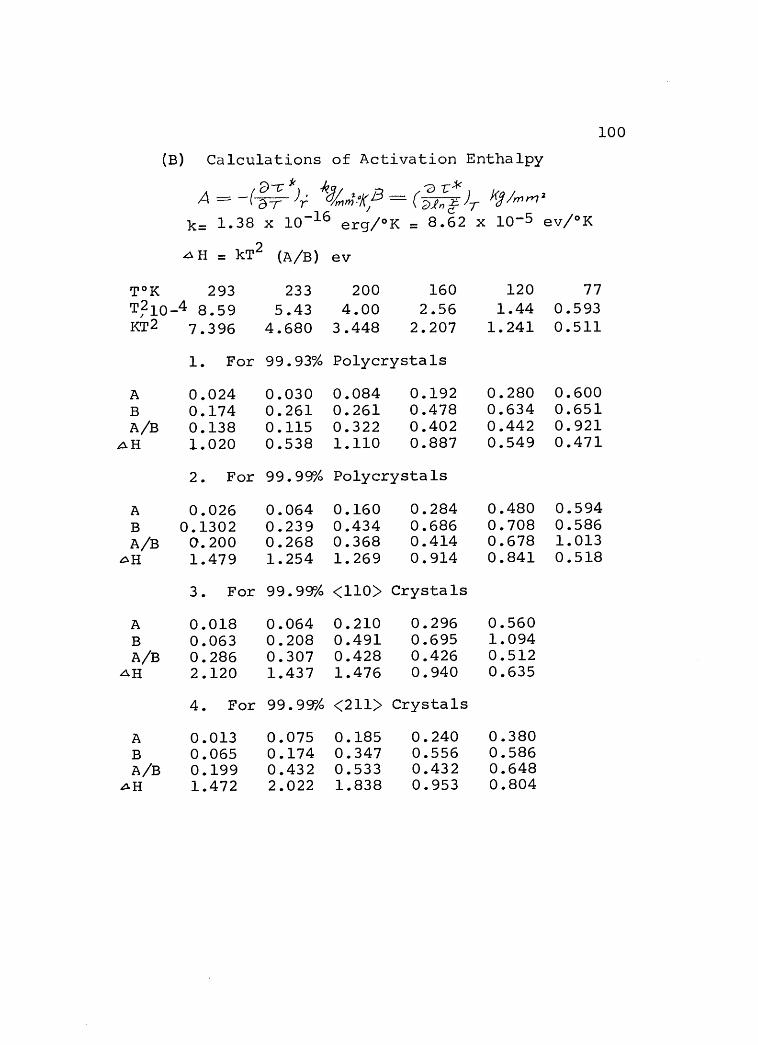
100
(B) Calculations of Activation Enthalpy
D-C * -k ,(Di
--a -c*A = (a-r 4: g/714-01c1. = n 4-- k1 /ice 2
k= 1.38 x 10⁻¹⁶ erg/°K = 8.62 x 10⁻⁵ ev/°K
, 2.4 1-1 = I'll (A /B) ev
T°K 293 233 200 160 120 77
rq10-4 8.59 5.43 4.00 2.56 1.44 0.593KT2 7.396 4.680 3.448 2.207 1.241 0.511
1. For 99.93% Polycrystals
A 0.024 0.030 0.084 0.192 0.280 0.600B 0.174 0.261 0.261 0.478 0.634 0.651A/B 0.138 0.115 0.322 0.402 0.442 0.921
411.1 1.020 0.538 1.110 0.887 0.549 0.471
2. For 99.99% Polycrystals
A 0.026 0.064 0.160 0.284 0.480 0.594B 0.1302 0.239 0.434 0.686 0.708 0.586A/B 0.200 0.268 0.368 0.414 0.678 1.013
411 1.479 1.254 1.269 0.914 0.841 0.518
3. For 99.99% <110> Crystals
A 0.018 0.064 0.210 0.296 0.560B 0.063 0.208 0.491 0.695 1.094A/B 0.286 0.307 0.428 0.426 0.512
AH 2.120 1.437 1.476 0.940 0.635
4. For 99.99% <211> Crystals
A 0.013 0.075 0.185 0.240 0.380B 0.065 0.174 0.347 0.556 0.586A/B 0.199 0.432 0.533 0.432 0.648AH 1.472 2.022 1.838 0.953 0.804
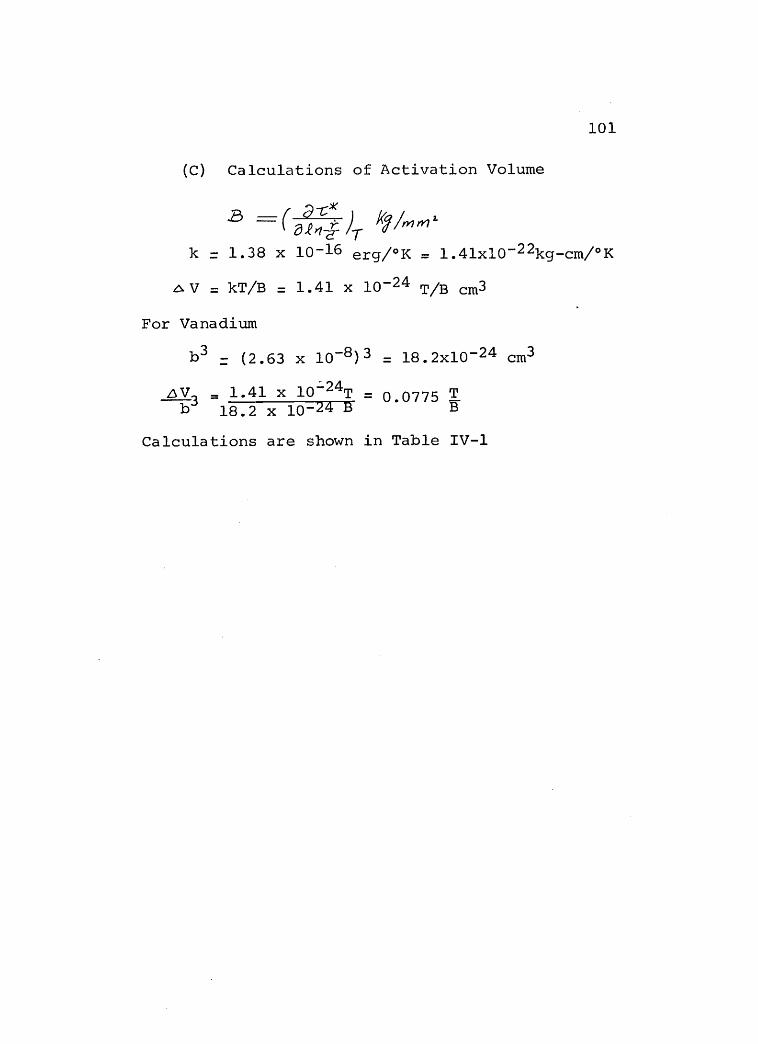
101
(C) Calculations of Activation Volume
(----r5-'' ) ky y,,,,,,,
0 ht-i- -7-
k = 1.38 x 10⁻¹⁶ erg/°K = 1.41x10⁻²²kg-cm/°K
L V = kT/B = 1.41 x 10⁻²⁴ T/B cm3
For Vanadium
b3 ._ - (2.63 x 10 -8)3 = 18.2x10⁻²⁴ cm3
6V3 = 1.41 x 10:-24T = 0.0775 Tb 18.2 x 10⁻²⁴ B B
Calculations are shown in Table IV-1

102
Table IV-1 Calculations of Activation Volume
T 293
(1)
B 0.174.14.3 131-0` 0
(2)
B 0.1304w0 175T-1( 0
(3)
B 0.0629ASV /63 361-17'` 0
(4)
B 0.0652N(/193 348
""G'3` 0
233 200 160 120 77
99.93% Polycrystal
0.261 0.261 0.478 0.634 0.65169.19 59.4 25.94 14.67 9.1671.55 1.60 5.35 10.05 20.50
99.99% Polycrystal
0.239 0.434 0.686 0.708 0.58675.55 35.71 18.08 13.14 10.181.12 2.76 6.65 13.8 26.0
99.99% <110> Crystal
0.208 0.491 0.695 1.09486.81 31.57 17.84 8.500.55 2.0 10.25 13.8
99.99% <211> Crystal
0.174 0.347 0.556 0.586103.8 44.67 22.30 15.870.55 1.90 7.10 10.8
Note:- 4.,:rl-walues are obtained from originaldata; they are listed here for the plot of.6\Wversus effective shear stress (Fig. 23)

(D) Comparison c.)1 Activation Enthalpy WithTheoretical Energy to 17,cleate a Pairof Kinks (Fig. 24)
Assume -I: =----- 200°K 1:7-p r r q/(1.1 m 2
103
Material Discription
T°K 77 120 160 200
T/Tc 0.385 0.60 0.80 1.00
T4( 13.8 10.25 2.00 99.99%<110>crystal10.8 7.10 1.90 99.99%<211>crystal
26.0 13.8 6.65 2.76 99.99%Polycrystal20.5 10.1 5.35 1.60 99.93%Polycrystal18.0 8.0 3.50 1.25 Christian and
Masters (1964)
0.276 0.205 0.040 99.99%<110>crystal0.216 0.142 0.038 99.99%<211>crystal
0.52 0.276 0.133 0.055 99.99%Polycrysta10.41 0.202 0.107 0.032 99.93%Polycrystal0.36 0.160 0.070 0.025 Christian and
Masters (1964)