Monitoring Ventilated Patients Dr.T.Sureshkumar MD, IDCCM, EDIC Consultant Intensivist Kovai Medical...
50
Monitoring Ventilated Patients Dr.T.Sureshkumar MD, IDCCM, EDIC Consultant Intensivist Kovai Medical Center and
-
Upload
agatha-moody -
Category
Documents
-
view
217 -
download
2
Transcript of Monitoring Ventilated Patients Dr.T.Sureshkumar MD, IDCCM, EDIC Consultant Intensivist Kovai Medical...

Monitoring Ventilated Patients
Dr.T.Sureshkumar MD, IDCCM, EDIC
Consultant IntensivistKovai Medical Center and Hospitals
SCOPE OF THIS TALK
• The aim is not to make anybody expert but to guide safe and
efficient practice.
• Narrowed down to avoid major catastrophe
• Focused on graphics and hemodynamics as time limits
• Language is not a barrier here & I am not the best in English.
• My intention is not delivery but reach, so please come close to me.

• Three Phases
1. Induction
2. Maintenance
3. Weaning
• Five Monitors
1. Patient
2. Ventilator
3. Vitals
4. Images
5. Labs

Why Ventilation ??Need for Ventilation
Pulmonary Extra Pulmonary
Air way issues Parenchymal issues
Normal lung
Abnormal lung
High resistance
Poor Compliance

Start with…Intubation
1st - Look your PatientLook & check air entry
1. Abnormal breathing Abdomen distendingIrregular chest rise
Hear 1. Five point auscultation2. Abnormal sounds –wheeze, crepts
And Yes your tube in right place…

Patient• At induction phase Pt will be in control ventilation • During maintenance Pt will trigger and may attempt his own
breath• Care should be taken whether he tolerates ventilator• Our settings adequate for him• Asynchrony
•Disease worsening•During Weaning :• Important to communicate with Patient• Don’t ignore his needs

2nd – Check Ventilator
• Two important things
1. What the ventilator gives to
the patient
2. How the lung accepts it.

1.Basic setup
a) Oxygenation ( FiO₂)
b) Ventilation (RR, Vt)
c) Desired mode
d) Recruitment (PEEP) if needed.
2.Scalars and loops
3.Parameters
4.Alarm settings
Ventilator Graphics
• Scalar and Loops are windows to Lung-Ventilation Mechanics
• So all modern ventilators equipped with Graphical representations.
• Gives a quick clue for problem even from a distance.
• On evaluation can diagnose specific disorder and helps in preventive
measures.

• Scalars and Loops:
• Scalars: Plot pressure, volume, or flow against time. Time is the x-axis.
• Loops: Plot pressure or flow against volume. (P/V or F/V). There is no time component.
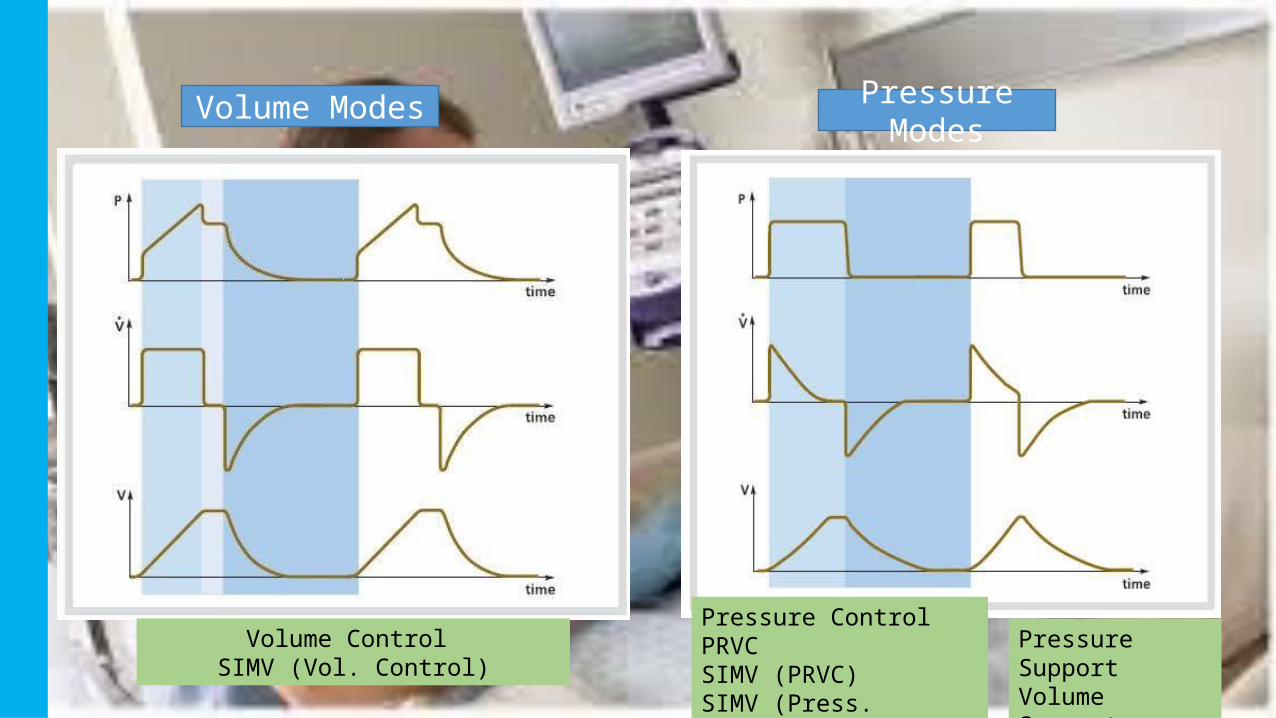
Volume Modes Pressure Modes
Volume Control SIMV (Vol. Control)
Pressure ControlPRVCSIMV (PRVC)SIMV (Press. Control)
Pressure SupportVolume Support
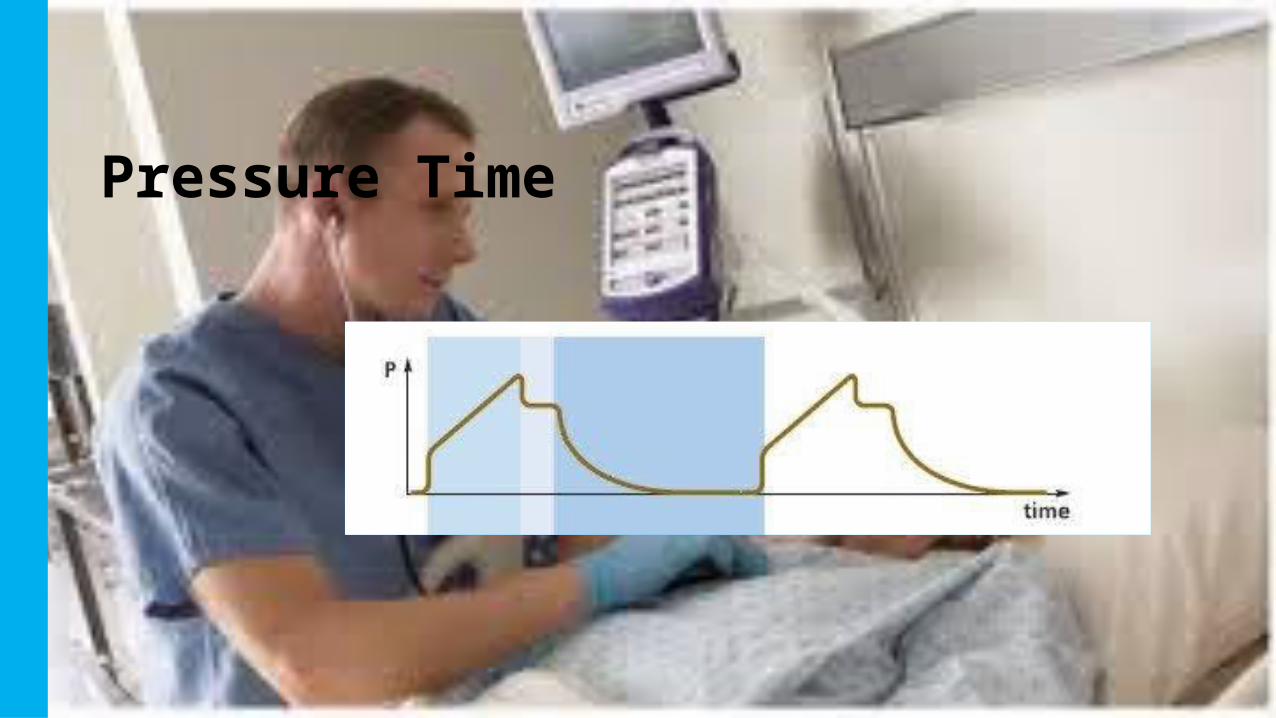
Pressure Time

Airway Pressure
Plateau Pressure
Mean airway Pressure

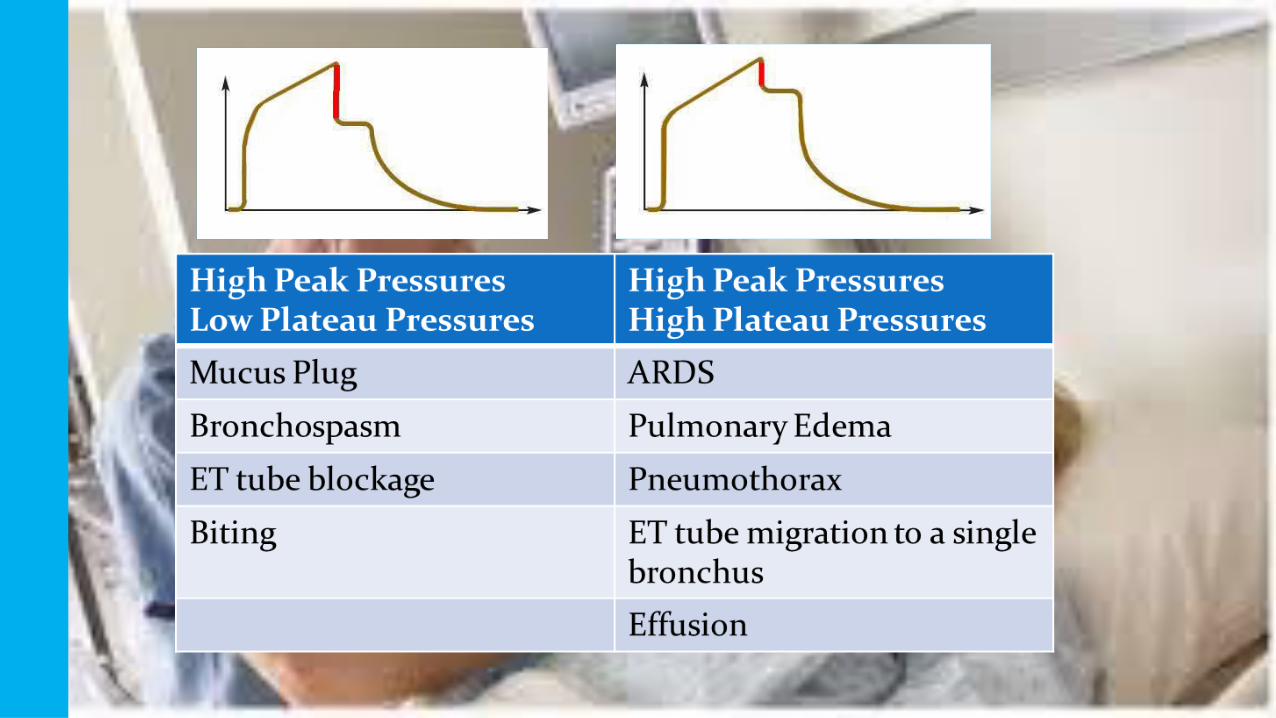
Increased Airway Resistance
Raw
PIP PIP
Pplat
Pplat
•A -Increase in airway resistance (Raw) causes the PIP to increase, but Pplat pressure remains normal.
•B-A decrease in lung compliance causes the entire waveform to increase in size. (More pressure is needed to achieve the same tidal volume). The difference between PIP and Pplat remains normal.
Decreased Compliance

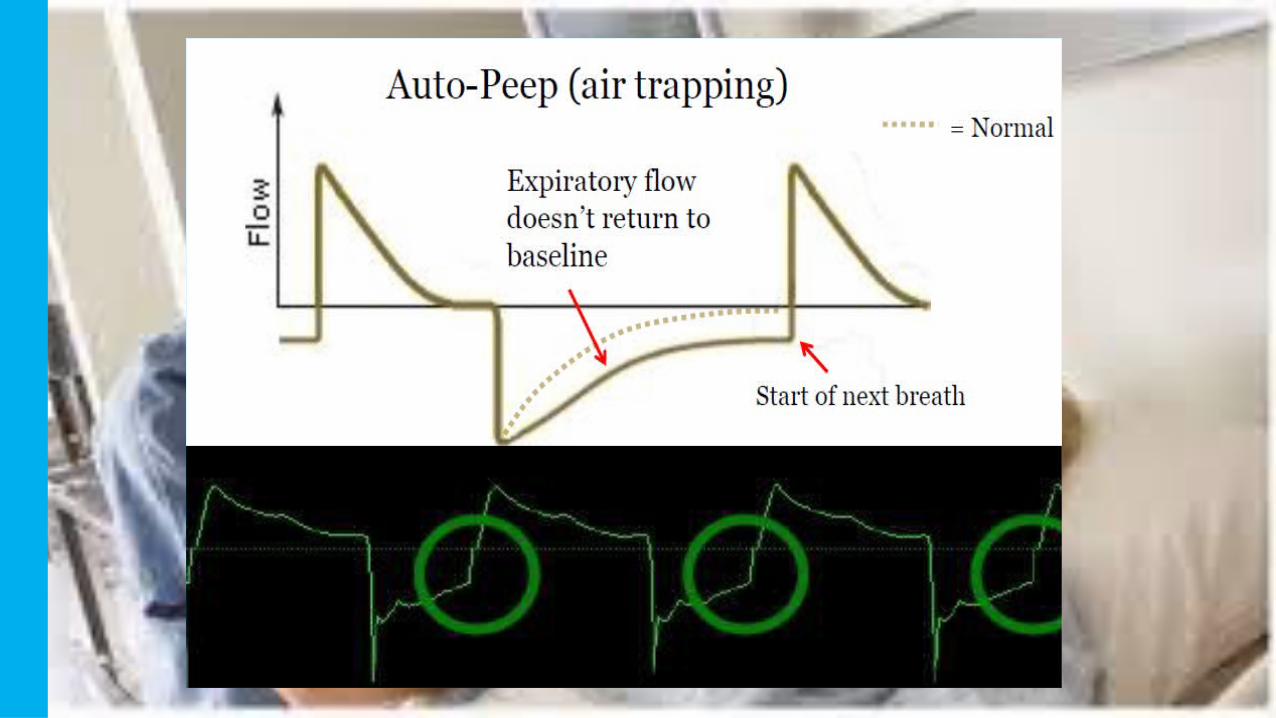
Air-Trapping (Auto-PEEP)
•An acceptable amount of auto-PEEP should be < 5cm H2O

Flow Time
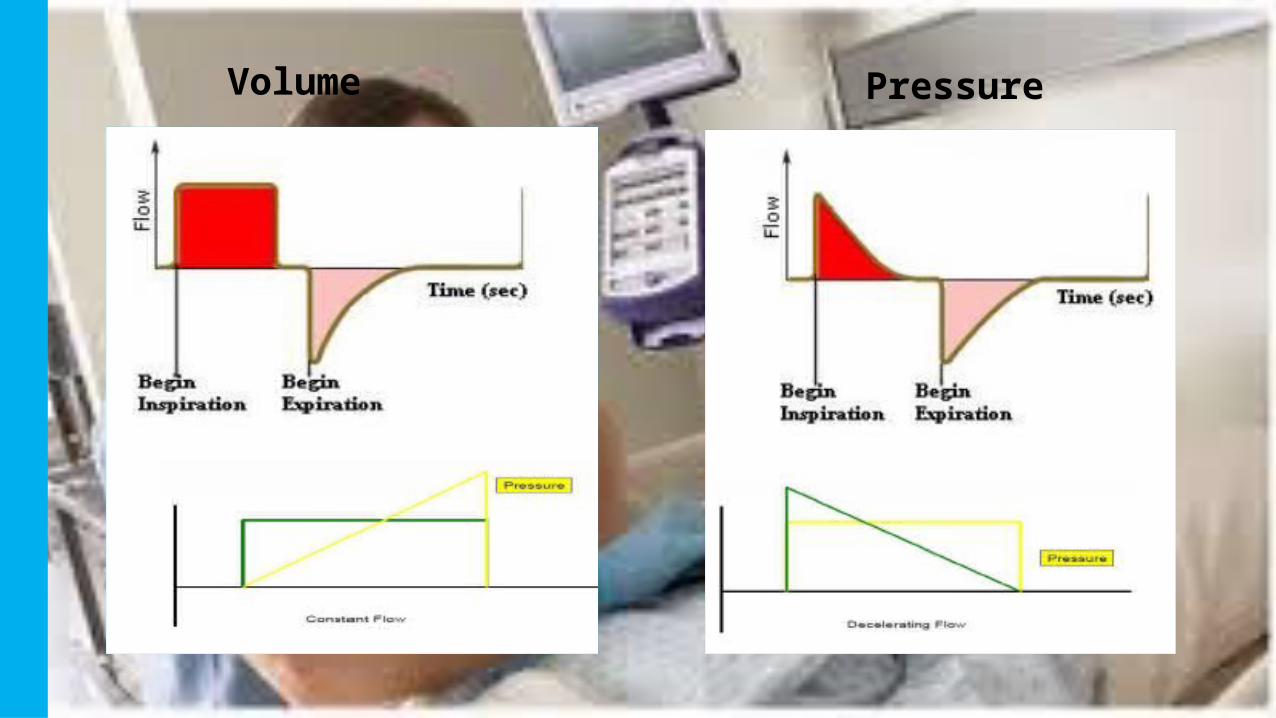
Volume Pressure

Wheeze & Bronchodilator Response
Improved Peak Flow

• The area of no flow indicated by the red line is known as a “zero-flow state”.
• This indicates that inspiratory time is too long for this patient.

Is it Inadequate insp. Time??
No . In spontaneous mode it is decided by the patient
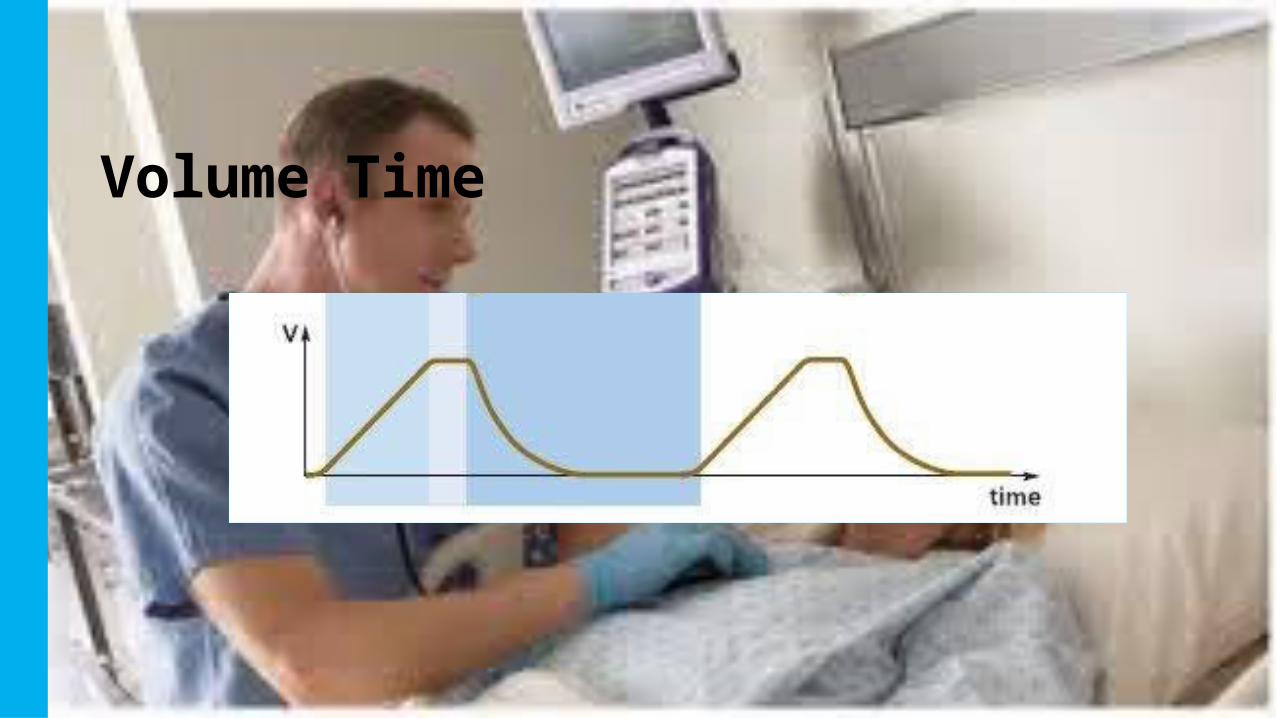
Volume Time
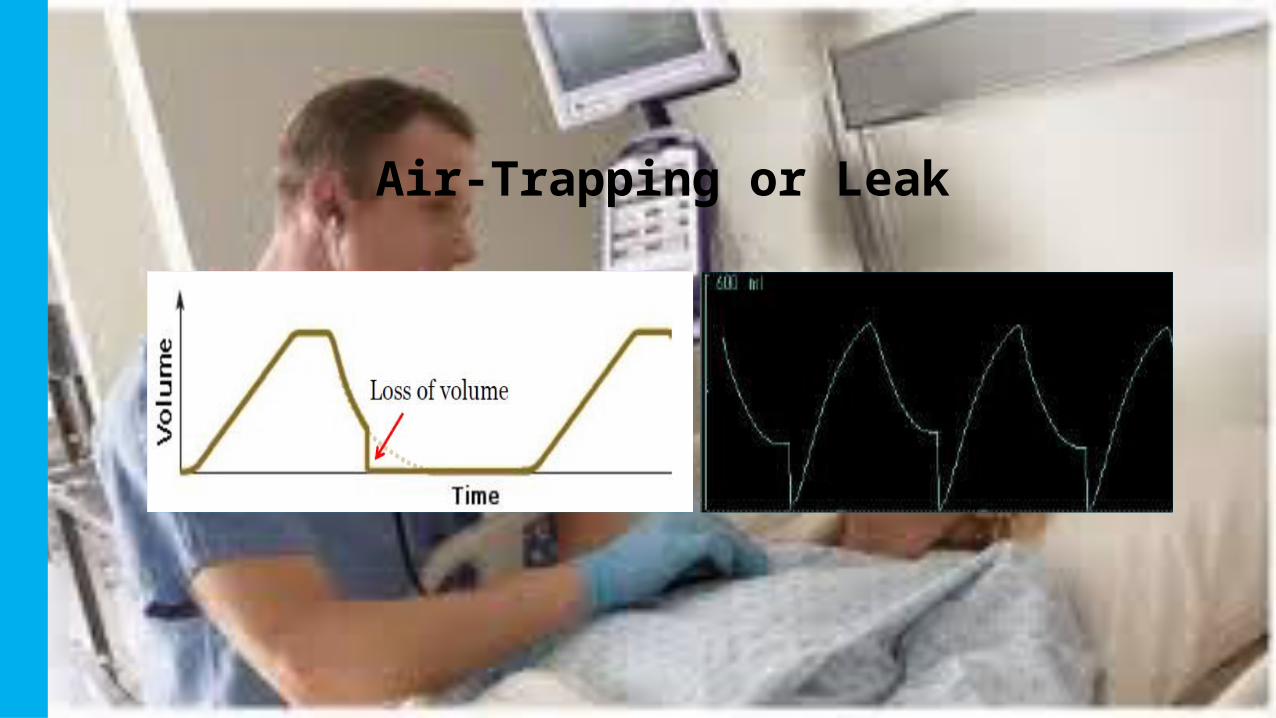
Air-Trapping or Leak

Pressure / Volume loopsDynamic Compliance

Over distention/DHI
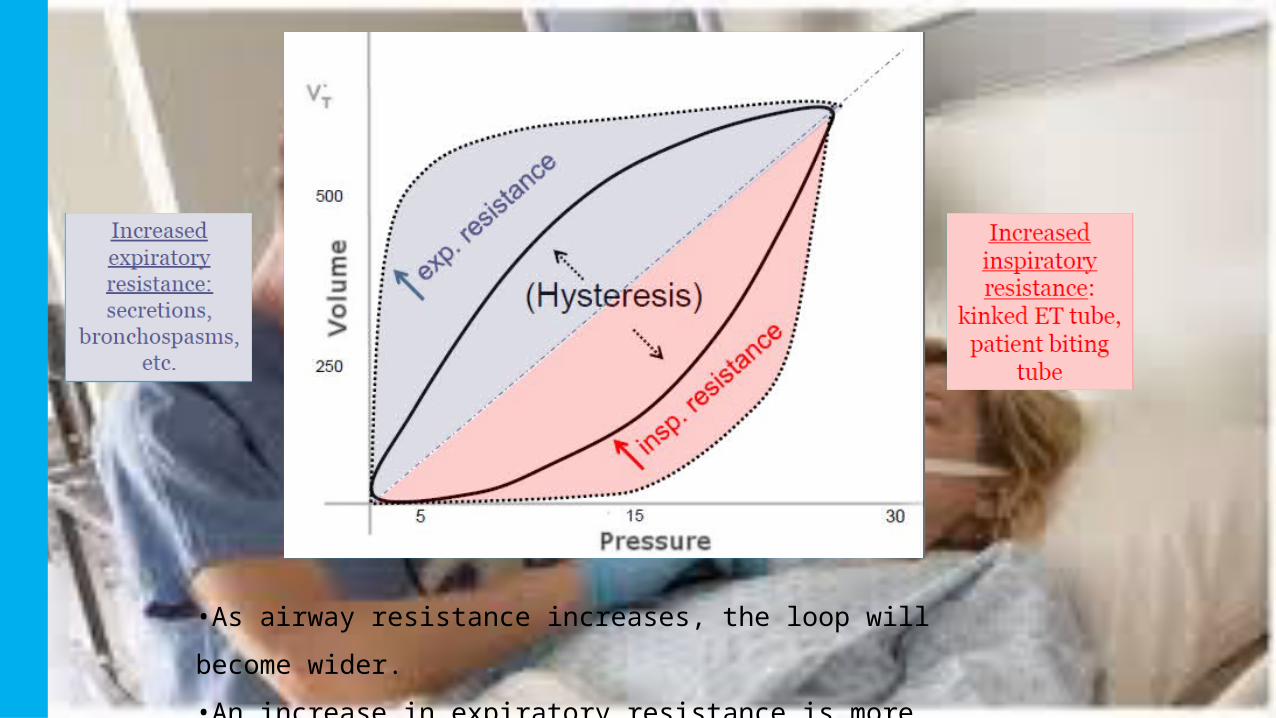
•As airway resistance increases, the loop will become wider.
•An increase in expiratory resistance is more commonly
seen.

Example: Emphysema Example: ARDS, CHF, Atelectasis
Increased Compliance Decreased Compliance

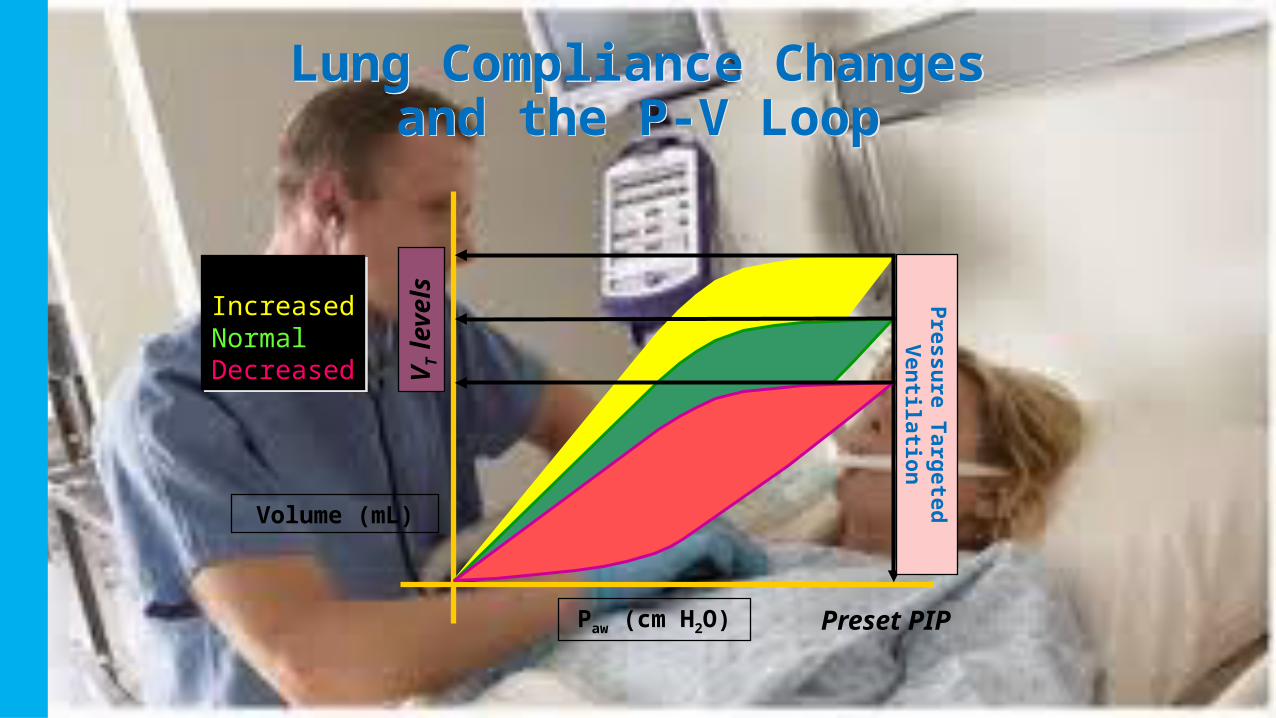
Lung Compliance Changes and the P-V Loop
Lung Compliance Changes and the P-V Loop
Volume (mL)
PIP levels
Preset VT
Paw (cm H2O)
COMPLIANCEIncreasedNormalDecreased
COMPLIANCEIncreasedNormalDecreased
Volume Targeted Ventilation
Lung Compliance Changes and the P-V Loop
Lung Compliance Changes and the P-V Loop
Volume (mL)
Preset PIP
VT
levels
Paw (cm H2O)
COMPLIANCEIncreasedNormalDecreased
COMPLIANCEIncreasedNormalDecreased
Pre
ssu
re Ta
rgete
d
Ven
tilatio
n
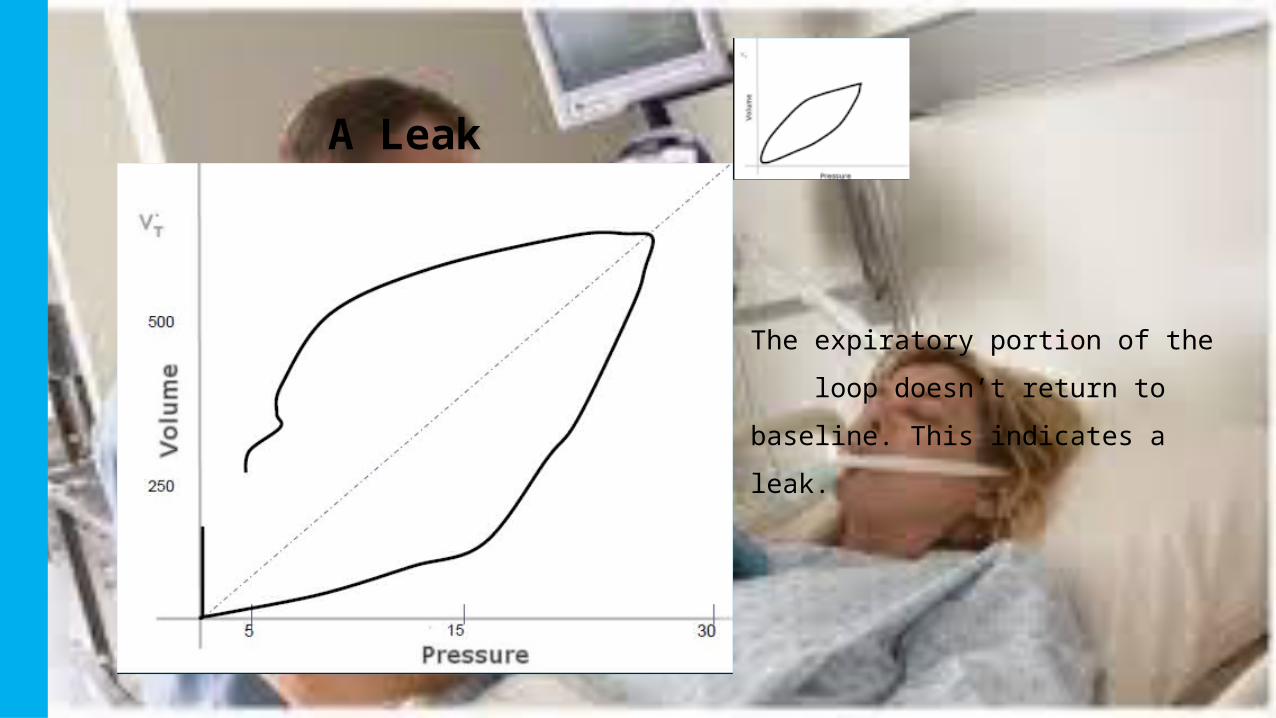
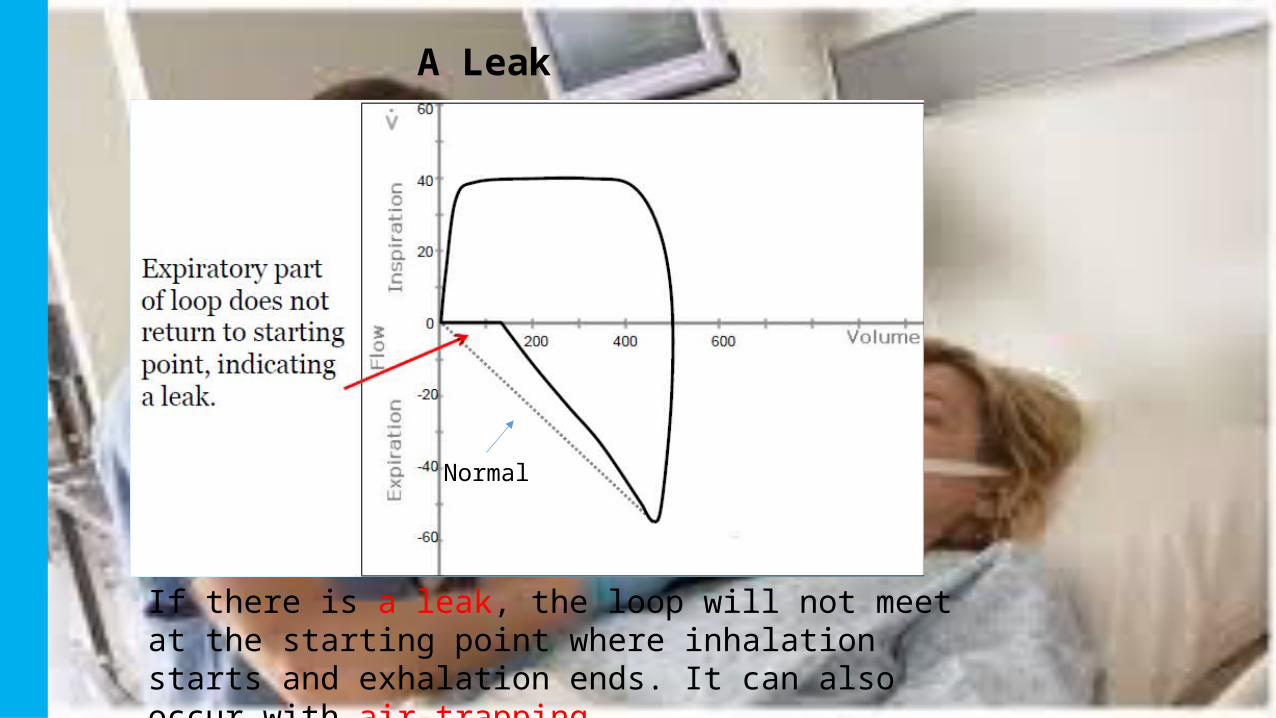
A Leak
The expiratory portion of the
loop doesn’t return to baseline.
This indicates a leak.

Pressure / Volume Loop

The shape of the inspiratory portion of the curve will
match the flow waveform.
Normal
A Leak
If there is a leak, the loop will not meet at the starting point where inhalation starts and exhalation ends. It can also occur with air-trapping.

Airway Obstruction

The inspiratory portion of the pressure wave shows a
“dip”, due to inadequate flow.
Flow Starvation

Hemodynamics
• Important to understand Thoracic physiology – Heart & Lung.• Normally the Negative Plural Pressure
augments the venous return to RA and thus increases CO
• So Output increases during Inspiration than Expiration.
• But in case of Positive Pressure it differs
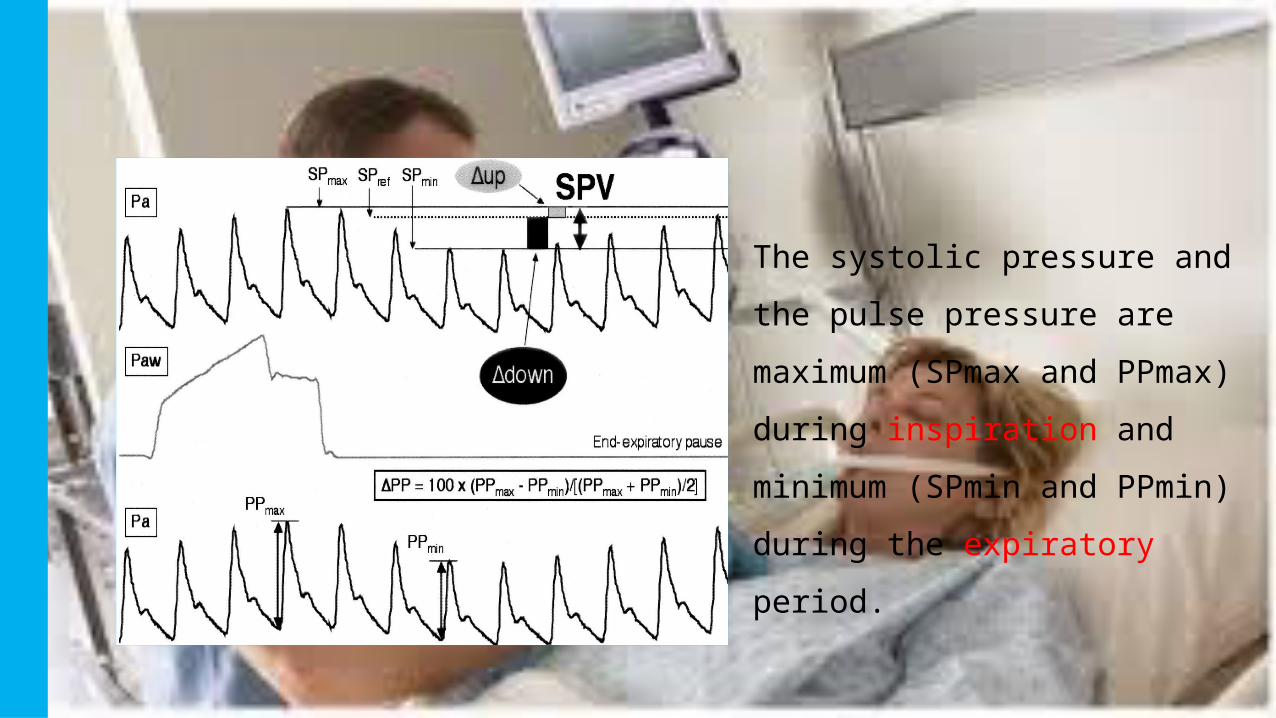
The systolic pressure and the
pulse pressure are maximum
(SPmax and PPmax) during
inspiration and minimum (SPmin
and PPmin) during the
expiratory period.

In hypovolemic conditions
(1) RV preload decreases becausethe increase in pleural pressure induces a compression of thesuperior vena cava (2) an increase in intramural right atrial pressure
(3) RV afterload increases because pulmonary capillaries are compressed.(4) The increase in alveolar pressure squeezes out the blood contained in the capillaries toward the left side of the heart.
(5) The increase in pleural pressure induces a decrease in left ventricular afterload

In hypervolemic conditions
The vena cava and right atrium are poorly compliant and compressible and hence relatively insensitive to changes in pleural pressure
(4) Each mechanical breath increases pulmonary venous flow and left ventricular preload
(5) The increase in pleural pressure induces a decrease in left ventricular afterload .

Capnography
• Measures End-tidal CO2 (EtCO2)
• Monitors changes in
• Ventilation - asthma, COPD, airway edema, foreign body, stroke
• Diffusion - pulmonary edema, alveolar damage, CO poisoning, smoke inhalation
• Perfusion - shock, pulmonary embolus, cardiac arrest, severe dysrhythmias
• Gold Standard for confirming Intubation
• Reports quality of CPR

Normal
45
0
Normal range is 35-45mm Hg (5% vol)

Waveform
A
B
CD
EBaseline
Ascending Phase of Exhalation
Alveolar Plateau
Descending phase of Inhalation
End-tidal

0
45
Hypoventilation
45
0
Hyperventilation
45
0
Normal

45
0
Normal
Bronchospasm
45
0

SPO₂• Works at two different wavelengths absorbed by oxy and deoxy Hb
and the gradient is used to calculate Hb saturation.• Different models of probes available.• Very useful to pick Pt deterioration.• Pros :• Mobile• All time wearable• Real time monitor• Cheap
Cons :• Sats < 85 % are unreliable• Impedance disturbances• Picks little late • Cannot measure MetHb, SulHb• Altered with shock state, nail
polish, dyes etc

CXR• Useful for properly locating the ET• Diagnosing issues.• Follow Up of Disease.

ABG
• Its out of scope for this Session.
• Check Ph
• Metabolic side(HCO3) / Respiratory Side(PCO2)
• Compensated/ Uncompensated
• Any ventilator change can alter it.
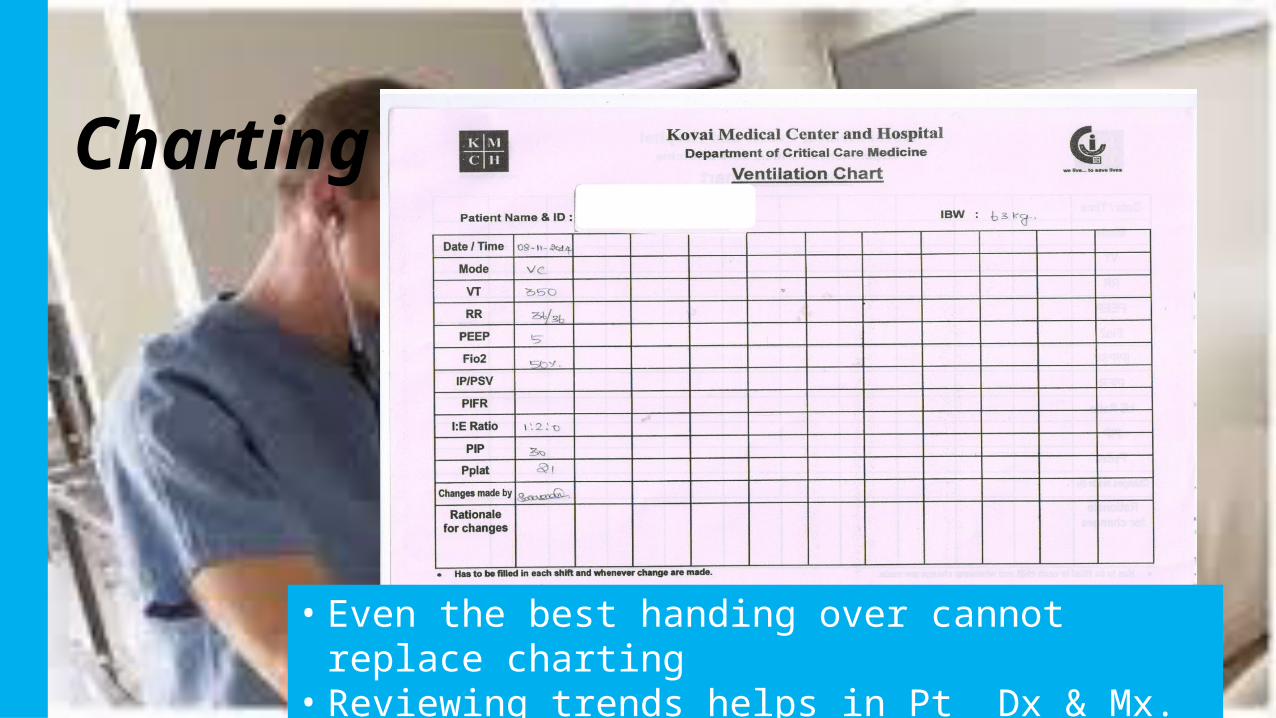
Charting
• Even the best handing over cannot replace charting• Reviewing trends helps in Pt Dx & Mx.

Language is not a barrier here & I am not the best in English.