MONITORING UNIVERSAL HEALTH COVERAGE IN THE WESTERN … · Monitoring universal health coverage in...
30
MONITORING UNIVERSAL HEALTH COVERAGE IN THE WESTERN PACIFIC FRAMEWORK, INDICATORS, AND DASHBOARD
Transcript of MONITORING UNIVERSAL HEALTH COVERAGE IN THE WESTERN … · Monitoring universal health coverage in...

MONITORING UNIVERSAL HEALTH COVERAGE IN THE WESTERN PACIFICFRAMEWORK, INDICATORS, AND DASHBOARD

MONITORING UNIVERSAL HEALTH COVERAGE IN THE WESTERN PACIFICFRAMEWORK, INDICATORS, AND DASHBOARD

Printed on recycled paper
Creative Commons Attribution 3.0 IGO license (CC BY 3.0 IGO)
© 2016 Asian Development Bank and the World Health OrganizationAsian Development Bank6 ADB Avenue, Mandaluyong City, 1550 Metro Manila, PhilippinesTel +63 2 632 4444; Fax +63 2 636 2444www.adb.org
Some rights reserved. Published in 2016. Printed in the Philippines.
ISBN 978-92-9257-599-1 (Print), 978-92-9257-600-4 (e-ISBN)Publication Stock No. RPT168435-2
Cataloging-In-Publication Data
Asian Development Bank. Monitoring universal health coverage in the Western Pacific: Framework, indicators, and dashboard.Mandaluyong City, Philippines: Asian Development Bank, 2016.
1. Sustainable development.��2. Health.��I. Asian Development Bank.
The designations employed and the presentation of the material in this publication do not imply the expression of any opinion whatsoever on the part of the Asian Development Bank (ADB) and the World Health Organization (WHO) concerning the legal status of any country, territory, city, or area or of its authorities, or concerning the delimitation of its frontiers or boundaries.
This publication follows ADB’s practice in reference to its members. Where there are space constraints, some country names have been abbreviated.
The mention of specific companies or of certain manufacturers’ products does not imply that they are endorsed or recommended by ADB and WHO in preference to others of a similar nature that are not mentioned. Errors and omissions excepted, the names of proprietary products are distinguished by initial capital letters.
All reasonable precautions have been taken by ADB and WHO to verify the information contained in this publication. However, the published material is being distributed without warranty of any kind, either expressed or implied. The responsibility for the interpretation and use of the material lies with the reader. In no event shall ADB and WHO be liable for damages arising from its use.
This work is available from the ADB website www.adb.org under the Creative Commons Attribution 3.0 IGO license (CC BY 3.0 IGO) https://creativecommons.org/licenses/by/3.0/igo/. By using the content of this publication, you agree to be bound by the terms of this license.
This CC license does not apply to non-ADB and non-WHO copyright materials in this publication. If the material is attributed to another source, please contact the copyright owner or publisher of that source for permission to reproduce it. ADB and WHO cannot be held liable for any claims that arise as a result of your use of the material.
Please contact [email protected] if you have questions or comments with respect to content, or if you wish to obtain copyright permission for your intended use that does not fall within these terms, or for permission to use the ADB logo.
Publications of the World Health Organization are available on the WHO website (www.who.int) or can be purchased from WHO Press, World Health Organization, 20 Avenue Appia, 1211 Geneva 27, Switzerland (tel.: +41 22 791 3264; fax: +41 22 791 4857; e-mail: [email protected]).
Notes:In this publication, “$” refers to US dollars.Corrigenda to ADB publications may be found at http://www.adb.org/publications/corrigenda
World Health OrganizationRegional Office for the Western PacificP.O. Box 2932, Manila 1000Tel: +63 2 528 8001; Fax: +63 2 521 1036 or 526 0279www.wpro.who.int

�iii
FIGURES iv
ABBREVIATIONS v
AUTHORS vi
EXECUTIVE SUMMARY vii
INTRODUCTION 1
MONITORING FRAMEWORK FOR UNIVERSAL HEALTH COVERAGE 3
UNIVERSAL HEALTH COVERAGE INDICATORS FOR THE WESTERN PACIFIC BASED ON THE HEALTH-RELATED SUSTAINABLE DEVELOPMENT GOALS 63.1 Using the Framework and Indicators 73.2 Country Experiences on Indicator Rationalization and Dashboard Development 83.3 Challenges in Data Availability 11
UNIVERSAL HEALTH COVERAGE DASHBOARD 12
THE WAY FORWARD 15
APPENDIX: Draft Reference List of Core Indicators to Monitor Health System Performance, 17 Universal Health Coverage, and the Health-Related Sustainable Development Goals
REFERENCES 18
CONTENTS
1
2
3
4
5

iv�
1 Health System Performance Framework to Achieve the Health-Related Sustainable Development Goals and Universal Health Coverage in the Western Pacific 4
2 Core Universal Health Coverage Indicators for the Western Pacific Based on the Health-Related Sustainable Development Goals 7
3 Universal Health Coverage Framework View through the Life Course 8
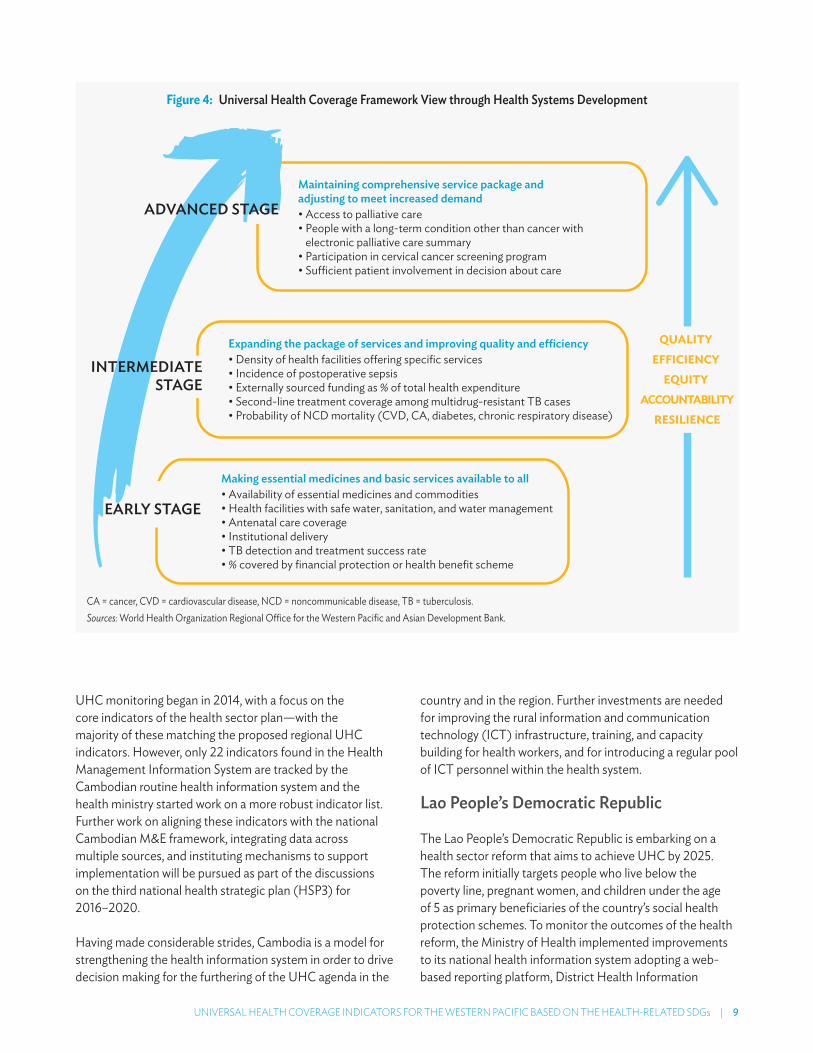
4 Universal Health Coverage Framework View through Health Systems Development 9
5 Universal Health Coverage Dashboard Featuring Country-Level View 13
6 Regional Comparison of Financial Risk Protection 13
7 Immunization Coverage by Mother’s Educational Level 14
FIGURES

�v
ADB Asian Development Bank
DHIS2 District Health Information System 2
ICT information and communication technology
KP Kalusugan Pangkalahatan (Achieving Universal Health Care for All Filipinos)
M&E monitoring and evaluation
MDG Millennium Development Goal
SDG Sustainable Development Goal
UHC universal health coverage
WHO World Health Organization
ABBREVIATIONS

vi�
�� Rosebelle May Azcuna is a health information specialist and consultant for the Asian Development Bank (ADB) and the World Health Organization (WHO).
�� Anjana Bhushan is the coordinator (Equity and Social Determinants) in the Division of Health Systems at the WHO Regional Office for the Western Pacific.
�� Mark Landry is the regional advisor for Health Situation and Trend Assessment in the Health Systems Development Department in the WHO Regional Office for South-East Asia in New Delhi.
�� Vivian Lin is the director for Health Systems at the WHO Regional Office for the Western Pacific.
�� Jane Parry is a senior public health and development writer.
�� Susann Roth supports ADB’s health sector development and co-led the preparation of ADB’s revised Operational Plan for Health, which supports developing member countries in achieving universal health coverage.
�� Ke Xu is the coordinator for Health Policy and Financing in the Division of Health Systems at the WHO Regional Office for the Western Pacific.
AUTHORS

�vii
The launch of the Sustainable Development Goals (SDGs) ushers in a new way of approaching investments in development. The SDGs are integrated
and indivisible with a clear focus on equity, including equity-focused monitoring and evaluation (M&E), to ensure not only that the targets are being met but also that no one is left behind. Member states of the United Nations have agreed on a range of indicators to track progress toward health for all in the SDGs. Adequately measuring progress to inform health policy making will require investment in statistical and qualitative research and in strengthening health information systems.
The new approach heralded by the SDGs coincides with renewed emphasis across Asia and the Pacific toward attaining universal health coverage (UHC)—equitable access to quality health services without undue financial hardship. Indeed, UHC is a specific target within SDG 3. As countries move toward UHC, the need to monitor the performance of the health system goes beyond service delivery and financial management to encompass newer issues such as quality of care, people-centeredness, equity, efficiency, transparency, and resilience.
The diversity of countries in the Western Pacific requires a flexible yet universal approach in order to meet national M&E requirements. At the same time, this should allow for regional and global tracking and comparisons, as well as links with social information systems that conduct the required M&E for the SDGs.
To guide the monitoring of UHC progress and to make results more comparable within the region, the World Health Organization (WHO) Regional Office for the Western Pacific and the Asian Development Bank (ADB) are developing a regional monitoring framework and a proposed set of core indicators. The development of a regional UHC
EXECUTIVE SUMMARY
dashboard is also under way to visualize UHC indicators readily available from country information systems and from global databases. This will enable policy makers to make more evidence-informed decisions and the tool will also support countries’ need for better accountability.
The framework puts individuals and families at the center, supported by their communities and social networks. It comprises four main M&E domains: inputs and processes, outputs, outcomes, and impacts. Additionally, the framework highlights key actors within the health sector and other sectors (e.g., finance, housing, education, public works, and transportation), as well as a range of stakeholders, including communities and their social networks.
For countries beginning the process, a pared-down list of core indicators is proposed. As countries move further along in the process of monitoring progress toward UHC, other core indicators from the expanded list of over 100 indicators developed by the WHO Regional Office for the Western Pacific and ADB can be added as appropriate.
A core requirement in monitoring health system performance and progress toward UHC and the SDGs is the assessment of inequities across population groups. Thus, in addition to providing national averages,
The SDGs are integrated and indivisible with a clear focus on equity, including equity-focused monitoring and evaluation (M&E), to ensure not only that the targets are being met but also that no one is left behind.

viii�|�EXECUTIVE SUMMARY
countries will collect and analyze data disaggregated by key demographic factors (such as age, sex, and place of residence) and socioeconomic stratifiers (such as education and wealth). Countries will be increasingly able to use the results of such analysis to refine policies and programs and thereby will help reduce inequities in service access and coverage, as well as in health and well-being.
While information has become more regularly available for Millennium Development Goals-related indicators, there are challenges in obtaining data for some of the new health issues included in the SDGs, such as noncommunicable diseases, disability, mental health, and injuries, and this requires further investments in health management information systems. There are also difficulties obtaining data for health system inputs and outputs. For example, there is a dearth of surveys to measure availability of and access to essential medicines. Very limited data exist to measure service availability and readiness, quality, and people-centeredness of health facilities. Lastly, there is lack of disaggregated information and generally weak capacity in countries to undertake equity-focused analysis of information and use it to refine policy making and implementation.
Countries will be increasingly able to use the results of such analysis to refine policies and programs and thereby will help reduce inequities in service access and coverage, as well as in health and well-being.

Adequately measuring progress to inform health policy making will require investment in statistical and qualitative research and in strengthening health information systems.

A core requirement in monitoring health system performance and progress toward UHC and the SDGs is the assessment of inequities across population groups.

�1
INTRODUCTION
The launch of the United Nations Sustainable Development Goals (SDGs) ushers in a new way of approaching investments in development.
Whereas the Millennium Development Goals (MDGs) with their discrete and separate targets led to a silo approach, the SDGs are integrated and indivisible. They have a clear focus on equity, including equity-focused monitoring and evaluation (M&E) to ensure not only that the SDG targets are being met but also that no one is being left behind. The health-related SDGs all need indicators, which require investment in statistical and qualitative research and in strengthening health information systems.
The benefits of robust M&E go beyond understanding and tracking progress. Once that mechanism is in place, countries become better positioned to harness innovative financing to increase the sustainability of health care financing and scale up successful pilot initiatives. Sound M&E is also a foundation for better collaboration with the private sector and for better-quality health service delivery.
To reach UHC, governments need a clear understanding of the population’s demographic profile, socioeconomic development, and health priorities. Monitoring the performance of the health system is critical. It informs policy and planning to provide the right mix of quality services and to support appropriate financing strategies. By regular monitoring of key UHC performance indicators, governments can adjust health services to ensure progress toward UHC. Insufficient evidence has been gathered at the national level on the extent to which countries have been monitoring UHC to date. The discussion at the country level so far has focused on the financial dimension of UHC, neglecting the dimensions of service quality and equitable access.
The diversity of countries in the Western Pacific requires a flexible yet universal approach in order to meet national M&E requirements. At the same time, this should allow for regional and global tracking and comparisons, as well as links with social information systems that conduct the required M&E for the SDGs. To guide the monitoring of UHC progress and to begin to make results more comparable within the region, the World Health Organization (WHO) Regional Office for the Western Pacific and the Asian Development Bank (ADB) are developing a regional monitoring framework and a proposed set of core indicators. The development of a regional UHC dashboard is also in progress to start to visualize UHC indicators readily available from country information systems and from global databases. This will enable policy makers to make more evidence-informed decisions.
The SDGs have a clear focus on equity, including equity-focused monitoring and evaluation to ensure not only that the SDG targets are being met but also that no one is being left behind.
The new approach heralded by the SDGs coincides with renewed emphasis across Asia and the Pacific toward attaining universal health coverage (UHC)—equitable access to quality health services without undue financial hardship. Indeed, UHC is a specific target within SDG 3. As countries move toward UHC, the need to monitor the performance of the health system goes beyond service delivery and financial management to encompass newer issues such as quality of care, people-centeredness, efficiency, transparency, and resilience. This too requires a fundamental commitment to durable M&E reflected in national health policies, strategies, and plans. These plans then need to be backed up with a robust M&E structure.
1

2�|�MONITORING UNIVERSAL HEALTH COVERAGE IN THE WESTERN PACIFIC
The framework and the indicator list are designed to be flexible and adaptable to the country context and health sector development programs, and to be readily implemented with direct linkages to existing country health information systems and indicator reporting systems. They also have the capacity to include additional indicators as country UHC M&E requirements evolve and national reporting systems improve. This is a significant step forward because there are no readily available country publications or assessments on UHC.
The proposed M&E framework empowers both governments and development partners. It enables them to track progress; identify reform efficiencies and improvements in other key dimensions such as equity, quality, resilience, and people-centeredness; monitor health systems performance; develop health sector programs supported by development partners with clear performance targets; and improve coordination at all levels.
The framework and the indicator list are designed
to be flexible and adaptable to the country
context and health sector development programs,
and to be readily implemented with direct linkages
to existing country health information systems
and indicator reporting systems.
�3
MONITORING FRAMEWORK FOR UNIVERSAL HEALTH COVERAGE
The regional monitoring framework for UHC answers the need for a systematic way to assess progress toward UHC both within countries and in comparison
with peer countries elsewhere in the region. It is designed to set monitoring requirements for tracking progress across all three domains of UHC (equitable access, quality health services, and financial protection) and the five health system attributes outlined in the Universal Health Coverage: Moving towards Better Health – Action Framework for the Western Pacific Region (quality, efficiency, equity, accountability, and resilience). The service coverage domain includes not only levels and distribution of provision but also the extent to which they match the country’s disease burden and operate across all stages of care. Analysis of this information can then guide the planning, design, and monitoring of system inputs and outputs to reach UHC and sustain progress. In this way, the framework can be used as an advocacy and accountability tool. One critical component of the framework is that while the focus is on UHC, it also considers broader health system performance. It also follows a logical approach from input to impact and highlights the role of the health sector and other sectors, as well as old and new stakeholders.
The framework was developed through discussions within the UHC technical advisory group, comprising technical teams of the Division of Health Systems of the WHO Regional Office for the Western Pacific and ADB staff, and among the different WHO technical teams (Figure 1). The group also reviewed relevant global and regional frameworks and ensured that the UHC monitoring framework is aligned with the WHO–World Bank global framework for monitoring UHC (Boerma et al. 2014). It integrates key elements from other global and national health monitoring frameworks, including the framework for health systems performance (WHO 2011), quality (OECD 2006), and social determinants of
health (WHO 2010). Feedback was also gathered from country experts through the WHO Consultation on Universal Health Coverage in the Western Pacific Region held in June 2015.
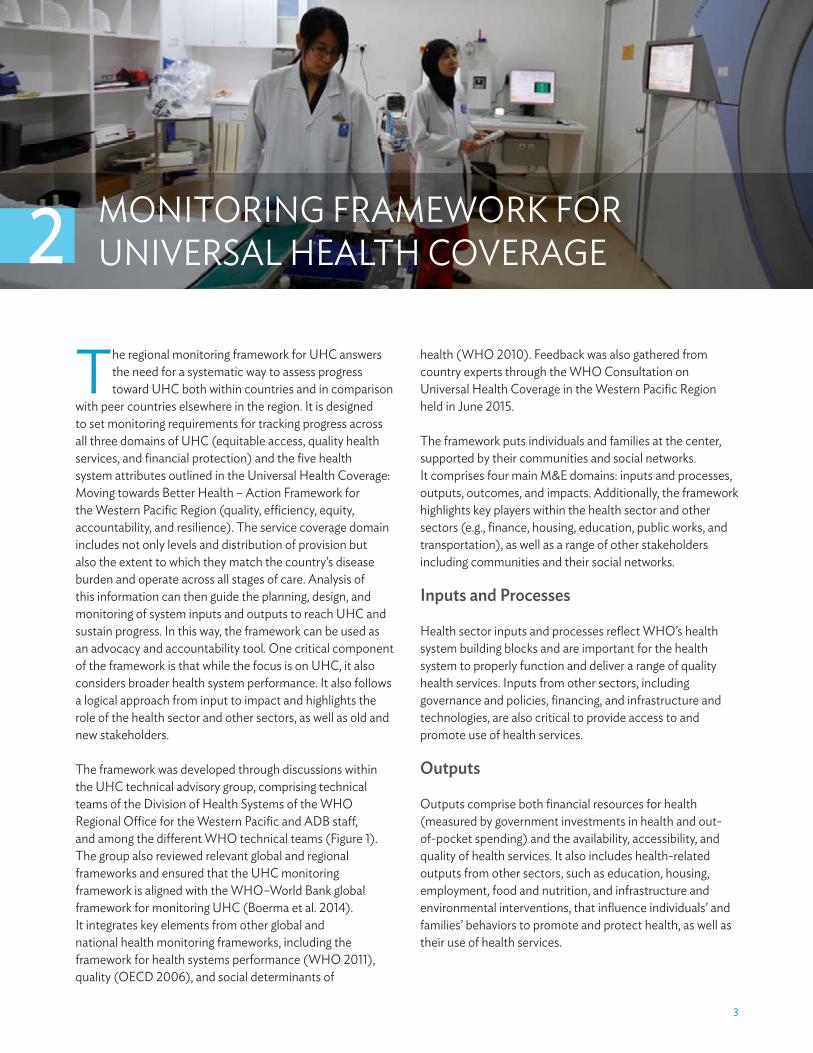
The framework puts individuals and families at the center, supported by their communities and social networks. It comprises four main M&E domains: inputs and processes, outputs, outcomes, and impacts. Additionally, the framework highlights key players within the health sector and other sectors (e.g., finance, housing, education, public works, and transportation), as well as a range of other stakeholders including communities and their social networks.
Inputs and Processes
Health sector inputs and processes reflect WHO’s health system building blocks and are important for the health system to properly function and deliver a range of quality health services. Inputs from other sectors, including governance and policies, financing, and infrastructure and technologies, are also critical to provide access to and promote use of health services.
Outputs
Outputs comprise both financial resources for health (measured by government investments in health and out-of-pocket spending) and the availability, accessibility, and quality of health services. It also includes health-related outputs from other sectors, such as education, housing, employment, food and nutrition, and infrastructure and environmental interventions, that influence individuals’ and families’ behaviors to promote and protect health, as well as their use of health services.
2

4�|�MONITORING UNIVERSAL HEALTH COVERAGE IN THE WESTERN PACIFIC
Figure 1: Health System Performance Framework to Achieve the Health-Related Sustainable Development Goals and Universal Health Coverage in the Western Pacific
INDIVIDUALS AND FAMILIES
COMMUNITIES AND SOCIAL NETWORKS
HEALTH SECTOR OTHER SECTORSINPUTS AND PROCESSES OUTPUTS OUTCOMES IMPACTS
Health sector
Other sectors
Household andsocietal impact
Population health
Health system
Household health-relatedexpenditure
Health service coverage
Lifestyle factorsand practices
Health financing
Health service delivery
Health-related interventions and social determinants
Sources: World Health Organization Regional Office for the Western Pacific and Asian Development Bank.
Outcomes
Measurable outcomes include intervention coverage (from promotive, preventive, curative, rehabilitative, and palliative health services) and financial risk protection measured by the reduction of household catastrophic health expenditure. Healthy lifestyles, such as physical activity and good nutrition, as a result of health-related promotive interventions are also measurable outcomes.
Impacts
The impact of the system can be measured at the household and societal level in terms of financial and health security and well-being, as well as by the status of the population’s health. Health system performance can also be measured in terms of quality, efficiency, equity, accountability, and resilience.

MONITORING FRAMEWORK FOR UNIVERSAL HEALTH COVERAGE�|�5
The framework was developed to be adaptable to a country’s demographic, economic, and epidemiological conditions. It can be used by governments as a guide on key system inputs, processes, and outputs to consider in relation to dimensions of financial risk protection and service coverage. This then can be the basis for the development of national UHC frameworks.
The UHC-related dimensions of the M&E domains in the framework can be used to demonstrate performance of health system interventions in achieving UHC and in meeting the SDGs. They can also be used to identify core indicators that will define the required M&E efforts—from data collection, to quality assessment, analysis, and use in decision making.
The framework is not designed as an additional M&E tool for the health sector, but as one comprehensive tool that will combine all M&E requirements for governments. In addition to the health ministry, the tool encompasses the work of other parts of government responsible for related socioeconomic factors, including infrastructure, food, education, social welfare, and culture.
The UHC-related dimensions of the M&E domains
in the framework can be used to demonstrate
performance of health system interventions in
achieving UHC and in meeting the SDGs.

6�
The regional monitoring framework is accompanied by a reference list of core indicators (Appendix 1). This list includes proposed tracer indicators to
measure the level of coverage of health interventions and financial risk protection, the focus of monitoring progress toward UHC (WHO 2012). Also included are proposed tracer indicators for health system inputs, processes, outputs, and health attributes. Linking data for these indicators to data on health service reach and financial risk protection coverage as well as to population health will allow assessment of the overall performance of the health system and can guide health system strengthening efforts.
Tracer indicators are also identified for health-related initiatives from other sectors (e.g., education, water, and sanitation) and social determinants of health, as well as for lifestyle factors and practices, as these dimensions significantly contribute to health service intervention use and coverage and also impact population health. Additional outcome and impact indicators were added to emphasize common challenges across the region, including noncommunicable diseases and the unfinished business of the MDGs in maternal and child health, tuberculosis, HIV, and malaria. Countries can choose which indicators to use, based on their national circumstances and priorities.
The proposed reference list indicators for the region are aligned to the latest guidance on SDG targets and indicators and to the WHO Global Reference List of 100 Core Health Indicators to the best extent possible to be harmonized with global reporting requirements. This can maximize their use for national policy and planning and minimize the burden of reporting from countries. The majority of these proposed UHC indicators and their data requirements are available in existing country M&E systems in the region.
For countries beginning the process, there is a pared-down list of core indicators that is a subset of the longer reference list (Figure 2). The proposed core indicators were based on the proposed indicators for the health-related SDGs and mapped across the different dimensions of the UHC framework. This ensures that there will be no added administrative or cost burden to countries when they monitor UHC and the health-related SDGs.
As countries develop stronger information systems and capabilities to assess progress toward UHC, other core indicators from the expanded list of over 100 indicators can be added as appropriate.
UNIVERSAL HEALTH COVERAGE INDICATORS FOR THE WESTERN PACIFIC BASED ON THE HEALTH-RELATED SUSTAINABLE DEVELOPMENT GOALS
3

UNIVERSAL HEALTH COVERAGE INDICATORS FOR THE WESTERN PACIFIC BASED ON THE HEALTH-RELATED SDGs�|�7
A core requirement in monitoring health system performance and progress toward UHC and the SDGs is the assessment of within-country inequities across population groups. Thus, in addition to providing national averages, countries will need to collect data disaggregated by demographic factors (age, sex, and place of residence) and socioeconomic groups (education and wealth), as required for the SDGs. Analysis of such information and its use in refining polices and programs will help reduce inequities in service access and coverage, as well as in health and well-being.
Figure 2: Core Universal Health Coverage Indicators for the Western Pacific Based on the Health-Related Sustainable Development Goals
INPUTS AND PROCESSES REACH AND OUTCOMES IMPACTSOUTPUTS
HEALTH WORKFORCE Health worker density and
distributiona,b
MEDICINES ANDTECHNOLOGIES
Availability of essential medicines and commoditiesa,b
HEALTH INFORMATIONAND SURVEILLANCESYSTEMS
Birth registration coverage (children<5)a,b
HEALTH FINANCINGGovernment health spendingTotal health expenditure (% of GDP)
HEALTH SERVICEDELIVERYAvailability and readiness
Meeting and sustaining IHR core capacities
Accessibility Median consumer price
ratio of selected generic medicinesb
HEALTH-RELATEDINTERVENTIONS ANDSOCIAL DETERMINANTS
Population using improved drinking water sourcesa,b
Population using improved sanitation facilitiesa,b
Mean urban air pollution of particulate mattera
HOUSEHOLDHEALTH-RELATEDFINANCIAL SECURITY
Impoverishing health expenditurea,b
POPULATION HEALTHMorbidity and mortality
Under-5 mortality ratea,b Maternal mortality ratioa,b HIV incidencea,b Tuberculosis incidencea,b
Malaria incidencea,b
Hepatitis B incidenceb
Mortality rate due to CVD, cancer, diabetes, or chronic respiratory disease between 30 and 70a,b
Road traffic deathsa,b
HOUSEHOLDHEALTH-RELATEDEXPENDITURE
Catastrophic health expenditurea,b
HEALTH SERVICE COVERAGEPromotive and preventive care
Family planning coverageb Antenatal care coverage
(4+ visits)a,b Skilled birth attendancea,b DTP3-containing vaccinea,b
Deworming of school-age childrena,b
Curative care Antiretroviral therapy coveragea,b Tuberculosis treatment
coveragea,b Treatment for substance
abuse disordersb Hypertension treatment
coverageb Diabetes treatment coverageb
Cataract surgical coverageb
LIFESTYLE FACTORS ANDPRACTICES
Children<5 stunteda,b Tobacco usea,b Intimate partner violence
prevalencea
SDG Goal 3 indicators (16) Health-related SDG indicators (5) World Health Organization–World Bank tracer indicators for service and financial risk protection coverage (11)
CVD = cardiovascular disease; DTP = diphtheria, tetanus, and pertussis (whooping cough); IHR = International Health Regulations; SDG = Sustainable Development Goal. Note: Total of 34 indicators, updated June 2016.a Included in the Global Reference List of 100 Core Health Indicators (25).b Indicators where stratified equity analysis is recommended (partial list).Sources: World Health Organization Regional Office for the Western Pacific and Asian Development Bank.
3.1 Using the Framework and Indicators
There are multiple ways to conceptualize the role of UHC indicators, including through the life course (Figure 3). The framework dimensions and indicators in the proposed M&E tools for the region allow flexibility of use and reporting to serve different purposes and priorities.
UHC indicators can also be bundled into core, expanded, and optimal sets, or through a health systems development view to highlight monitoring different packages of health system services and interventions at each level of health system maturity (Figure 4). Each country should be guided

8�|�MONITORING UNIVERSAL HEALTH COVERAGE IN THE WESTERN PACIFIC
Figure 3: Universal Health Coverage Framework View through the Life Course
Health servicecoverage
Financing riskprotection
Health impactthrough the
life course
Health systemresources,
capacity, andperformance
Socialdeterminants
of health ANC4 = antenatal care, four visits; DTP = diphtheria, tetanus, and pertussis (whooping cough); GDP = gross domestic product; MDR = multidrug-resistant; NCD = noncommunicable disease; OOP = out of pocket; TB = tuberculosis.Sources: World Health Organization Regional Office for the Western Pacific and Asian Development Bank.
by their national health policies, priorities, strategies, and capacity for implementing their appropriate national M&E framework and measuring UHC and the SDGs.
3.2 Country Experiences on Indicator Rationalization and Dashboard Development
With ADB support, Cambodia and the Lao People’s Democratic Republic have initiated work on national UHC monitoring dashboards. In the Philippines, this work was done at the national level, and ADB is supporting a subnational project in Davao.
Cambodia
Cambodia’s commitment to UHC is enshrined in its Second Health Strategic Plan (HSP2) for 2008–2015. In 2010, the Cambodia Health Management Information System was created by the Ministry of Health, with the support of development partners, to respond to the need for more accurate, timely, and reliable health information. The database integrates 20 sources of data into a single reporting system with standardized recording and reporting templates to avoid additional workload and data duplication. Currently, it allows for direct data capture at the point of care nationwide from 1,100 health centers, 65 referral hospitals, 25 provincial hospitals, 8 national hospitals, and 2 nongovernment organization-supported hospitals.
UNIVERSAL HEALTH COVERAGE INDICATORS FOR THE WESTERN PACIFIC BASED ON THE HEALTH-RELATED SDGs�|�9
UHC monitoring began in 2014, with a focus on the core indicators of the health sector plan—with the majority of these matching the proposed regional UHC indicators. However, only 22 indicators found in the Health Management Information System are tracked by the Cambodian routine health information system and the health ministry started work on a more robust indicator list. Further work on aligning these indicators with the national Cambodian M&E framework, integrating data across multiple sources, and instituting mechanisms to support implementation will be pursued as part of the discussions on the third national health strategic plan (HSP3) for 2016–2020.
Having made considerable strides, Cambodia is a model for strengthening the health information system in order to drive decision making for the furthering of the UHC agenda in the
country and in the region. Further investments are needed for improving the rural information and communication technology (ICT) infrastructure, training, and capacity building for health workers, and for introducing a regular pool of ICT personnel within the health system.
Lao People’s Democratic Republic
The Lao People’s Democratic Republic is embarking on a health sector reform that aims to achieve UHC by 2025. The reform initially targets people who live below the poverty line, pregnant women, and children under the age of 5 as primary beneficiaries of the country’s social health protection schemes. To monitor the outcomes of the health reform, the Ministry of Health implemented improvements to its national health information system adopting a web-based reporting platform, District Health Information
Figure 4: Universal Health Coverage Framework View through Health Systems Development
INTERMEDIATESTAGE
EARLY STAGE
ADVANCED STAGE
QUALITY EFFICIENCY
EQUITY ACCOUNTABILITY
RESILIENCE
Expanding the package of services and improving quality and efficiency
Maintaining comprehensive service package andadjusting to meet increased demand
Making essential medicines and basic services available to all
CA = cancer, CVD = cardiovascular disease, NCD = noncommunicable disease, TB = tuberculosis.Sources: World Health Organization Regional Office for the Western Pacific and Asian Development Bank.

10�|�MONITORING UNIVERSAL HEALTH COVERAGE IN THE WESTERN PACIFIC
System 2 (DHIS2). All 18 of the country’s provinces use DHIS2 with positive feedback; regular reports from health centers to national levels of the health system can be produced from the system.
Enabling health workers and managers at the different levels of the system to access and visualize the data through dashboards and other graphical data representations has increased the demand for DHIS2. It is now regarded as not only a data management tool, but also a means to better understand the health situation and to aid decision making for planning and program implementation purposes. There is increasing interest for dashboards, and the Ministry of Health has developed an initial UHC dashboard to visualize priority maternal and child health indicators aligned with the country’s health sector reforms. To date, about 25 indicators have been identified, and considerations are being made to use routine data in DHIS2 as a means to provide a clear and comprehensive picture of UHC—including depicting status of equity—to health managers.
The implementation of UHC with ICT in the Lao People’s Democratic Republic sheds light on the importance of strong leadership from the Ministry of Health and having clear goals from the health reform strategy. Investments in ICT in the country have increased, and the internet backbone is in place nationwide. There is higher demand and appreciation for data among health workers across different levels of the health system. Coordination of support from development partners and other government bodies is important to foster an enabling environment for the optimal use of ICT tools.
Philippines
The Philippines’ aspiration for UHC is articulated in the Aquino Health Agenda: Achieving Universal Health Care for All Filipinos, more popularly known as Kalusugan Pangkalahatan (KP). The Philippines launched its UHC dashboard in 2013, with a core set of 19 UHC indicators to track financial risk protection, equity, service quality and coverage, and infrastructure improvements.
The KP dashboard indicators were vetted through a participatory process among Department of Health central and regional program directors and managers, the Philippine Health Insurance Corporation (PhilHealth), and other key health stakeholders. The indicators were also appraised against the WHO–World Bank M&E Framework for UHC. The KP dashboard was designed to graphically present trends in health care across the country, provide
disaggregated health data, and signal when certain indicators are off-track. A policy was also drafted to ensure its use and sustainability. To intensify national efforts to measure, monitor, and achieve UHC, the Department of Health progressively expanded and upgraded the Field Health Services Information System, the major source of health facility data; broadened discussions on strengthening the country’s health information system, including civil registration and vital statistics; and exploited the use of ICT for automated program monitoring.
Amid many challenges, it took the Philippines over a year to develop the KP dashboard. Outdated indicators had to be reviewed and amended. Building consensus and development of policies in support of KP monitoring required a thorough and exhaustive process. Populating the dashboard indicators with data was also met with the challenge of slow transmission of data from the front lines to the national health system due to the lack of ample technology infrastructure reaching all 7,107 islands of the Philippine archipelago, and due to the lack of skills on ICT use and health information management at the local levels. Nevertheless, the KP dashboard has seen good use. While originally designed for the Health Secretary to visualize KP outcomes, it has also helped provide a picture of UHC in the Philippines for other national stakeholders and development partners.
Davao Region
In addition to the national program, dashboards are also being developed to reflect subnational variations and to support local decision making and accountability. The aim of the Philippine Davao Region dashboards is to provide more granular data and indicators that monitor local system inputs and outputs and address health service coverage inequities. This is based on an extensive consultation with local government representatives and a process of indicator review and rationalization by each of the programs to be able to monitor and improve availability, quality, delivery, and utilization of services, as well as financial protection.
The dashboards are useful tools, alerting and facilitating timely action by the local government health department and to increase accountability of delivery of quality health programs in decentralized health systems. In addition, they are meant to be used to communicate and facilitate actions required from the other sectors and from the local chief executives who are responsible for health service delivery and financial protection programs in their respective municipalities.

UNIVERSAL HEALTH COVERAGE INDICATORS FOR THE WESTERN PACIFIC BASED ON THE HEALTH-RELATED SDGs�|�11
3.3 Challenges in Data Availability
While data are being made more regularly available for MDG-related indicators, there are challenges in obtaining data for noncommunicable diseases, disability, mental health, and injuries, and this requires further investments in health management information systems.
Countries lacking fully functioning civil registration and vital statistics (CRVS) systems are still reliant on estimation processes and surveys to derive mortality and morbidity data. Assessment of inequities in service coverage still relies on information gathered from Multiple Indicator Cluster Surveys (MICS) and Demographic and Health Surveys (DHS), which are conducted every 3–5 years in select countries in the region, mainly on maternal and child health.
There are also difficulties obtaining both quantitative and qualitative data for health system inputs and outputs. There is a dearth of surveys to measure the availability of and access to essential medicines. Very limited data exist to measure service availability and readiness in health facilities. Data on service quality, safety, and people-centered service delivery are also lacking, especially in
low- and middle-income countries. While data for health financing-related indicators are now more available, continued efforts are required to make data on financial risk protection more accessible. Appropriate indicators and data collection methods are also needed to measure and monitor health system attributes such as quality, accountability, and resilience. There is also a pressing need to move away from ad hoc development partner-financed surveys and instead implement rigorous, durable health management information systems.
The demand for data generated by the MDGs was catalytic in strengthening M&E capacities in countries and standardizing indicator definitions and measurement tools. While monitoring of the MDGs provides the foundation for monitoring the SDGs, there are still issues with data availability, accuracy, and timeliness. The SDGs require more detailed and robust monitoring than do the MDGs. They need data that reflect both national and subnational situations and can be disaggregated across relevant equity stratifiers. To support timely decision making and actions, data must be made available much faster. This requires countries to be less reliant on surveys and invest more in strengthening routine health information systems and national CRVS systems.
While data are being made more regularly available
for MDG-related indicators, there are challenges
in obtaining data for noncommunicable
diseases, disability, mental health, and injuries,
and this requires further investments in health
management information systems.

12�
UNIVERSAL HEALTH COVERAGE DASHBOARD
A regional UHC dashboard is also under development to explore key UHC indicators and provide region-level intelligence of country-specific UHC situations.
The dashboard is a web-based visualization tool that compiles information from multiple sources and synthesizes it into a user-friendly format. For development partners, the UHC dashboard will help develop and implement results-based financing investments to support UHC, health sector reforms, and the implementation of health information system and e-health strategies. For governments, the dashboard will help communicate progress made on health sector programs, UHC, and system performance.
The dashboard’s interactive features allow for user-defined selection of countries, indicators, equity stratifiers, and charts. It draws on data from the Health Information and Intelligence Platform of the WHO Regional Office for the Western Pacific, which integrates data for UHC-related indicators compiled from WHO’s yearly data call to its Member States, data collected by its technical programs, and data from global databases, including the WHO Global Health Observatory and the WHO Global Health Expenditure Database.
The regional UHC dashboard features a country-level view with four UHC-related themes: health financing, health service coverage, inequities in service coverage, and trends in health outcomes (Figure 5). Within these themes, the interactive dashboard allows flexible selection of indicators and type of data stratified to view inequities. For health service coverage, the dashboard allows users to set country targets and view country performance.
The dashboard can also be used to compare UHC indicators across the region. It currently allows comparison of country achievement in key health service coverage indicators and provides a regional summary of countries’ progress toward set regional targets.
For example, it is possible to visualize the country’s level of financial risk protection relative to others and across time (Figure 6). Similarly, immunization relative to mother’s educational level can easily be compared using the dashboard (Figure 7).
A regional UHC dashboard is also under
development to explore key UHC indicators and
provide region-level intelligence of country-specific
UHC situations. The dashboard is a web-based
visualization tool that compiles information
from multiple sources and synthesizes it into a
user-friendly format.
4

univErSal HEaltH covEragE daSHBoard | 13
Figure 5: Universal Health Coverage Dashboard featuring Country-level view
Sources: world health organization regional office for the western Pacific and asian development bank.
Figure 6: regional Comparison of financial risk Protection
Sources: world health organization regional office for the western Pacific and asian development bank.

14 | monitoring univErSal HEaltH covEragE in tHE WEStErn Pacific
Figure 7: immunization Coverage by Mother’s educational level
Sources: world health organization regional office for the western Pacific and asian development bank.

�15
THE WAY FORWARD
The M&E requirements of the new development agenda call for coordinated global and national investments in national health information systems.
This is necessary to strengthen and sustain country capacities to generate accurate and timely data to support better decision making and accountability. It requires strengthening of M&E systems and capacities, both at national and subnational levels, to support operations-level monitoring, policies, and actions. Support to countries can be better coordinated if countries define their UHC M&E requirements and ensure they align with the country’s UHC targets, national priorities, strategies, and plans.
Good monitoring is fundamental for countries to achieve their UHC targets. Countries must leverage the investments made and successes garnered from monitoring of the MDGs. For UHC monitoring efforts to be robust and better sustained, governments must do the following:
(i) Foster cross-sector collaboration and work collaboratively with development partners, the private sector, and civil society for more coordinated health information system investments and program plans and actions and for better sharing of capacities and health information system resources.
(ii) Maximize existing country data resources by harmonizing and integrating different data systems (CRVS systems, surveys, and facility and administrative information systems) to feed into the country UHC M&E framework.
(iii) Facilitate data sharing and flow within the health sector and across sectors by fostering collaboration and trust, and through the development and use of interoperable systems.
(iv) Utilize ICT tools and solutions to accelerate and improve quality and efficiencies in data collection, analysis, and visualization, and in communicating results for action.
(v) Strengthen community-based monitoring and social accountability mechanisms. Publicizing health data through UHC dashboards for the wider public enables feedback and valuable insights from citizens and provides a basis for consultations among governments, service providers, and citizens to jointly find solutions to challenges in achieving UHC through multistakeholder committees and other forums.
(vi) Leverage and strengthen existing institutions and mechanisms within the state and across different levels of government to foster accountability and ensure responsiveness from decision makers and service providers. These encompass regulatory agencies, legislative frameworks, reporting structures between central and decentralized government, and existing organizational or individual performance frameworks and incentive systems.
Countries must regularly assess their performance to ensure that they are on the right track to realizing UHC, and this will require comprehensive M&E and assessment tools. Thus, the international community must work together to develop tools that are adaptable to the country context and compatible with those of other countries or at the subnational level. Moreover, development partners are mandated to better coordinate their support and build synergies when supporting the health sector.
5

The M&E requirements of the new development agenda call for coordinated global and national investments in national health information systems.
�17
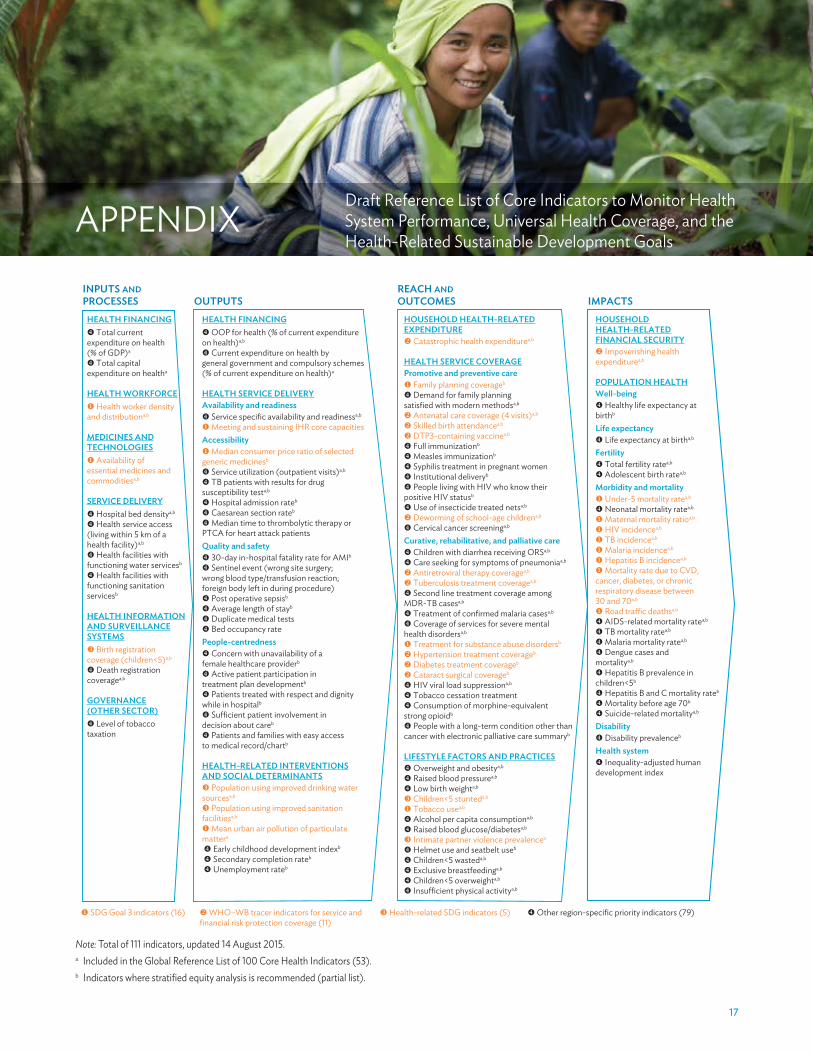
APPENDIXDraft Reference List of Core Indicators to Monitor Health System Performance, Universal Health Coverage, and the Health-Related Sustainable Development Goals
Note: Total of 111 indicators, updated 14 August 2015.a Included in the Global Reference List of 100 Core Health Indicators (53).b Indicators where stratified equity analysis is recommended (partial list).
INPUTS AND PROCESSES
REACH AND OUTCOMES OUTPUTS
HEALTH FINANCING Total current
expenditure on health (% of GDP)a
Total capital expenditure on healtha
HEALTH WORKFORCE Health worker density
and distributiona,b
MEDICINES ANDTECHNOLOGIES
Availability of essential medicines and commoditiesa,b
SERVICE DELIVERY Hospital bed densitya,b
Health service access (living within 5 km of ahealth facility)a,b
Health facilities withfunctioning water servicesb
Health facilities withfunctioning sanitationservicesb
HEALTH INFORMATIONAND SURVEILLANCESYSTEMS
Birth registrationcoverage (children<5)a,b
Death registrationcoveragea,b
GOVERNANCE(OTHER SECTOR)
Level of tobaccotaxation
IMPACTSHOUSEHOLDHEALTH-RELATEDFINANCIAL SECURITY
Impoverishing healthexpenditurea,b
POPULATION HEALTHWell-being
Healthy life expectancy atbirthb
Life expectancy Life expectancy at birtha,b
Fertility Total fertility ratea,b
Adolescent birth ratea,b
Morbidity and mortality Under-5 mortality ratea,b
Neonatal mortality ratea,b
Maternal mortality ratioa,b
HIV incidencea,b
TB incidencea,b
Malaria incidencea,b
Hepatitis B incidencea,b
Mortality rate due to CVD,cancer, diabetes, or chronicrespiratory disease between30 and 70a,b
Road traffic deathsa,b
AIDS-related mortality ratea,b
TB mortality ratea,b
Malaria mortality ratea,b
Dengue cases and mortalitya,b
Hepatitis B prevalence in children<5b
Hepatitis B and C mortality rateb
Mortality before age 70b
Suicide-related mortalitya,b
Disability Disability prevalenceb
Health system Inequality-adjusted human
development index
HOUSEHOLD HEALTH-RELATEDEXPENDITURE
Catastrophic health expenditurea,b
HEALTH SERVICE COVERAGEPromotive and preventive care
Family planning coverageb
Demand for family planning satisfied with modern methodsa,b
Antenatal care coverage (4 visits)a,b
Skilled birth attendancea,b
DTP3-containing vaccinea,b
Full immunizationb
Measles immunizationb
Syphilis treatment in pregnant women Institutional deliveryb
People living with HIV who know their positive HIV statusb
Use of insecticide treated netsa,b
Deworming of school-age childrena,b
Cervical cancer screeninga,b
Curative, rehabilitative, and palliative care Children with diarrhea receiving ORSa,b
Care seeking for symptoms of pneumoniaa,b
Antiretroviral therapy coveragea,b
Tuberculosis treatment coveragea,b
Second line treatment coverage amongMDR-TB casesa,b
Treatment of confirmed malaria casesa,b
Coverage of services for severe mentalhealth disordersa,b
Treatment for substance abuse disordersb
Hypertension treatment coverageb
Diabetes treatment coverageb
Cataract surgical coverageb
HIV viral load suppressiona,b
Tobacco cessation treatment Consumption of morphine-equivalent
strong opioidb
People with a long-term condition other thancancer with electronic palliative care summaryb
LIFESTYLE FACTORS AND PRACTICES Overweight and obesitya,b
Raised blood pressurea,b
Low birth weighta,b
Children<5 stunteda,b
Tobacco usea,b
Alcohol per capita consumptiona,b
Raised blood glucose/diabetesa,b
Intimate partner violence prevalencea
Helmet use and seatbelt useb
Children<5 wasteda,b
Exclusive breastfeedinga,b
Children<5 overweighta,b
Insufficient physical activitya,b
HEALTH FINANCING OOP for health (% of current expenditure
on health)a,b
Current expenditure on health by general government and compulsory schemes(% of current expenditure on health)a
HEALTH SERVICE DELIVERYAvailability and readiness
Service specific availability and readinessa,b
Meeting and sustaining IHR core capacitiesAccessibility
Median consumer price ratio of selected generic medicinesb
Service utilization (outpatient visits)a,b
TB patients with results for drug susceptibility testa,b
Hospital admission rateb
Caesarean section rateb
Median time to thrombolytic therapy orPTCA for heart attack patientsQuality and safety
30-day in-hospital fatality rate for AMIb
Sentinel event (wrong site surgery; wrong blood type/transfusion reaction;foreign body left in during procedure)
Post operative sepsisb
Average length of stayb
Duplicate medical tests Bed occupancy rate
People-centredness Concern with unavailability of a
female healthcare providerb
Active patient participation intreatment plan developmentb
Patients treated with respect and dignitywhile in hospitalb
Sufficient patient involvement indecision about careb
Patients and families with easy access to medical record/chartb
HEALTH-RELATED INTERVENTIONSAND SOCIAL DETERMINANTS
Population using improved drinking watersourcesa,b
Population using improved sanitationfacilitiesa,b
Mean urban air pollution of particulatemattera
Early childhood development indexb
Secondary completion rateb
Unemployment rateb
SDG Goal 3 indicators (16) WHO–WB tracer indicators for service andfinancial risk protection coverage (11)
Health-related SDG indicators (5) Other region-specific priority indicators (79)

18�
Boerma ,T., C. AbouZahr, D. Evans, and T. Evans. 2014. Monitoring Intervention Coverage in the Context of Universal Health Coverage. PLoS Medicine 11, No. 9: e1001728.
OECD (Organisation for Economic Co-operation and Development). 2006. Health Care Quality Indicators Project Conceptual Framework Paper. http://www.oecd.org/els/health-systems/36262363.pdf
WHO (World Health Organization). 2010. A Conceptual Framework for Action on the Social Determinants of Health. http://apps.who.int/iris/bitstream/10665/44489/1/9789241500852_eng.pdf?ua=1
———. 2011. Monitoring, Evaluation and Review of National Health Strategies: A Country-Led Platform for Information and Accountability. http://www.who.int/healthinfo/country_monitoring_evaluation/1085_IER_131011_web.pdf
———. 2012. Measuring Progress towards Universal Health Coverage. Geneva.
———. 2014. Global Reference List of 100 Core Health Indicators. Geneva.
———. 2016. Universal Health Coverage: Moving Towards Better Health – Action Framework for the Western Pacific Region. Manila.
WHO and World Bank. 2014. Monitoring Progress towards Universal Health Coverage at Country and Global Levels: Framework, Measures and Targets. Geneva.
REFERENCES

ISBN 978-92-9257-599-1
Monitoring Universal Health Coverage in the Western Pacifi cFramework, Indicators, and Dashboard
The Sustainable Development Goals (SDGs) have a clear focus on equity-focused monitoring and evaluation to ensure that no one is left behind. The United Nations member states have agreed on a range of indicators to track progress toward health for all in the SDGs. Universal health coverage is a specifi c target within SDG 3 and as countries move toward it they need to monitor the performance of the health system. To guide the monitoring of progress toward universal health coverage and to make results more comparable within the region, the World Health Organization Regional Offi ce for the Western Pacifi c (WPRO) and the Asian Development Bank (ADB) are developing a regional monitoring framework and a proposed set of core indicators. This report introduces the framework and indicators, and looks at early country experiences of implementation.
About the Asian Development Bank
ADB’s vision is an Asia and Pacifi c region free of poverty. Its mission is to help its developing member countries reduce poverty and improve the quality of life of their people. Despite the region’s many successes, it remains home to half of the world’s extreme poor. ADB is committed to reducing poverty through inclusive economic growth, environmentally sustainable growth, and regional integration.
Based in Manila, ADB is owned by 67 members, including 48 from the region. Its main instruments for helping its developing member countries are policy dialogue, loans, equity investments, guarantees, grants, and technical assistance.
ASIAN DEVELOPMENT BANK6 ADB Avenue, Mandaluyong City1550 Metro Manila, Philippineswww.adb.org