
Monitoring the Indian Summer Monsoon evolution using … Science... · Julian Days 200 Jharkhand 12...
1
Misra, V., A. Bhardwaj, and A. Mishra, 2017: Local onset and demise of the Indian summer monsoon. Clim. Dyn. Doi:10.1007/s00382-017-3924-2. Noska, R. and Misra, V., 2016. Characterizing the onset and demise of the Indian summer monsoon. Geophysical Research Letters, 43(9), pp.4547-4554. Pai, D. S., L. Sridhar, M. Rajeevan, O. P. Sreejith, N. S. Satbhai, and B. Mukhopadhyay, 2014a: Development of a new high spatial resolution (0.25°x0.25°) long period (1901-2010) daily gridded rainfall data set over India and its comparison with existing data sets over the region, Mausam, 65 (1), 1-18. Pai, D. S., L. Sridhar, M. R. Badwaik, and M. Rajeevan, 2014b: Analysis of the daily rainfall events over India using a new long period (1901-2010) high resolution (0.25°´0.25°) gridded rainfall data set, Climate Dyn., 45(3-4), doi:10.1007/s00382-014-2307-1. Conclusions An objective definition of local onset and demise of the ISM is introduced, which has many attractive features: 1) The definition is scalable to any spatial resolution; therefore it can be easily adapted for any application or dataset. 2) The chance for detection of false onset and demise is minimized by anchoring to AIR seasonal cycle. 3) It is solely based on rainfall; therefore it is comparatively easy to implement as it does not require multiple sources of data. 4) It is quite apparent that early (later) onset of the ISM over Northeast India (NI) is very strongly associated with early (later) onset (Fig. 2a), early (later) demise (Fig. 2b) and longer (shorter) length (Fig. 2c) of ISM over rest of India. However, the relationship of the onset of ISM over NI with seasonal rainfall anomalies is weekly correlated over rest of India. Because onset of summer rains in NI occurs almost a month earlier than rest of India, there is a potential to tap the predictive skill of the onset of rains over NI for predicting onset, demise, and seasonal length over rest of the India. 5) We further analyzed the gridded rainfall analysis to develop regional onset, demise, seasonal length and the seasonal accumulation of rainfall over 33 meteorological subdivisions (MSDs) of India as shown in Figs. 3a. The onset and demise dates of the ISM in these 33 MSDs were found to be comparable in IMD, TRMM, and GPM datasets as shown in Fig. 5. References Acknowledgements The project is support by NASA. The project is funded at FSU (lead institution, grant number NNX17AG72G S001 & NNX17AG72G S003. We also thank the Indian Meteorological Department for the availability of the daily rain analysis over India. Rain gauge observation of the IMD available for 104 years (1902-2005) (Pai et al. 2014a, b) and satellite-based TRMM (1998-2015) products are utilized to compute onset and demise at 0.25°x0.25° grid interval. Three years of GPM (2015-2017) products are then used for testing an experimental forecast outlook. The onset (demise) of AIR is defined as the first day after the minimum (maximum) in daily cumulative anomaly of AIR is reached in the year (Noska and Misra 2016). The daily cumulative anomaly ! ! " (#) of AIR for day i of year m is computed as: C! " (i) = ∑ #$% & A! n −, C where, - C= 1 MN 1 !$% ' 1 #$% ( A(m, n) 4) 5 is the daily AIR for day n of year m, and % ! is the climatology of the annual mean of AIR over N (=365/366) days for M years. To define the local onset and demise at every grid point over the domain we first compute the climatological local onset ( 6(7) * ) and demise ( 8(7) * ) from the daily cumulative anomaly (9:* " (7)) of the daily climatology of rain at the grid point in the same way as for the AIR (but this local definition can be potentially scaled to any spatial discretization that suits user needs): 9:* " 7 =∑+$% , ;* 5 − 9* where, &< is the climatological rain at grid point x for day n and '< is annual mean climatology of rain at grid point x: , c- = % '( ∑!$% ' ∑#$% ( r(m, n)- Similarly, we define the climatological onset ( O(i) - ) and demise ( D(i) - ) from the daily cumulative anomaly of the daily climatological AIR. We then compute the difference ( b- ) between the climatological local ( o(j) - ) and climatological AIR onset ( O(i)) as: b- = o(j)- − O(i) and similarly, the difference (d D ) between the climatological local ( d(j) - ) and AIR demise ( F(7)) as: 8* = 8(G)* − F(7) The climatological departures of local with AIR-based onset/demise over the 104-year period of the dataset gives a robust estimate of the phase lag (in days), with the transients being averaged out. We then define local onset (:9)(7)*) and demise (:8)(7)*) for a given year m and grid point x from the daily cumulative anomaly for the year m by finding conservatively (the nearest) minimum and maximum near the immediate vicinity of ( ) H) 7 ± JK* and F) 7 ± L8* , where, J= 1 + NO.! and L= 1 + ;O.! . O.! ,O/! , are the standard deviations of bx and dx, q and r are fractions that are incrementally increased from zero. (Misra et al 2017). Amit Bhardwaj 1, 3 and Vasubandhu Misra 1, 2, 3 1 Center for Ocean-Atmospheric Prediction Studies, Florida State University, Tallahassee, Florida, USA 2 Department of Earth, Ocean and Atmospheric Science, Florida State University, Tallahassee, Florida, USA 3 Florida Climate Institute, Florida State University, Tallahassee, Florida, USA Monitoring the Indian Summer Monsoon evolution using TRMM/GPM We make use of satellite-based rainfall products from both the Global Precipitation Measurement (GPM) Integrated Multiscale Retrievals for GPM (IMERG) and its predecessor, the Tropical Rainfall Measuring Mission (TRMM) Multi-Satellite Precipitation Analysis (TMPA), and daily rainfall analysis based on rain gauge measurement available from the Indian Meteorological Department (IMD) to objectively define local onset and demise at 36 Meteorological subdivisions of the Indian Summer Monsoon. This local definition is also anchored to the All India averaged Rainfall (AIR) monsoon onset and demise to avoid detection of false local onset and demise. It is also shown that the early monsoon rains over northeast India has a predictive potential for the following seasonal length of the Indian Summer Monsoon over rest of India. Abstract Figure 3: (a) 36 Meteorological sub- divisions of India, Name of each subdivision is given in the list (b) MSDs corresponding onset day (Julian days) from IMD (black) and TRMM (Red) are compared. (Note: subdivisions 1 and 36 are not used in analysis, also updated data for subdivision 27 (Chhattisgarh) is not available. 1. Andaman & Nicobar Islands 2. Arunachal Pradesh 3. Assam & Meghalaya 4. Naga. Manni. Mizo & Tripura 5. Sub-Him. West Bengal & Sikkim 6. Gangetic West Bengal 7. Orissa 8. Jharkhand 9. Bihar 10. East Uttar Pradesh 11. West Uttar Pradesh 12. Uttaranchal 13. Haryana, Chandigarh & Delhi 14. Punjab 15. Himachal Pradesh 16. Jammu & Kashmir 17. West Rajasthan 18. East Rajasthan 19. West Madhya Pradesh 20. East Madhya Pradesh 21. Gujarat 22. Saurashtra, Kutch & Diu 23. Konkan & Goa 24. Madhya Maharashtra 25. Marathwada 26. Vidarbha 27. Chhattisgarh 28. Coastal Andhra Pradesh 29. Telangana 30. Rayalaseema 31. Tamil Nadu & Pondicherry 32. Coastal Karnataka 33. North Interior Karnataka 34. South Interior Karnataka 35. Kerala 36. Lakshadweep (a) (b) Datasets and Methodology Figure 1: First, second and third rows shows the climatological onset, demise date (in Julian days), and seasonal accumulation of rainfall (mm) of the Indian Summer Monsoon (ISM) defined at every grid point for Indian Meteorological Department (IMD), TRMM and GPM gridded rainfall dataset respectively arranged in respective columns. Arunachal Pradesh 1 2 100 125 150 175 200 Julian Days Assam & Meghalaya Naga. Manni. Mizo & Tripura Sub-Him. West Bengal & Sikkim Gangetic West Bengal 1 2 250 275 300 325 Orissa 1 2 100 125 150 175 200 Julian Days Jharkhand Bihar East Uttar Pradesh West Uttar Pradesh 1 2 250 275 300 325 Uttaranchal 1 2 100 125 150 175 200 Julian Days Haryana, Chandigarh & Delhi Punjab Himachal Pradesh Jammu & Kashmir 1 2 250 275 300 325 West Rajasthan 1 2 100 125 150 175 200 Julian Days East Rajasthan West Madhya Pradesh East Madhya Pradesh Gujarat 1 2 250 275 300 325 Saurashtra, Kutch & Diu 1 2 100 125 150 175 200 Julian Days Konkan & Goa Madhya Maharashtra Marathwada Vidarbha 1 2 250 275 300 325 Chhattisgarh 1 2 100 125 150 175 200 Julian Days Coastal Andhra Pradesh Telangana Rayalaseema Tamil Nadu & Pondicherry 1 2 250 275 300 325 Coastal Karnataka Onset Demise 100 125 150 175 200 Julian Days North Interior Karnataka Onset Demise South Interior Karnataka Onset Demise Kerala Onset Demise 250 275 300 325 IMD TRMM GPM Figure 4: Time series of daily rainfall climatology (IMD) of the 33-Meteorological sub-divisions of India (MSDs; blue dots) and the corresponding cumulative daily anomaly curve (red line) with onset (OD) and Demise (DD) dates marked in Julian days. Figure 5: Comparison of IMD, TRMM and GPM onset/demise for corresponding MSDs. Local Onset/demise Climatology The climatological local onset, demise, seasonal accumulation of rainfall of the ISM are shown in first column of Figs. 1a, b, c. In general, the progression of the local onset of the ISM in Fig.1a follows the typical isochrone progression of the ISM from the southwest corner across to the northwest regions of India. However, the southeastern part of India (Tamil Nadu) and over northern tip of India (northwestern part of Jammu and Kashmir) experience a very delayed onset of the ISM (Fig. 1a), as these regions climatologically receive far less summer season rainfall than other parts of the country (Fig.1c). TRMM and GPM draws similar conclusion as shown in second and third corresponding columns. (a) (b) (c) (d) (e) (f) (g) (h) (i) Figure 6: GPM three years (2015, 2016 & 2017) onset , demise and seasonal length anomalies. Note the striking similarity in the sign of the anomalies of the onset date anomaly (ODA), demise date anomaly (DDA) and seasonal length anomaly (SLA) over northeast India with the rest of India. Figure 2: The correlation of the area average onset date over northeast India (NIOD) with corresponding IMD (first row) and TRMM (Second row) local onset date (LOD), demise dates (LDD), seasonal length (LSL) and seasonal rainfall anomalies (LSRA) of the Indian Summer monsoon. The hatched regions indicate passing bootstrap test at 5% significance level. (a) (e) (b) (f) (c) (g) (d) (h) Results
-
Upload
phungduong -
Category
Documents
-
view
215 -
download
0
Transcript of Monitoring the Indian Summer Monsoon evolution using … Science... · Julian Days 200 Jharkhand 12...
RESEARCH POSTER PRESENTATION DESIGN © 2015
www.PosterPresentations.com
Misra, V., A. Bhardwaj, and A. Mishra, 2017: Local onset and demise of the Indian summermonsoon. Clim. Dyn. Doi:10.1007/s00382-017-3924-2.Noska, R. and Misra, V., 2016. Characterizing the onset and demise of the Indian summermonsoon. Geophysical Research Letters, 43(9), pp.4547-4554.
Pai, D. S., L. Sridhar, M. Rajeevan, O. P. Sreejith, N. S. Satbhai, and B. Mukhopadhyay,2014a: Development of a new high spatial resolution (0.25°x0.25°) long period (1901-2010)daily gridded rainfall data set over India and its comparison with existing data sets over theregion, Mausam, 65 (1), 1-18.Pai, D. S., L. Sridhar, M. R. Badwaik, and M. Rajeevan, 2014b: Analysis of the daily rainfallevents over India using a new long period (1901-2010) high resolution (0.25°´0.25°) griddedrainfall data set, Climate Dyn., 45(3-4), doi:10.1007/s00382-014-2307-1.
ConclusionsAn objective definition of local onset and demise of the ISM isintroduced, which has many attractive features:1) The definition is scalable to any spatial resolution; therefore it can be
easily adapted for any application or dataset.
2) The chance for detection of false onset and demise is minimized byanchoring to AIR seasonal cycle.
3) It is solely based on rainfall; therefore it is comparatively easy toimplement as it does not require multiple sources of data.
4) It is quite apparent that early (later) onset of the ISM over NortheastIndia (NI) is very strongly associated with early (later) onset (Fig. 2a),early (later) demise (Fig. 2b) and longer (shorter) length (Fig. 2c) ofISM over rest of India. However, the relationship of the onset of ISMover NI with seasonal rainfall anomalies is weekly correlated over restof India. Because onset of summer rains in NI occurs almost a monthearlier than rest of India, there is a potential to tap the predictive skillof the onset of rains over NI for predicting onset, demise, and seasonallength over rest of the India.
5) We further analyzed the gridded rainfall analysis to develop regionalonset, demise, seasonal length and the seasonal accumulation ofrainfall over 33 meteorological subdivisions (MSDs) of India as shownin Figs. 3a. The onset and demise dates of the ISM in these 33 MSDswere found to be comparable in IMD, TRMM, and GPM datasets asshown in Fig. 5.
References
Acknowledgements
The project is support by NASA. The project is funded atFSU (lead institution, grant number NNX17AG72GS001 & NNX17AG72G S003. We also thank the IndianMeteorological Department for the availability of thedaily rain analysis over India.
Rain gauge observation of the IMD available for 104 years (1902-2005) (Paiet al. 2014a, b) and satellite-based TRMM (1998-2015) products are utilizedto compute onset and demise at 0.25°x0.25° grid interval. Three years ofGPM (2015-2017) products are then used for testing an experimentalforecast outlook. The onset (demise) of AIR is defined as the first day afterthe minimum (maximum) in daily cumulative anomaly of AIR is reached inthe year (Noska and Misra 2016). The daily cumulative anomaly !!" (#) ofAIR for day i of year m is computed as:
C!" (i) = ∑#$%& A! n − ,C where,
-C =1MN
1!$%
'1
#$%
(A(m, n)
4) 5 is the daily AIR for day n of year m, and %! is the climatology of theannual mean of AIR over N (=365/366) days for M years.
To define the local onset and demise at every grid point over the domain wefirst compute the climatological local onset (6(7)*) and demise (8(7)*) fromthe daily cumulative anomaly (9:*" (7)) of the daily climatology of rain at thegrid point in the same way as for the AIR (but this local definition can bepotentially scaled to any spatial discretization that suits user needs):
9:*" 7 = ∑+$%, ;* 5 − 9*
where, &< is the climatological rain at grid point x for day n and '< is annualmean climatology of rain at grid point x:
,c- =%'( ∑!$%
' ∑#$%( r(m, n)-
Similarly, we define the climatological onset (O(i)-) and demise (D(i)-) fromthe daily cumulative anomaly of the daily climatological AIR. We thencompute the difference (b- ) between the climatological local (o(j)-) andclimatological AIR onset (O(i)) as:
b- = o(j)- − O(i)
and similarly, the difference (dD) between the climatological local (d(j)-) andAIR demise (F(7)) as:
8* = 8(G)* − F(7)
The climatological departures of local with AIR-based onset/demise overthe 104-year period of the dataset gives a robust estimate of the phase lag(in days), with the transients being averaged out. We then define local onset(:9)(7)* ) and demise (:8)(7)* ) for a given year m and grid point x from thedaily cumulative anomaly for the year m by finding conservatively (thenearest) minimum and maximum near the immediate vicinity of (
)
H) 7 ±
JK* and F) 7 ± L8* , where, J = 1 + NO.! and L = 1 + ;O.! . O.! , O/! , arethe standard deviations of bx and dx, q and r are fractions that areincrementally increased from zero. (Misra et al 2017).
Amit Bhardwaj1, 3 and Vasubandhu Misra1, 2, 3
1Center for Ocean-Atmospheric Prediction Studies, Florida State University, Tallahassee, Florida, USA2Department of Earth, Ocean and Atmospheric Science, Florida State University, Tallahassee, Florida, USA
3Florida Climate Institute, Florida State University, Tallahassee, Florida, USA
Monitoring the Indian Summer Monsoon evolution using TRMM/GPM
We make use of satellite-based rainfall products from both the GlobalPrecipitation Measurement (GPM) Integrated Multiscale Retrievals forGPM (IMERG) and its predecessor, the Tropical Rainfall MeasuringMission (TRMM) Multi-Satellite Precipitation Analysis (TMPA), and dailyrainfall analysis based on rain gauge measurement available from the IndianMeteorological Department (IMD) to objectively define local onset anddemise at 36 Meteorological subdivisions of the Indian Summer Monsoon.This local definition is also anchored to the All India averaged Rainfall(AIR) monsoon onset and demise to avoid detection of false local onset anddemise. It is also shown that the early monsoon rains over northeast Indiahas a predictive potential for the following seasonal length of the IndianSummer Monsoon over rest of India.
Abstract
Figure 3: (a) 36Meteorological sub-divisions of India, Nameof each subdivision isgiven in the list (b)MSDs correspondingonset day (Julian days)from IMD (black) andTRMM (Red) arecompared. (Note:subdivisions 1 and 36are not used in analysis,also updated data forsubdivision 27(Chhattisgarh) is notavailable.
1. Andaman & Nicobar Islands2. Arunachal Pradesh 3. Assam & Meghalaya 4. Naga. Manni. Mizo & Tripura5. Sub-Him. West Bengal & Sikkim6. Gangetic West Bengal 7. Orissa 8. Jharkhand 9. Bihar 10. East Uttar Pradesh11. West Uttar Pradesh 12. Uttaranchal 13. Haryana, Chandigarh & Delhi 14. Punjab 15. Himachal Pradesh 16. Jammu & Kashmir 17. West Rajasthan 18. East Rajasthan 19. West Madhya Pradesh 20. East Madhya Pradesh 21. Gujarat 22. Saurashtra, Kutch & Diu 23. Konkan & Goa 24. Madhya Maharashtra 25. Marathwada 26. Vidarbha27. Chhattisgarh 28. Coastal Andhra Pradesh 29. Telangana 30. Rayalaseema 31. Tamil Nadu & Pondicherry 32. Coastal Karnataka 33. North Interior Karnataka 34. South Interior Karnataka35. Kerala36. Lakshadweep
(a)
(b)
Datasets and Methodology
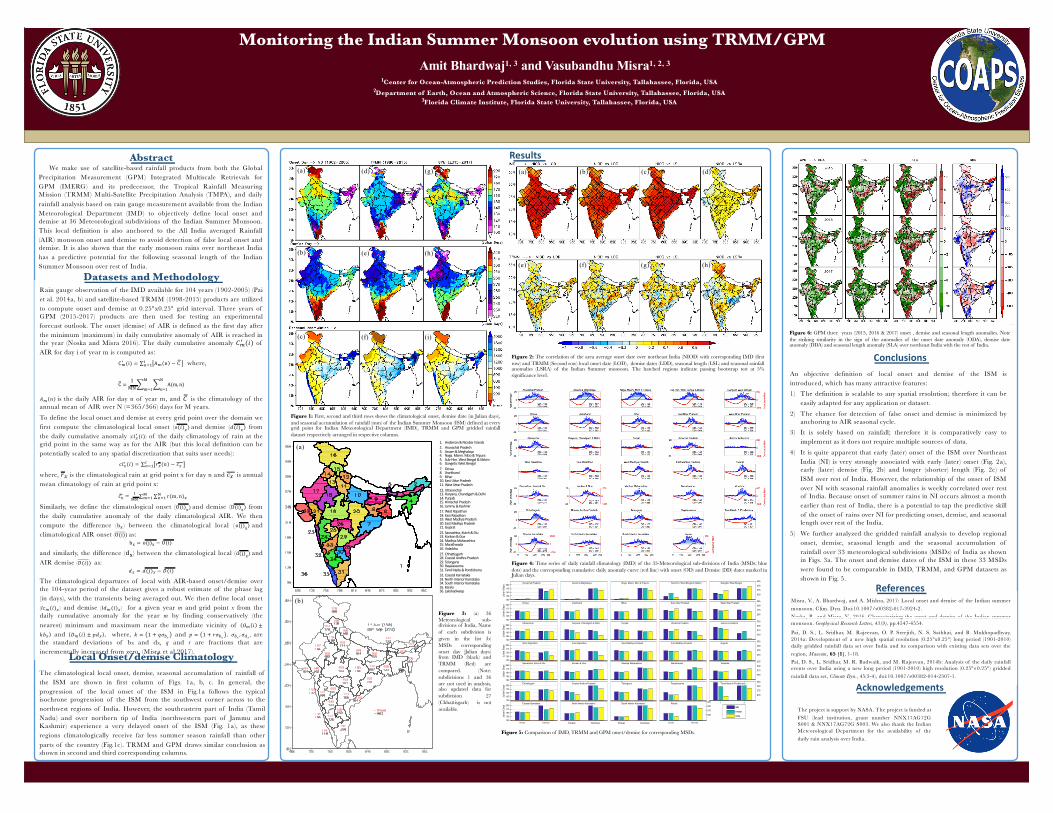
Figure 1: First, second and third rows shows the climatological onset, demise date (in Julian days),and seasonal accumulation of rainfall (mm) of the Indian Summer Monsoon (ISM) defined at everygrid point for Indian Meteorological Department (IMD), TRMM and GPM gridded rainfalldataset respectively arranged in respective columns.
Arunachal Pradesh
1 2100125150175200
Julia
n D
ays
Assam & Meghalaya
1 2
Naga. Manni. Mizo & Tripura
1 2
Sub-Him. West Bengal & Sikkim
1 2
Gangetic West Bengal
1 2
250
275
300
325
Orissa
1 2100125150175200
Julia
n D
ays
Jharkhand
1 2
Bihar
1 2
East Uttar Pradesh
1 2
West Uttar Pradesh
1 2
250
275
300
325
Uttaranchal
1 2100125150175200
Julia
n D
ays
Haryana, Chandigarh & Delhi
1 2
Punjab
1 2
Himachal Pradesh
1 2
Jammu & Kashmir
1 2
250
275
300
325
West Rajasthan
1 2100125150175200
Julia
n D
ays
East Rajasthan
1 2
West Madhya Pradesh
1 2
East Madhya Pradesh
1 2
Gujarat
1 2
250
275
300
325
Saurashtra, Kutch & Diu
1 2100125150175200
Julia
n D
ays
Konkan & Goa
1 2
Madhya Maharashtra
1 2
Marathwada
1 2
Vidarbha
1 2
250
275
300
325
Chhattisgarh
1 2100125150175200
Julia
n D
ays
Coastal Andhra Pradesh
1 2
Telangana
1 2
Rayalaseema
1 2
Tamil Nadu & Pondicherry
1 2
250
275
300
325
Coastal Karnataka
Onset Demise100125150175200
Julia
n D
ays
North Interior Karnataka
Onset Demise
South Interior Karnataka
Onset Demise
Kerala
Onset Demise
250
275
300
325
IMD
TRMM
GPM
Figure 4: Time series of daily rainfall climatology (IMD) of the 33-Meteorological sub-divisions of India (MSDs; bluedots) and the corresponding cumulative daily anomaly curve (red line) with onset (OD) and Demise (DD) dates marked inJulian days.
Figure 5: Comparison of IMD, TRMM and GPM onset/demise for corresponding MSDs.
Local Onset/demise ClimatologyThe climatological local onset, demise, seasonal accumulation of rainfall ofthe ISM are shown in first column of Figs. 1a, b, c. In general, theprogression of the local onset of the ISM in Fig.1a follows the typicalisochrone progression of the ISM from the southwest corner across to thenorthwest regions of India. However, the southeastern part of India (TamilNadu) and over northern tip of India (northwestern part of Jammu andKashmir) experience a very delayed onset of the ISM (Fig. 1a), as theseregions climatologically receive far less summer season rainfall than otherparts of the country (Fig.1c). TRMM and GPM draws similar conclusion asshown in second and third corresponding columns.
(a)
(b)
(c)
(d)
(e)
(f)
(g)
(h)
(i)Figure 6: GPM three years (2015, 2016 & 2017) onset , demise and seasonal length anomalies. Notethe striking similarity in the sign of the anomalies of the onset date anomaly (ODA), demise dateanomaly (DDA) and seasonal length anomaly (SLA) over northeast India with the rest of India.
Figure 2: The correlation of the area average onset date over northeast India (NIOD) with corresponding IMD (firstrow) and TRMM (Second row) local onset date (LOD), demise dates (LDD), seasonal length (LSL) and seasonal rainfallanomalies (LSRA) of the Indian Summer monsoon. The hatched regions indicate passing bootstrap test at 5%significance level.
(a)
(e)
(b)
(f)
(c)
(g)
(d)
(h)
Results