Monitoring the Citrix XenMobile MDM · Monitoring the XenMobile MDM Server 3 Monitoring the...
42
Monitoring the Citrix XenMobile MDM eG Enterprise v6.0
Transcript of Monitoring the Citrix XenMobile MDM · Monitoring the XenMobile MDM Server 3 Monitoring the...
Monitoring the Citrix
XenMobile MDM
eG Enterprise v6.0
Restricted Rights Legend
The information contained in this document is confidential and subject to change without notice. No part of this
document may be reproduced or disclosed to others without the prior permission of eG Innovations Inc. eG
Innovations Inc. makes no warranty of any kind with regard to the software and documentation, including, but not
limited to, the implied warranties of merchantability and fitness for a particular purpose.
Trademarks
Microsoft Windows, Windows NT, Windows 2003, and Windows 2000 are either registered trademarks or trademarks
of Microsoft Corporation in United States and/or other countries.
The names of actual companies and products mentioned herein may be the trademarks of their respective owners.
Copyright
©2014 eG Innovations Inc. All rights reserved.
Table of Contents INTRODUCTION .......................................................................................................................................................................... 1
MONITORING THE XENMOBILE MDM ................................................................................................................................. 3
2.1 The JVM Layer Tests ........................................................................................................................................................ 4
2.2 The Java Application Server Layer ................................................................................................................................... 5
2.3 The XenMobile Server Layer ............................................................................................................................................ 6
2.3.1 License Test .............................................................................................................................................................. 7
2.3.2 Logs Test ................................................................................................................................................................... 8
2.3.3 Scheduled Jobs Test ................................................................................................................................................ 14
2.3.4 XenMobile Status Test ............................................................................................................................................ 17
2.3.5 XenMobile Threads Test ......................................................................................................................................... 18
2.4 The XenMobile Device Management Layer ................................................................................................................... 21
2.4.1 Device Applications Test ........................................................................................................................................ 21
2.4.2 Device Actions Test ................................................................................................................................................ 23
2.4.3 Device Sessions Test ............................................................................................................................................... 26
2.4.1 Devices by Platform Test ........................................................................................................................................ 28
2.4.2 Devices Test ............................................................................................................................................................ 32
2.4.3 Package Deployments Test ..................................................................................................................................... 35
CONCLUSION ............................................................................................................................................................................. 38
Table of Figures
Figure 1: The Citrix XenMobile Architecture ........................................................................................................................................................... 1 Figure 2.1: The layer model of the XenMobile Device Manager .............................................................................................................................. 3 Figure 2.1: The tests mapped to the JVM layer ......................................................................................................................................................... 5 Figure 2.2: The tests mapped to the Java Application Server layer ........................................................................................................................... 6 Figure 2.2: The tests mapped to the Operating System layer ..................................................................................................................................... 7 Figure 2.3: The detailed diagnosis of the repeating jobs measure ............................................................................................................................ 16 Figure 2.4: The detailed diagnosis of the running jobs measure .............................................................................................................................. 16 Figure 2.5: The detailed diagnosis of the Devices with non-suggested applications measure.................................................................................. 23 Figure 2.6: The detailed diagnosis of the Devices with missing required applications measure .............................................................................. 23 Figure 2.7: The detailed diagnosis of the Connected devices measure .................................................................................................................... 28
Int roduct ion
1
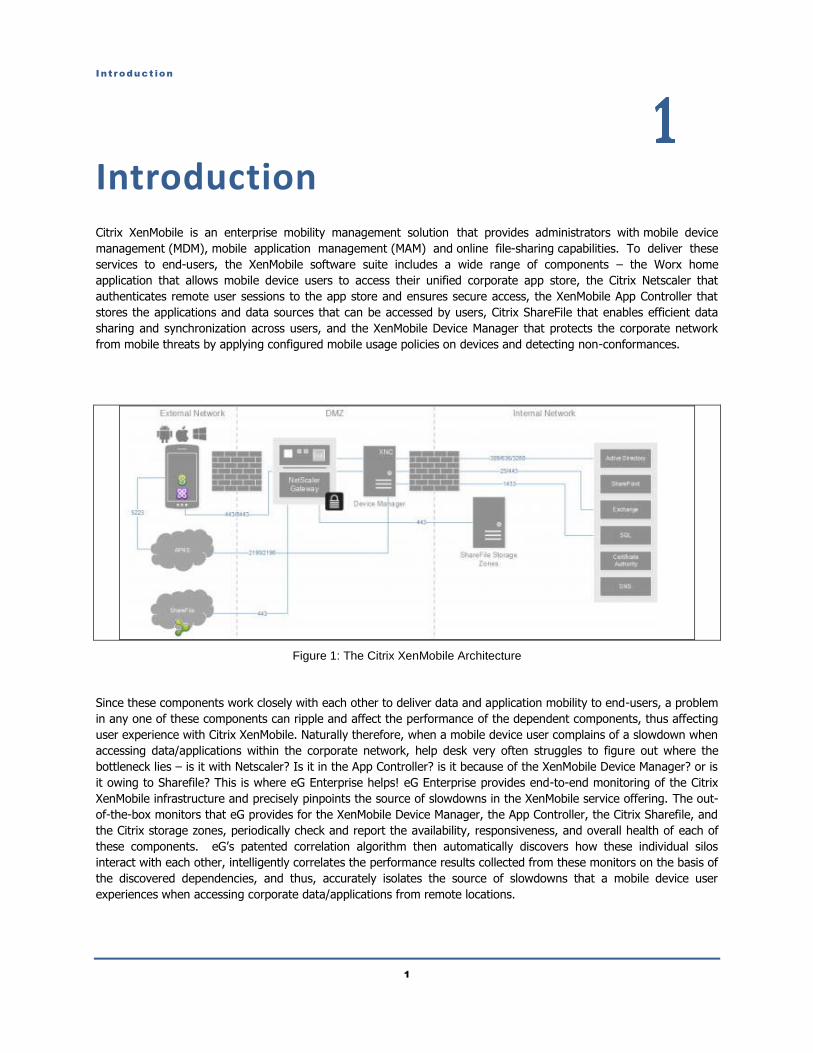
Introduction Citrix XenMobile is an enterprise mobility management solution that provides administrators with mobile device
management (MDM), mobile application management (MAM) and online file-sharing capabilities. To deliver these
services to end-users, the XenMobile software suite includes a wide range of components – the Worx home
application that allows mobile device users to access their unified corporate app store, the Citrix Netscaler that
authenticates remote user sessions to the app store and ensures secure access, the XenMobile App Controller that
stores the applications and data sources that can be accessed by users, Citrix ShareFile that enables efficient data
sharing and synchronization across users, and the XenMobile Device Manager that protects the corporate network
from mobile threats by applying configured mobile usage policies on devices and detecting non-conformances.
Figure 1: The Citrix XenMobile Architecture
Since these components work closely with each other to deliver data and application mobility to end-users, a problem
in any one of these components can ripple and affect the performance of the dependent components, thus affecting
user experience with Citrix XenMobile. Naturally therefore, when a mobile device user complains of a slowdown when
accessing data/applications within the corporate network, help desk very often struggles to figure out where the
bottleneck lies – is it with Netscaler? Is it in the App Controller? is it because of the XenMobile Device Manager? or is
it owing to Sharefile? This is where eG Enterprise helps! eG Enterprise provides end-to-end monitoring of the Citrix
XenMobile infrastructure and precisely pinpoints the source of slowdowns in the XenMobile service offering. The out-
of-the-box monitors that eG provides for the XenMobile Device Manager, the App Controller, the Citrix Sharefile, and
the Citrix storage zones, periodically check and report the availability, responsiveness, and overall health of each of
these components. eG’s patented correlation algorithm then automatically discovers how these individual silos
interact with each other, intelligently correlates the performance results collected from these monitors on the basis of
the discovered dependencies, and thus, accurately isolates the source of slowdowns that a mobile device user
experiences when accessing corporate data/applications from remote locations.

Monitor ing the Qua l i t y Vi r tua l Desktop
2
This document details how eG monitors the XenMobile MDM – i.e., the XenMobile Device Manager – and what
metrics it collects from the MDM.
Monitor ing the XenMob i le MDM Server
3
Monitoring the XenMobile MDM Server XenMobile MDM (also known as the XenMobile Device Manager (XDM)) is the MDM component within Citrix
XenMobile, which runs on an Apache Tomcat web server configured as a Windows service and relies on Java
software (Java virtual Machine). It provides role-based management, configuration and security of corporate and
user-owned devices. Using this tool, IT can manage mobile devices, set mobile policies and compliance rules, gain
visibility to the mobile network, provide control over mobile apps and data, and shield the network from mobile
threats. IT can blacklist or whitelist apps, detect devices that are jailbroken or out of compliance and block their
ActiveSync email access and do a full or selective wipe of a device that is lost, stolen or out of compliance. This
implies that the non-availability of the XenMobile MDM, even for a few minutes, or a temporary slowdown in its
operations, can have grave consequences! Without the XenMobile MDM, mobile devices will not be able to register
with XenMobile; registered devices will not be able to download latest policies. This in turn can expose the
environment to serious mobile threats – for instance, access by unauthorized devices and usage of blacklisted
applications will go undetected; confidential information may travel beyond authorized boundaries increasing the
possibilities of abuse. To keep such intrusions at bay and to ensure a secure mobile experience for users,
administrators need to keep an eye on the availability and overall health of the XenMobile MDM, proactively detect
potential problem conditions, and initiate measures to avert them.
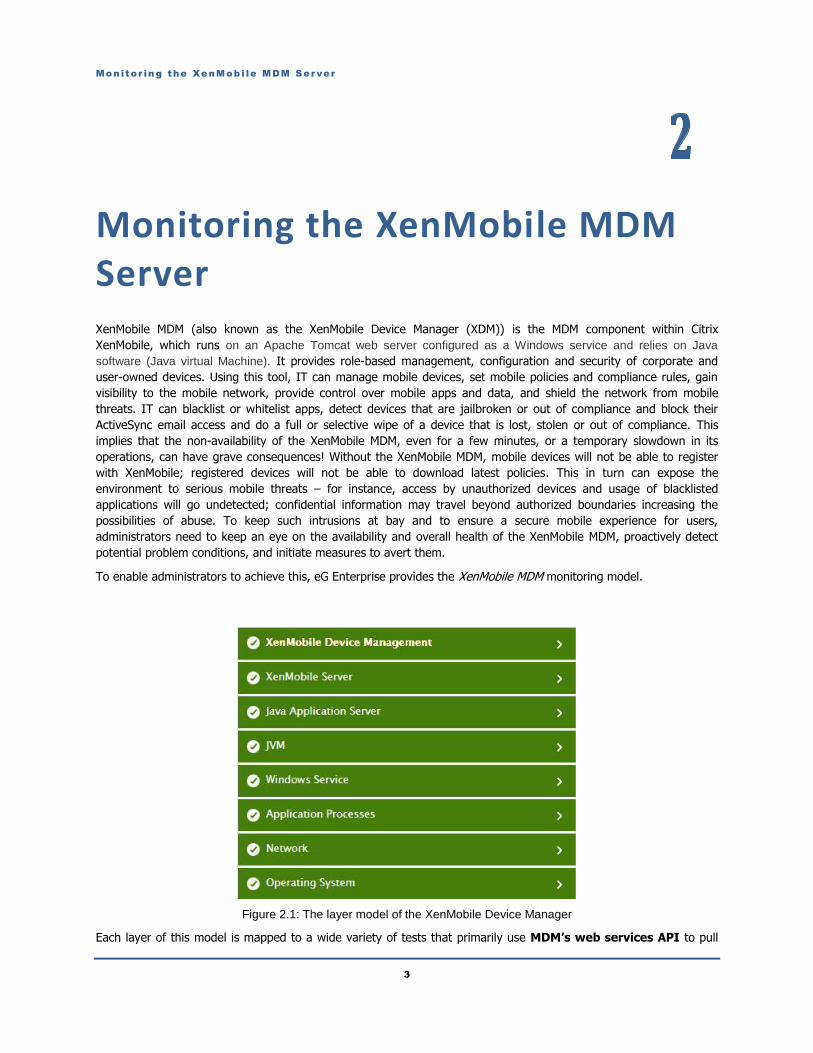
To enable administrators to achieve this, eG Enterprise provides the XenMobile MDM monitoring model.
Figure 2.1: The layer model of the XenMobile Device Manager
Each layer of this model is mapped to a wide variety of tests that primarily use MDM’s web services API to pull
Monitor ing the XenMob i le MDM Server
4
out a wealth of performance information related to the XenMobile MDM. To access the API, the eG agent has to be
configured with ‘Administrator’ rights to the XenMobile MDM server.
Using the metrics collected from the API, administrators can ascertain the following:
Is the XenMobile MDM server available over the network?
Is the Tomcat server hosting the XenMobile MDM operating at its peak capacity?
Are any JVM threads being blocked? Exactly, which thread is blocking and which line of code could
have caused the block?
Is the XenMobile MDM server online?
Has the server experienced any error events recently? What type of errors are these?
Does the server have adequate user/device licenses?
Are scheduled jobs running as per schedule on the XenMobile MDM server?
What is the current device load on the server? Does the server’s thread pool have adequate threads to
handle this load?
How many devices are currently managed by the server?
Which of these devices host blacklisted applications?
Do all managed devices contain all required applications? Which applications are missing on which
devices?
Has the MDM server detected any jail-broken, perimeter-breaching, out-of-compliant, or passcode
non-compliant devices? If so, which devices are they?
Has the MDM server triggered any automated actions on any device? Which of these actions are still
pending on these devices and why?
Which devices are currently disconnected from the server?
Have any package deployments failed?
The sections that follow will take you on a layer-by-layer tour of the XenMobile MDM monitoring model. However,
since the tests associated with the Operating System, Network, Application Processes, and Windows Service layers
have been already dealt with in detail in the Monitoring Unix and Windows Servers document, this chapter will focus
on the other layers only.
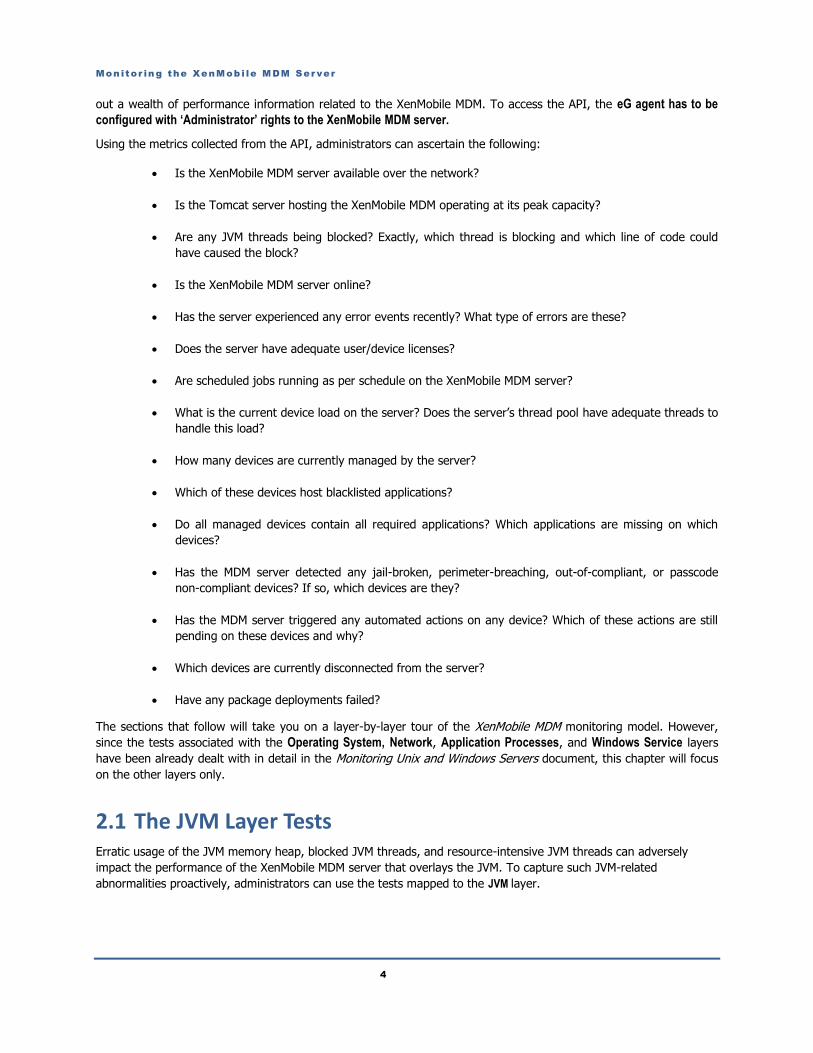
2.1 The JVM Layer Tests Erratic usage of the JVM memory heap, blocked JVM threads, and resource-intensive JVM threads can adversely
impact the performance of the XenMobile MDM server that overlays the JVM. To capture such JVM-related
abnormalities proactively, administrators can use the tests mapped to the JVM layer.
Monitor ing the XenMob i le MDM Server
5
Figure 2.1: The tests mapped to the JVM layer
Since the tests mapped to this layer have already been discussed elaborately in the Monitoring Java Applications
document, let us proceed to the next layer.
2.2 The Java Application Server Layer As stated earlier, XenMobile MDM runs on an Apache Tomcat server. Since the availability and performance of the
MDM server relies on the health of its Tomcat foundation, the tests mapped to this layer monitor and report on
Tomcat health.
Monitor ing the XenMob i le MDM Server
6
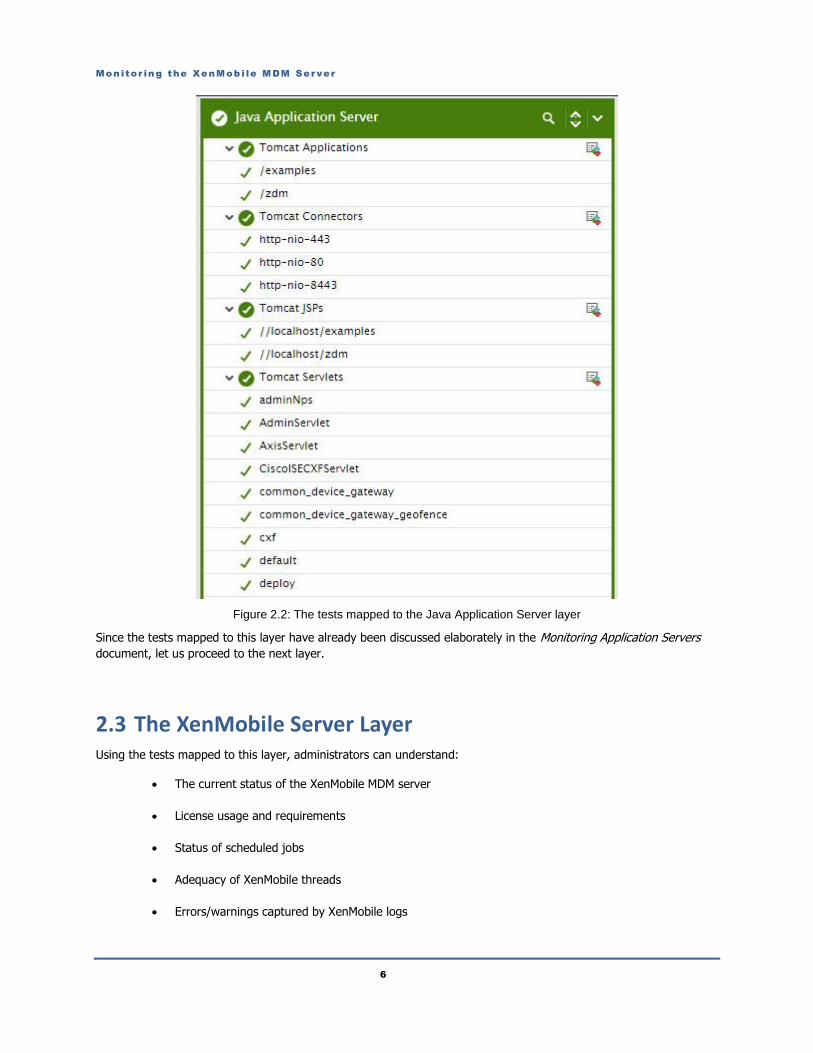
Figure 2.2: The tests mapped to the Java Application Server layer
Since the tests mapped to this layer have already been discussed elaborately in the Monitoring Application Servers
document, let us proceed to the next layer.
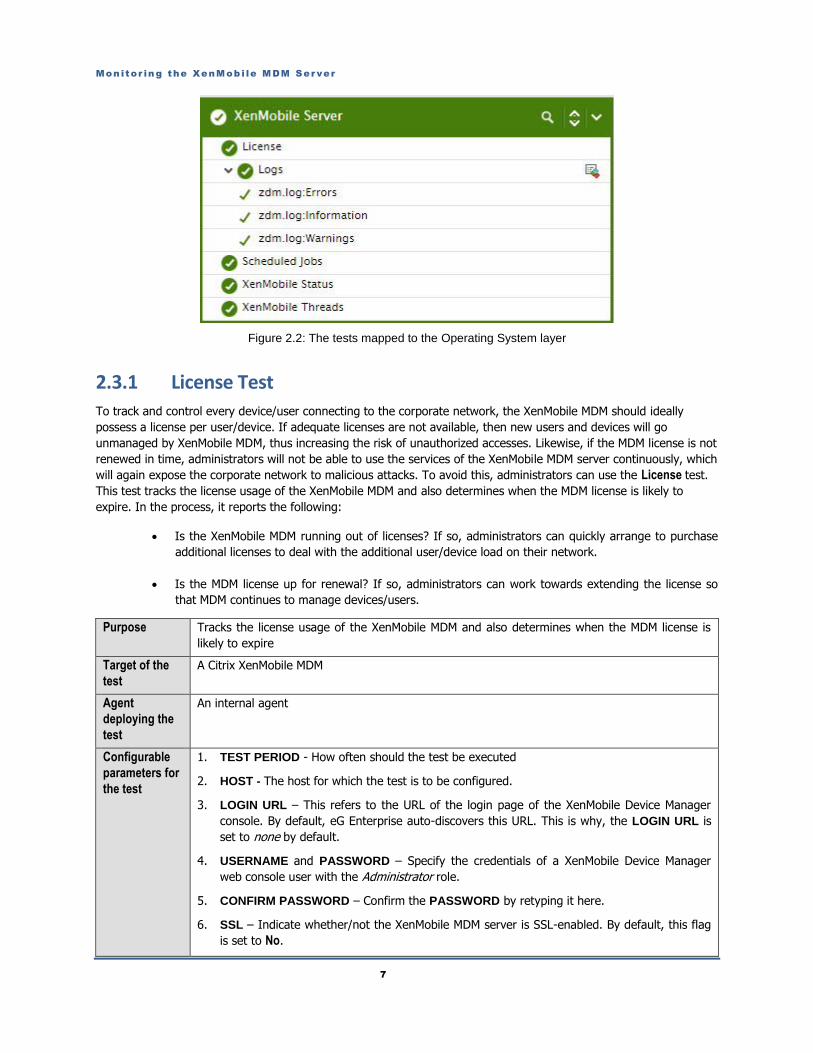
2.3 The XenMobile Server Layer Using the tests mapped to this layer, administrators can understand:
The current status of the XenMobile MDM server
License usage and requirements
Status of scheduled jobs
Adequacy of XenMobile threads
Errors/warnings captured by XenMobile logs
Monitor ing the XenMob i le MDM Server
7
Figure 2.2: The tests mapped to the Operating System layer
2.3.1 License Test
To track and control every device/user connecting to the corporate network, the XenMobile MDM should ideally
possess a license per user/device. If adequate licenses are not available, then new users and devices will go
unmanaged by XenMobile MDM, thus increasing the risk of unauthorized accesses. Likewise, if the MDM license is not
renewed in time, administrators will not be able to use the services of the XenMobile MDM server continuously, which
will again expose the corporate network to malicious attacks. To avoid this, administrators can use the License test.
This test tracks the license usage of the XenMobile MDM and also determines when the MDM license is likely to
expire. In the process, it reports the following:
Is the XenMobile MDM running out of licenses? If so, administrators can quickly arrange to purchase
additional licenses to deal with the additional user/device load on their network.
Is the MDM license up for renewal? If so, administrators can work towards extending the license so
that MDM continues to manage devices/users.
Purpose Tracks the license usage of the XenMobile MDM and also determines when the MDM license is
likely to expire
Target of the
test
A Citrix XenMobile MDM
Agent
deploying the
test
An internal agent
Configurable
parameters for
the test
1. TEST PERIOD - How often should the test be executed
2. HOST - The host for which the test is to be configured.
3. LOGIN URL – This refers to the URL of the login page of the XenMobile Device Manager
console. By default, eG Enterprise auto-discovers this URL. This is why, the LOGIN URL is
set to none by default.
4. USERNAME and PASSWORD – Specify the credentials of a XenMobile Device Manager
web console user with the Administrator role.
5. CONFIRM PASSWORD – Confirm the PASSWORD by retyping it here.
6. SSL – Indicate whether/not the XenMobile MDM server is SSL-enabled. By default, this flag
is set to No.
Monitor ing the XenMob i le MDM Server
8
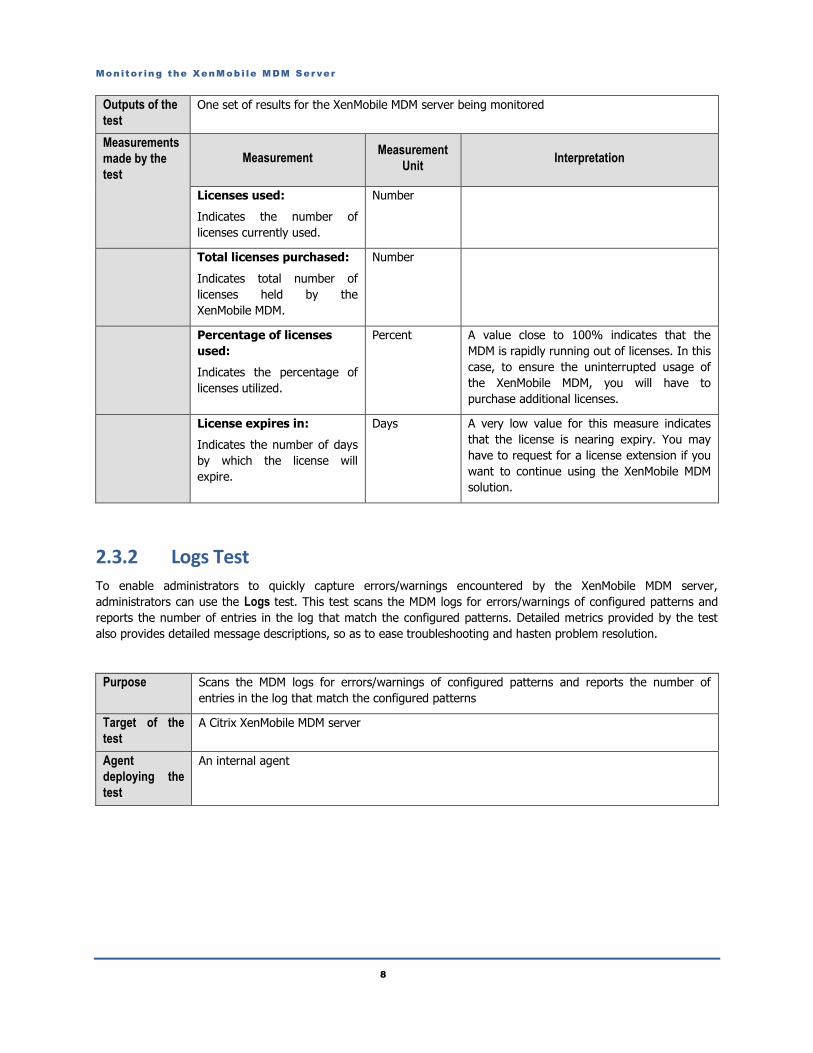
Outputs of the
test
One set of results for the XenMobile MDM server being monitored
Measurements
made by the
test
Measurement Measurement
Unit Interpretation
Licenses used:
Indicates the number of
licenses currently used.
Number
Total licenses purchased:
Indicates total number of
licenses held by the
XenMobile MDM.
Number
Percentage of licenses
used:
Indicates the percentage of
licenses utilized.
Percent A value close to 100% indicates that the
MDM is rapidly running out of licenses. In this
case, to ensure the uninterrupted usage of
the XenMobile MDM, you will have to
purchase additional licenses.
License expires in:
Indicates the number of days
by which the license will
expire.
Days A very low value for this measure indicates
that the license is nearing expiry. You may
have to request for a license extension if you
want to continue using the XenMobile MDM
solution.
2.3.2 Logs Test
To enable administrators to quickly capture errors/warnings encountered by the XenMobile MDM server,
administrators can use the Logs test. This test scans the MDM logs for errors/warnings of configured patterns and
reports the number of entries in the log that match the configured patterns. Detailed metrics provided by the test
also provides detailed message descriptions, so as to ease troubleshooting and hasten problem resolution.
Purpose Scans the MDM logs for errors/warnings of configured patterns and reports the number of
entries in the log that match the configured patterns
Target of the
test
A Citrix XenMobile MDM server
Agent
deploying the
test
An internal agent
Monitor ing the XenMob i le MDM Server
9
Configurable
parameters for
the test
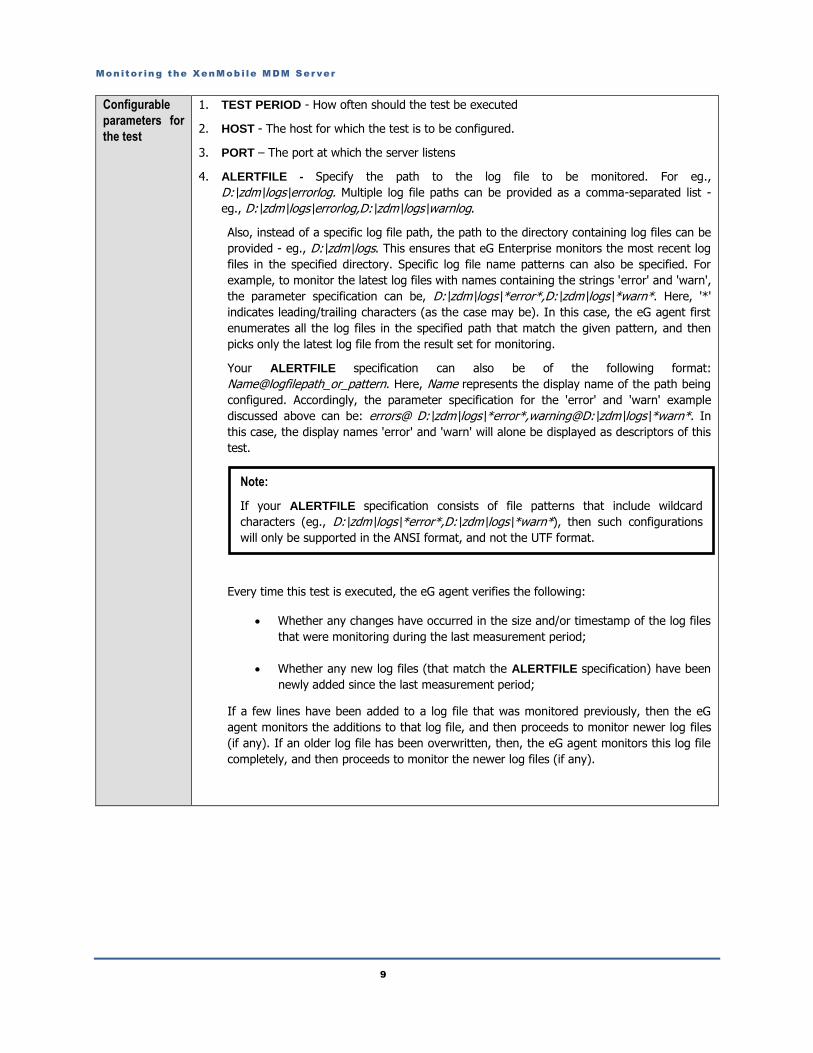
1. TEST PERIOD - How often should the test be executed
2. HOST - The host for which the test is to be configured.
3. PORT – The port at which the server listens
4. ALERTFILE - Specify the path to the log file to be monitored. For eg.,
D:\zdm\logs\errorlog. Multiple log file paths can be provided as a comma-separated list -
eg., D:\zdm\logs\errorlog,D:\zdm\logs\warnlog.
Also, instead of a specific log file path, the path to the directory containing log files can be
provided - eg., D:\zdm\logs. This ensures that eG Enterprise monitors the most recent log
files in the specified directory. Specific log file name patterns can also be specified. For
example, to monitor the latest log files with names containing the strings 'error' and 'warn',
the parameter specification can be, D:\zdm\logs\*error*,D:\zdm\logs\*warn*. Here, '*'
indicates leading/trailing characters (as the case may be). In this case, the eG agent first
enumerates all the log files in the specified path that match the given pattern, and then
picks only the latest log file from the result set for monitoring.
Your ALERTFILE specification can also be of the following format:
Name@logfilepath_or_pattern. Here, Name represents the display name of the path being
configured. Accordingly, the parameter specification for the 'error' and 'warn' example
discussed above can be: errors@ D:\zdm\logs\*error*,warning@D:\zdm\logs\*warn*. In
this case, the display names 'error' and 'warn' will alone be displayed as descriptors of this
test.
Every time this test is executed, the eG agent verifies the following:
Whether any changes have occurred in the size and/or timestamp of the log files
that were monitoring during the last measurement period;
Whether any new log files (that match the ALERTFILE specification) have been
newly added since the last measurement period;
If a few lines have been added to a log file that was monitored previously, then the eG
agent monitors the additions to that log file, and then proceeds to monitor newer log files
(if any). If an older log file has been overwritten, then, the eG agent monitors this log file
completely, and then proceeds to monitor the newer log files (if any).
Note:
If your ALERTFILE specification consists of file patterns that include wildcard
characters (eg., D:\zdm\logs\*error*,D:\zdm\logs\*warn*), then such configurations
will only be supported in the ANSI format, and not the UTF format.
Monitor ing the XenMob i le MDM Server
10
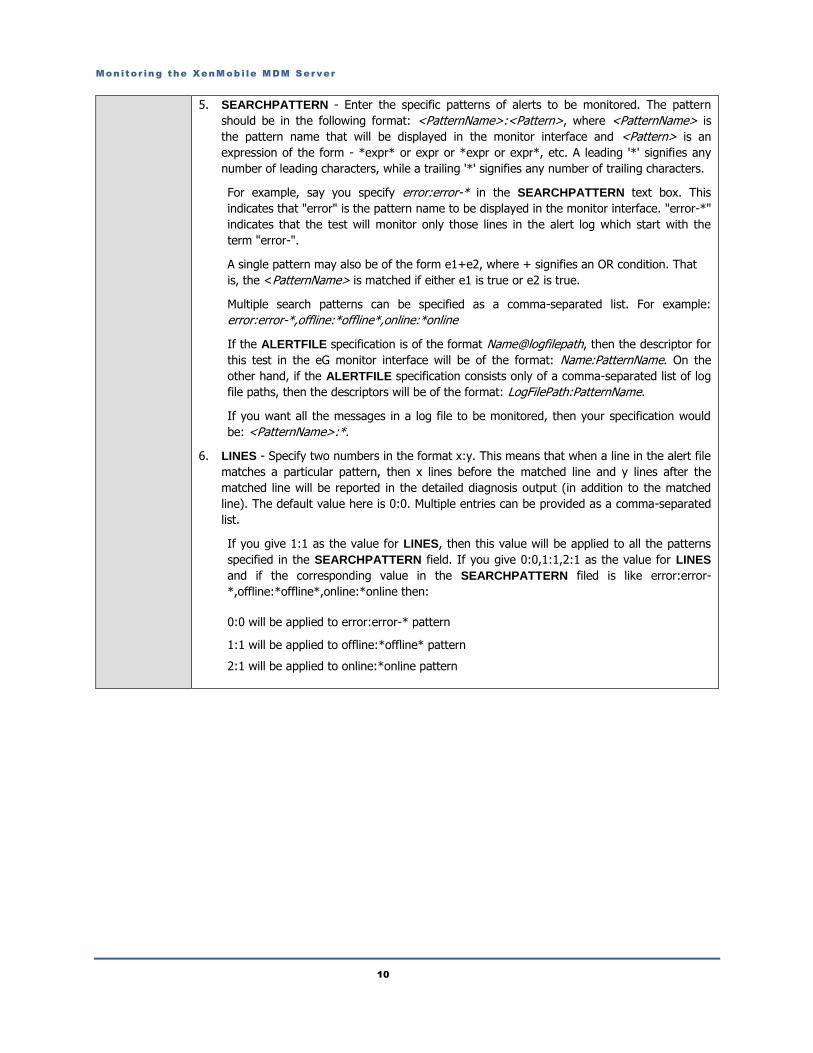
5. SEARCHPATTERN - Enter the specific patterns of alerts to be monitored. The pattern
should be in the following format: <PatternName>:<Pattern>, where <PatternName> is
the pattern name that will be displayed in the monitor interface and <Pattern> is an
expression of the form - *expr* or expr or *expr or expr*, etc. A leading '*' signifies any
number of leading characters, while a trailing '*' signifies any number of trailing characters.
For example, say you specify error:error-* in the SEARCHPATTERN text box. This
indicates that "error" is the pattern name to be displayed in the monitor interface. "error-*"
indicates that the test will monitor only those lines in the alert log which start with the
term "error-".
A single pattern may also be of the form e1+e2, where + signifies an OR condition. That
is, the <PatternName> is matched if either e1 is true or e2 is true.
Multiple search patterns can be specified as a comma-separated list. For example:
error:error-*,offline:*offline*,online:*online
If the ALERTFILE specification is of the format Name@logfilepath, then the descriptor for
this test in the eG monitor interface will be of the format: Name:PatternName. On the
other hand, if the ALERTFILE specification consists only of a comma-separated list of log
file paths, then the descriptors will be of the format: LogFilePath:PatternName.
If you want all the messages in a log file to be monitored, then your specification would
be: <PatternName>:*.
6. LINES - Specify two numbers in the format x:y. This means that when a line in the alert file
matches a particular pattern, then x lines before the matched line and y lines after the
matched line will be reported in the detailed diagnosis output (in addition to the matched
line). The default value here is 0:0. Multiple entries can be provided as a comma-separated
list.
If you give 1:1 as the value for LINES, then this value will be applied to all the patterns
specified in the SEARCHPATTERN field. If you give 0:0,1:1,2:1 as the value for LINES
and if the corresponding value in the SEARCHPATTERN filed is like error:error-
*,offline:*offline*,online:*online then:
0:0 will be applied to error:error-* pattern
1:1 will be applied to offline:*offline* pattern
2:1 will be applied to online:*online pattern
Monitor ing the XenMob i le MDM Server
11
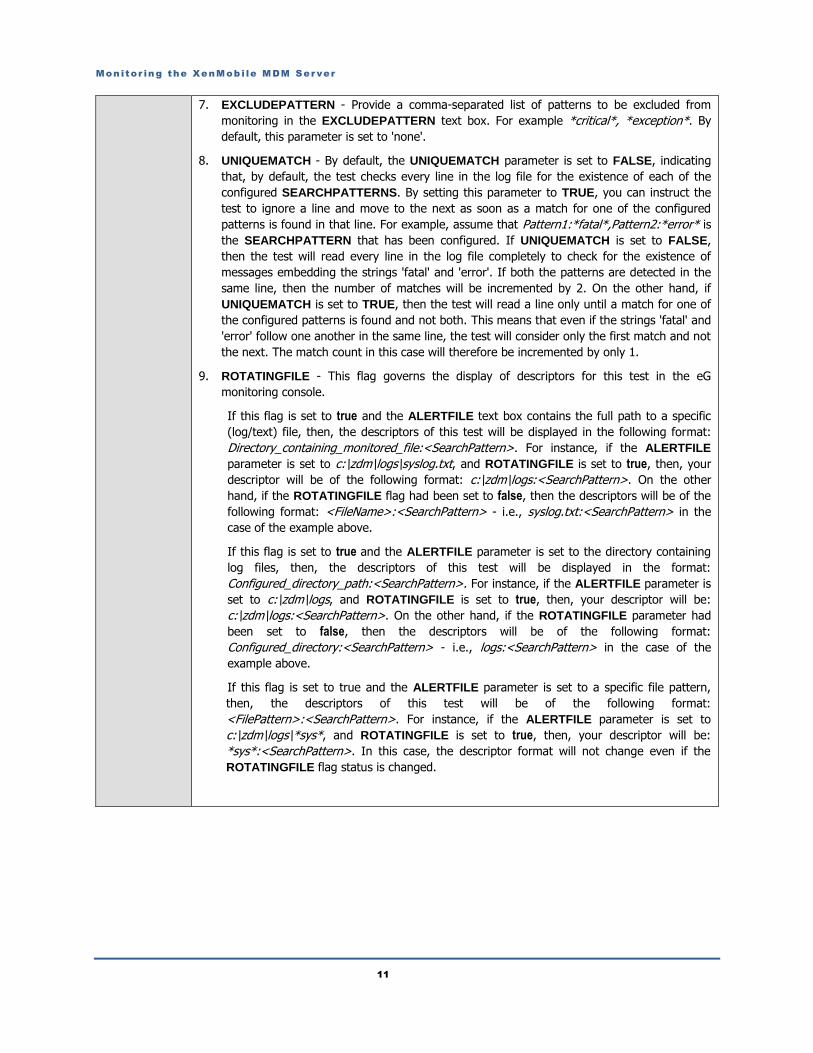
7. EXCLUDEPATTERN - Provide a comma-separated list of patterns to be excluded from
monitoring in the EXCLUDEPATTERN text box. For example *critical*, *exception*. By
default, this parameter is set to 'none'.
8. UNIQUEMATCH - By default, the UNIQUEMATCH parameter is set to FALSE, indicating
that, by default, the test checks every line in the log file for the existence of each of the
configured SEARCHPATTERNS. By setting this parameter to TRUE, you can instruct the
test to ignore a line and move to the next as soon as a match for one of the configured
patterns is found in that line. For example, assume that Pattern1:*fatal*,Pattern2:*error* is
the SEARCHPATTERN that has been configured. If UNIQUEMATCH is set to FALSE,
then the test will read every line in the log file completely to check for the existence of
messages embedding the strings 'fatal' and 'error'. If both the patterns are detected in the
same line, then the number of matches will be incremented by 2. On the other hand, if
UNIQUEMATCH is set to TRUE, then the test will read a line only until a match for one of
the configured patterns is found and not both. This means that even if the strings 'fatal' and
'error' follow one another in the same line, the test will consider only the first match and not
the next. The match count in this case will therefore be incremented by only 1.
9. ROTATINGFILE - This flag governs the display of descriptors for this test in the eG
monitoring console.
If this flag is set to true and the ALERTFILE text box contains the full path to a specific
(log/text) file, then, the descriptors of this test will be displayed in the following format:
Directory_containing_monitored_file:<SearchPattern>. For instance, if the ALERTFILE
parameter is set to c:\zdm\logs\syslog.txt, and ROTATINGFILE is set to true, then, your
descriptor will be of the following format: c:\zdm\logs:<SearchPattern>. On the other
hand, if the ROTATINGFILE flag had been set to false, then the descriptors will be of the
following format: <FileName>:<SearchPattern> - i.e., syslog.txt:<SearchPattern> in the
case of the example above.
If this flag is set to true and the ALERTFILE parameter is set to the directory containing
log files, then, the descriptors of this test will be displayed in the format:
Configured_directory_path:<SearchPattern>. For instance, if the ALERTFILE parameter is
set to c:\zdm\logs, and ROTATINGFILE is set to true, then, your descriptor will be:
c:\zdm\logs:<SearchPattern>. On the other hand, if the ROTATINGFILE parameter had
been set to false, then the descriptors will be of the following format:
Configured_directory:<SearchPattern> - i.e., logs:<SearchPattern> in the case of the
example above.
If this flag is set to true and the ALERTFILE parameter is set to a specific file pattern,
then, the descriptors of this test will be of the following format:
<FilePattern>:<SearchPattern>. For instance, if the ALERTFILE parameter is set to
c:\zdm\logs\*sys*, and ROTATINGFILE is set to true, then, your descriptor will be:
*sys*:<SearchPattern>. In this case, the descriptor format will not change even if the
ROTATINGFILE flag status is changed.
Monitor ing the XenMob i le MDM Server
12
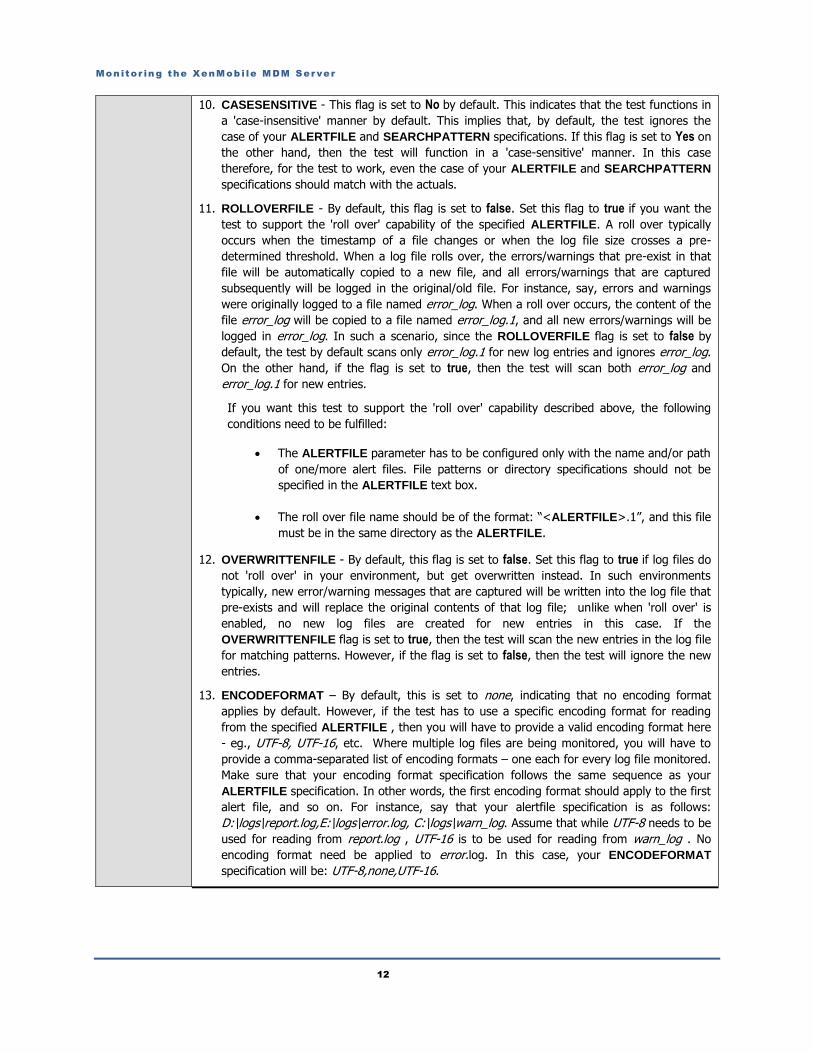
10. CASESENSITIVE - This flag is set to No by default. This indicates that the test functions in
a 'case-insensitive' manner by default. This implies that, by default, the test ignores the
case of your ALERTFILE and SEARCHPATTERN specifications. If this flag is set to Yes on
the other hand, then the test will function in a 'case-sensitive' manner. In this case
therefore, for the test to work, even the case of your ALERTFILE and SEARCHPATTERN
specifications should match with the actuals.
11. ROLLOVERFILE - By default, this flag is set to false. Set this flag to true if you want the
test to support the 'roll over' capability of the specified ALERTFILE. A roll over typically
occurs when the timestamp of a file changes or when the log file size crosses a pre-
determined threshold. When a log file rolls over, the errors/warnings that pre-exist in that
file will be automatically copied to a new file, and all errors/warnings that are captured
subsequently will be logged in the original/old file. For instance, say, errors and warnings
were originally logged to a file named error_log. When a roll over occurs, the content of the
file error_log will be copied to a file named error_log.1, and all new errors/warnings will be
logged in error_log. In such a scenario, since the ROLLOVERFILE flag is set to false by
default, the test by default scans only error_log.1 for new log entries and ignores error_log.
On the other hand, if the flag is set to true, then the test will scan both error_log and
error_log.1 for new entries.
If you want this test to support the 'roll over' capability described above, the following
conditions need to be fulfilled:
The ALERTFILE parameter has to be configured only with the name and/or path
of one/more alert files. File patterns or directory specifications should not be
specified in the ALERTFILE text box.
The roll over file name should be of the format: “<ALERTFILE>.1”, and this file
must be in the same directory as the ALERTFILE.
12. OVERWRITTENFILE - By default, this flag is set to false. Set this flag to true if log files do
not 'roll over' in your environment, but get overwritten instead. In such environments
typically, new error/warning messages that are captured will be written into the log file that
pre-exists and will replace the original contents of that log file; unlike when 'roll over' is
enabled, no new log files are created for new entries in this case. If the
OVERWRITTENFILE flag is set to true, then the test will scan the new entries in the log file
for matching patterns. However, if the flag is set to false, then the test will ignore the new
entries.
13. ENCODEFORMAT – By default, this is set to none, indicating that no encoding format
applies by default. However, if the test has to use a specific encoding format for reading
from the specified ALERTFILE , then you will have to provide a valid encoding format here
- eg., UTF-8, UTF-16, etc. Where multiple log files are being monitored, you will have to
provide a comma-separated list of encoding formats – one each for every log file monitored.
Make sure that your encoding format specification follows the same sequence as your
ALERTFILE specification. In other words, the first encoding format should apply to the first
alert file, and so on. For instance, say that your alertfile specification is as follows:
D:\logs\report.log,E:\logs\error.log, C:\logs\warn_log. Assume that while UTF-8 needs to be
used for reading from report.log , UTF-16 is to be used for reading from warn_log . No
encoding format need be applied to error.log. In this case, your ENCODEFORMAT
specification will be: UTF-8,none,UTF-16.
Monitor ing the XenMob i le MDM Server
13
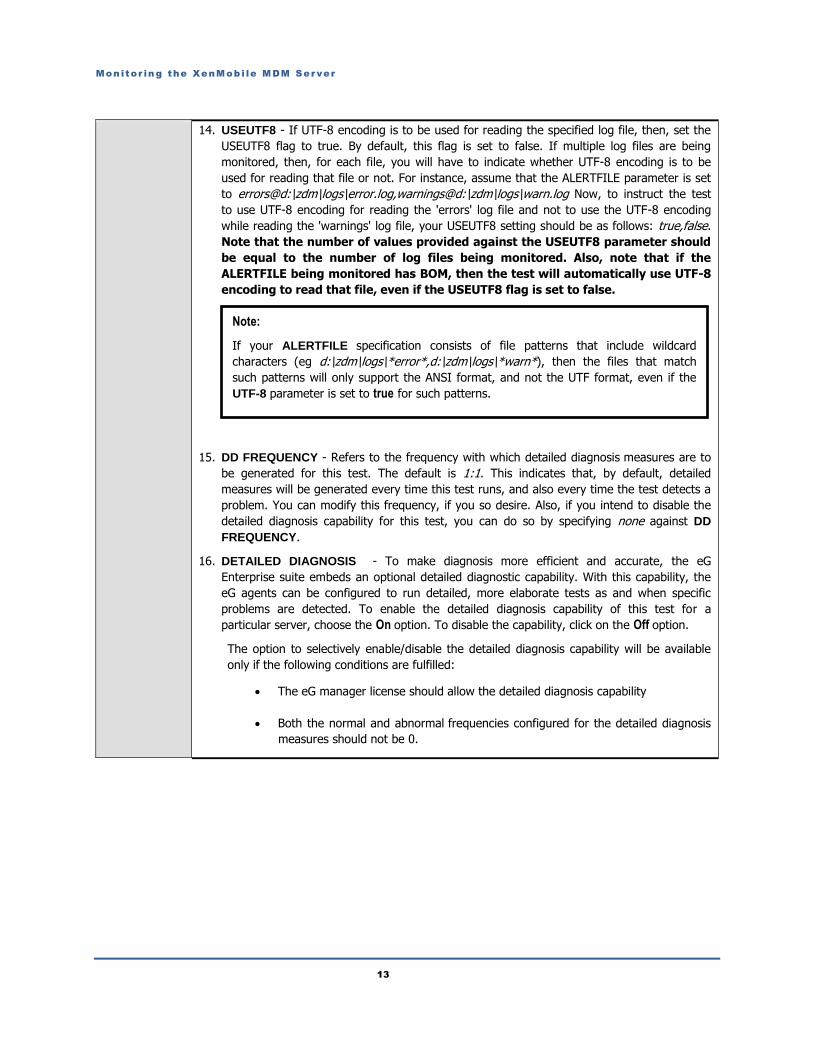
14. USEUTF8 - If UTF-8 encoding is to be used for reading the specified log file, then, set the
USEUTF8 flag to true. By default, this flag is set to false. If multiple log files are being
monitored, then, for each file, you will have to indicate whether UTF-8 encoding is to be
used for reading that file or not. For instance, assume that the ALERTFILE parameter is set
to errors@d:\zdm\logs\error.log,warnings@d:\zdm\logs\warn.log Now, to instruct the test
to use UTF-8 encoding for reading the 'errors' log file and not to use the UTF-8 encoding
while reading the 'warnings' log file, your USEUTF8 setting should be as follows: true,false.
Note that the number of values provided against the USEUTF8 parameter should
be equal to the number of log files being monitored. Also, note that if the
ALERTFILE being monitored has BOM, then the test will automatically use UTF-8
encoding to read that file, even if the USEUTF8 flag is set to false.
15. DD FREQUENCY - Refers to the frequency with which detailed diagnosis measures are to
be generated for this test. The default is 1:1. This indicates that, by default, detailed
measures will be generated every time this test runs, and also every time the test detects a
problem. You can modify this frequency, if you so desire. Also, if you intend to disable the
detailed diagnosis capability for this test, you can do so by specifying none against DD
FREQUENCY.
16. DETAILED DIAGNOSIS - To make diagnosis more efficient and accurate, the eG
Enterprise suite embeds an optional detailed diagnostic capability. With this capability, the
eG agents can be configured to run detailed, more elaborate tests as and when specific
problems are detected. To enable the detailed diagnosis capability of this test for a
particular server, choose the On option. To disable the capability, click on the Off option.
The option to selectively enable/disable the detailed diagnosis capability will be available
only if the following conditions are fulfilled:
The eG manager license should allow the detailed diagnosis capability
Both the normal and abnormal frequencies configured for the detailed diagnosis
measures should not be 0.
Note:
If your ALERTFILE specification consists of file patterns that include wildcard
characters (eg d:\zdm\logs\*error*,d:\zdm\logs\*warn*), then the files that match
such patterns will only support the ANSI format, and not the UTF format, even if the
UTF-8 parameter is set to true for such patterns.
Monitor ing the XenMob i le MDM Server
14
Outputs of the
test
One set of results for every ALERTFILE and SEARCHPATTERN combination
Measurements
made by the
test
Measurement Measurement
Unit Interpretation
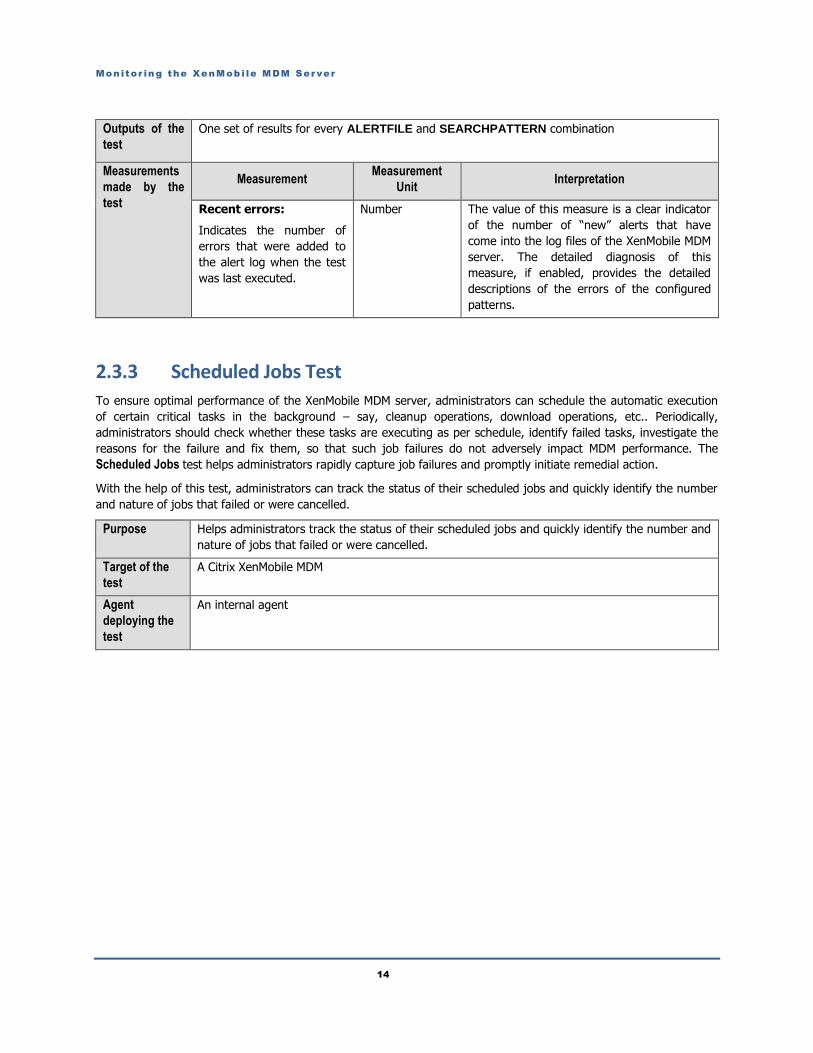
Recent errors:
Indicates the number of
errors that were added to
the alert log when the test
was last executed.
Number The value of this measure is a clear indicator
of the number of “new” alerts that have
come into the log files of the XenMobile MDM
server. The detailed diagnosis of this
measure, if enabled, provides the detailed
descriptions of the errors of the configured
patterns.
2.3.3 Scheduled Jobs Test
To ensure optimal performance of the XenMobile MDM server, administrators can schedule the automatic execution
of certain critical tasks in the background – say, cleanup operations, download operations, etc.. Periodically,
administrators should check whether these tasks are executing as per schedule, identify failed tasks, investigate the
reasons for the failure and fix them, so that such job failures do not adversely impact MDM performance. The
Scheduled Jobs test helps administrators rapidly capture job failures and promptly initiate remedial action.
With the help of this test, administrators can track the status of their scheduled jobs and quickly identify the number
and nature of jobs that failed or were cancelled.
Purpose Helps administrators track the status of their scheduled jobs and quickly identify the number and
nature of jobs that failed or were cancelled.
Target of the
test
A Citrix XenMobile MDM
Agent
deploying the
test
An internal agent
Monitor ing the XenMob i le MDM Server
15
Configurable
parameters for
the test
1. TEST PERIOD - How often should the test be executed
2. HOST - The host for which the test is to be configured.
3. LOGIN URL – This refers to the URL of the login page of the XenMobile Device Manager
console. By default, eG Enterprise auto-discovers this URL. This is why, the LOGIN URL is
set to none by default.
4. USERNAME and PASSWORD – Specify the credentials of a XenMobile Device Manager
web console user with the Administrator role.
5. CONFIRM PASSWORD – Confirm the PASSWORD by retyping it here.
6. SSL – Indicate whether/not the XenMobile MDM server is SSL-enabled. By default, this flag
is set to No.
7. DETAILED DIAGNOSIS - To make diagnosis more efficient and accurate, the eG
Enterprise suite embeds an optional detailed diagnostic capability. With this capability, the
eG agents can be configured to run detailed, more elaborate tests as and when specific
problems are detected. To enable the detailed diagnosis capability of this test for a
particular server, choose the On option. To disable the capability, click on the Off option.
The option to selectively enable/disable the detailed diagnosis capability will be available
only if the following conditions are fulfilled:
The eG manager license should allow the detailed diagnosis capability
Both the normal and abnormal frequencies configured for the detailed diagnosis
measures should not be 0.
Outputs of the
test
One set of results for the XenMobile MDM server being monitored
Measurements
made by the
test
Measurement Measurement
Unit Interpretation
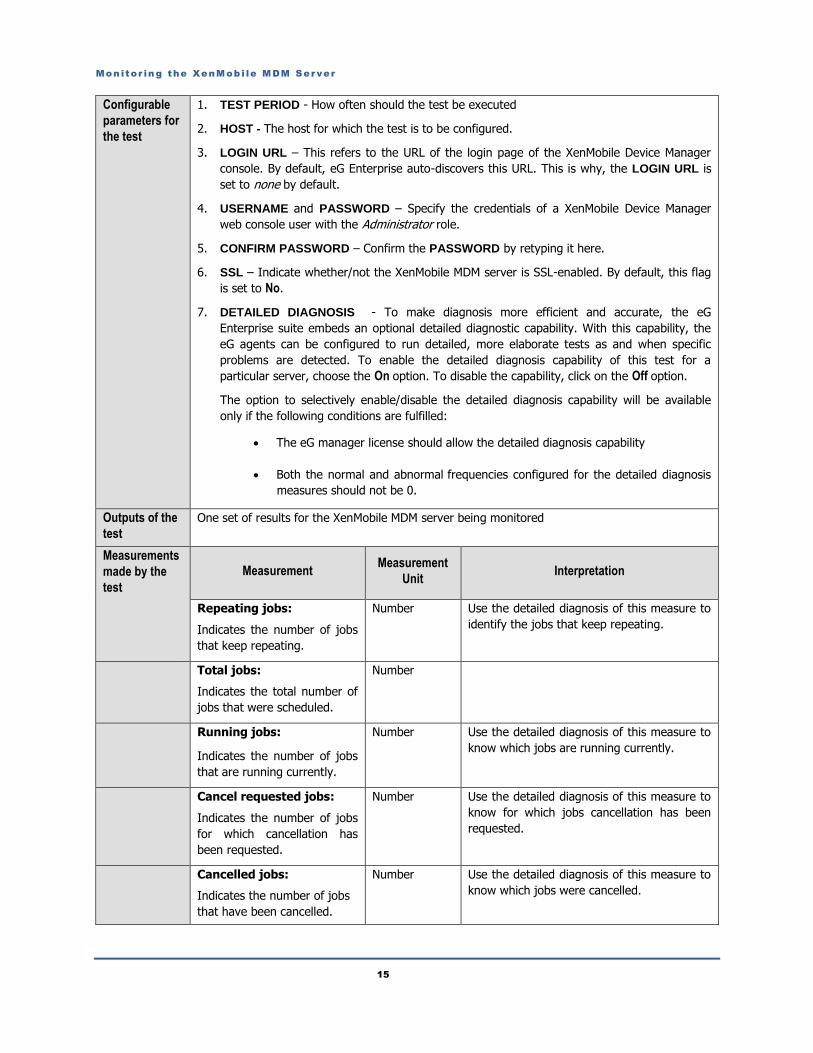
Repeating jobs:
Indicates the number of jobs
that keep repeating.
Number Use the detailed diagnosis of this measure to
identify the jobs that keep repeating.
Total jobs:
Indicates the total number of
jobs that were scheduled.
Number
Running jobs:
Indicates the number of jobs
that are running currently.
Number Use the detailed diagnosis of this measure to
know which jobs are running currently.
Cancel requested jobs:
Indicates the number of jobs
for which cancellation has
been requested.
Number Use the detailed diagnosis of this measure to
know for which jobs cancellation has been
requested.
Cancelled jobs:
Indicates the number of jobs
that have been cancelled.
Number Use the detailed diagnosis of this measure to
know which jobs were cancelled.
Monitor ing the XenMob i le MDM Server
16
Recently ran jobs:
Indicates the number of jobs
that ran during the last
measurement period.
Number
Recently failed jobs:
Indicates the number of jobs
that failed during the last
measurement period.
Number Ideally, the value of this measure should be
0. If this measure reports a non-zero value,
use the detailed diagnosis of this measure to
know which jobs failed.
Last executed jobs:
Indicates the number of jobs
that were executed during the
last measurement period.
Number Use the detailed diagnosis of this measure to
know which jobs executed during the last
measurement period.
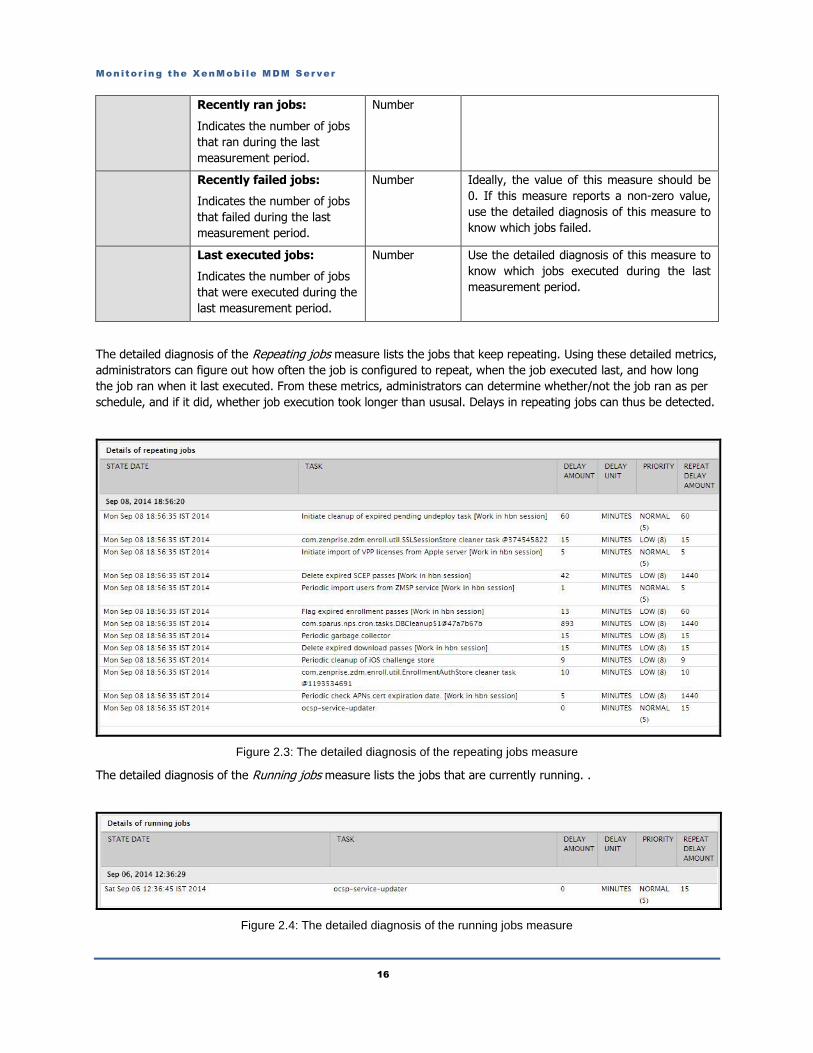
The detailed diagnosis of the Repeating jobs measure lists the jobs that keep repeating. Using these detailed metrics,
administrators can figure out how often the job is configured to repeat, when the job executed last, and how long
the job ran when it last executed. From these metrics, administrators can determine whether/not the job ran as per
schedule, and if it did, whether job execution took longer than ususal. Delays in repeating jobs can thus be detected.
Figure 2.3: The detailed diagnosis of the repeating jobs measure
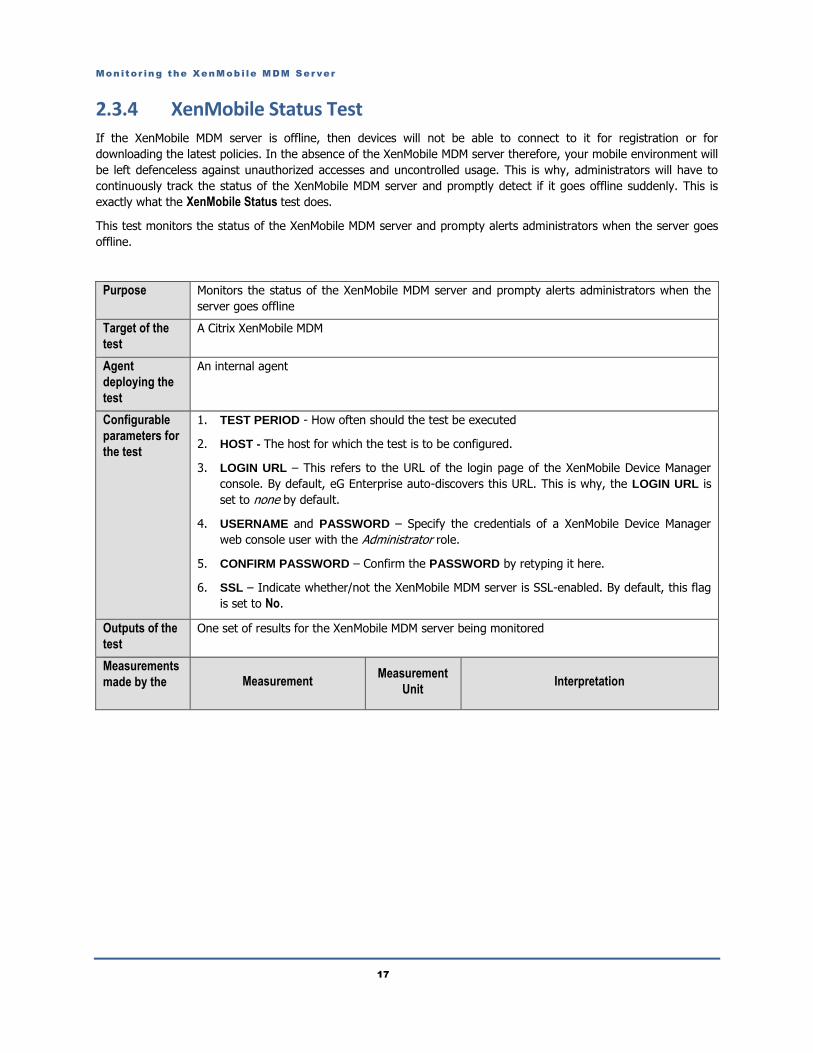
The detailed diagnosis of the Running jobs measure lists the jobs that are currently running. .
Figure 2.4: The detailed diagnosis of the running jobs measure
Monitor ing the XenMob i le MDM Server
17
2.3.4 XenMobile Status Test
If the XenMobile MDM server is offline, then devices will not be able to connect to it for registration or for
downloading the latest policies. In the absence of the XenMobile MDM server therefore, your mobile environment will
be left defenceless against unauthorized accesses and uncontrolled usage. This is why, administrators will have to
continuously track the status of the XenMobile MDM server and promptly detect if it goes offline suddenly. This is
exactly what the XenMobile Status test does.
This test monitors the status of the XenMobile MDM server and prompty alerts administrators when the server goes
offline.
Purpose Monitors the status of the XenMobile MDM server and prompty alerts administrators when the
server goes offline
Target of the
test
A Citrix XenMobile MDM
Agent
deploying the
test
An internal agent
Configurable
parameters for
the test
1. TEST PERIOD - How often should the test be executed
2. HOST - The host for which the test is to be configured.
3. LOGIN URL – This refers to the URL of the login page of the XenMobile Device Manager
console. By default, eG Enterprise auto-discovers this URL. This is why, the LOGIN URL is
set to none by default.
4. USERNAME and PASSWORD – Specify the credentials of a XenMobile Device Manager
web console user with the Administrator role.
5. CONFIRM PASSWORD – Confirm the PASSWORD by retyping it here.
6. SSL – Indicate whether/not the XenMobile MDM server is SSL-enabled. By default, this flag
is set to No.
Outputs of the
test
One set of results for the XenMobile MDM server being monitored
Measurements
made by the Measurement Measurement
Unit Interpretation
Monitor ing the XenMob i le MDM Server
18
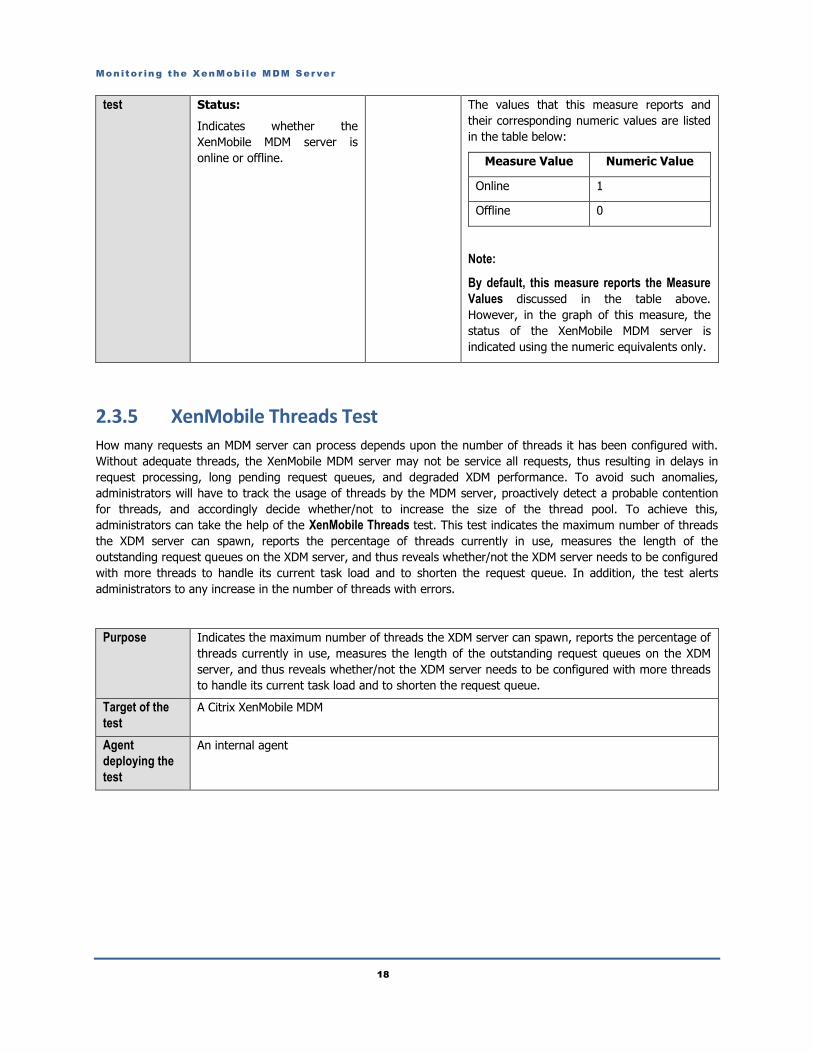
test Status:
Indicates whether the
XenMobile MDM server is
online or offline.
The values that this measure reports and
their corresponding numeric values are listed
in the table below:
Measure Value Numeric Value
Online 1
Offline 0
Note:
By default, this measure reports the Measure
Values discussed in the table above.
However, in the graph of this measure, the
status of the XenMobile MDM server is
indicated using the numeric equivalents only.
2.3.5 XenMobile Threads Test
How many requests an MDM server can process depends upon the number of threads it has been configured with.
Without adequate threads, the XenMobile MDM server may not be service all requests, thus resulting in delays in
request processing, long pending request queues, and degraded XDM performance. To avoid such anomalies,
administrators will have to track the usage of threads by the MDM server, proactively detect a probable contention
for threads, and accordingly decide whether/not to increase the size of the thread pool. To achieve this,
administrators can take the help of the XenMobile Threads test. This test indicates the maximum number of threads
the XDM server can spawn, reports the percentage of threads currently in use, measures the length of the
outstanding request queues on the XDM server, and thus reveals whether/not the XDM server needs to be configured
with more threads to handle its current task load and to shorten the request queue. In addition, the test alerts
administrators to any increase in the number of threads with errors.
Purpose Indicates the maximum number of threads the XDM server can spawn, reports the percentage of
threads currently in use, measures the length of the outstanding request queues on the XDM
server, and thus reveals whether/not the XDM server needs to be configured with more threads
to handle its current task load and to shorten the request queue.
Target of the
test
A Citrix XenMobile MDM
Agent
deploying the
test
An internal agent
Monitor ing the XenMob i le MDM Server
19
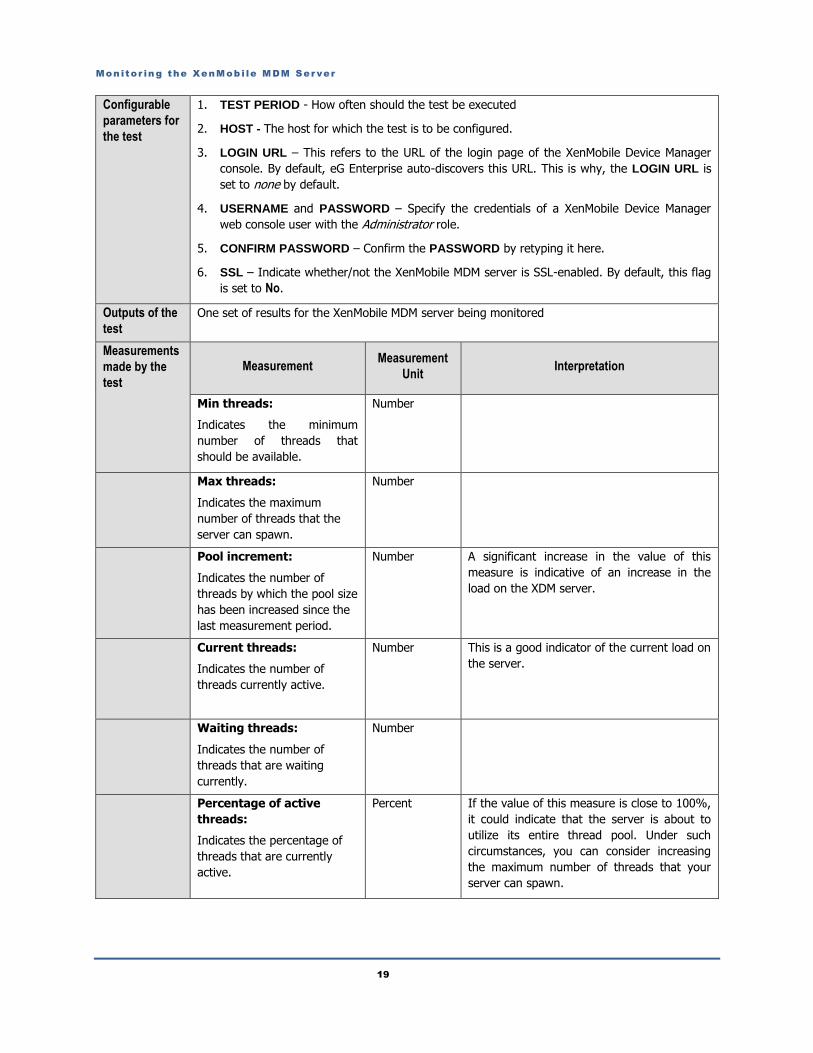
Configurable
parameters for
the test
1. TEST PERIOD - How often should the test be executed
2. HOST - The host for which the test is to be configured.
3. LOGIN URL – This refers to the URL of the login page of the XenMobile Device Manager
console. By default, eG Enterprise auto-discovers this URL. This is why, the LOGIN URL is
set to none by default.
4. USERNAME and PASSWORD – Specify the credentials of a XenMobile Device Manager
web console user with the Administrator role.
5. CONFIRM PASSWORD – Confirm the PASSWORD by retyping it here.
6. SSL – Indicate whether/not the XenMobile MDM server is SSL-enabled. By default, this flag
is set to No.
Outputs of the
test
One set of results for the XenMobile MDM server being monitored
Measurements
made by the
test
Measurement Measurement
Unit Interpretation
Min threads:
Indicates the minimum
number of threads that
should be available.
Number
Max threads:
Indicates the maximum
number of threads that the
server can spawn.
Number
Pool increment:
Indicates the number of
threads by which the pool size
has been increased since the
last measurement period.
Number A significant increase in the value of this
measure is indicative of an increase in the
load on the XDM server.
Current threads:
Indicates the number of
threads currently active.
Number This is a good indicator of the current load on
the server.
Waiting threads:
Indicates the number of
threads that are waiting
currently.
Number
Percentage of active
threads:
Indicates the percentage of
threads that are currently
active.
Percent If the value of this measure is close to 100%,
it could indicate that the server is about to
utilize its entire thread pool. Under such
circumstances, you can consider increasing
the maximum number of threads that your
server can spawn.
Monitor ing the XenMob i le MDM Server
20
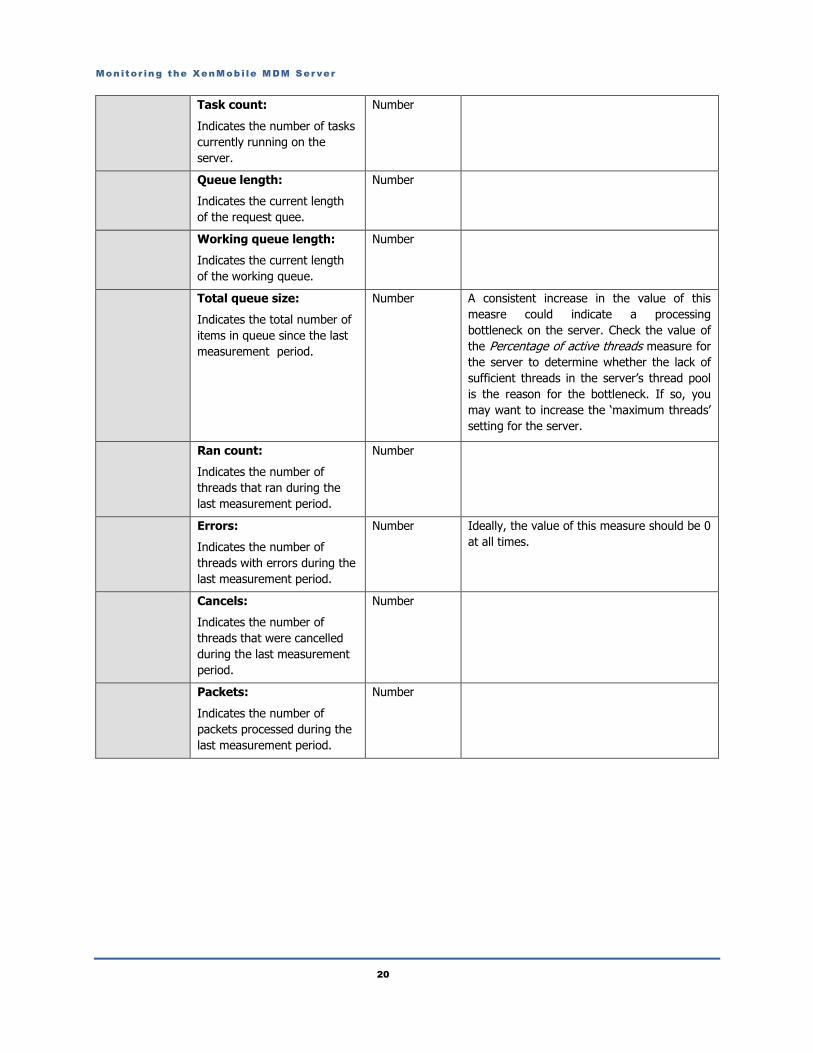
Task count:
Indicates the number of tasks
currently running on the
server.
Number
Queue length:
Indicates the current length
of the request quee.
Number
Working queue length:
Indicates the current length
of the working queue.
Number
Total queue size:
Indicates the total number of
items in queue since the last
measurement period.
Number A consistent increase in the value of this
measre could indicate a processing
bottleneck on the server. Check the value of
the Percentage of active threads measure for
the server to determine whether the lack of
sufficient threads in the server’s thread pool
is the reason for the bottleneck. If so, you
may want to increase the ‘maximum threads’
setting for the server.
Ran count:
Indicates the number of
threads that ran during the
last measurement period.
Number
Errors:
Indicates the number of
threads with errors during the
last measurement period.
Number Ideally, the value of this measure should be 0
at all times.
Cancels:
Indicates the number of
threads that were cancelled
during the last measurement
period.
Number
Packets:
Indicates the number of
packets processed during the
last measurement period.
Number
Monitor ing the XenMob i le MDM Server
21
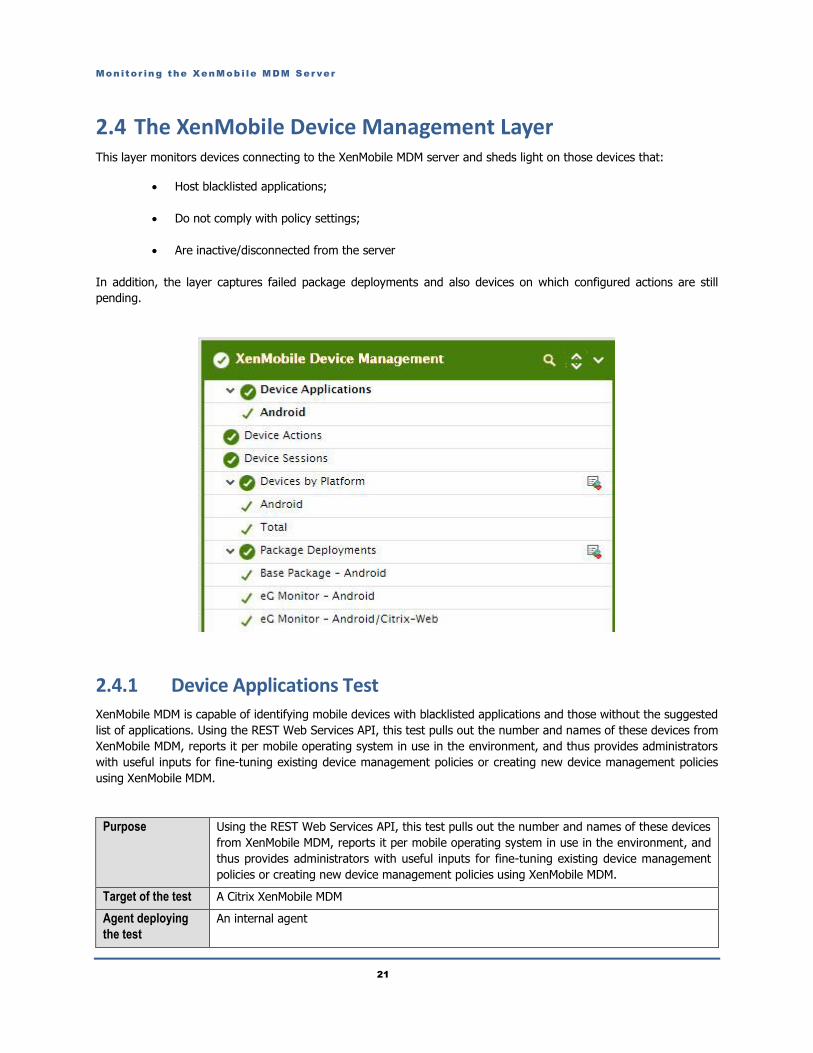
2.4 The XenMobile Device Management Layer This layer monitors devices connecting to the XenMobile MDM server and sheds light on those devices that:
Host blacklisted applications;
Do not comply with policy settings;
Are inactive/disconnected from the server
In addition, the layer captures failed package deployments and also devices on which configured actions are still
pending.
2.4.1 Device Applications Test
XenMobile MDM is capable of identifying mobile devices with blacklisted applications and those without the suggested
list of applications. Using the REST Web Services API, this test pulls out the number and names of these devices from
XenMobile MDM, reports it per mobile operating system in use in the environment, and thus provides administrators
with useful inputs for fine-tuning existing device management policies or creating new device management policies
using XenMobile MDM.
Purpose Using the REST Web Services API, this test pulls out the number and names of these devices
from XenMobile MDM, reports it per mobile operating system in use in the environment, and
thus provides administrators with useful inputs for fine-tuning existing device management
policies or creating new device management policies using XenMobile MDM.
Target of the test A Citrix XenMobile MDM
Agent deploying
the test
An internal agent
Monitor ing the XenMob i le MDM Server
22
Configurable
parameters for the
test
1. TEST PERIOD - How often should the test be executed
2. HOST - The host for which the test is to be configured.
3. WSDL URL – This test connects to XenMobile’s REST Web Services API to pull out the
required metrics. For this, you need to configure the test with the URL for connecting to
the REST Web Services API. By default, eG Enterprise automatically discovers this URL
and displays the same against WSDL URL.
4. USERNAME and PASSWORD – Specify the credentials of a XenMobile Device Manager
web console user with the Administrator role.
5. CONFIRM PASSWORD – Confirm the PASSWORD by retyping it here.
6. SSL – Indicate whether/not the XenMobile MDM server is SSL-enabled. By default, this
flag is set to No.
7. DETAILED DIAGNOSIS - To make diagnosis more efficient and accurate, the eG
Enterprise suite embeds an optional detailed diagnostic capability. With this capability,
the eG agents can be configured to run detailed, more elaborate tests as and when
specific problems are detected. To enable the detailed diagnosis capability of this test for
a particular server, choose the On option. To disable the capability, click on the Off
option.
The option to selectively enable/disable the detailed diagnosis capability will be
available only if the following conditions are fulfilled:
The eG manager license should allow the detailed diagnosis capability
Both the normal and abnormal frequencies configured for the detailed
diagnosis measures should not be 0.
Outputs of the test One set of results for each mobile operating system connecting to the corporate network
Measurements
made by the test Measurement Measurement
Unit Interpretation
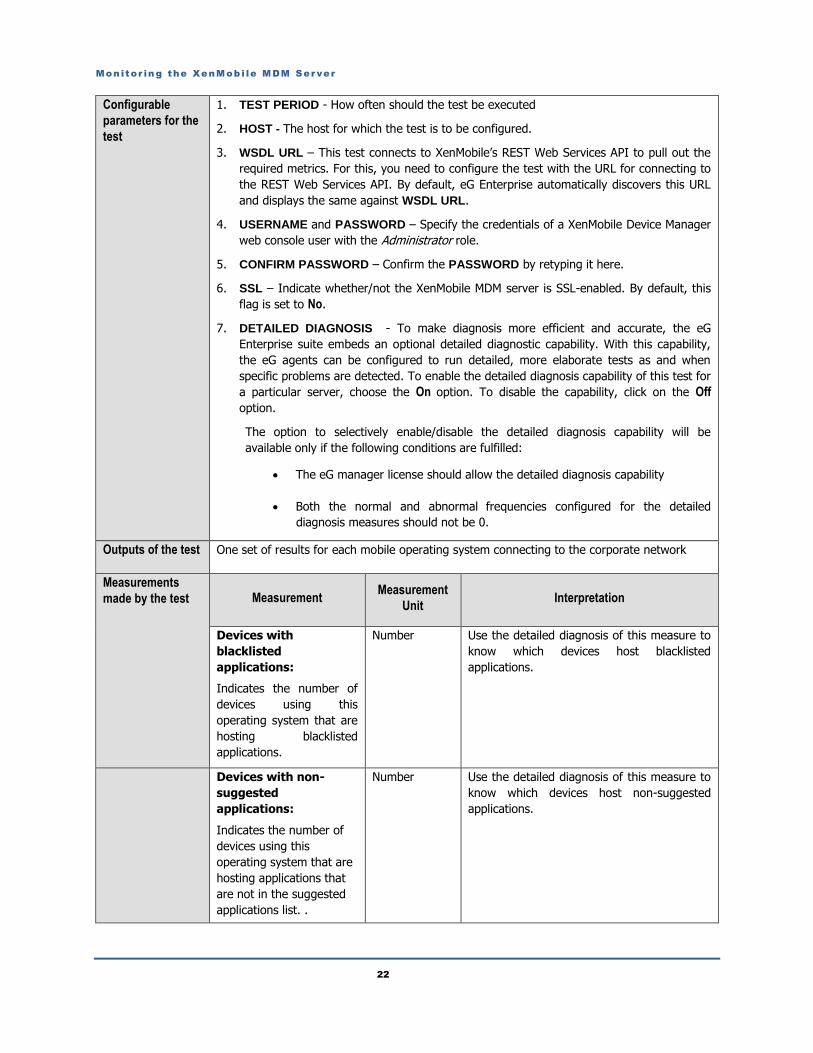
Devices with
blacklisted
applications:
Indicates the number of
devices using this
operating system that are
hosting blacklisted
applications.
Number Use the detailed diagnosis of this measure to
know which devices host blacklisted
applications.
Devices with non-
suggested
applications:
Indicates the number of
devices using this
operating system that are
hosting applications that
are not in the suggested
applications list. .
Number Use the detailed diagnosis of this measure to
know which devices host non-suggested
applications.
Monitor ing the XenMob i le MDM Server
23
Devices with missing
required applications:
Indicates the number of
devices using this
operating system that do
not contain one/more
required applications .
Number Use the detailed diagnosis of this measure to
know which devices do not host certain
required applications.
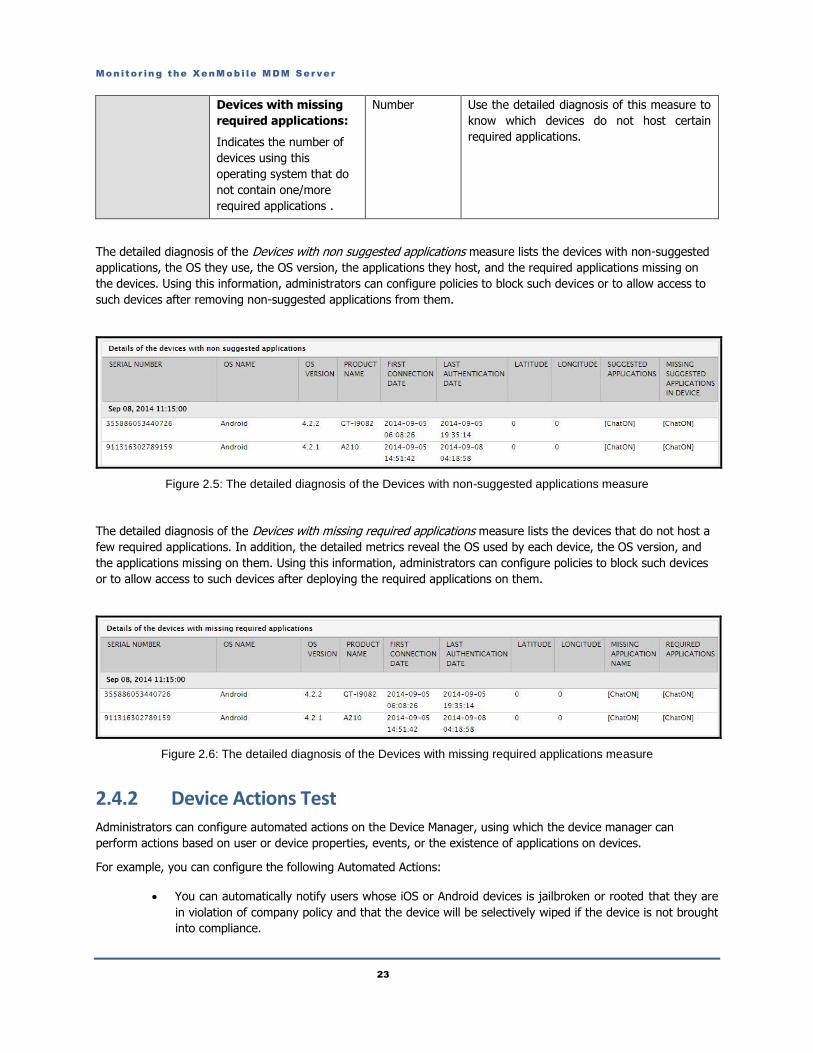
The detailed diagnosis of the Devices with non suggested applications measure lists the devices with non-suggested
applications, the OS they use, the OS version, the applications they host, and the required applications missing on
the devices. Using this information, administrators can configure policies to block such devices or to allow access to
such devices after removing non-suggested applications from them.
Figure 2.5: The detailed diagnosis of the Devices with non-suggested applications measure
The detailed diagnosis of the Devices with missing required applications measure lists the devices that do not host a
few required applications. In addition, the detailed metrics reveal the OS used by each device, the OS version, and
the applications missing on them. Using this information, administrators can configure policies to block such devices
or to allow access to such devices after deploying the required applications on them.
Figure 2.6: The detailed diagnosis of the Devices with missing required applications measure
2.4.2 Device Actions Test Administrators can configure automated actions on the Device Manager, using which the device manager can
perform actions based on user or device properties, events, or the existence of applications on devices.
For example, you can configure the following Automated Actions:
You can automatically notify users whose iOS or Android devices is jailbroken or rooted that they are
in violation of company policy and that the device will be selectively wiped if the device is not brought
into compliance.
Monitor ing the XenMob i le MDM Server
24
You can automatically enforce a geo-fencing policy whereby if a user's device leaves a defined
geographical perimeter, the device is blocked from accessing your organization's email, is selectively
wiped, or is revoked.
You can alertusers automatically when mobile devices are roaming domestically or internationally and
that they may be charged extra for the service.
You can wipe a user's device automatically when the user leaves the company, and can disable the
user's Active Directory account, so that the user can no longer access your organization's data.
You can place a user's device into an Out Of Compliance state automatically if the user installs a
blacklisted app, and you can send the user a notification informing them that they have broken the
organization's mobile app policy.
To understand the workload imposed by these actions on the server, measure the efficiency of the server in
performing these actions, and proactively isolate bottlenecks in the execution of these actions, administrators should
use the Device Actions test. This test tracks the automated actions triggered on the XenMobile MDM server, reports
the number and nature of actions completed by the server and the count of actions pending on the server, and thus
points to probable bottlenecks in the execution of these actions.
Purpose Tracks the automated actions triggered on the XenMobile MDM server, reports the number of
actions completed by the server and the count of actions pending on the server, and thus
points to probable bottlenecks in the execution of these actions.
Target of the test A Citrix XenMobile MDM
Agent deploying
the test
An internal agent
Monitor ing the XenMob i le MDM Server
25
Configurable
parameters for the
test
1. TEST PERIOD - How often should the test be executed
2. HOST - The host for which the test is to be configured.
3. WSDL URL – This test connects to XenMobile’s REST Web Services API to pull out the
required metrics. For this, you need to configure the test with the URL for connecting to
the REST Web Services API. By default, eG Enterprise automatically discovers this URL
and displays the same against WSDL URL.
4. USERNAME and PASSWORD – Specify the credentials of a XenMobile Device Manager
web console user with the Administrator role.
5. CONFIRM PASSWORD – Confirm the PASSWORD by retyping it here.
6. SSL – Indicate whether/not the XenMobile MDM server is SSL-enabled. By default, this
flag is set to No.
7. DETAILED DIAGNOSIS - To make diagnosis more efficient and accurate, the eG
Enterprise suite embeds an optional detailed diagnostic capability. With this capability,
the eG agents can be configured to run detailed, more elaborate tests as and when
specific problems are detected. To enable the detailed diagnosis capability of this test for
a particular server, choose the On option. To disable the capability, click on the Off
option.
The option to selectively enable/disable the detailed diagnosis capability will be
available only if the following conditions are fulfilled:
The eG manager license should allow the detailed diagnosis capability
Both the normal and abnormal frequencies configured for the detailed
diagnosis measures should not be 0.
Outputs of the test One set of results for the XenMobile MDM server monitored
Measurements
made by the test Measurement Measurement
Unit Interpretation
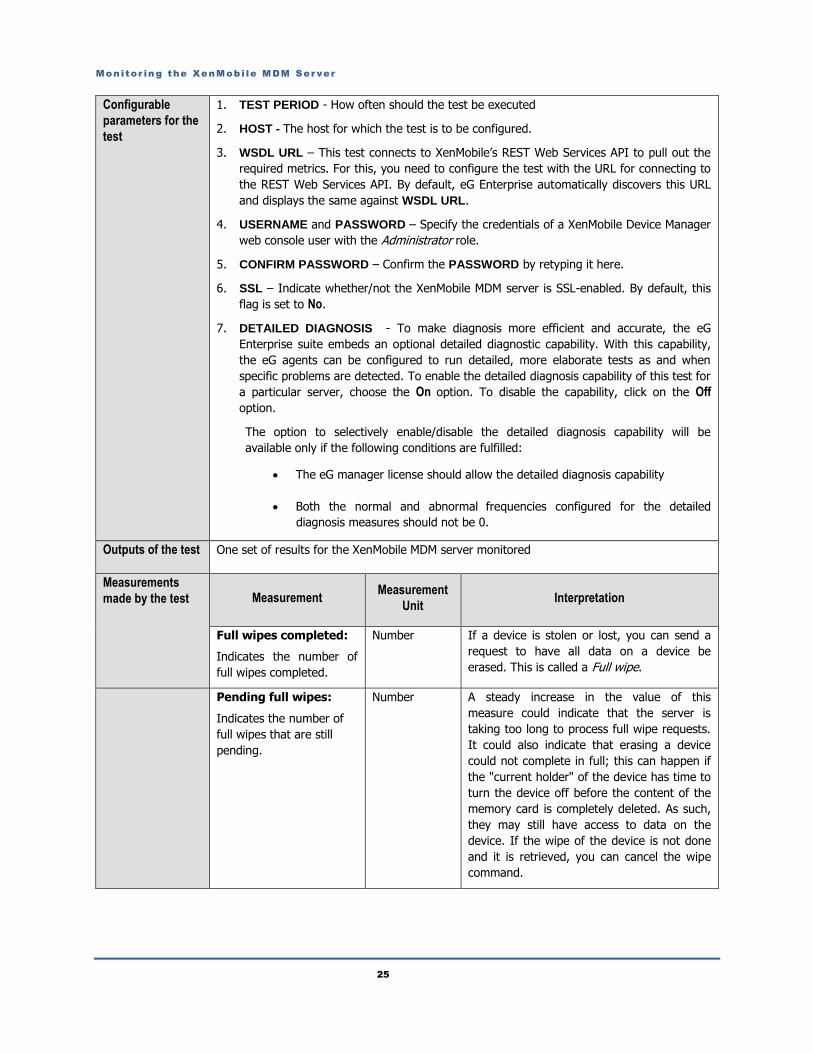
Full wipes completed:
Indicates the number of
full wipes completed.
Number If a device is stolen or lost, you can send a
request to have all data on a device be
erased. This is called a Full wipe.
Pending full wipes:
Indicates the number of
full wipes that are still
pending.
Number A steady increase in the value of this
measure could indicate that the server is
taking too long to process full wipe requests.
It could also indicate that erasing a device
could not complete in full; this can happen if
the "current holder" of the device has time to
turn the device off before the content of the
memory card is completely deleted. As such,
they may still have access to data on the
device. If the wipe of the device is not done
and it is retrieved, you can cancel the wipe
command.
Monitor ing the XenMob i le MDM Server
26
Corporate wipes
completed:
Indicates the number of
corporate wipes
completed by the server.
Number When a corporate/selective wipe is
performed, only the corporate data from the
end user’s device is deleted, leaving the
personal data intact.
Pending corporate
wipes:
Indicates the number of
corporate wipes still
pending on the server.
Number A steady increase in the value of this
measure could indicate that the server is
taking too long to process corporate wipe
requests.
Locks completed:
Indicates the number of
device locks completed.
Number If the device is lost, but you are not sure it
was stolen, you can remotely "lock" the
device.
For Android and Windows Mobile devices, the
system will then generate a PIN code that will
be set in the device if the user had not set a
PIN code already. To access the device, the
user will have to type that PIN code.
Pending locks:
Indicates the number of
device locks pending on
the server.
Number A steady increase in the value of this
measure could indicate that the server is
taking too long to process device locks.
Tracks completed:
Indicates the number of
device tracks completed.
Number
Pending tracks:
Indicates the number of
device tracks that are still
pending on the server.
Number A steady increase in the value of this
measure could indicate that the server is
taking too long to perform device tracking.
2.4.3 Device Sessions Test At any given point in time, administrators should be able to tell the number and names of devices connected to the
XenMobile MDM server, as this is not only a good measure of the current workload of the server, but also points to
the devices that are contributing to the load. In addition, administrators should also be able predict the future device
load on the server, so that they can figure out whether/not the server has been sized right to handle the current and
expected device load. To achieve this, administrators can use the Device Sessions test. This test indicates the current
load on the server and enables administrators to gauge the future load as well by reporting the count of devices
currently connected to the server and those for which the connection will resume shortly. The device IDs are also
revealed as part of detailed diagnosis.
Purpose Indicates the current load on the server and enables administrators to gauge the future load
as well by reporting the count of devices currently connected to the server and those for
which the connection will resume shortly
Monitor ing the XenMob i le MDM Server
27
Target of the test A Citrix XenMobile MDM
Agent deploying
the test
An internal agent
Configurable
parameters for the
test
1. TEST PERIOD - How often should the test be executed
2. HOST - The host for which the test is to be configured.
3. WSDL URL – This test connects to XenMobile’s REST Web Services API to pull out the
required metrics. For this, you need to configure the test with the URL for connecting to
the REST Web Services API. By default, eG Enterprise automatically discovers this URL
and displays the same against WSDL URL.
4. USERNAME and PASSWORD – Specify the credentials of a XenMobile Device Manager
web console user with the Administrator role.
5. CONFIRM PASSWORD – Confirm the PASSWORD by retyping it here.
6. SSL – Indicate whether/not the XenMobile MDM server is SSL-enabled. By default, this
flag is set to No.
7. DETAILED DIAGNOSIS - To make diagnosis more efficient and accurate, the eG
Enterprise suite embeds an optional detailed diagnostic capability. With this capability,
the eG agents can be configured to run detailed, more elaborate tests as and when
specific problems are detected. To enable the detailed diagnosis capability of this test for
a particular server, choose the On option. To disable the capability, click on the Off
option.
The option to selectively enable/disable the detailed diagnosis capability will be
available only if the following conditions are fulfilled:
The eG manager license should allow the detailed diagnosis capability
Both the normal and abnormal frequencies configured for the detailed
diagnosis measures should not be 0.
Outputs of the test One set of results for the XenMobile MDM server monitored
Measurements
made by the test Measurement Measurement
Unit Interpretation
Connected devices:
Indicates the number of
devices currently
connected to the server.
Number This is a good measure of the current
workload of the server. Use the detailed
diagnosis of this test to know which devices
are currently connected to the server.
Resume expected
devices:
Indicates the number of
resume expected devices.
Number This denotes the number of devices that are
currently disconnected from the server, but
for which the connection is likely to resume
shortly. The value of this measure therefore
indicates the anticipated device load on the
server. Use the detailed diagnosis of this test
to know for which the connection is expected
to resume.
Monitor ing the XenMob i le MDM Server
28
Resume requested
devices:
Indicates the number of
resume requested
devices.
Number This denotes the number of devices that are
currently disconnected from the server, but
for which a connection continuance has been
requested. The value of this measure
therefore indicates the anticipated device
load on the server. Use the detailed diagnosis
of this test to know for which devices
connection continuance has been requested.
F Created devices:
Indicates the number of
devices that have been
created on the server.
Number Use the detailed diagnosis of this measure to
know which devices are created on the
server.
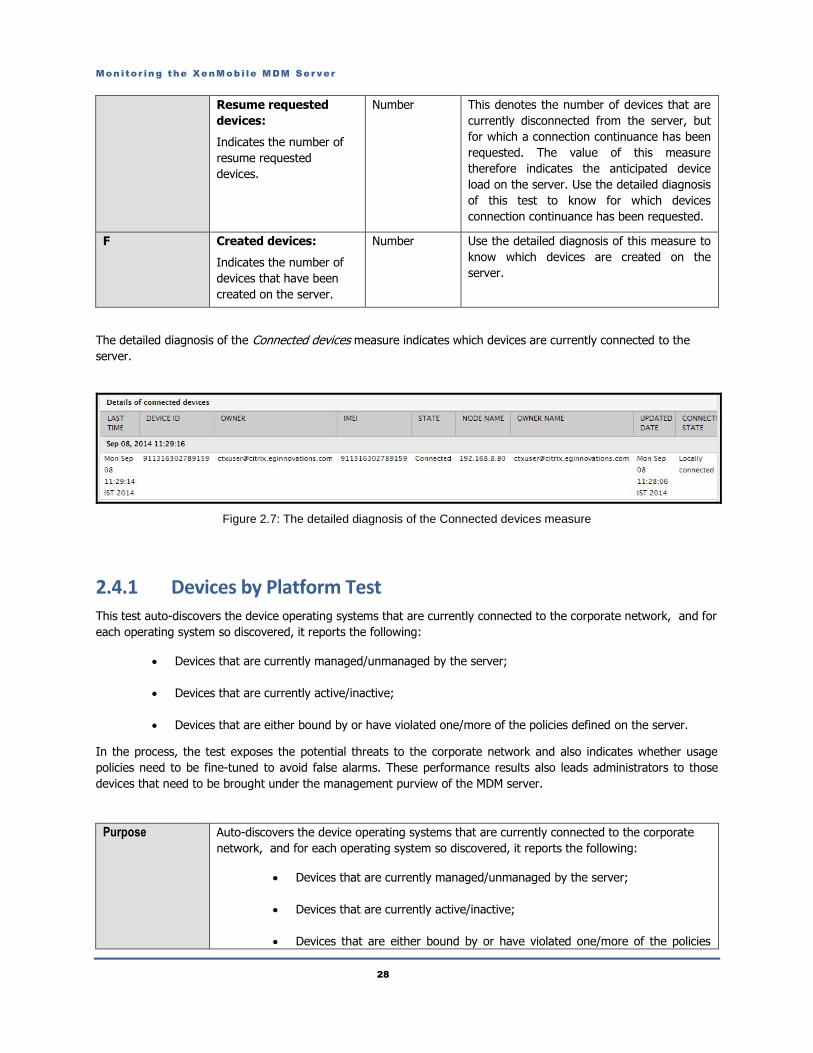
The detailed diagnosis of the Connected devices measure indicates which devices are currently connected to the
server.
Figure 2.7: The detailed diagnosis of the Connected devices measure
2.4.1 Devices by Platform Test This test auto-discovers the device operating systems that are currently connected to the corporate network, and for
each operating system so discovered, it reports the following:
Devices that are currently managed/unmanaged by the server;
Devices that are currently active/inactive;
Devices that are either bound by or have violated one/more of the policies defined on the server.
In the process, the test exposes the potential threats to the corporate network and also indicates whether usage
policies need to be fine-tuned to avoid false alarms. These performance results also leads administrators to those
devices that need to be brought under the management purview of the MDM server.
Purpose Auto-discovers the device operating systems that are currently connected to the corporate
network, and for each operating system so discovered, it reports the following:
Devices that are currently managed/unmanaged by the server;
Devices that are currently active/inactive;
Devices that are either bound by or have violated one/more of the policies
Monitor ing the XenMob i le MDM Server
29
defined on the server.
Target of the test A Citrix XenMobile MDM
Agent deploying
the test
An internal agent
Configurable
parameters for the
test
1. TEST PERIOD - How often should the test be executed
2. HOST - The host for which the test is to be configured.
3. WSDL URL – This test connects to XenMobile’s REST Web Services API to pull out the
required metrics. For this, you need to configure the test with the URL for connecting to
the REST Web Services API. By default, eG Enterprise automatically discovers this URL
and displays the same against WSDL URL.
4. USERNAME and PASSWORD – Specify the credentials of a XenMobile Device Manager
web console user with the Administrator role.
5. CONFIRM PASSWORD – Confirm the PASSWORD by retyping it here.
6. SSL – Indicate whether/not the XenMobile MDM server is SSL-enabled. By default, this
flag is set to No.
7. DETAILED DIAGNOSIS - To make diagnosis more efficient and accurate, the eG
Enterprise suite embeds an optional detailed diagnostic capability. With this capability,
the eG agents can be configured to run detailed, more elaborate tests as and when
specific problems are detected. To enable the detailed diagnosis capability of this test for
a particular server, choose the On option. To disable the capability, click on the Off
option.
The option to selectively enable/disable the detailed diagnosis capability will be
available only if the following conditions are fulfilled:
The eG manager license should allow the detailed diagnosis capability
Both the normal and abnormal frequencies configured for the detailed
diagnosis measures should not be 0.
Outputs of the test One set of results for each mobile operating system currently connected to the XenMobile
MDM server monitored
Measurements
made by the test Measurement Measurement
Unit Interpretation
Inactive devices:
Indicates the number of
devices using this mobile
OS that are currently
inactive.
Number Use the detailed diagnosis of this measure to
know which devices are inactive.
Monitor ing the XenMob i le MDM Server
30
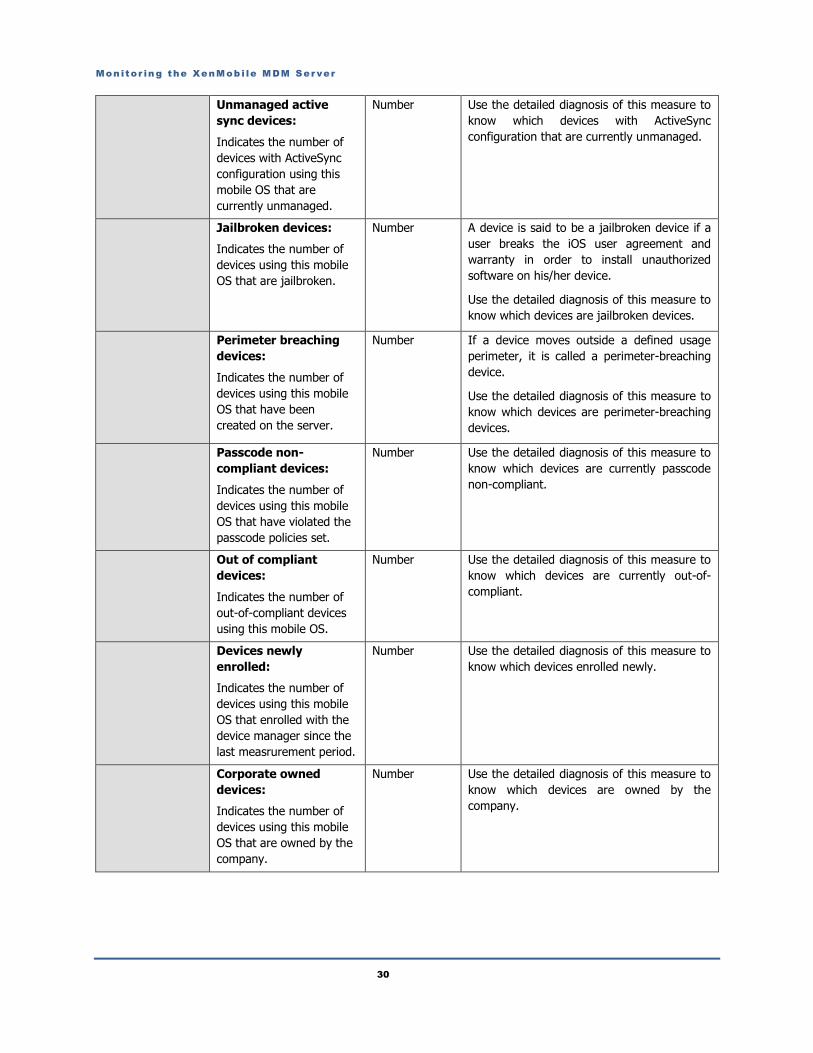
Unmanaged active
sync devices:
Indicates the number of
devices with ActiveSync
configuration using this
mobile OS that are
currently unmanaged.
Number Use the detailed diagnosis of this measure to
know which devices with ActiveSync
configuration that are currently unmanaged.
Jailbroken devices:
Indicates the number of
devices using this mobile
OS that are jailbroken.
Number A device is said to be a jailbroken device if a
user breaks the iOS user agreement and
warranty in order to install unauthorized
software on his/her device.
Use the detailed diagnosis of this measure to
know which devices are jailbroken devices.
Perimeter breaching
devices:
Indicates the number of
devices using this mobile
OS that have been
created on the server.
Number If a device moves outside a defined usage
perimeter, it is called a perimeter-breaching
device.
Use the detailed diagnosis of this measure to
know which devices are perimeter-breaching
devices.
Passcode non-
compliant devices:
Indicates the number of
devices using this mobile
OS that have violated the
passcode policies set.
Number Use the detailed diagnosis of this measure to
know which devices are currently passcode
non-compliant.
Out of compliant
devices:
Indicates the number of
out-of-compliant devices
using this mobile OS.
Number Use the detailed diagnosis of this measure to
know which devices are currently out-of-
compliant.
Devices newly
enrolled:
Indicates the number of
devices using this mobile
OS that enrolled with the
device manager since the
last measrurement period.
Number Use the detailed diagnosis of this measure to
know which devices enrolled newly.
Corporate owned
devices:
Indicates the number of
devices using this mobile
OS that are owned by the
company.
Number Use the detailed diagnosis of this measure to
know which devices are owned by the
company.
Monitor ing the XenMob i le MDM Server
31
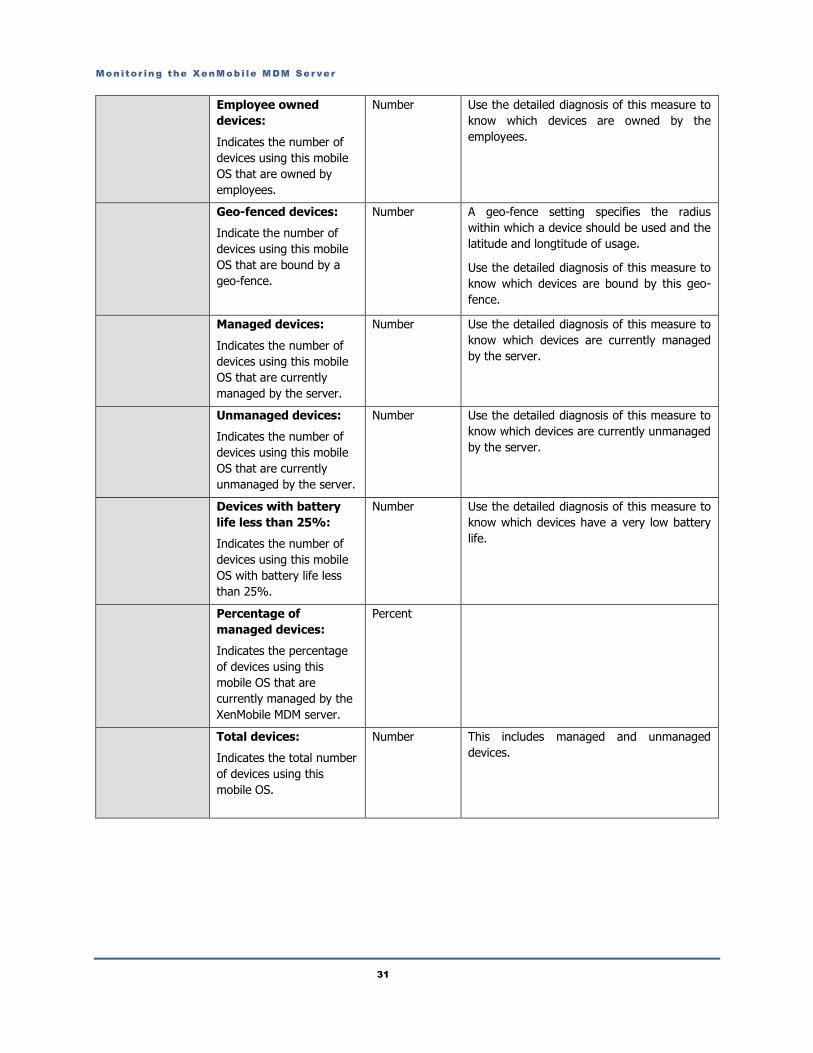
Employee owned
devices:
Indicates the number of
devices using this mobile
OS that are owned by
employees.
Number Use the detailed diagnosis of this measure to
know which devices are owned by the
employees.
Geo-fenced devices:
Indicate the number of
devices using this mobile
OS that are bound by a
geo-fence.
Number A geo-fence setting specifies the radius
within which a device should be used and the
latitude and longtitude of usage.
Use the detailed diagnosis of this measure to
know which devices are bound by this geo-
fence.
Managed devices:
Indicates the number of
devices using this mobile
OS that are currently
managed by the server.
Number Use the detailed diagnosis of this measure to
know which devices are currently managed
by the server.
Unmanaged devices:
Indicates the number of
devices using this mobile
OS that are currently
unmanaged by the server.
Number Use the detailed diagnosis of this measure to
know which devices are currently unmanaged
by the server.
Devices with battery
life less than 25%:
Indicates the number of
devices using this mobile
OS with battery life less
than 25%.
Number Use the detailed diagnosis of this measure to
know which devices have a very low battery
life.
Percentage of
managed devices:
Indicates the percentage
of devices using this
mobile OS that are
currently managed by the
XenMobile MDM server.
Percent
Total devices:
Indicates the total number
of devices using this
mobile OS.
Number This includes managed and unmanaged
devices.
Monitor ing the XenMob i le MDM Server
32
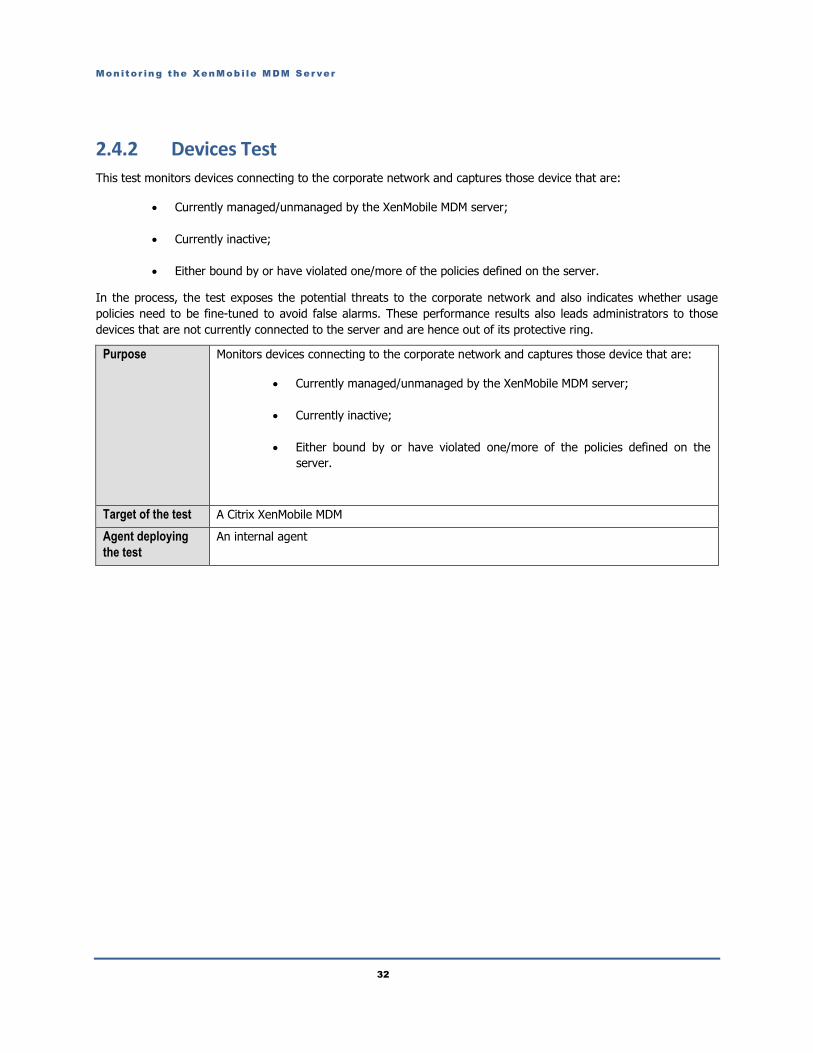
2.4.2 Devices Test
This test monitors devices connecting to the corporate network and captures those device that are:
Currently managed/unmanaged by the XenMobile MDM server;
Currently inactive;
Either bound by or have violated one/more of the policies defined on the server.
In the process, the test exposes the potential threats to the corporate network and also indicates whether usage
policies need to be fine-tuned to avoid false alarms. These performance results also leads administrators to those
devices that are not currently connected to the server and are hence out of its protective ring.
Purpose Monitors devices connecting to the corporate network and captures those device that are:
Currently managed/unmanaged by the XenMobile MDM server;
Currently inactive;
Either bound by or have violated one/more of the policies defined on the
server.
Target of the test A Citrix XenMobile MDM
Agent deploying
the test
An internal agent
Monitor ing the XenMob i le MDM Server
33
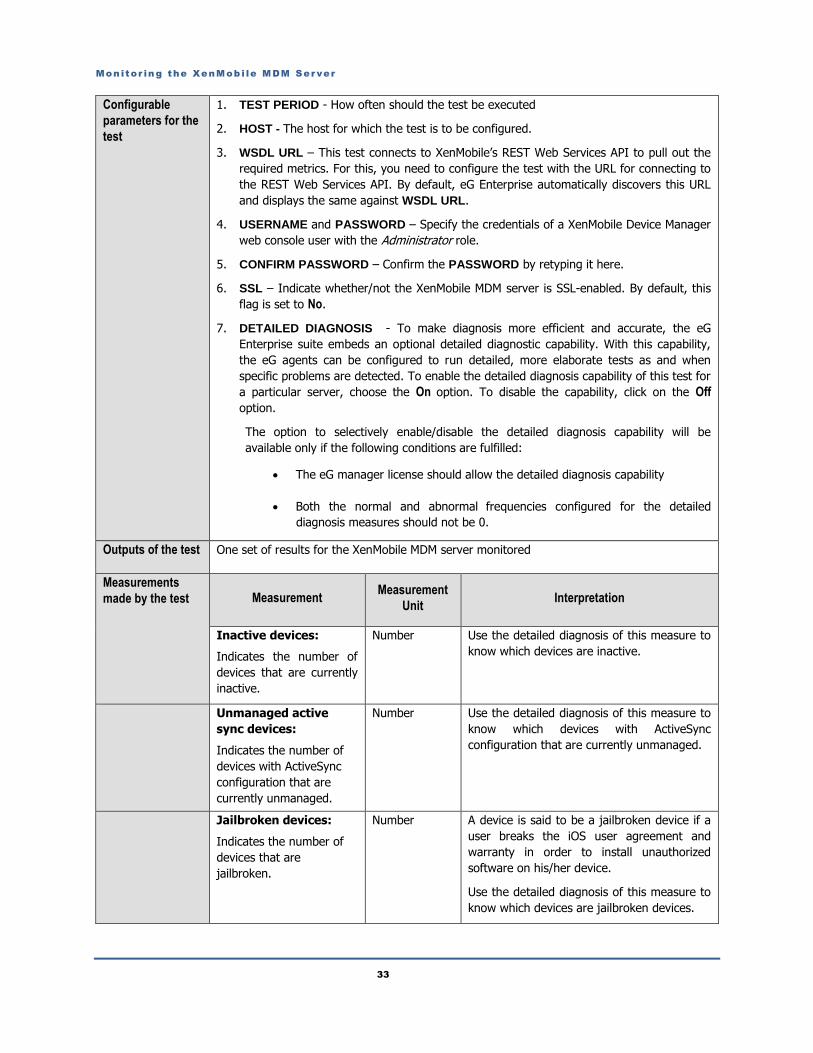
Configurable
parameters for the
test
1. TEST PERIOD - How often should the test be executed
2. HOST - The host for which the test is to be configured.
3. WSDL URL – This test connects to XenMobile’s REST Web Services API to pull out the
required metrics. For this, you need to configure the test with the URL for connecting to
the REST Web Services API. By default, eG Enterprise automatically discovers this URL
and displays the same against WSDL URL.
4. USERNAME and PASSWORD – Specify the credentials of a XenMobile Device Manager
web console user with the Administrator role.
5. CONFIRM PASSWORD – Confirm the PASSWORD by retyping it here.
6. SSL – Indicate whether/not the XenMobile MDM server is SSL-enabled. By default, this
flag is set to No.
7. DETAILED DIAGNOSIS - To make diagnosis more efficient and accurate, the eG
Enterprise suite embeds an optional detailed diagnostic capability. With this capability,
the eG agents can be configured to run detailed, more elaborate tests as and when
specific problems are detected. To enable the detailed diagnosis capability of this test for
a particular server, choose the On option. To disable the capability, click on the Off
option.
The option to selectively enable/disable the detailed diagnosis capability will be
available only if the following conditions are fulfilled:
The eG manager license should allow the detailed diagnosis capability
Both the normal and abnormal frequencies configured for the detailed
diagnosis measures should not be 0.
Outputs of the test One set of results for the XenMobile MDM server monitored
Measurements
made by the test Measurement Measurement
Unit Interpretation
Inactive devices:
Indicates the number of
devices that are currently
inactive.
Number Use the detailed diagnosis of this measure to
know which devices are inactive.
Unmanaged active
sync devices:
Indicates the number of
devices with ActiveSync
configuration that are
currently unmanaged.
Number Use the detailed diagnosis of this measure to
know which devices with ActiveSync
configuration that are currently unmanaged.
Jailbroken devices:
Indicates the number of
devices that are
jailbroken.
Number A device is said to be a jailbroken device if a
user breaks the iOS user agreement and
warranty in order to install unauthorized
software on his/her device.
Use the detailed diagnosis of this measure to
know which devices are jailbroken devices.
Monitor ing the XenMob i le MDM Server
34
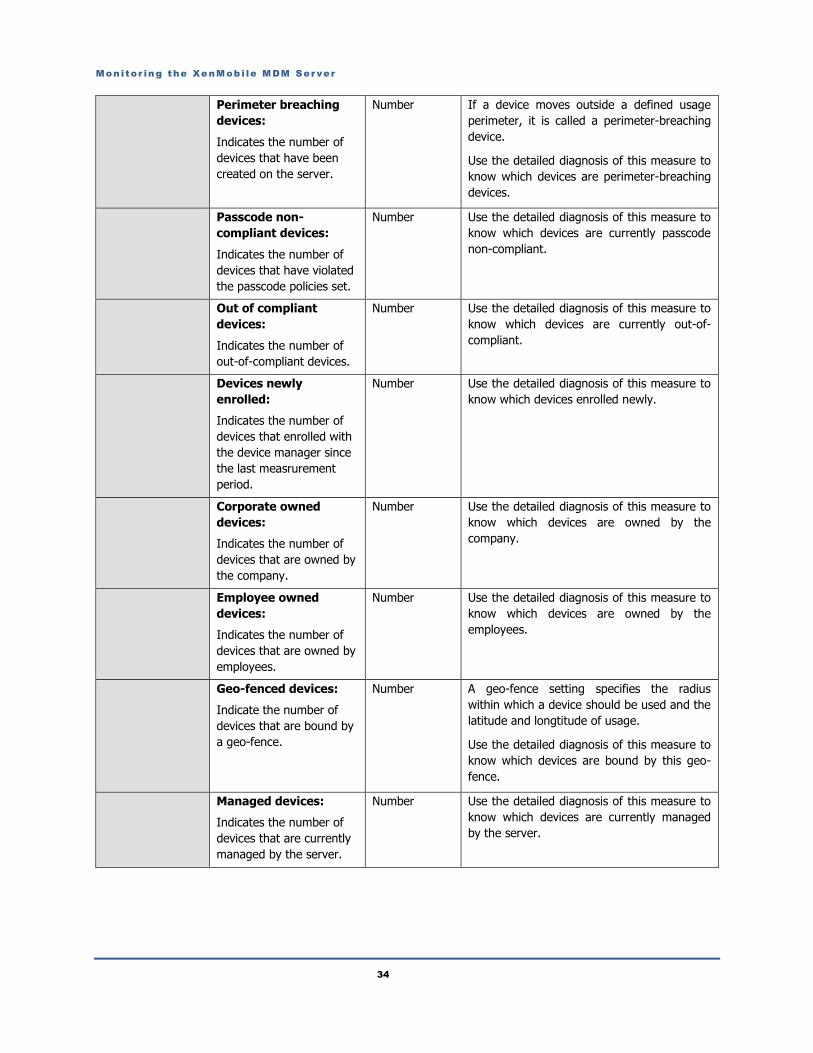
Perimeter breaching
devices:
Indicates the number of
devices that have been
created on the server.
Number If a device moves outside a defined usage
perimeter, it is called a perimeter-breaching
device.
Use the detailed diagnosis of this measure to
know which devices are perimeter-breaching
devices.
Passcode non-
compliant devices:
Indicates the number of
devices that have violated
the passcode policies set.
Number Use the detailed diagnosis of this measure to
know which devices are currently passcode
non-compliant.
Out of compliant
devices:
Indicates the number of
out-of-compliant devices.
Number Use the detailed diagnosis of this measure to
know which devices are currently out-of-
compliant.
Devices newly
enrolled:
Indicates the number of
devices that enrolled with
the device manager since
the last measrurement
period.
Number Use the detailed diagnosis of this measure to
know which devices enrolled newly.
Corporate owned
devices:
Indicates the number of
devices that are owned by
the company.
Number Use the detailed diagnosis of this measure to
know which devices are owned by the
company.
Employee owned
devices:
Indicates the number of
devices that are owned by
employees.
Number Use the detailed diagnosis of this measure to
know which devices are owned by the
employees.
Geo-fenced devices:
Indicate the number of
devices that are bound by
a geo-fence.
Number A geo-fence setting specifies the radius
within which a device should be used and the
latitude and longtitude of usage.
Use the detailed diagnosis of this measure to
know which devices are bound by this geo-
fence.
Managed devices:
Indicates the number of
devices that are currently
managed by the server.
Number Use the detailed diagnosis of this measure to
know which devices are currently managed
by the server.
Monitor ing the XenMob i le MDM Server
35
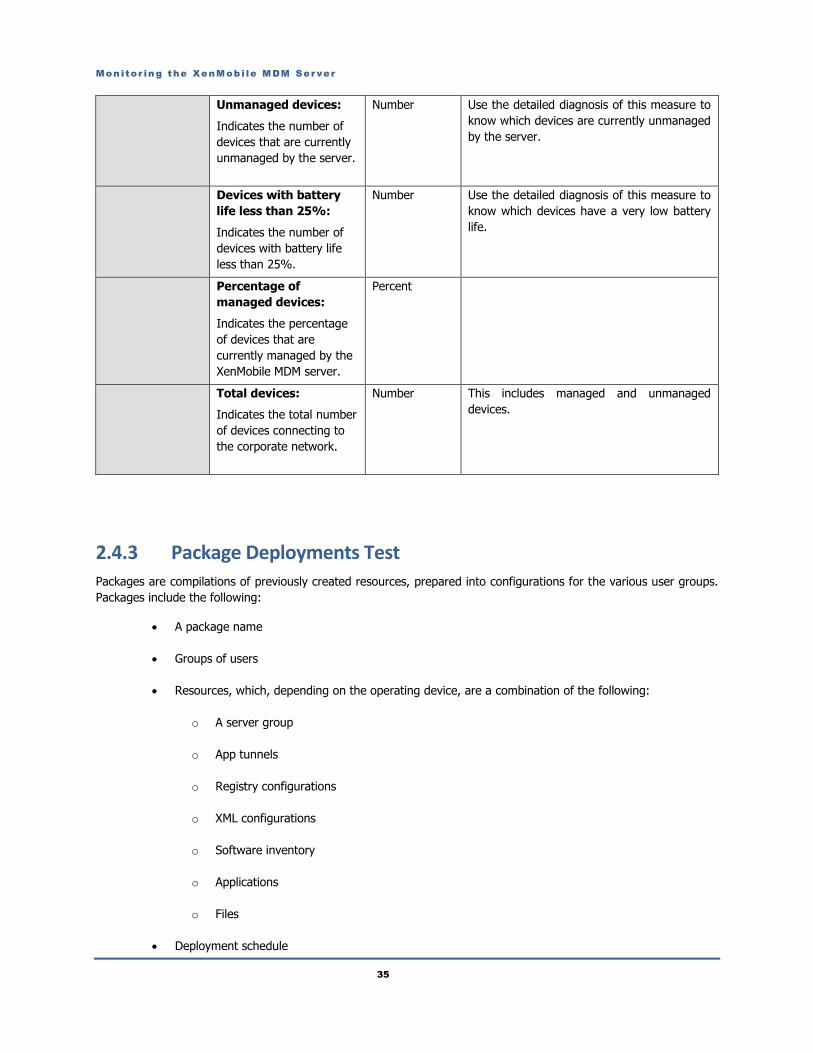
Unmanaged devices:
Indicates the number of
devices that are currently
unmanaged by the server.
Number Use the detailed diagnosis of this measure to
know which devices are currently unmanaged
by the server.
Devices with battery
life less than 25%:
Indicates the number of
devices with battery life
less than 25%.
Number Use the detailed diagnosis of this measure to
know which devices have a very low battery
life.
Percentage of
managed devices:
Indicates the percentage
of devices that are
currently managed by the
XenMobile MDM server.
Percent
Total devices:
Indicates the total number
of devices connecting to
the corporate network.
Number This includes managed and unmanaged
devices.
2.4.3 Package Deployments Test
Packages are compilations of previously created resources, prepared into configurations for the various user groups.
Packages include the following:
A package name
Groups of users
Resources, which, depending on the operating device, are a combination of the following:
o A server group
o App tunnels
o Registry configurations
o XML configurations
o Software inventory
o Applications
o Files
Deployment schedule
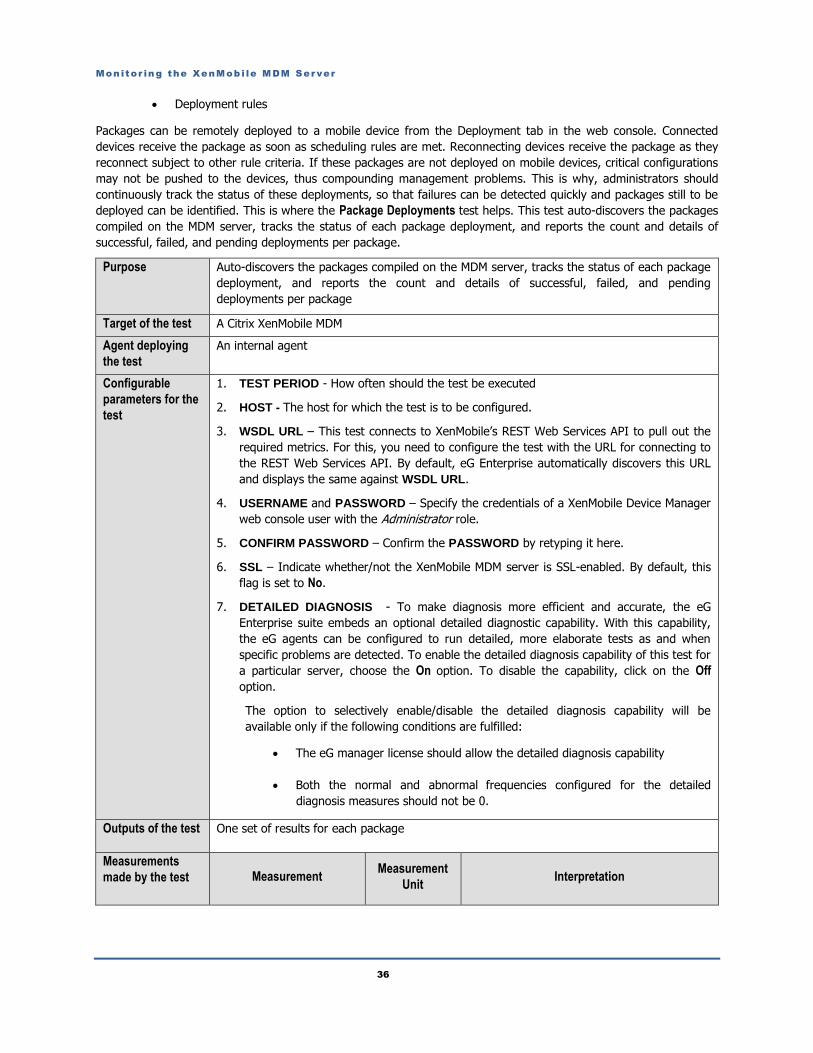
Monitor ing the XenMob i le MDM Server
36
Deployment rules
Packages can be remotely deployed to a mobile device from the Deployment tab in the web console. Connected
devices receive the package as soon as scheduling rules are met. Reconnecting devices receive the package as they
reconnect subject to other rule criteria. If these packages are not deployed on mobile devices, critical configurations
may not be pushed to the devices, thus compounding management problems. This is why, administrators should
continuously track the status of these deployments, so that failures can be detected quickly and packages still to be
deployed can be identified. This is where the Package Deployments test helps. This test auto-discovers the packages
compiled on the MDM server, tracks the status of each package deployment, and reports the count and details of
successful, failed, and pending deployments per package.
Purpose Auto-discovers the packages compiled on the MDM server, tracks the status of each package
deployment, and reports the count and details of successful, failed, and pending
deployments per package
Target of the test A Citrix XenMobile MDM
Agent deploying
the test
An internal agent
Configurable
parameters for the
test
1. TEST PERIOD - How often should the test be executed
2. HOST - The host for which the test is to be configured.
3. WSDL URL – This test connects to XenMobile’s REST Web Services API to pull out the
required metrics. For this, you need to configure the test with the URL for connecting to
the REST Web Services API. By default, eG Enterprise automatically discovers this URL
and displays the same against WSDL URL.
4. USERNAME and PASSWORD – Specify the credentials of a XenMobile Device Manager
web console user with the Administrator role.
5. CONFIRM PASSWORD – Confirm the PASSWORD by retyping it here.
6. SSL – Indicate whether/not the XenMobile MDM server is SSL-enabled. By default, this
flag is set to No.
7. DETAILED DIAGNOSIS - To make diagnosis more efficient and accurate, the eG
Enterprise suite embeds an optional detailed diagnostic capability. With this capability,
the eG agents can be configured to run detailed, more elaborate tests as and when
specific problems are detected. To enable the detailed diagnosis capability of this test for
a particular server, choose the On option. To disable the capability, click on the Off
option.
The option to selectively enable/disable the detailed diagnosis capability will be
available only if the following conditions are fulfilled:
The eG manager license should allow the detailed diagnosis capability
Both the normal and abnormal frequencies configured for the detailed
diagnosis measures should not be 0.
Outputs of the test One set of results for each package
Measurements
made by the test Measurement Measurement
Unit Interpretation
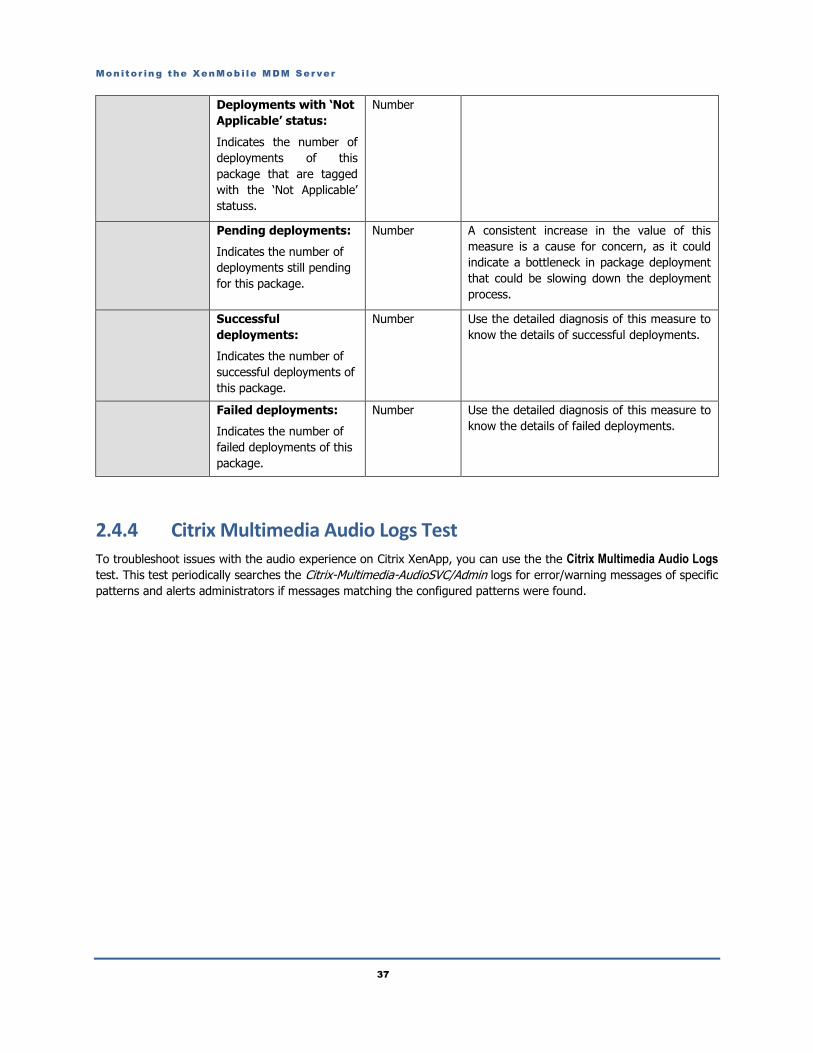
Monitor ing the XenMob i le MDM Server
37
Deployments with ‘Not
Applicable’ status:
Indicates the number of
deployments of this
package that are tagged
with the ‘Not Applicable’
statuss.
Number
Pending deployments:
Indicates the number of
deployments still pending
for this package.
Number A consistent increase in the value of this
measure is a cause for concern, as it could
indicate a bottleneck in package deployment
that could be slowing down the deployment
process.
Successful
deployments:
Indicates the number of
successful deployments of
this package.
Number Use the detailed diagnosis of this measure to
know the details of successful deployments.
Failed deployments:
Indicates the number of
failed deployments of this
package.
Number Use the detailed diagnosis of this measure to
know the details of failed deployments.
2.4.4 Citrix Multimedia Audio Logs Test To troubleshoot issues with the audio experience on Citrix XenApp, you can use the the Citrix Multimedia Audio Logs
test. This test periodically searches the Citrix-Multimedia-AudioSVC/Admin logs for error/warning messages of specific
patterns and alerts administrators if messages matching the configured patterns were found.
Conc lus ion
38
Conclusion
This document has described in detail the monitoring paradigm used and the measurement capabilities of the eG
Enterprise suite of products with respect to the XenMobile MDM server. For details of how to administer and use the
eG Enterprise suite of products, refer to the user manuals.
We will be adding new measurement capabilities into the future versions of the eG Enterprise suite. If you can
identify new capabilities that you would like us to incorporate in the eG Enterprise suite of products, please contact
[email protected]. We look forward to your support and cooperation. Any feedback regarding this manual
or any other aspects of the eG Enterprise suite can be forwarded to [email protected].