Monitoring Railway Infrastructure Tunnels & Tunnelling
23
Monitoring Railway Infrastructure Tunnels & Tunnelling G Price MPhil, MICE, MIMechE, MinE, CEng.
Transcript of Monitoring Railway Infrastructure Tunnels & Tunnelling

Monitoring Railway Infrastructure Tunnels & Tunnelling
G Price MPhil, MICE, MIMechE, MinE, CEng.

Construction Monitoring Control Systems Limited Willow Brook Barn, Llangeview, Usk, Monmouth, NP15 1EY
Tel - Garston: 01923 682 300, Usk: 01291 672 236, Mobile: 07802 247 334
Email: [email protected] Web page: www.cmcsltd.co.uk
2
Introduction CMCS was formed in 1993 to provide data to help Civil Engineers manage risk and assess performance on civil engineering projects. Our intelligent data acquisition systems are designed specifically for the Construction industry combining unique, efficient and cost effective alternatives to other conventional monitoring methods. CMCS Automatic Monitoring Systems (AMS’s) have sensors to detect change such as tilt, movement, strain or load, signal conditioning to convert the output from the sensors into digital format, data loggers to store the information, computers and software to process and display the data in a form that an engineer can assess the likely risk levels associated with the work in their charge. By and large the construction activities on railways involve; tunnels, embankments and bridges and third party structures within the interactive zone. If a structure within the interactive zone has historic significance, then gaining permission to carry out the work can rest on the confidence level placed on the monitoring system used to control the work.
CASE Study 1: Mansion House Understanding soil structure interaction is the key to assessing the likely effect of new construction work on existing structures, however, determining the engineering properties of the soil required to carry out theoretical predictions is often down to experience and guess work because of unquantifiable disturbances to the soil; during the construction of the infrastructure existing or new. As essential is to keep at the fore front on all decisions relating to a monitoring system is the prime objective for installing it. G Price, while employed as scientists at the Building Research Establishment designed and installed the monitoring systems for Mott MacDonald in 1989. Work could not start on the Platform and running tunnels for the Docklands Light Railway beneath the Mansion House (MH) the official residence of the Lord Mayor of the City of London, without consent from Parliament. The cover photograph shows the MH and below it a schematic of the monitoring system deployed. to manage the risk associated with the tunnelling Horizontal boreholes A, B and C were drilled from the stair shaft and a series of precise tilt sensors installed to monitor changes in vertical movements of the ground, immediately above the tunnels. Similarly, vertical holes were drilled alongside the north and east wall to a depth below the new tunnels and series of tilt sensors installed to monitor changes in horizontal movements of the ground. To monitor movements of the foundations tilt sensor beams were attached to the east and north walls in the basement with two additional runs parallel to the north wall through the central area of the building. A series of seven runs consisting of 8 discrete tilt sensors were attached to the east, north and west walls. Tie bars linking the front of the building to the rear were also fitted with load cells. Real time data from the system was relayed to Mott MacDonald office in Croydon via a modem. Summarising the system into desirable features of a AMS:
Monitor if possible the prime disturbance (soil movements due to tunnelling).
Monitor the controlling elements of the structure to be protected (movement of the foundations).
Monitor the elements of most concern the walls.
Have a secondary system as backup Optical surveying of the walls, roads and surrounding buildings.

Construction Monitoring Control Systems Limited Willow Brook Barn, Llangeview, Usk, Monmouth, NP15 1EY
Tel - Garston: 01923 682 300, Usk: 01291 672 236, Mobile: 07802 247 334
Email: [email protected] Web page: www.cmcsltd.co.uk
3
There were two objectives, the first to determine the magnitude of ground movements that the MH would be subjected were not damaging to the structure and the second to determine when movements had ceased so that planed renovation work could start. One of the significant findings from the monitoring was that the fixed sensors attached to the east wall in the basement showed the centre of the foundations rising while the precise levelling did not. This difference resulted in questions being raised about the data from the tilt sensors, i.e. tunnelling being carried out causing downward movement of the ground resulting in upward movement in the centre of the foundations. The matter was later resolved in favour of the fixed sensors data when it was realised that the cross passage formed earlier under the centre of the MH was rising causing the lift. CMCS have experienced several examples were monitored data from fixed sensors do not conform to the expected and it is important when analysing data to keep an open mind. A full report on all the instruments deployed and their findings are given in the Proceedings: Institute of Civil Engineers: Geotech’ Engng 1994, 107 Apr 77 – 87.
CASE STUDY 2: Monitoring movement during the formation of a Step Plate Junction
G Price first initiated the development of tilt sensors to monitor tunnel distortion in the early 1980s for use in the running tunnels for London Underground Limited (LUL) at the Angel, Islington. A running tunnel is the tunnel through which the trains run.

The systems were designed to monitor distortion of the lining during the construction of Step Plate Junctions (SPJ). Six metre diameter tunnels were driven to capture the 3 m running tunnels. The work was to be carried out without stopping the trains. The diagram opposite show the relationship between the two tunnels. Monitoring of the running tunnels was essential to ensure that any distortions did not infringe on the safe envelope (the amount of clearance) for the trains travelling through a tunnel. The photograph (below left) shows the curved convergence monitoring beams being fitted into the lining segments, which were designed not to protrude into the tunnel by more than 15 mm. To monitor the convergence, each of the five beams making up the system was fitted with an electro-level (EL) with a resolution of 1-arc second and linear movement transducers, resolution 0.01mm on monitor circumferential change on each beam. The system could detect movements from 0.1 to 100 mm change in tunnel profile.
The graphs on the right shows the change in width and height (maximum 5 mm) of one of the five points around the circumference of the running tunnel as the SPJ advanced towards and past the section being monitored. The larger tunnel reached the section monitored as the plot of its advance crosses the axis in the top plot. It can be seen from the plots that the running tunnel start to respond when the SPJ was about 5 m away and its affect on the running tunnel was a decrease in width by about 5 mm and an increase in height of about 3.5 mm.
CASE STUDY 3: The effect of new tunnelling work on LUL cast iron lined tunnels Because of the importance of the London Underground to the economic and social welfare of London it is extremely rare for the daily service to be discontinued while new construction work is carried out in close proximity to the running tunnels. Instead monitoring is installed in the running tunnels to check that predicted movements due to the new works are not exceeded and that the trains can pass safely through the effected zone. To monitor movements of the 3 m diameter running

Construction Monitoring Control Systems Limited Willow Brook Barn, Llangeview, Usk, Monmouth, NP15 1EY
Tel - Garston: 01923 682 300, Usk: 01291 672 236, Mobile: 07802 247 334
Email: [email protected] Web page: www.cmcsltd.co.uk
5
tunnels while forming a new 2 m diameter tunnel 4 m below them, CMCS installed ten 3 m electro-level beams in each tunnel (see the sketch above), the beams are represented as lines on the tunnel side walls. The movements monitored during the passage of the new tunnel under the existing tunnels are shown in the plots opposite. The top plot shows the stability of the system over the previous four
weeks up to 10:00 hrs and the bottom at 22:00 hrs on the 16th August 2000. The plot below shows the approach of the new tunnel to the centre lines of the existing running tunnels.
The plot opposite shows the movement monitored by the beams in the the east bound tunnel. The results showed that tunnel did not respond until the new tunnel was 5 m passed the centre line of the East Bound and that most of the movements occurred within 12 hours. By December 2000 the electro-
level beam system, only monitoring relative settlement could only observe the widening of the settlement trough. To determine absolute movement the results of the manual precise surveying to the ends of the electro-level beams would need to be added to the movements recorded by the electro-levels. Manual
-20.0
-15.0
-10.0
-5.0
0.0
5.0
10.0
15.0
19:12 00:00 04:48 09:36 14:24 19:12 00:00
Dis
tan
ce f
rom
cen
tre l
ine o
f ru
nn
ing
tu
nn
els
(m
)
August 2000
Progress of new tunnel towards running tunnels
East bound running tunnel
West bound running tunnel
Plot
16th 17th16th

Construction Monitoring Control Systems Limited Willow Brook Barn, Llangeview, Usk, Monmouth, NP15 1EY
Tel - Garston: 01923 682 300, Usk: 01291 672 236, Mobile: 07802 247 334
Email: [email protected] Web page: www.cmcsltd.co.uk
6
surveys were carried out at intervals of 1, 10 and 100 days, after which change in movements would be too small to be accurately detect further change without long periods in between, i.e. 1000 days. The prime objective of the automatic system is to warn of larger than expected movements in real time, while the manual surveys were to add to the understanding of the relationship between the initial elastic movements (over in hours) and the eventual long-term settlements that could take several years.
CASE STUDY 4: Contract 240 on the Channel Tunnel Rail Link (CTRL)
CMCS electro-level beams with other instruments were installed in the London Underground Limited (LUL) Central Line tunnels at Stratford to safeguard the normal operation of the Central Line trains during the construction of two 8 m diameter main line railway tunnels for the new Channel Tunnel Rail Link (CTRL) from Stratford into Central London. The new tunnels pass under the LUL tunnels within 100 m of leaving the launching box, see photograph (above) and diagram (below right). Due to the stiffness of the tunnels, concerns were expressed that the expected ground movements would crack the tunnel linings. Circumferential bolts were loosened at intervals along the axis of the tunnels, thereby converting them into a series of articulated sections, between 3 and 10 m long, within the zone of influence of the CTRL tunnels. Both the East and West bound LUL tunnels were fitted with arrays of electro-levels to monitor changes in deflection, rotation, twist and shear of the articulated sections. In addition linear movement transducers were fitted to monitor axial movements between the articulated sections.

Construction Monitoring Control Systems Limited Willow Brook Barn, Llangeview, Usk, Monmouth, NP15 1EY
Tel - Garston: 01923 682 300, Usk: 01291 672 236, Mobile: 07802 247 334
Email: [email protected] Web page: www.cmcsltd.co.uk
7
Data from the instruments were recorded by CMCS loggers and transferred via GSM modem to both the CTRL site control office and LUL offices. CMCS software displayed the large volume of data in a relatively easy to understand format on site computers as well as warn on-call engineers via mobile phones if set limits in the data were exceeded. The photograph on the left shows the engineers on duty during the critical period of passing under the LUL tunnels.
The tunnel monitoring systems were installed within a 5-week period along side other activities taking place in the LUL tunnels. Despite the relatively short space of time the system was operational in sufficient time to allow the first of the CTRL tunnels to pass under the LUL tunnels before the Christmas 2003 break, of significant commercial importance to the contractor. LUL engineers satisfied with the stability and resolution of the system and software gave the go ahead for the Tunnel Boring Machine (TBM) to pass under their tunnels.
During the critical stage of the first drive under the eastbound tunnel CMCS engineers were on site to respond instantly to any problems, there were no problems. The electro-level beams used to monitor the deflection of the tunnel showed the start of movements before the precise surveys carried out during engineering hours detected any movement. The surveys only confirmed the movements after 2 to 3 mm had occurred. The coloured diagram above is of the computer display. The white boxes in the yellow band give the deflection along half the tunnel being monitored. Comments made by one of the senior engineers looking at the results are given in the box below. The comments are included for two reasons;

Construction Monitoring Control Systems Limited Willow Brook Barn, Llangeview, Usk, Monmouth, NP15 1EY
Tel - Garston: 01923 682 300, Usk: 01291 672 236, Mobile: 07802 247 334
Email: [email protected] Web page: www.cmcsltd.co.uk
8
a) To show the CMCS system worked satisfactorily and b) Disturbances referred to were caused by third party workers operating in the tunnel and
occasionally inadvertently disturbing the instruments. The likelihood of disturbances depends on the extent of other work activities taking place and the size of the tunnels. The 3m diameter running tunnels can be very congested and it is essential to keep a diary of events that can be used to explain changes in the data not related to the construction process.
The plot below shows the deflected profile along the 150 m of tunnel being monitored. The two curves on the plot below are because the engineers needed changes in level along the track as versines (relative vertical movements on overlapping 5 m intervals). The steeper curve is from the electro-level beams direct, while the smoother fitted curve was used to calculate the versines. Other information on the coloured screen gave rotations at each of the separated section, circumferential rotations, and gap opening between each section.
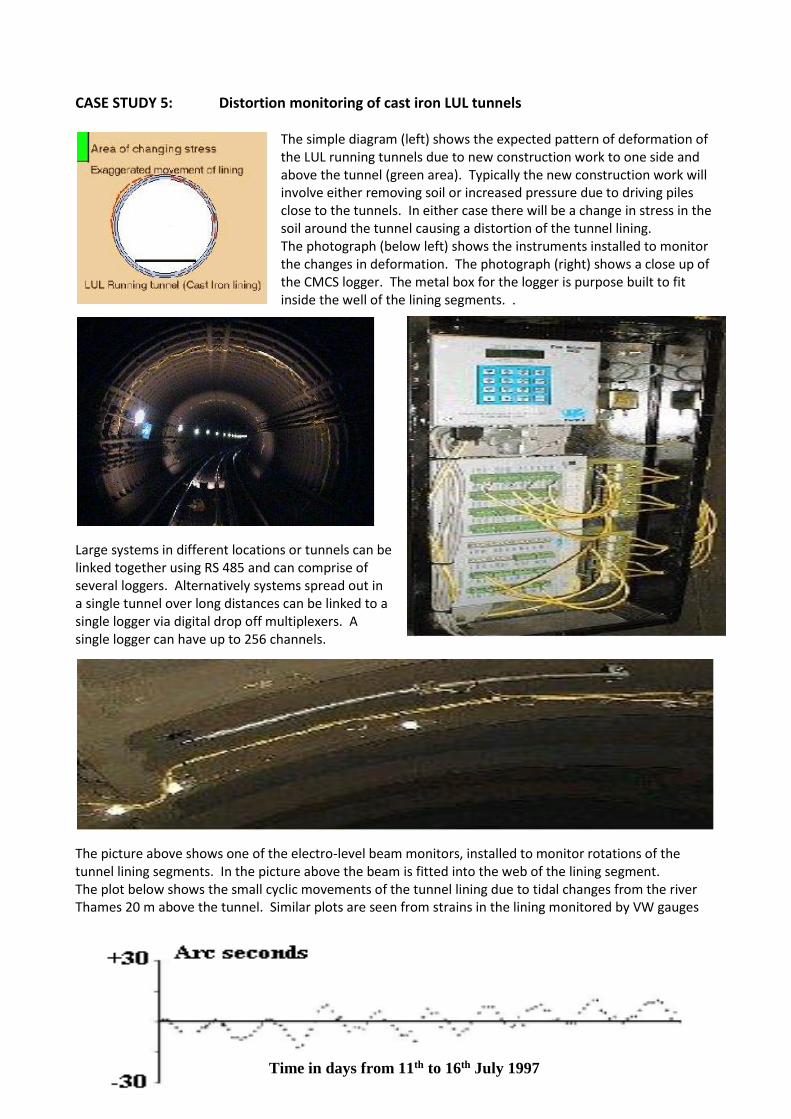
CASE STUDY 5: Distortion monitoring of cast iron LUL tunnels
The simple diagram (left) shows the expected pattern of deformation of the LUL running tunnels due to new construction work to one side and above the tunnel (green area). Typically the new construction work will involve either removing soil or increased pressure due to driving piles close to the tunnels. In either case there will be a change in stress in the soil around the tunnel causing a distortion of the tunnel lining. The photograph (below left) shows the instruments installed to monitor the changes in deformation. The photograph (right) shows a close up of the CMCS logger. The metal box for the logger is purpose built to fit inside the well of the lining segments. .
Large systems in different locations or tunnels can be linked together using RS 485 and can comprise of several loggers. Alternatively systems spread out in a single tunnel over long distances can be linked to a single logger via digital drop off multiplexers. A single logger can have up to 256 channels.
The picture above shows one of the electro-level beam monitors, installed to monitor rotations of the tunnel lining segments. In the picture above the beam is fitted into the web of the lining segment. The plot below shows the small cyclic movements of the tunnel lining due to tidal changes from the river Thames 20 m above the tunnel. Similar plots are seen from strains in the lining monitored by VW gauges
Time in days from 11th to 16th July 1997

Construction Monitoring Control Systems Limited Willow Brook Barn, Llangeview, Usk, Monmouth, NP15 1EY
Tel - Garston: 01923 682 300, Usk: 01291 672 236, Mobile: 07802 247 334
Email: [email protected] Web page: www.cmcsltd.co.uk
10
CASE STUDY 6: Distortion monitoring of brick and concrete lined Main Line Railway Tunnels
The photograph (above left) is of Bradway Tunnel near Sheffield. CMCS installed distortion monitoring beams around the circumference of the tunnel to warn of inward movements of the tunnel lining during grouting. The grouting was carried out extensively over lengths of the tunnels to prevent water ingress damaging the mortar between the bricks. The photograph (above right) shows the movement beams being used in 1998 to monitor changes in cant of the track during grouting operations to seal the Mersey Loop tunnels against water ingress. The beams were carried to their required location by the engineer in charge and simply placed either across the track to monitor change in cant or along the track to observe uplift. As grouting proceeded, relative movements of 2 mm on the beam caused the warning light to flash. Grouting was immediately stopped and as the pressure reduced, so the differential movements reduced to an acceptable level. The beams were connected to loggers and the data could be analysed at the end of the shift via CMCS software. The beams can also be used vertically to monitor horizontal movements. The control of many construction processes comes down to whether work activities are causing movement to existing infrastructure. Waiting until movement is detected by a computer and then relayed through the engineering staff to the workman to stop their activities can be too late to prevent damage. CMCS relative movement indicator as been developed so that an engineer can set limits by means of a key at which flashing lights warm locally of movements. For simplicity and cost CMCS can make the beams so that they only warn of movement and not store the data, but show movement via a series of LEDs. Multiple beam systems can also be linked to a battery powered data logger as at Bray Head Tunnel.

CASE STUDY 7: Monitoring of Bray Head Tunnel Summer 2005 The 1007m Bray Head tunnel began construction in 1913 and opened for trains in 1917 replacing an older tunnel between Greystone to Bray. Excavated through glacial till comprising of sands, silts and clay on the Greystone end and Greywacke beds (rock) at the Bray end, the single-track railway tunnel cuts through part of the headland between the two towns, some 20 miles south of Dublin. (The photograph shows a view of the headland from Greystone). The tunnel now services the ‘DART’ (Dublin Area Rapid Transport) an overhead-electrified commuter line, linking towns on the east coast of Ireland from Greystone to Howth. In recent years concerns have been expressed at the amount of water leaking into the Greystone end of the tunnel and its detrimental effect on the brickwork between the portal and a 30 m deep ventilation shaft about 420 m in bye.
CMCS were contracted by AMCO to provide two monitoring systems; the first to record water pressure behind the lining and the second to record any movement of the lining during grouting. Initially it had been envisaged that the water pressures would be monitored remotely from the top of the ventilation shaft, however, safe access to the shaft and work required on the shaft prevented this. CMCS installed with the assistance of AMCO, and Consultants COWI, the piezometers and recorded water pressures using two radio storage units from inside the tunnel.
The diagram above shows the general set-up, while the one opposite shows the location of the VW piezometers. Over 1500 holes had to be drilled through the lining, 10 for the piezometers at 15 degrees to the horizontal,1 m above rail level, then arrays of grouting holes at 2 m intervals (more than 1,000) between the portal and the shaft and finally the drainage holes. To install the piezometers, cased
holes were drilled through the lining and into the alluvial material to a depth of about 5 m or until it hit solid rock. Holes near to the ventilation shaft were shorter because the rock was closer to the lining. The piezometers were to be installed at the bottom of the holes surrounded by filter sand and sealed in the holes by bentonite pellets. To install the sand filter around the piezometer and seal it with bentonite in an almost horizontal hole a carrying ‘slipper’ was used.

Construction Monitoring Control Systems Limited Willow Brook Barn, Llangeview, Usk, Monmouth, NP15 1EY
Tel - Garston: 01923 682 300, Usk: 01291 672 236, Mobile: 07802 247 334
Email: [email protected] Web page: www.cmcsltd.co.uk
12
The VW piezometers were connected to two 6-channel battery powered radio storage units that could be read by a hand held radio transceiver. For remote monitoring after the contractor had left the site the system was connected to a GSM modem powered by a large solar panel.
The results on a scale of 5 m of water are shown in the graph above from installation in August 2005 to August 2006.

Tunnel lining movement system To ensure that grouting behind the brick lining did not collapse the tunnel CMCS installed a four movement monitoring system, each system comprising of four sets of four tilt beams (see photograph opposite)
connected to a battery powered logger and an alarm system. Data from the system could be downloaded and displayed on a computer; however, its main purpose was to warn grouting personnel of movements of the lining above set levels by means of warning lights. Each system covered 40 m of tunnel as shown in the diagram above and could be moved independently of each other, two protecting the current grouting area and two being set up in the next area to be grouted. It was necessary to carry out several grouting passes (days apart) to complete each area up to the crown. When dealing with multiple systems that can be moved to new areas it is essential to plan the work and keep records of the
location of each system with respect to time. Progress Sheet: The yellow coloured area shows where the grouting had been completed while the blue
area shows where systems were active. The purpose of the Progress Sheet was to inform site personnel of work or checks required on the monitoring system at any time.

Construction Monitoring Control Systems Limited Willow Brook Barn, Llangeview, Usk, Monmouth, NP15 1EY
Tel - Garston: 01923 682 300, Usk: 01291 672 236, Mobile: 07802 247 334
Email: [email protected] Web page: www.cmcsltd.co.uk
14
Stability of the monitoring beams: Changes in temperature shown in the top plot caused either the tunnel lining or beams to move. The response from the instruments to normal changes in temperature in the tunnel was considered to be insignificant in terms of the allowable movement of the tunnel lining during grouting, i.e. 2 mm.
Tunnel lining movements recorded during grouting: The following plots show movements recorded by the system during grouting. The grouting periods for each portion of the tunnel can be seen in the Schedule given earlier. During the 3rd of July 2005 (early Sunday morning) grouting was taking place behind the sidewalls of the tunnel between Locations 7 and 9.
Positive movement on all 4 beams is when the top of the beam, i.e. the end furthest from the rail moves into the tunnel. All beams have the same sense because when looked at from the centre of the tunnel the tilt sensor is on the right hand side of the beam.

Construction Monitoring Control Systems Limited Willow Brook Barn, Llangeview, Usk, Monmouth, NP15 1EY
Tel - Garston: 01923 682 300, Usk: 01291 672 236, Mobile: 07802 247 334
Email: [email protected] Web page: www.cmcsltd.co.uk
15
Several important features of the movements recorded can be seen in the plots or the 3rd of July at Location 8. Firstly, the response from the instruments on the right hand side of the tunnel is larger than those on the left and the tilt of the wall beam on the left is in the opposite sense to that on the right. Grouting records showed that the sidewalls were being grouted on the 3rd of July.
Monitoring between the 3rd and 5th showed that further movement occurred during the night of the 4th but stopped when the grouting stopped, see the plots below. Temperature over the period is given in the top plot and is ruled out as a major factor in the periods of increased movement. The bottom plot below is of the array at Location 9 on the night of the 6/8/05 again temperature is ruled out as a significant factor during the period of increased movement which occurred at 02:00 hours, i.e. when grouting was being carried out in the tunnel at that location. Both shoulder beams moved positive, i.e. as if the arch was flattening, while the wall beams move slightly negative, i.e. the toe of the beam moving into the tunnel or the top of the wall moving out as it tries to resist the arch flattening.
Movement of the shoulder beam C reached a Level 2 alarm and the grouting was stopped. It is interesting to note that these early small movements have an elastic component, i.e. when grouting stops there is an immediate small recovery. From the pattern of movement it was deduced that they could only have occurred if

Construction Monitoring Control Systems Limited Willow Brook Barn, Llangeview, Usk, Monmouth, NP15 1EY
Tel - Garston: 01923 682 300, Usk: 01291 672 236, Mobile: 07802 247 334
Email: [email protected] Web page: www.cmcsltd.co.uk
16
the crown at Location 9 was being grouted at that time. Examination of the grouting records showed that the crown was being grouted during the period in question. The difference between the movements caused during the side and crown grouting can be clearly seen in the extended plot from the 3rd to 7th of July 2005. The undulations in the upward trend of movements recorded are possibly due to temperature changes. Similar undulations can be seen in the diurnal changes between day and night in the top plot, however, the tunnel would also be experiencing changes in temperature from the grout pumped in at night subsequently hydrated and increased the temperature behind the lining. Gross grouting pressure during this period was of the order of 4 bar. Pressure behind the lining would be less than the gross due to loss in the delivery hoses; estimating a pressure of 2 bar (202 kPa) would exert a load of about 3,000 kN/m on the tunnel with an external profile of about 15 m. The plot below covers the period from the 3rd to the 7th of July and clearly shows the two instances of increased movement and the different direction of movement due to the pressure being applied from the side and subsequently the crown. The plots also show that movements continued for several days after grouting had stopped.

CASE STUDY 8: Tunnels under large bodies of water Severn Tunnel
G Price & IF Wardle designed and installed a monitoring system in the 150 year old Severn Railway Tunnel is used as an example of the sensitivity and stability needed to give the engineers responsible for managing risk confidence in the monitoring system. The safety of trains passing through the tunnel while the Second Severn Crossing was constructed was a major concern.
The centre foundation for the new Second Crossing suspension bridge straddled the tunnel close to mid-channel of the Severn Estuary; the closest piles were only 5m away from the tunnel lining. As illustrated in the diagram, electro-levels, reading to one arc second resolution, were fitted in the brick lining of the Severn
Railway Tunnel to monitor any distortion of the brick lining during installation and loading of the piled foundations. The two graphs are from one of the electro-levels, the top graph, on a scale of +/- 5 arc seconds shows two cycles of movement a day corresponding to the tidal
movements in the sea 30 m above the tunnel. Over the seasons the size of the cycles changed with the level of tide. The bottom graph (on a scale of +/-300 arc seconds) shows a two yearly cycle of movements in the lining of about 100 arc seconds. During critical stages of construction daily trends in the data were closely monitored to ensure there was no adverse effect on the lining as a result of the piling. On a 5 arc second scale any significant distortion of

Construction Monitoring Control Systems Limited Willow Brook Barn, Llangeview, Usk, Monmouth, NP15 1EY
Tel - Garston: 01923 682 300, Usk: 01291 672 236, Mobile: 07802 247 334
Email: [email protected] Web page: www.cmcsltd.co.uk
18
the tunnel lining due to the pile construction would have been detected immediately by the electro-levels. On completion of the project, 44,000 hours later, the outside Parties Engineer Mr Mike Welsh wrote the following to BRE: ‘I should like to take this opportunity to thank you for your co-operation throughout the construction of the Crossing, in developing and maintaining efficient and successful monitoring systems. These have given British Rail and Railtrack the confidence in knowing that any minor changes in behavioural patterns of the tunnel fabric could be detected and appropriate action taken.’ At a presentation of the work in the Institute of Civil Engineers the main contractor was unaware that major monitoring of the tunnel had taken place, despite the fact that there were five portable computer given to on call British Rail engineers and the system fed direct into the Control Room at Sudbrook.
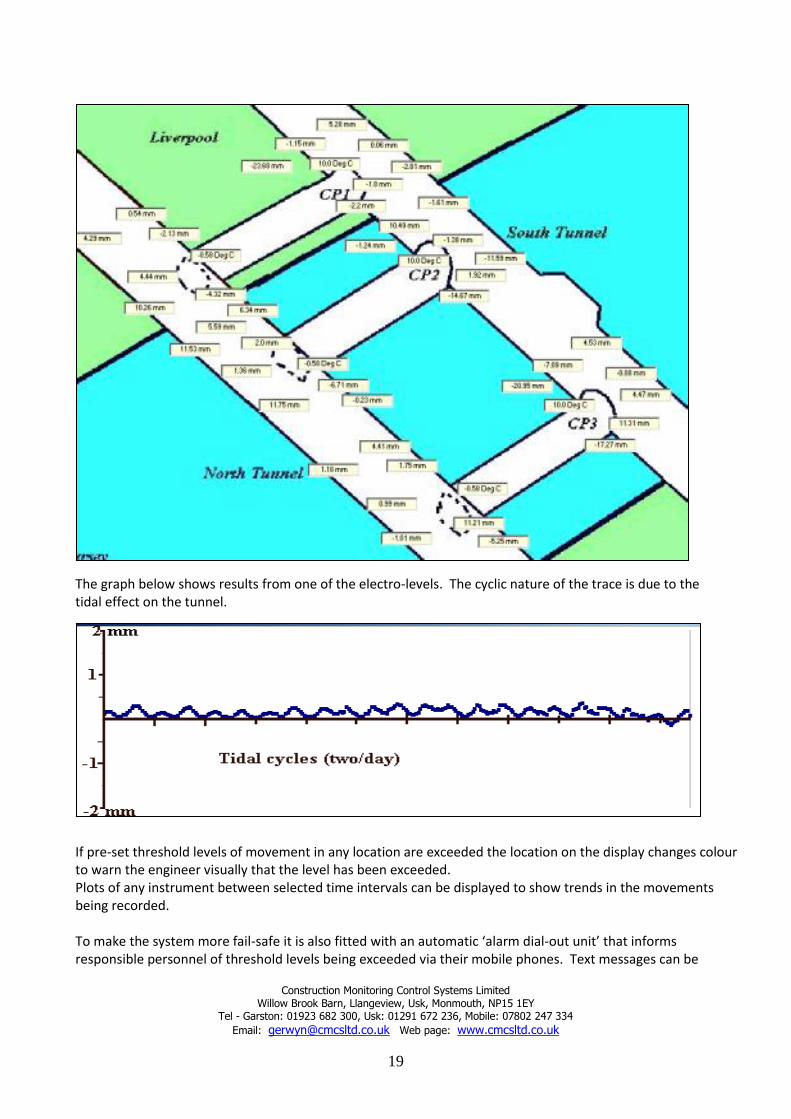
The Kingsway Tunnel Recent concerns about fire risks in tunnels and adequacy of escape routes has caused Liverpool authorities
to link the two bores of the Kingsway tunnel by three cross passages. The safety of road traffic passing under the Mersey River while the work was carried out was to be ensured. Electro-level beam monitors were installed in both of the nine metre diameter main tunnels to observe any distortion as accesses were cut out for the cross passages. The electro-levels (read at one arc second resolution) were fitted to the main tunnel lining on 2m beams at the entrance and exit locations for the cross passages, as shown on the NCE photograph (right). The small cyclic distortions of the main tunnels due to tidal changes in the Mersey 30 m above were clearly monitored by the electro-levels.
Observing these small movements gave the on-site engineers confidence that the monitoring system was operational and would detect any additional distortion of the main road tunnels during the mining operation. The computer display (below) gives the site engineer an over view of all the instruments.
Construction Monitoring Control Systems Limited Willow Brook Barn, Llangeview, Usk, Monmouth, NP15 1EY
Tel - Garston: 01923 682 300, Usk: 01291 672 236, Mobile: 07802 247 334
Email: [email protected] Web page: www.cmcsltd.co.uk
19
The graph below shows results from one of the electro-levels. The cyclic nature of the trace is due to the tidal effect on the tunnel.
If pre-set threshold levels of movement in any location are exceeded the location on the display changes colour to warn the engineer visually that the level has been exceeded. Plots of any instrument between selected time intervals can be displayed to show trends in the movements being recorded. To make the system more fail-safe it is also fitted with an automatic ‘alarm dial-out unit’ that informs responsible personnel of threshold levels being exceeded via their mobile phones. Text messages can be

Construction Monitoring Control Systems Limited Willow Brook Barn, Llangeview, Usk, Monmouth, NP15 1EY
Tel - Garston: 01923 682 300, Usk: 01291 672 236, Mobile: 07802 247 334
Email: [email protected] Web page: www.cmcsltd.co.uk
20
sent within seconds of levels being exceeded. Data from the system can also be posted on a Web site if required for more general dissemination of the data. CASE STUDY 9: BBC Broadcasting House & the Victoria Line Phase 2 of broadcasting house required a 30m deep excavation that bought the bottom of this close to the Victoria line which ran below site. Both the diaphragm wall around the excavation and the Victoria Line
needed monitoring. A main road runs along Portland place with a pedestrian path right on the edge of the site. Duchess Street and Hallam Street also has a pedestrian road and a small road but offices are also situated next to them. A monitoring system was to be designed so that it would monitor the Diaphragm wall on Duchess and Hallam Street to stop damage to adjacent buildings as well as the movements to along Portland Place to
stop damage to the road.
To achieve this eight 30m deep inclinometer tubes were installed around the site along Duchess Street and Hallam Street. Sensors on beams were placed on the wall running along Portland place and Duchess Street on upper wall and base level (see diagram above). Data was recorded every hour and stored on the onsite computer. CMCS’ server would also dial in to download the data and upload it onto the website for engineers not on site to view the data. Data from the sensors in the inclinometer tubes gave a similar profile to the one shown in the diagram above.

Construction Monitoring Control Systems Limited Willow Brook Barn, Llangeview, Usk, Monmouth, NP15 1EY
Tel - Garston: 01923 682 300, Usk: 01291 672 236, Mobile: 07802 247 334
Email: [email protected] Web page: www.cmcsltd.co.uk
21
An XYZ system was developed by CMCS to monitor horizontal and vertical movement as well as distortion around the tunnel. A string of 31 sensors were placed along the length of tunnel running through the zone of influence. Distortion was measured with tilt sensors placed around the tunnel lining and strain gauges were used to measure between the lining segments.
Data from the sensors were recoded on a logger, downloaded by the CMCS server via a modem and displayed on the webpage. A horizontal profile plot was plotted from all the data gathered and shown in the graph below. As expected the tunnel moved towards the site excavation as ground reacted to the removal of earth in the site. The cross passage that connects the two tunnels can be clearly seen in the graph where it is essential held back. Movements recorded were within the predicted envelopes of expected movement.

Construction Monitoring Control Systems Limited Willow Brook Barn, Llangeview, Usk, Monmouth, NP15 1EY
Tel - Garston: 01923 682 300, Usk: 01291 672 236, Mobile: 07802 247 334
Email: [email protected] Web page: www.cmcsltd.co.uk
22
Victoria line horizontal movement profile
-5.0
0.0
5.0
10.0
15.0
20.0
0 15 30 45 60 75
Distance along tunnel (m)
Mov
emen
t (m
m)
07/03/2007 07/05/2007
08/07/2007 07/09/2007
07/11/2007 12/01/2008
12/03/2008 07/05/2008
07/07/2008 07/09/2008
07/11/2008 13/01/2009
Effect of
horizontal cross
passage
Construction Monitoring Control Systems Limited Willow Brook Barn, Llangeview, Usk, Monmouth, NP15 1EY
Tel - Garston: 01923 682 300, Usk: 01291 672 236, Mobile: 07802 247 334
Email: [email protected] Web page: www.cmcsltd.co.uk
23