Monitoring of concrete mixing evolution using image analysis
20
HAL Id: hal-01522593 https://hal.archives-ouvertes.fr/hal-01522593 Submitted on 15 May 2017 HAL is a multi-disciplinary open access archive for the deposit and dissemination of sci- entific research documents, whether they are pub- lished or not. The documents may come from teaching and research institutions in France or abroad, or from public or private research centers. L’archive ouverte pluridisciplinaire HAL, est destinée au dépôt et à la diffusion de documents scientifiques de niveau recherche, publiés ou non, émanant des établissements d’enseignement et de recherche français ou étrangers, des laboratoires publics ou privés. Monitoring of concrete mixing evolution using image analysis Jaime Moreno Juez, Riccardo Artoni, Bogdan Cazacliu To cite this version: Jaime Moreno Juez, Riccardo Artoni, Bogdan Cazacliu. Monitoring of concrete mixing evolution using image analysis. Powder Technology, Elsevier, 2017, 305, pp.477-487. 10.1016/j.powtec.2016.10.008. hal-01522593
Transcript of Monitoring of concrete mixing evolution using image analysis
HAL Id: hal-01522593https://hal.archives-ouvertes.fr/hal-01522593
Submitted on 15 May 2017
HAL is a multi-disciplinary open accessarchive for the deposit and dissemination of sci-entific research documents, whether they are pub-lished or not. The documents may come fromteaching and research institutions in France orabroad, or from public or private research centers.
L’archive ouverte pluridisciplinaire HAL, estdestinée au dépôt et à la diffusion de documentsscientifiques de niveau recherche, publiés ou non,émanant des établissements d’enseignement et derecherche français ou étrangers, des laboratoirespublics ou privés.
Monitoring of concrete mixing evolution using imageanalysis
Jaime Moreno Juez, Riccardo Artoni, Bogdan Cazacliu
To cite this version:Jaime Moreno Juez, Riccardo Artoni, Bogdan Cazacliu. Monitoring of concrete mixing evolution usingimage analysis. Powder Technology, Elsevier, 2017, 305, pp.477-487. �10.1016/j.powtec.2016.10.008�.�hal-01522593�
Monitoring of concrete mixing evolution using image analysis
Jaime MORENO JUEZ*, Riccardo ARTONI, Bogdan CAZACLIUIFSTTAR, Aggregates and Material Processing Laboratory, Route de Bouaye – CS4, 44344Bouguenais Cedex, Nantes, France
*Corresponding author. E-mail address: [email protected] (J. Moreno Juez).
Abstract:
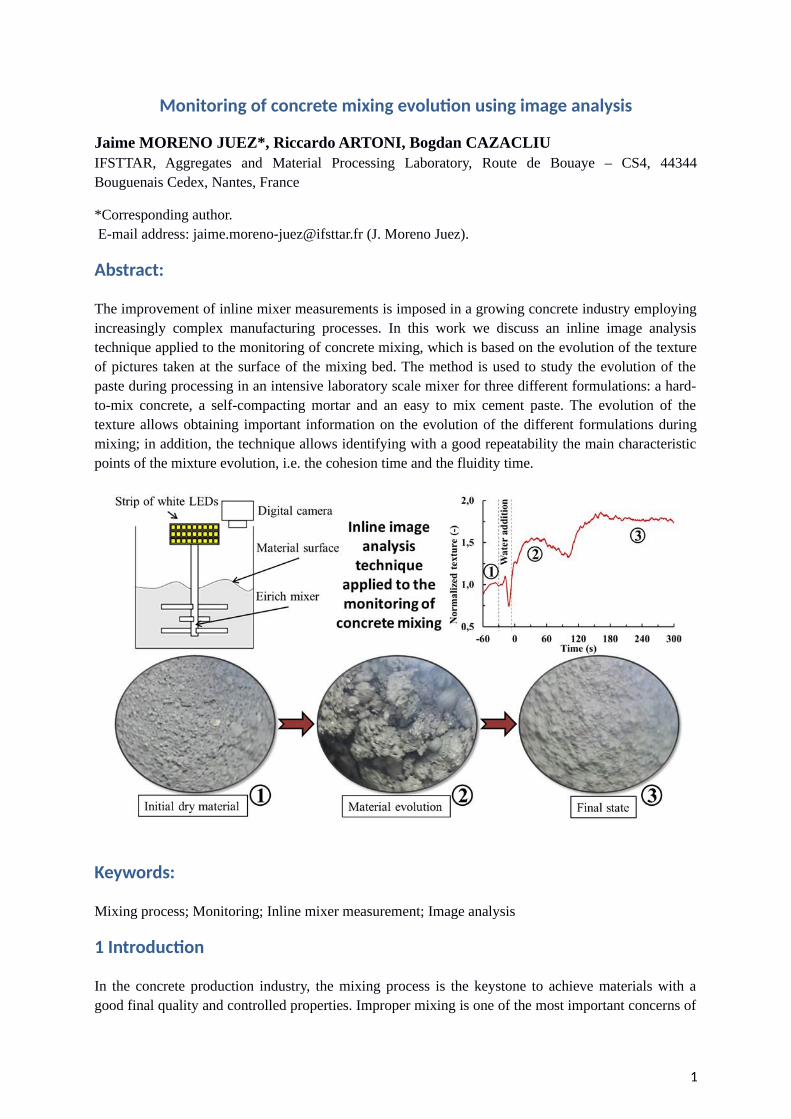
The improvement of inline mixer measurements is imposed in a growing concrete industry employingincreasingly complex manufacturing processes. In this work we discuss an inline image analysistechnique applied to the monitoring of concrete mixing, which is based on the evolution of the textureof pictures taken at the surface of the mixing bed. The method is used to study the evolution of thepaste during processing in an intensive laboratory scale mixer for three different formulations: a hard-to-mix concrete, a self-compacting mortar and an easy to mix cement paste. The evolution of thetexture allows obtaining important information on the evolution of the different formulations duringmixing; in addition, the technique allows identifying with a good repeatability the main characteristicpoints of the mixture evolution, i.e. the cohesion time and the fluidity time.
Keywords:
Mixing process; Monitoring; Inline mixer measurement; Image analysis
1 Introduction
In the concrete production industry, the mixing process is the keystone to achieve materials with agood final quality and controlled properties. Improper mixing is one of the most important concerns of
1

concrete manufacturers. This problem has increased in recent decades due to the expansion of newmaterials requiring higher mixing times, i.e. high-performance concrete (HPC) and self-compactingconcrete (SCC) [1–6]. The increase in productivity for this type of concrete has become a high priorityrequirement. To ensure both quality and productivity, concrete manufacturers are forced to respect themixing times trying to reduce them to the maximum. In the same way, in other industries related withcementitious materials several authors are working in this problem [7–11]. A good control andmonitoring of the mixing process is then imposed.
Fig. 1 Different concrete mixing stages and transition points using the mixing power measurement(reproduced from [12]).
The practice of performing measurements on the mixer is consolidated since a long time. Followingprecursor studies [13–15], the most important monitoring technique developed during the last decadeis the mixer power consumption evolution with mixing time (power curve). Two attempts to adapt theanalysis of the power curve to concrete receipts using high amount of admixture were proposed byChopin et al. [16] and by Cazacliu and Legrand [17]. Based on this technique, Cazacliu and Roquet[18,19] went further and proposed an explanation of the mechanism of mixture evolution duringconcrete mixing. They defined six mixing stages by a simple approach (Figure 1), using the mixingpower measurement and its fluctuation and they determined also two transition points, the “maximumcohesion point” and “the fluidity point”. These two points are reliable indicators of the mixingevolution. The maximum cohesion time corresponds to the transition from the wet granular state to astate where granules not yet dissolved are already connected by liquid bridges (hard paste). Thefluidity time is the instant of transition from a hard paste to a granular suspension state in all the mixedvolume. When the fluidity time is reached the mixture has already a fresh concrete appearance (softpaste). This fluidity point is related to a fast attenuation of the power signal fluctuation and for some“easy-to-mix” mixtures, the fluidity point also corresponds to an angular point on the power curve.These concepts were confirmed, directly or indirectly by several independent studies [20–24].
Other authors have used different methods to control and monitor the mixing process using the studyof different parameters during the mixing. Danilevskii et al. [25] monitored the homogeneity and
2
workability evolution of concrete by means of vibroacoustic measurements. In order to estimate themixing efficiency, an alternative technique was employed by Jezequel and Collin [26,27] based on theanalysis of the dispersion kinetics of colored, cohesive, tracer particles that progressivelydeagglomerated during stirring. Li et al. [28] presented a method for estimating the SCC workabilityusing visual information during the mixing process based on the appearance of the concrete mixture atthe end of the mixing.
Although many different studies have been performed in concrete production, we do not have yet adefinitely reliable tool for monitoring and control the concrete mixing evolution. The problembecomes more important when we deal with “hard-to-mix” mixtures. In this kind of mixtures theestimation of the fluidity point may still be difficult and more research is needed to bring a completeanswer for the in line detection by curve analyses.
To solve this problem we have been inspired by observation techniques used in other industries (suchas chemical or pharmaceutical), and in particular by the wet granulation process which bears manysimilarities with the concrete mixing process. Daniher and Briens [29,30] used sound and vibrationsignal analysis as monitoring methods for the end-point detection in high-shear wet granulation. Imageanalysis techniques were employed by the authors [31–33] to study granulation and wet agglomerationprocesses with promising results for the control of wet granulation processes. Images of the powdersurface were captured during the granulation process and analyzed with different techniquesdepending on the authors. Nalesso et al. [31] used the standard deviation of the gray-scale histogramto monitor the size evolution of the wet aggregates. Watano [32,33] used an image processing and afuzzy logic based on linguistic algorithms employing IF-THEN rules, in which the process lag elementwas taken into consideration. The authors [34–36] also proposed an image analysis technique allowingto describe the mixing efficiency at the surface of the mixing volume of a multi-component mixture.
The aim of the present study has been to develop a system for direct monitoring and control of thecementitious materials mixing. An inline monitoring of the surface texture of the mixture wasdeveloped based on an image analysis technique. The ability of the technique to detect the mixtureevolution during mixing was investigated by comparison with the mixing power consumptionevolution and by direct observation of the mixture. The scope of this work is to demonstrate theperformance and reliability of this technique at laboratory scale.
2 Experimental method
2.1. Materials and equipment
2.1.1. Product formulation
Tests were carried out on three kinds of mixture, cement paste, mortar and concrete, in order to cover alarge domain of cementitious materials mixtures. The compositions of the three mixtures are outlinedin Table 1. In order to facilitate the comparison between the tests, the cement paste, the mortar and theconcrete were produced with the same components: cement CEMI 52.5 from Lafarge Ciments (StPierre La Cour, France), Chryso superplasticizer (ChrysoFluid® Optima 352 EMx), calcium carbonatefiller (Betocarb), natural 0/4 silico-calcareous sand (for the mortar and concrete) and rolled natural4/10 siliceous aggregate (for the concrete). A high proportion of liquid polycarboxylatesuperplasticizer, called thereinafter HRWR (High Range Water Reducer) was used in order to obtainmixtures with low water to powder ratio (W/P), making the mixtures more difficult to mix, asdemonstrated by Chopin et al. [1]. This allow a more precise observation of mixing stages, which
3

duration is significantly higher than the mixing time needed for homogenization of the composition[37]. It was also chosen to fix the composition of the cement paste in the free mixtures and those of themortar in the mortar and the concrete. As a consequence, the fluidity of the final mixture is decreasingfrom cement paste to mortar then concrete. An appropriate water to powder ratio was chosen in orderto keep the fluidity of the three mixtures in a convenient range and to avoid segregation.
Table 1. Composition of the mixtures
To determine the consistency of the concrete we used the slump test method according to the standardNF-EN 12350-2 [38]. The test consists of filling a truncated cone metallic mold with the mixture. Atfirst the material is added in three layers tamped with 25 strokes of a standard steel rod, then the moldis removed, and finally the settlement experienced by the mixture is measured. This techniquecharacterizes the fluidity of the mixtures; based on the slump test results we can conclude that thethree formulations correspond to a sloppy consistency cement paste, a wet consistency mortar and adry consistency concrete.
2.1.2. Mixer
The tests were conducted in an intensive laboratory pan mixer (Figure 2), a 5 liters Erich mixer.
Fig. 2 Eirich laboratory mixer
4

In this study, all tests were carried out with a vessel velocity of 45 RPM and the impeller turned at 200RPM. The mixer was set in counter current configuration, i.e. the vessel and agitator rotate in opposite direction. The batch volume was kept constant and equal to 4 liters in all the tests, which represents a filling amount of about 80%.The mixing power was measured by a mixing power sensor with a frequency of 10 Hz. For therepresentations employed in this study two consecutives rolling mean filters are applied on 10 values(1 second) each one. The mixing power fluctuation is calculated with the STD of 10 successivemeasurements corresponding to 1 second and then applying to it a rolling mean filter of 20 values (2seconds).
2.1.3. Image acquisition
The image signal was obtained using a digital GoPro camera. This camera offers the advantage ofbeing a high performance and powerful compact camera while being low-cost, compact, lightweightand robust. The camera was placed on the top of the vessel to take pictures of the sample surface(Figure 3). It was set at 1920x1080 screen resolution and 120 frames per second to have a goodbalance between resolution and frequency acquisition. An external support ensured that the camerawas always located in the same position relative to the mixer.
Tests were performed with controlled lightning conditions. The light source was constituted by acontinuous strip of white LEDs (4000K, 680lumen/m and 6.7W/m) fitted to the internal fixed axis ofthe impeller (Figure 3).
Fig. 3 Experimental set-up
2.2 Experimental program
Batches were carried out on the given mixtures (Table 1) at a temperature between 15 and 20 ºC. Thesolid materials were loaded before starting the mixer. Measurements started at the same time as themixer and were recorded without interruption for the entire mixing process. After mixing the solidconstituents for 60 seconds to ensure dispersion and homogenization of materials, a solution of waterand HRWR (previously mixed) were constantly added during 20 seconds and the full mixture was
5
mixed for 300 seconds more after the end of water addition. We consider that this mixing time is largeenough to guarantee the correct uniformity and quality of all chosen cementitious mixtures.
2.3 Image analysis
The image analysis technique used in this paper is an adaptation of that developed by Nalesso et al.(2015) for wet granulation. It computes statistics and measurements based on the gray-level intensitiesof the image pixels. The main advantages of looking at material surface are that the technique is notinvasive and the particles are not analyzed individually but in bulk. Since the camera has an HDresolution and the acquisition rate is up to 120fps we are able to analyze a moving bed of particleswith a high image quality thus providing reliability and precision.
To proceed, all the pictures were extracted from the video and analyzed individually. Images werereduced to a window containing most of the paste bed but avoiding the walls of the vessel and otherparts of the mixer which could interfere with the analysis. Once the images extracted and the correctarea selected a histogram analysis was performed.
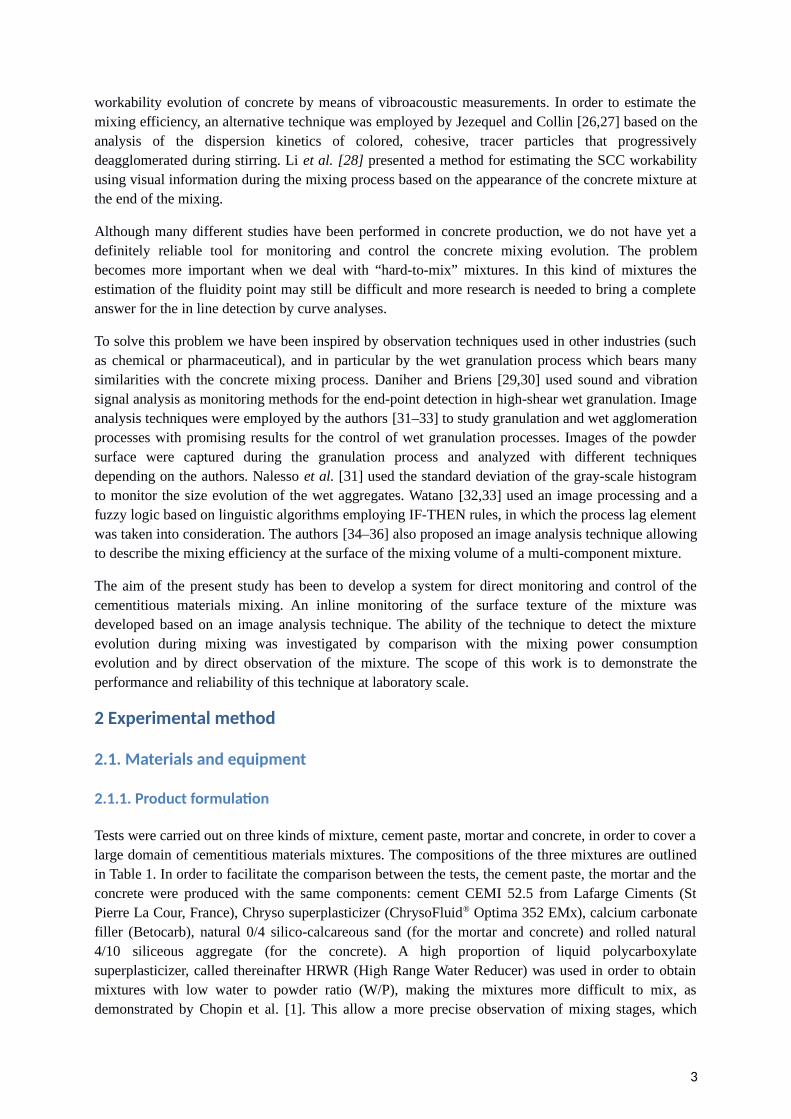
Common tools often used for image analysis are histograms, line profiles, and intensity measurements.The better tool for our application is the histogram image analysis. A histogram counts and graphs thetotal number of pixels at each gray-scale level as a function of their intensity. From the histogram, wecan know whether the image contains distinct regions of a certain gray-level value and detect theimage contrast. For example, in Figure 4a (dry concrete constituents before the water addition) we canobserve a narrow peak corresponding to a large number of pixels with the same gray-level value, thesurface texture is quite smooth and homogeneous. Conversely, in Figure 4b (intermediate step ofmixing) the span of the histogram is larger, which means that the range of pixel gray-level is larger andthus that the surface texture more rough and uneven. To represent these differences in the gray-levelpeak width we use the Standard Deviation of the gray-level histogram (texture index) employed byNalesso et al. (2015). Minor differences in lighting conditions or in camera position can have animpact on the texture index, this is why we normalize the signal by dividing each result by a meandone within 15 seconds prior to the introduction of water (when the dry powder bed is stabilized). Arolling mean of 300 images (2.5 seconds) was finally applied in order to remove the signal noise. Weobtain then a measure of the surface texture by an image analysis tool, the Normalized STD of thegray-level histogram, hereinafter the normalized texture index.
Fig. 4 Gray-level histogram at two different times of a concrete mixing.
6
3 Results and discussions
3.1 Concrete mixing
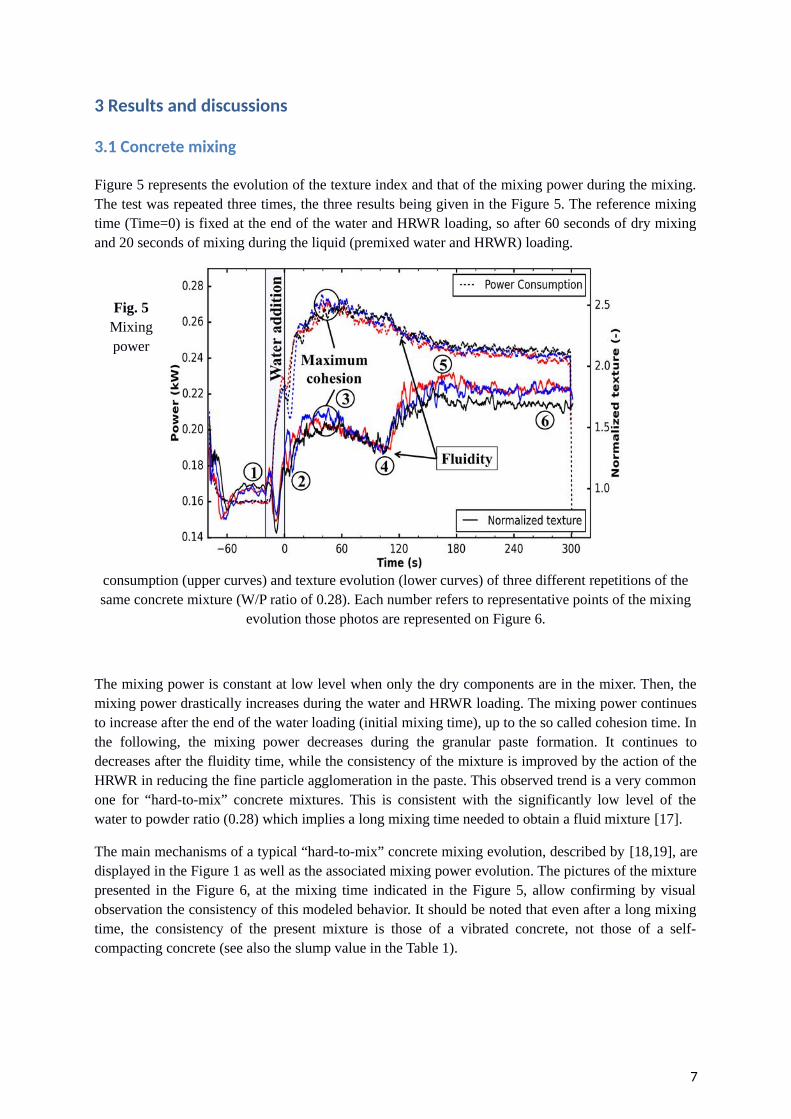
Figure 5 represents the evolution of the texture index and that of the mixing power during the mixing.The test was repeated three times, the three results being given in the Figure 5. The reference mixingtime (Time=0) is fixed at the end of the water and HRWR loading, so after 60 seconds of dry mixingand 20 seconds of mixing during the liquid (premixed water and HRWR) loading.
Fig. 5Mixingpower
consumption (upper curves) and texture evolution (lower curves) of three different repetitions of thesame concrete mixture (W/P ratio of 0.28). Each number refers to representative points of the mixing
evolution those photos are represented on Figure 6.
The mixing power is constant at low level when only the dry components are in the mixer. Then, themixing power drastically increases during the water and HRWR loading. The mixing power continuesto increase after the end of the water loading (initial mixing time), up to the so called cohesion time. Inthe following, the mixing power decreases during the granular paste formation. It continues todecreases after the fluidity time, while the consistency of the mixture is improved by the action of theHRWR in reducing the fine particle agglomeration in the paste. This observed trend is a very commonone for “hard-to-mix” concrete mixtures. This is consistent with the significantly low level of thewater to powder ratio (0.28) which implies a long mixing time needed to obtain a fluid mixture [17].
The main mechanisms of a typical “hard-to-mix” concrete mixing evolution, described by [18,19], aredisplayed in the Figure 1 as well as the associated mixing power evolution. The pictures of the mixturepresented in the Figure 6, at the mixing time indicated in the Figure 5, allow confirming by visualobservation the consistency of this modeled behavior. It should be noted that even after a long mixingtime, the consistency of the present mixture is those of a vibrated concrete, not those of a self-compacting concrete (see also the slump value in the Table 1).
7
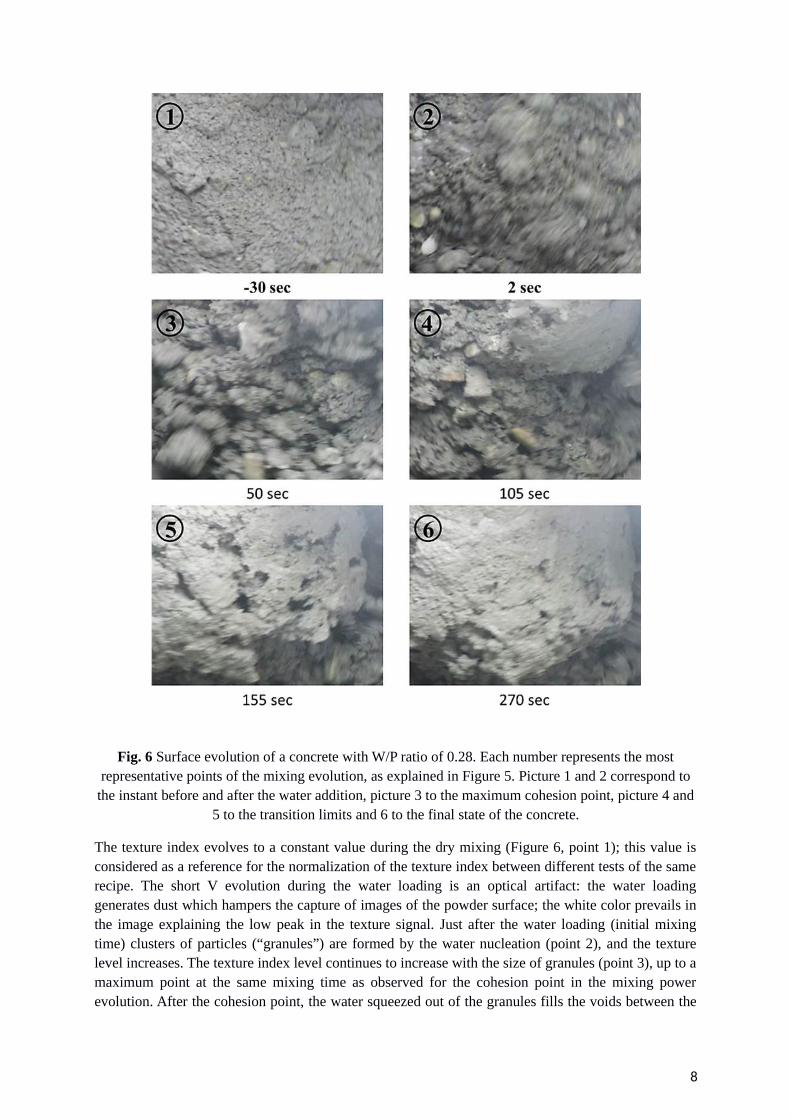
Fig. 6 Surface evolution of a concrete with W/P ratio of 0.28. Each number represents the mostrepresentative points of the mixing evolution, as explained in Figure 5. Picture 1 and 2 correspond to
the instant before and after the water addition, picture 3 to the maximum cohesion point, picture 4 and5 to the transition limits and 6 to the final state of the concrete.
The texture index evolves to a constant value during the dry mixing (Figure 6, point 1); this value isconsidered as a reference for the normalization of the texture index between different tests of the samerecipe. The short V evolution during the water loading is an optical artifact: the water loadinggenerates dust which hampers the capture of images of the powder surface; the white color prevails inthe image explaining the low peak in the texture signal. Just after the water loading (initial mixingtime) clusters of particles (“granules”) are formed by the water nucleation (point 2), and the texturelevel increases. The texture index level continues to increase with the size of granules (point 3), up to amaximum point at the same mixing time as observed for the cohesion point in the mixing powerevolution. After the cohesion point, the water squeezed out of the granules fills the voids between the
8

granules and produces a smoother surface, producing a decrease in the texture level. When most of thevoids between the granules are filled, the material becomes a paste. The transition between a raspberryshape surface and a paste surface seems to be close to the point 4, in Figure 5 and 6 and certainlybefore the point 5 (indicated in the same figures). The newly formed paste is fractured during mixingby the impeller’s blades. The fractures increase progressively the texture level. Indeed, at this stage,the consistency of the paste is very stiff, and the fractures are not closed before new fractures appearafter one turn of the impeller. The texture index starts to decrease at the point 5. One can roughlyconsider that at this mixing time, the consistency of the paste becomes fluid enough to reverse thisphenomenon; the rate of fractures closed becomes higher than the rate of fractures created duringmixing. After the point 5, the paste evolves to a stable texture index as it also evolves to a stableconsistency (point 6).
By taking into account these considerations, it seems that the image analysis method allows an easydetection of the cohesion point, at the same mixing time as indicated by the mixing power evolution(Figure 6). This corresponds to a local maximum of the texture index. To decide if the point 4,corresponding to a local minimum in the texture index, could be considered as the fluidity point, acomparison with the mixing power fluctuation is given in the Figure 7. The evolution of the mixingpower fluctuation is employed by the authors [17–20] to determine more accurately the fluidity pointof the concrete mixing process. These authors define this fluidity point as the point associated with astabilization of the fluctuation curve trend, at lower level than during pendular, funicular and capillarystructures of the mixture. Indeed, comparing the evolution of texture with the mixing powerfluctuation, we can observe that the level of fluctuation decreases and stabilizes beginning with thepoint 4, with a slight further decrease up to the point 5. By taking into account the visual observationof the mixture structure (see for instance Figure 6) we conclude that the point 4 is the beginning of theformation of the paste, so could be considered as the fluidity point (or at least the beginning of afluidity transition zone).
This new method seems more powerful in detecting the fluidity time (point 4) than the mixing powerfluctuation signal. We can consider that the method clearly detects the time where the paste is formedby the minimum of the texture evolution in point 4. Conversely, in the power fluctuation signal thedetection is very complex and subjective, resulting in some cases in a very high uncertainty. Acomprehensive analysis of the method accuracy and repeatability is given in section 3.4.
9
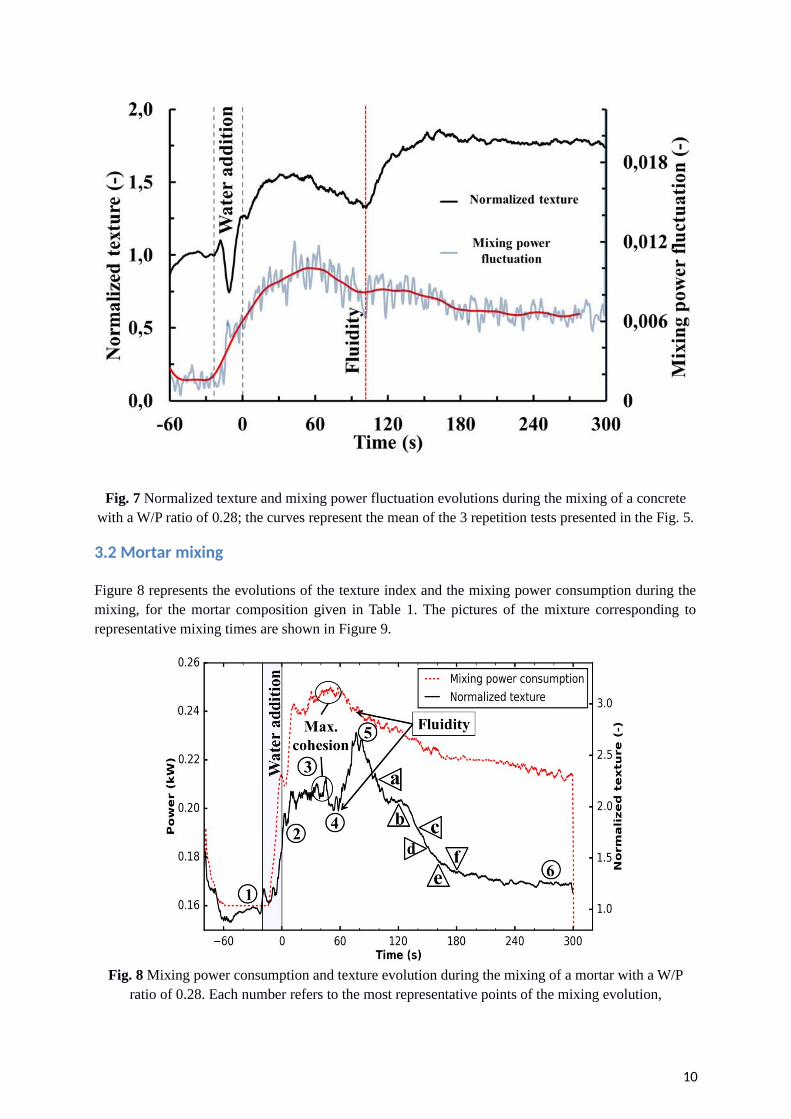
Fig. 7 Normalized texture and mixing power fluctuation evolutions during the mixing of a concretewith a W/P ratio of 0.28; the curves represent the mean of the 3 repetition tests presented in the Fig. 5.
3.2 Mortar mixing
Figure 8 represents the evolutions of the texture index and the mixing power consumption during themixing, for the mortar composition given in Table 1. The pictures of the mixture corresponding torepresentative mixing times are shown in Figure 9.
Fig. 8 Mixing power consumption and texture evolution during the mixing of a mortar with a W/Pratio of 0.28. Each number refers to the most representative points of the mixing evolution,
10
represented on Figure 9. Letters refers to a more detailed analysis between points 5 and 6, representedon Figure 10.
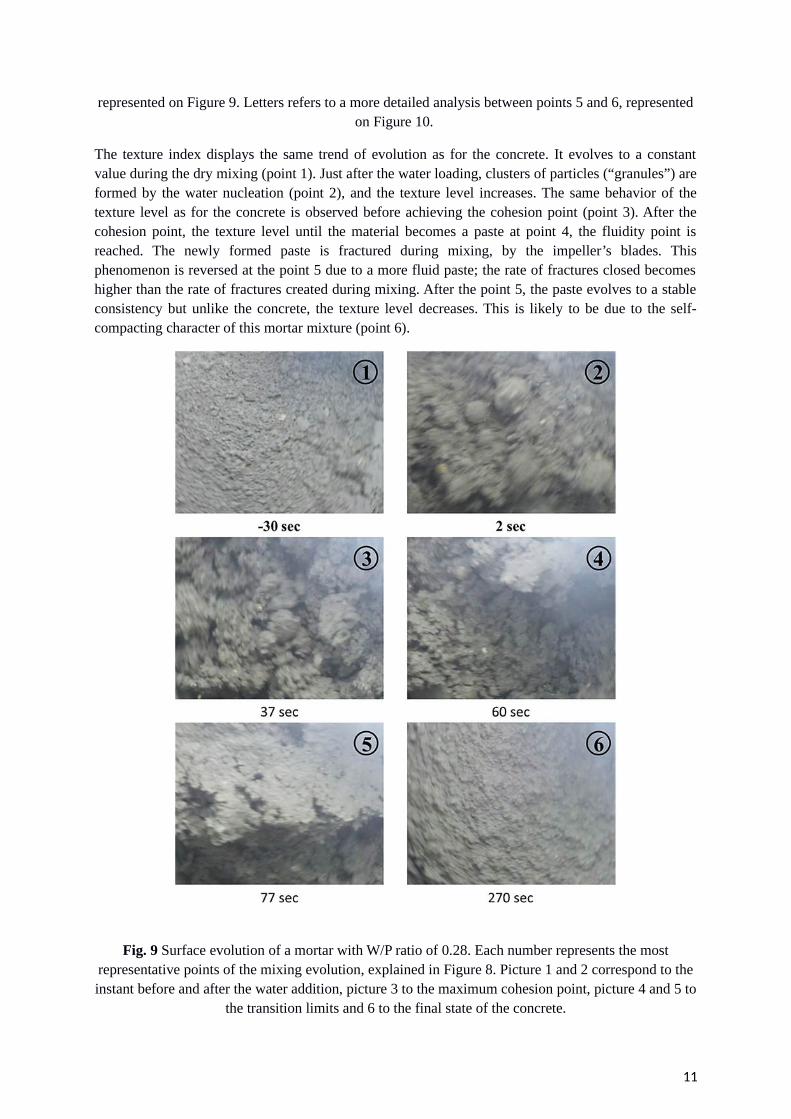
The texture index displays the same trend of evolution as for the concrete. It evolves to a constantvalue during the dry mixing (point 1). Just after the water loading, clusters of particles (“granules”) areformed by the water nucleation (point 2), and the texture level increases. The same behavior of thetexture level as for the concrete is observed before achieving the cohesion point (point 3). After thecohesion point, the texture level until the material becomes a paste at point 4, the fluidity point isreached. The newly formed paste is fractured during mixing, by the impeller’s blades. Thisphenomenon is reversed at the point 5 due to a more fluid paste; the rate of fractures closed becomeshigher than the rate of fractures created during mixing. After the point 5, the paste evolves to a stableconsistency but unlike the concrete, the texture level decreases. This is likely to be due to the self-compacting character of this mortar mixture (point 6).
Fig. 9 Surface evolution of a mortar with W/P ratio of 0.28. Each number represents the mostrepresentative points of the mixing evolution, explained in Figure 8. Picture 1 and 2 correspond to theinstant before and after the water addition, picture 3 to the maximum cohesion point, picture 4 and 5 to
the transition limits and 6 to the final state of the concrete.
11
Concerning the identification of the characteristics times with respect to the concrete mixture, it seemsa little more difficult to detect the cohesion time (point 3), this is because the homogenization time isabout the same as the time to cohesion and consequently reading becomes more difficult. The fluiditypoint (point 4) and the transition point 5 remain clearly identifiable. Similarly to the concrete mixture,the texture signal allows a better detection of the fluidity point than the power mixing fluctuationsignal which it is totally inaccurate and inappropriate for this kind of mixture (see Section 3.4, Table2).
After the point 5, the evolution is faster and more pronounced than for the concrete and the mechanismof this evolution is more clearly observed. The evolution during the fluidification of the paste goes upto get a self-compacting mortar character. At the final stage of the mixing, the material surfacebecomes horizontal and the fractures created by the impeller are closed soon after its passage. From apoint of view of the texture, a similarity is found between the dry powder surface and the self-compacting mortar surface, with moreover a close texture level in both cases.
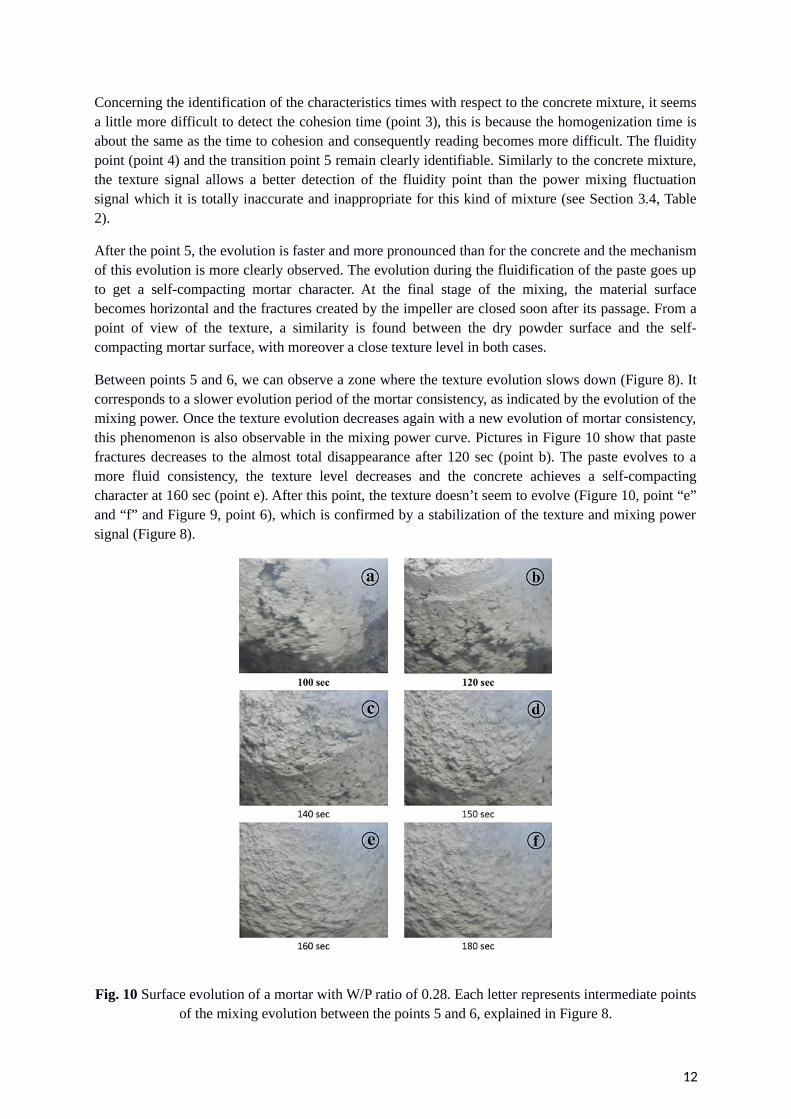
Between points 5 and 6, we can observe a zone where the texture evolution slows down (Figure 8). Itcorresponds to a slower evolution period of the mortar consistency, as indicated by the evolution of themixing power. Once the texture evolution decreases again with a new evolution of mortar consistency,this phenomenon is also observable in the mixing power curve. Pictures in Figure 10 show that pastefractures decreases to the almost total disappearance after 120 sec (point b). The paste evolves to amore fluid consistency, the texture level decreases and the concrete achieves a self-compactingcharacter at 160 sec (point e). After this point, the texture doesn’t seem to evolve (Figure 10, point “e”and “f” and Figure 9, point 6), which is confirmed by a stabilization of the texture and mixing powersignal (Figure 8).
Fig. 10 Surface evolution of a mortar with W/P ratio of 0.28. Each letter represents intermediate pointsof the mixing evolution between the points 5 and 6, explained in Figure 8.
12

3.3 Cement paste mixing
Finally, a test was carried out for the cement paste composition whose formulation was given in table1. Figure 11 represents the cement paste evolution texture index evolution and also the mixing powerconsumption evolution during the mixing. The surface pictures corresponding to the mostrepresentative times are shown in Figure 12.
Fig. 11 Mixing power consumption and texture evolution during the mixing of a cement paste with aW/P ratio of 0.28. Each number refers to the most representative points of the mixing evolution,
represented on Figure 12.
We can find again the characteristic points of the texture evolution described for concrete and mortar.However, the peak of cohesion occurs during or shortly after the introduction of water. This indicatesthat the proportion of water in the mixture is too high making the mixture unable to keep the "hard-to-mix" character. Excess of water is clear in the pictures of points 2 and 3 (Figure 12). Point 4corresponds to the creation of a homogeneous paste having incorporated all the water and whichcontains fine particles agglomerates. The self-compacting character of the paste is acquired from thismixing stage. The continuation of shear produces the dissolution of agglomerates.
The texture evolution after point 4 can be explained by a new phenomenon, characteristic of this typeof mixture. Dissolution of agglomerates in the paste produces a more compact granular skeleton andwater is released from the mixture to its surface. Light zones appear due to a mirror effect and also, theair bubbles trapped at the surface of the mixture increase significantly the texturing. When the waterfilm at the surface of the mixture begins to homogenize over the whole surface, and when on the otherhand, air bubbles begin to be released more rapidly from the mixture, the measured texture leveldecreases again.
13

Fig. 12 Surface evolution of a cement paste with W/P ratio of 0.28. Each number represents the mostrepresentative points of the mixing evolution, explained in figure 10. Picture 1 and 2 correspond to theinstant before and after the water addition, picture 3 to an intermediate moment, picture 4 and 5’ to the
transition limits and 6 to the final state of the concrete.
3.4 Technique accuracy
In this section, we discuss the accuracy of the technique with respect to the identification ofcharacteristic points of mixing, with particular regard to the cohesion and fluidity time by textureindex evolution. We consider the results on concrete and mortar for which three and respectively tworepetitions were performed. We also compare the estimation of the cohesion time obtained from thetexture evolution with that obtained from the mixing power signal. Results are resumed in Table 2.
14

Table 2. Repeatability of the estimates of cohesion and fluidity times obtained by the texture evolutionin comparison with other estimates based on the mixing power evolution.
First of all, an overall good repeatability can be remarked. The cohesion point seems to be detectedwith the same precision by texture analysis and power evolution since the total STD between thedifferent repetition tests is very similar for both techniques. The cohesion point is detectedapproximately 4 seconds (Table 2) before with the new method but this offset remains very smallcompared to the total mixing time. We can then expect a very high accuracy detection of the cohesionpoint combining these two methods.
With the new texture method, the fluidity point is detected with very high precision, the total STD isless than 1 second (Table 2). It should be noted that the power fluctuation technique to detect thefluidity point is far from being simple, objective and accurate, mainly for mortar and cement paste.
A combination between the power signal and the texture signal seems to be the better way to monitorthe concrete mixing evolution with precision but the use of the new technique alone simplifies theanalysis remaining very reliable and accurate and allows identifying the characteristics points of theprocess approximately 5 seconds before the other techniques.
15

4 Conclusions
In this work, an inline image analysis technique is applied to the monitoring of concrete mixing.
The technique is based on the evolution of the texture (estimated from the gray-level histogram) ofpictures taken at the surface of the paste during mixing. The method is applied to the assessment of theevolution of the paste during processing in an intensive laboratory scale mixer for three differentformulations.
We have chosen to study a cement paste, a mortar and a concrete keeping constant the W/P ratio. Thislevel of W/P provides a self-compacting character to the mortar mixture, also giving it a "hard-to-mix"character. This was achieved using the HRWR at the maximum level of its absorption by the powder.Therefore, the concrete mixture has also a “hard-to-mix” character, but the proportion of water isslightly less than that required for obtaining a self-compacting concrete. In contrast, at this level ofW/P, the cement paste is water overdosed. This mixture is then “easy-to-mix” and a bleeding isexpected when the paste is well mixed.
A similar texture evolution is observed in the 3 mixtures with differences strictly related to the natureof the mixture. An explanation of the observed evolution is given in the 3 cases, based on the picturesand the information provided by the mixing power measurement. In all the cases, the new methodappears robust to determine the fluidity point during mixing. We can also determine with precision thecohesion point, at least for the concrete and for the “hard-to-mix” formulations, which are also thosewith a larger cohesion time than the homogenization time as explained by Chopin et al. (2007).
Concerning the mortar and concrete, the new method also allows the detection of a characteristic pointof the mixture, where the mixture is sufficiently fluid (sufficiently reduced shear threshold), to ensurethe paste flow at the speed imposed by mixing. Although this point seems to depend on the speed andthe mixing geometry, it may potentially be useful for a more detailed description of the state ofmixing.
It has to be noted that, due to the fast motion of the surface, images may appear slightly blurred insome cases. This is not a limitation of the technique itself but is related to the experimental setup(camera and lighting conditions) used in this work. However, the texture analysis seems to be robustand works well even in such conditions. Everything suggests that this monitoring technique can beused in an industrial context where the experimental conditions are seldom the optimal ones.
To conclude, the method proves to be very robust for a large range of formulations (cement paste,mortar and concrete). The evolution of the texture allows obtaining important information on theevolution of the different pastes during mixing; in addition, the technique allows identifying with agood repeatability the main characteristic points of the mixture evolution, i.e. the cohesion time andthe fluidity time.
Compliance with Ethical Standards:
The authors declare that they have no conflict of interest.
References
[1] D. Chopin, F. De Larrard, B. Cazacliu, Why do HPC and SCC require a longer mixing time?,Cem. Concr. Res. 34 (2004) 2237–2243. doi:10.1016/j.cemconres.2004.02.012.
16

[2] D. Lowke, P. Schiessl, Effect of Mixing Energy on Fresh Properties of Scc, Proceeding FouthInt. RILEM Symp. Self-Compacting Concr. (2005) 517–523.
[3] P. Schießl, O. Mazanec, D. Lowke, SCC and UHPC – Effect of Mixing Technology on FreshConcrete Properties, Concrete. (n.d.).
[4] J. Dils, G. De Schutter, V. Boel, Influence of mixing procedure and mixer type on fresh andhardened properties of concrete: a review, Mater. Struct. 45 (2012) 1673–1683.doi:10.1617/s11527-012-9864-8.
[5] O. Mazanec, D. Lowke, P. Schießl, Mixing of high performance concrete : effect of concretecomposition and mixing intensity on mixing time, Mater. Struct. (2010) 357–365.doi:10.1617/s11527-009-9494-y.
[6] H. Beitzel, Optimisation of the Mixing Process for Producing SCHP Concrete, RILEMBookseries. 1 (2010) 175–183. doi:10.1007/978-90-481-9664-7.
[7] H. Lombois-Burger, P. Colombet, J.L. Halary, H. Van Damme, Kneading and extrusion ofdense polymer-cement pastes, Cem. Concr. Res. 36 (2006) 2086–2097.doi:10.1016/j.cemconres.2006.08.001.
[8] R.G. Pileggi, A.R. Studart, V.C. Pandolfelli, J. Gallo, How mixing affects the rheology ofrefractory castables, Part 2, Am. Ceram. Soc. Bull. 80 (2001) 38–42.
[9] L. Prasittisopin, D. Trejo, Effects of Mixing Variables on Hardened Characteristics of PortlandCement Mortars, Mater. J. 112 (2015). doi:10.1017/CBO9781107415324.004.
[10] A.S. Brand, J.R. Roesler, A. Salas, Initial moisture and mixing effects on higher qualityrecycled coarse aggregate concrete, Constr. Build. Mater. 79 (2015) 83–89.doi:10.1016/j.conbuildmat.2015.01.047.
[11] A. Wendling, D. Mar, N. Wischmeier, D. Anderson, T. McIff, Combination of modified mixingtechnique and low frequency ultrasound to control the elution profile of vancomycin-loadedacrylic bone cement, Bone Jt. Res. 5 (2016) 26–32. doi:10.1302/2046-3758.52.2000412.
[12] B. Cazacliu, In-mixer measurements for describing mixture evolution during concrete mixing,in: Sixth Int. Symp. Mix. Ind. Process Ind., 2008.
[13] R. Teillet, S. Bruneaud, Y. Charonnat, Suivi et contrôle de l a fabrication des mélanges : Unenouvelle jeunesse pour le wattmètre différentiel, Bull. Liaison Des Lab. Des Pont Chaussées.N° 174 (1991).
[14] E.H. Lichtenberg, Method of and apparatus for determining the consistency of concrete,(1929).
[15] R. Sauterey, Utilisation du wattmetre differentiel pour le controle d’un poste d'enrobagediscontinu C0P.pdf, (1968).
[16] D. Chopin, B. Cazacliu, F. De Larrard, R. Schell, Monitoring of concrete homogenisation withthe power consumption curve, Mater. Struct. 40 (2007) 897–907. doi:10.1617/s11527-006-9187-8.
[17] B. Cazacliu, J. Legrand, Characterization of the granular-to-fluid state process during mixingby power evolution in a planetary concrete mixer, Chem. Eng. Sci. 63 (2008) 4617–4630.doi:10.1016/j.ces.2008.06.001.
[18] B. Cazacliu, In-mixer measurements for describing mixture evolution during concrete mixing,Chem. Eng. Res. Des. 86 (2008) 1423–1433. doi:10.1016/j.cherd.2008.08.021.
17

[19] B. Cazacliu, N. Roquet, Concrete mixing kinetics by means of power measurement, Cem.Concr. Res. 39 (2009) 182–194. doi:10.1016/j.cemconres.2008.12.005.
[20] H.-T. Ngo, E.-H. Kadri, A. Kaci, T.-T. Ngo, A. Trudel, S. Lecrux, Advanced online watercontent measurement for self-compacting concrete production in ready-mixed concrete plants,Constr. Build. Mater. 112 (2016) 570–580. doi:10.1016/j.conbuildmat.2016.02.158.
[21] M. Martin, M. Renault, P.H. Jezequel, E. Garcia, Mixability and particle size distributioncriteria—Study on model materials, Powder Technol. 190 (2009) 36–40.doi:10.1016/j.powtec.2008.04.091.
[22] R. Collet, D. Oulahna, A. De Ryck, P.H. Jezequel, M. Martin, Mixing of a wet granularmedium: Effect of the particle size, the liquid and the granular compacity on the intensityconsumption, Chem. Eng. J. 164 (2010) 299–304. doi:10.1016/j.cej.2010.07.012.
[23] R. Collet, D. Oulahna, A. De Ryck, P.H. Jezequel, M. Martin, Mixing of a wet granularmedium: Influence of the liquid addition method, Powder Technol. 208 (2011) 367–371.doi:10.1016/j.powtec.2010.08.030.
[24] C. Baumert, H. Garrecht, Mischen von hochleistungsbetonen, Beton- Und Stahlbetonbau. 105(2010) 371–378. doi:10.1002/best.201000011.
[25] L.N. Danilevskii, E. V. Korobko, S. V. Terekhov, Vibroacoustic monitoring of the homogeneityand workability of concrete mixes by their hydromechanical state in the process of mixing, J.Eng. Phys. Thermophys. 82 (2009) 338–345. doi:10.1007/s10891-009-0189-6.
[26] P.H. Jézéquel, V. Collin, Mixing of concrete or mortars: Dispersive aspects, Cem. Concr. Res.39 (2009) 678–686. doi:10.1016/j.cemconres.2009.05.011.
[27] V. Collin, P.H. Jézéquel, Mixing of concrete or mortars: Distributive aspects, Cem. Concr. Res.39 (2009) 678–686. doi:10.1016/j.cemconres.2009.05.011.
[28] S. Li, X. An, Method for estimating workability of self-compacting concrete using mixingprocess images, Comput. Concr. 6 (2014) 781–798.
[29] D. Daniher, L. Briens, A. Tallevi, End-point detection in high-shear granulation using soundand vibration signal analysis, Powder Technol. 181 (2008) 130–136.doi:10.1016/j.powtec.2006.12.003.
[30] L. Briens, D. Daniher, a. Tallevi, Monitoring high-shear granulation using sound and vibrationmeasurements, Int. J. Pharm. 331 (2007) 54–60. doi:10.1016/j.ijpharm.2006.09.012.
[31] S. Nalesso, C. Codemo, E. Franceschinis, N. Realdon, R. Artoni, A.C. Santomaso, Textureanalysis as a tool to study the kinetics of wet agglomeration processes, Int. J. Pharm. 485(2015) 61–69. doi:10.1016/j.ijpharm.2015.03.007.
[32] S. Watano, Direct control of wet granulation processes by image processing system, PowderTechnol. 117 (2001) 163–172. doi:10.1016/S0032-5910(01)00322-9.
[33] S. Watano, T. Numa, K. Miyanami, Y. Osako, A fuzzy control system of high shear granulationusing image processing, Powder Technol. 115 (2001) 124–130. doi:10.1016/S0032-5910(00)00332-6.
[34] B. Daumann, H. Nirschl, Assessment of the mixing efficiency of solid mixtures by means ofimage analysis, Powder Technol. 182 (2008) 415–423. doi:10.1016/j.powtec.2007.07.006.
[35] B. Daumann, A. Fath, H. Anlauf, H. Nirschl, Determination of the mixing time in adiscontinuous powder mixer by using image analysis, Chem. Eng. Sci. 64 (2009) 2320–2331.
18

doi:10.1016/j.ces.2009.01.032.
[36] H. Berthiaux, V. Mosorov, L. Tomczak, C. Gatumel, J.F. Demeyre, Principal componentanalysis for characterising homogeneity in powder mixing using image processing techniques,Chem. Eng. Process. Process Intensif. 45 (2006) 397–403. doi:10.1016/j.cep.2005.10.005.
[37] B. Cazacliu, Mixing self compacting concrete: mixers, mixing methods, mixing time, in:RILEM, 2013: pp. 1–8.
[38] EN 12350-2, 2012. Testing fresh concrete - Slump test
19