Monitoring MongoDB’s Engines in the Wild - percona.com · • Nagios • MRTG • Munin •...
44
Tim Vaillancourt Sr. Technical Operations Architect Monitoring MongoDB’s Engines in the Wild
Transcript of Monitoring MongoDB’s Engines in the Wild - percona.com · • Nagios • MRTG • Munin •...

Tim Vaillancourt Sr. Technical Operations Architect
Monitoring MongoDB’s Engines in the Wild

About Me• Joined Percona in January 2016• Sr Technical Operations Architect for MongoDB• Previous:
• EA DICE (MySQL DBA)• EA SPORTS (Sys/NoSQL DBA Ops)• Amazon/AbeBooks Inc (Sys/MySQL+NoSQL DBA Ops)
• Main techs: MySQL, MongoDB, Cassandra, Solr, Redis, queues, etc• 10+ years tuning Linux for database workloads (off and on) • Monitoring techs
• Nagios • MRTG• Munin• Zabbix • Cacti• Graphite• Prometheus

Storage Engines• MMAPv1
• Mostly done by Linux kernel• WiredTiger
• Default as of 3.2• Percona In-Memory
• Same metrics as WiredTiger• RocksDB• PerconaFT / TokuMX
• Deprecated• Fractal-tree based storage engine

Storage Engines?! The New SE API
• Introduced in MongoDB 3.0
• Abstraction layer for storage-level interaction
• Allowed integration of WiredTiger and other features

Storage Engines: MMAPv1• Default storage engine < 3.2 (now WiredTiger) • Collection-level locking (common performance bottleneck)
• Monitored via Lock Ratio/Percent metrics • In-place datafile updating (when possible) • OS-level operations
• Uses OS-level mmap() to map BSON files on disk <=> memory• Uses OS-level filesystem cache as block cache• Much low(er) monitoring visibility
• Database metrics must be gathered from OS-level• OS-level metrics are more vague

Storage Engines: MMAPv1• Document read path
• Try to load from cache• If not in cache, load from BSON file on
disk• Document update/write path
• Try to update document in-place• If too big, “move” document on disk
until a free space is found

• New default engine as of 3.2• Standalone LSM engine acquired by MongoDB
Inc• BTree-Based under MongoDB• Integrated using Storage Engine API
• Document-level locking• Built-in compression• Index prefix compression• MVCC and Concurrency Limits• High parallelism / CPU utilisation
Storage Engines: WiredTiger

Storage Engines: WiredTiger• Document Write Path
• Update, delete or write is written to WT log• Changes to data files are performed by checkpointing later
• Document Read Path• Looks for data in in-heap cache• Looks for data in the WT log• Goes to data files for the data
• Kernel will look in filesystem cache, uncompress result if exists
• If not in FS cache, read from disk and uncompress result• Switch compression algorithms if CPU is too high

Storage Engines: RocksDB / MongoRocks• MongoRocks developed by • Tiered level compaction strategy• First layer is called the MemTable• N number of on-disk levels• Compaction is triggered when any level is full• In-heap Block Cache (default 30% RAM)
• Holds uncompressed data• BlockCache reduces compression CPU hit
• Kernel-level Page Cache for compressed data• Space amplification of LSM is about +10%• Optional ‘counters’: storage.rocksdb.counters

Storage Engines: RocksDB / MongoRocks• Document Write path
• Updates, Deletes and Writes go to Meltable and complete• Compaction resolves multi-versions of data in the background
• Document Read path• Looks for data in MemTable• Level 0 to Level N is asked for the data• Data is read from filesystem cache, if
present, then uncompressed• Or, bloom filter is used to find data file,
then data is read and uncompressed

Storage Engines: RocksDB / MongoRocks• Watch for
• Pending compactions• Stalls
• Indicates compaction system is overwhelmed, possibly due to I/O• Level Read Latencies
• If high, disk throughput may be too low• Rate of compaction in bytes vs any
noticeable slowdown• Rate of deletes vs read latency
• Deletes add expense to reads and compaction

Metric Sources: operationProfiling• Writes slow database operations to a new MongoDB collection for analysis
• Capped Collection: “system.profile” in each database, default 100mb • The collection is capped, ie: profile data doesn’t last forever
• Support for operationProfiling data in Percona Monitoring and Management in current future goals• Enable operationProfiling in “slowOp” mode
• Start with a very high threshold and decrease it in steps• Usually 50-100ms is a good threshold• Enable in mongod.confoperationProfiling:
slowOpThresholdMs: 100
mode: slowOp
Or the command-line way… mongod <other-flags> —profile 1 —slowms 100

Metric Sources: operationProfiling• op/ns/query: type, namespace and query of a profile• keysExamined: # of index keys examined • docsExamined: # of docs examined to achieve result• writeConflicts: # of WCE encountered during update • numYields: # of times operation yielded for others • locks: detailed lock statistics

Metric Sources: operationProfiling• nreturned: # of documents returned by the operation• nmoved: # of documents moved on disk by the operation• ndeleted/ninserted/nMatched/nModified: self
explanatory• responseLength: the byte-length of the server response• millis: execution time in milliseconds• execStats: detailed statistics explaining the query’s
execution steps• SHARDING_FILTER = mongos sharded query• COLLSCAN = no index, 35k docs examined(!)

Metric Sources: db.serverStatus()• A function that dumps status info about MongoDB’s current status
• Think “SHOW FULL STATUS” + “SHOW ENGINE INNODB STATUS” • Sections
• Asserts• backgroundFlushing• connections• dur (durability)• extra_info• globalLock + locks• network• opcounters• opcountersRepl• repl (replication)• storageEngine• mem (memory)• metrics• (Optional) wiredTiger• (Optional) rocksdb

Metric Sources: db.serverStatus().rocksdb

Metric Sources: db.serverStatus().rocksdb

• ‘block-manager’: disks reads/writes• ‘cache’: in-heap page cache
• Watch eviction modified vs unmodified
• ‘cursor’: WiredTiger cursor ops/calls• ‘log’: WiredTiger log stats
Metric Sources: db.serverStatus().wiredTiger

• ‘transaction’: checkpoint and trx info• Watch max/min/avg checkpoint times
• ‘concurrentTransactions’: concurrency ticket info (!)• Increased with engine variable
Metric Sources: db.serverStatus().wiredTiger

Metric Sources: db.serverStatus().wiredTiger

Metric Sources: rs.status()• A function that dumps replication status
• Think “SHOW MASTER STATUS” or “SHOW SLAVE STATUS”
• Contains• Replication set name and term• Member status
• State• Optime state• Election state• Heartbeat state

Metric Sources: Cluster Metadata• The “config” database on Cluster Config servers• Contains
• actionlog (3.0+)• changelog• databases• collections • shards• chunks• settings• mongos• locks• lockpings

Metric Sources: db.currentOp()• A function that dumps status info about running operations and various lock/execution details

Metric Sources: Log Files• Interesting details are logged to the mongod/mongos log files
• Slow queries • Storage engine details (sometimes) • Index operations• Chunk moves• Connections

Monitoring: Percona PMM• Open-source
monitoring from Percona!
• Based on open-source technology
• Simple deployment• Examples in this
demo are from PMM• 800+ metrics per
ping

Monitoring: Prometheus + Grafana• Percona-Lab GitHub
• grafana_mongodb_dashboards for Grafana• prometheus_mongodb_exporter for Prometheus
• Sources• db.serverStatus()• rs.status()• sh.status()• Config-server metadata• Others and more soon..
• Supports MMAPv1, WT and RocksDB• node_exporter for Prometheus
• OS-level (mostly Linux) exporter

Monitoring: Prometheus + Grafana

Usual Performance Suspects• Locking
• Collection-level locks• Document-level locks• Software mutex/semaphore
• Limits• Max connections• Operation rate limits• Resource limits
• Resources• Lack of IOPS, RAM, CPU,
network, etc

MongoDB Resources and Consumers• CPU
• System CPU• FS cache• Networking• Disk I/O• Threading
• User CPU (MongoDB)• Compression (WiredTiger and RocksDB) • Session Management• BSON (de)serialisation• Filtering / scanning / sorting• Optimiser
• Disk• Data file read/writes• Journaling• Error logging
• Network• Query request/response• Replication

High-Level OS Resources• CPU
• CPU Load Averages• thread-per-connection
• User vs System CPU• System is kernel-level• User is usually Mongo
• IOWAIT• Can also include
network waits• IO Time Spent
• “The canary in the gold mine”

High-Level OS Resources• Process Count
• 1 connection = 1 fork()• Context Switches
• High switches can ==too few CPUs
• Memory• True used % without
caches/buffers• Cached / Buffers
• Needed for block- caching
• Disk• Free space percent(!)• LSM trees use more disk

MMAPv1: Page Faults• Linux/Operating System
• Data pages in RAM are swapped to disk due to no free memory• MongoDB MMAPv1
• Data is read/written to data file blocks that are not in RAM• Some page faults are expected but a high rate is suspicious • A high rate often indicates:
• A working set too large for RAM (or cache size)• Inefficient patterns (eg: missing index)• Too many indices vs updates• A cold-focused access pattern

MMAPv1: Lock Ratio / Percent• MMAPv1
• Lock Ratio/Percent indicates rate of collection-level locking
• ‘db.serverStatus.globalLock.ratio’ in older versions
• ‘db.serverStatus.locks’ in newer versions• RocksDB and WiredTiger
• Global, DB and Collections Locks are “intent” locks/non-blocking

MMAPv1: Fragmentation• Can cause serious slowdowns on scans, range
queries, etc• db.<collection>.stats()
• Shows various storage info for a collection• Fragmentation can be computed by dividing
‘storageSize’ by ‘size’ • Any value > 1 indicates fragmentation• Compact when you near a value of 2 by
rebuilding secondaries or using the ‘compact’ command
• WiredTiger and RocksDB have little/no fragmentation

MMAPv1: Background Flushing• Stats on the count/time taken to flush in the background• If ‘average_ms’ grow continuously, writes will eventually go direct to disk based on:
• Linux sysctl ‘vm.dirty_ratio’• Writes go to disk if dirty page ratio exceeds this number
• Linux sysctl ‘vm.dirty_background_ratio’

Rollbacks• JSON file written to ‘rollback’ dir on-disk when PRIMARY crashes
when ahead of SECONDARYs• Monitor for this file existing

WiredTiger + RocksDB: Checkpoints/Compactions
• Moves changes to real data files• Causes a massive spike in disk I/O• Monitor in combination with
• CPU IOWAIT %• Disk IO Time Spent

Replication Lag and Oplog Time Range• Replication in MongoDB is lightweight BUT it is
single threaded• Shard for more replication throughput
• Replication Lag/Delay• Subtract PRIMARY and SECONDARY ‘optime’
• Oplog Time Range• Length of oplog from start -> finish• Equal to the amount of time to rebuild a node
without needing a full re-sync!• More oplog changes == shorter time range

Scanned and Moved• Indicates random read or write I/O• Scanned
• Number of documents/objects scanned• A high rate indicates inefficient query
patterns, lack of indices, etc• Moved
• Usually happens in MMAPv1 only• Document is too big to be written in-
place and is moved elsewhere

Network• Max connections
• Ensure max available connections is not exceed• 1 connection = roughly 1MB of RAM!
• Consider connection pools if too many connections are needed
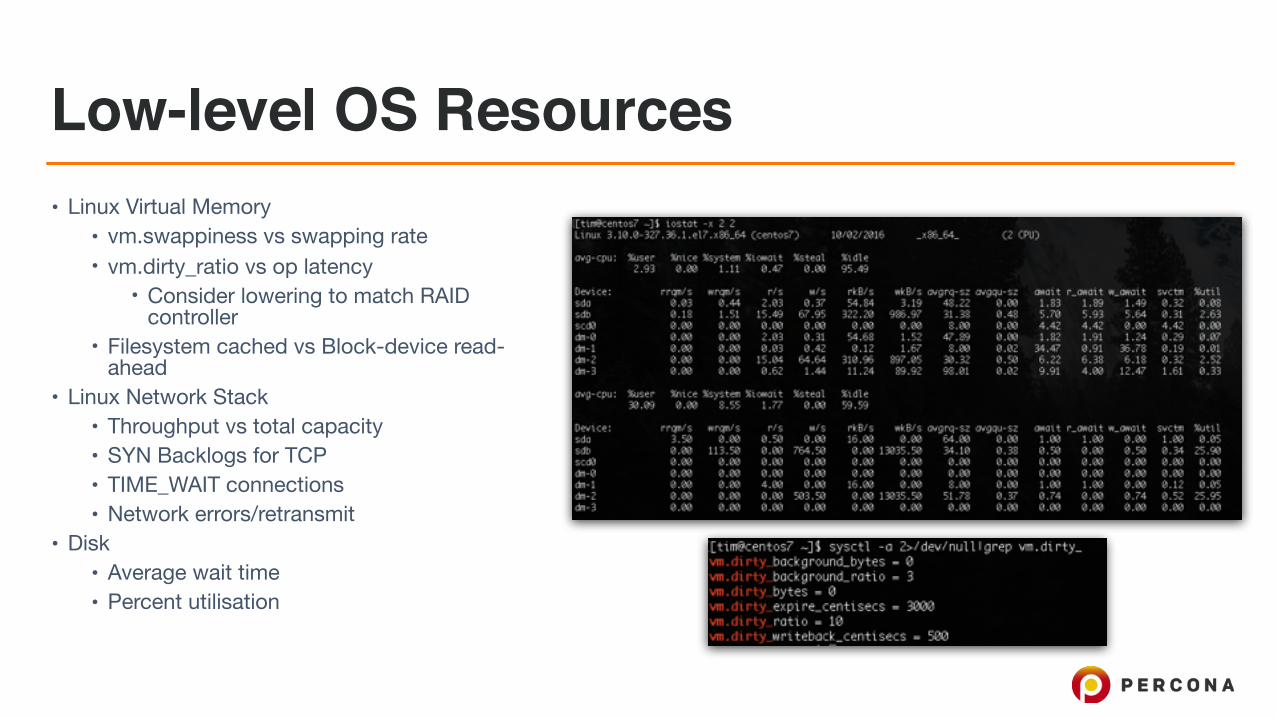
Low-level OS Resources• Linux Virtual Memory
• vm.swappiness vs swapping rate• vm.dirty_ratio vs op latency
• Consider lowering to match RAID controller
• Filesystem cached vs Block-device read-ahead
• Linux Network Stack• Throughput vs total capacity• SYN Backlogs for TCP• TIME_WAIT connections• Network errors/retransmit
• Disk• Average wait time• Percent utilisation

High-level Monitoring Tips• Polling Frequency
• A lot can happen in 1-10 seconds!• History
• Have another app/launch to compare with• Annotate maintenances, launches, DDoS, important
events• What to Monitor
• Fetch more than you graph, there’s no time machine• (IMHO) monitor until it hurts, then just a bit less than
that

Questions?

DATABASE PERFORMANCEMATTERS