Fish Habitat Assessment Procedures Watershed Restoration Technical Circular No. 8

Monitoring Habitat Restoration Projects: U.S. Fish and Wildlife Pacific Region Partners for Fish and Wildlife Program and Coastal Program Protocol
Chapter 11 of Section A, Biological Science, Book 2, Collection of Environmental Data
Prepared in cooperation with the U.S. Fish and Wildlife Service’s Partners for Fish and Wildlife Program and Coastal Program
U.S. Department of the InteriorU.S. Geological Survey
Techniques and Methods 2–A11


Monitoring Habitat Restoration Projects: U.S. Fish and Wildlife Service Pacific Region Partners for Fish and Wildlife Program and Coastal Program ProtocolBy Andrea Woodward, U.S. Geological Survey; and Kathy Hollar, U.S. Fish and Wildlife Service
Chapter 11 of Section A, Biological Science, Book 2, Collection of Environmental Data
Prepared in cooperation with the U.S. Fish and Wildlife Service, the U.S. Fish and Wildlife Service’s Partners for Fish and Wildlife Program and Coastal Program
Techniques and Methods 2–A11
U.S. Department of the InteriorU.S. Geological Survey

U.S. Department of the InteriorKEN SALAZAR, Secretary
U.S. Geological SurveyMarcia K. McNutt, Director
U.S. Geological Survey, Reston, Virginia: 2011
For more information on the USGS—the Federal source for science about the Earth, its natural and living resources, natural hazards, and the environment, visit http://www.usgs.gov or call 1-888-ASK-USGS.
For an overview of USGS information products, including maps, imagery, and publications, visit http://www.usgs.gov/pubprod.
To order this and other USGS information products, visit http://store.usgs.gov.Any use of trade, product, or firm names is for descriptive purposes only and does not imply endorsement by the U.S. Government.
Any use of trade, product, or firm names is for descriptive purposes only and does not imply endorsement by the U.S. Government.
Although this report is in the public domain, permission must be secured from the individual copyright owners to reproduce any copyrighted materials contained within this report.
Suggested citation:Woodward, Andrea, and Hollar, Kathy, 2011, Monitoring habitat restoration projects: U.S. Fish and Wildlife Service Pacific Region Partners for Fish and Wildlife Program and Coastal Program Protocol: U.S. Geological Survey Techniques and Methods 2-A11, 36 p.

iii
Figures Figure 1. Timeline of typical Partners Program project visit schedule. …………………… 7 Figure 2. Risk Urgency Matrix for determining frequency of mid-agreement visits. ……… 8
Tables Table 1. Definitions of monitoring phases ………………………………………………… 3 Table 2. Steps taken to achieve protocol objectives ……………………………………… 6
Contents
Acknowledgments .........................................................................................................................................1Introduction.....................................................................................................................................................1Standard Operating Procedure (SOP) 1 ..................................................................................................11Standard Operating Procedure (SOP) 2 ..................................................................................................15Standard Operating Procedure (SOP) 3 ..................................................................................................21References ....................................................................................................................................................30Glossary .........................................................................................................................................................31Appendix A. Examples of Completed Effectiveness Assessment Datasheets .................................33

iv
Conversion FactorsInch/Pound to SI
Multiply By To obtain
acre 0.4047 hectare (ha)
foot (ft) 0.3048 meter (m)
mile (mi) 1.609 kilometer (km)
square mile (mi2) 2.590 square kilometer (km2)
SI to Inch/Pound
Multiply By To obtain
meter (m) 3.281 foot (ft)
square meter (m2) 10.76 square foot (ft2)

Monitoring Habitat Restoration Projects: U.S. Fish and Wildlife Service Pacific Region Partners for Fish and Wildlife Program and Coastal Program Protocol
By Andrea Woodward, U.S. Geological Survey, and Kathy Hollar, U.S. Fish and Wildlife Service
AcknowledgmentsWe wish to acknowledge the staff members of the
Washington, Oregon, Idaho, and Pacific Island Field Offices of the Partners Program and Coastal Program and their efforts to organize and conduct field trips, gather project records from the archives, and discuss the restoration process and potential pitfalls. We also appreciate the patience required to travel down several blind alleys before arriving at a practical protocol. We also are grateful for the constructive comments from staff in the FWS Washington Office, as well as thoughtful reviews from Kurt Jenkins and Paul Geissler.
Introduction
Pacific Region Partners for Fish and Wildlife Program and Coastal Program: Purposes and Approach
The U.S. Fish and Wildlife Service’s (FWS) Pacific Region (Region 1) includes more than 158 million acres (almost 247,000 square miles) of land base in Idaho, Oregon, Washington, Hawai`i, the Commonwealth of the Northern Mariana Islands, American Samoa, Guam, the Republic of Palau, the Federated States of Micronesia, and the Republic of the Marshall Islands. Region 1 is ecologically diverse with landscapes that range from coral reefs, broadleaf tropical forests, and tropical savannahs in the Pacific Islands, to glacial streams and lakes, lush old-growth rainforests, inland fjords, and coastal shoreline in the Pacific Northwest, to the forested mountains, shrub-steppe desert, and native grasslands in the Inland Northwest. Similarly, the people of the different landscapes perceive, value, and manage their natural resources in ways unique to their respective regions and cultures. The Partners for Fish and Wildlife Program (Partners Program) and Coastal Program work with a variety of partners in Region 1 including individual landowners, watershed councils, land trusts, Soil and Water Conservation Districts,
non-governmental organizations, Tribal governments, Native Hawaiian organizations, and local, State, and Federal agencies. The Partners Program is the FWS’s vanguard for working with private landowners to voluntarily restore and conserve fish and wildlife habitat. Using non-regulatory incentives, the Partners Program engages willing partners to conserve and protect valuable fish and wildlife habitat on their property and in their communities. This is accomplished by providing the funding support and technical and planning tools needed to make on-the-ground conservation affordable, feasible, and effective. The primary goals of the Pacific Region Partners Program are to:
• Promote citizen and community-based stewardship efforts for fish and wildlife conservation,
• Contribute to the recovery of at-risk species,
• Protect the environmental integrity of the National Wildlife Refuges,
• Contribute to the implementation of the State Comprehensive Wildlife Conservation Strategies, and
• Help achieve the objectives of the National Fish Habitat Partnerships and regionally based bird conservation plans (for example, North American Waterfowl Management Plan, U.S. Pacific Island Shorebird Conservation Plans, Intermountain West Regional Shorebird Plan, etc.).
The Partners Program accomplishes these priorities by: • Developing and maintaining strong partnerships, and
delivering on-the-ground habitat restoration projects designed to reestablish habitat function and restore natural processes;
• Addressing key habitat limiting factors for declining species;
• Providing corridors for wildlife and decrease impediments to native fish and wildlife migration; and
• Enhancing native plant communities by reducing invasive species and improving native species composition.

2 Monitoring Habitat Restoration Projects
The Coastal Program is a voluntary fish and wildlife conservation program that focuses on watershed-scale, long-term collaborative resource planning and on-the-ground restoration projects in high-priority coastal areas. The Coastal Program conducts planning and restoration work on private, State, and Federal lands, and partnerships with other agencies—Native American Tribes, citizens, and organizations are emphasized. Coastal Program goals include restoring and protecting coastal habitat, providing technical and cost-sharing assistance where appropriate, supporting community-based restoration, collecting and developing information on the status of and threats to fish and wildlife, and using outreach to promote stewardship of coastal resources.
The diversity of habitats and partners in Region 1 present many opportunities for conducting restoration projects. Faced with this abundance of opportunity, the Partners Program and Coastal Program must ensure that limited staffing and project dollars are allocated to benefit the highest priority resources and achieve the highest quality results for Federal trust species. In 2007, the Partners Program and Coastal Program developed a Strategic Plan to guide program operations and more efficiently conserve habitat by focusing partnership building and habitat improvement actions within 35 Partners Program Focus Areas and 9 Coastal Program Focus Areas (U.S. Fish and Wildlife Service, 2010). The Strategic Plan also contains four other goals: broaden and strengthen partnerships; improve information sharing and communications; enhance workforce; and increase accountability to ensure that program resources are used efficiently and effectively. This protocol will help achieve all goals of the Strategic Plan.
Monitoring of Restoration Projects
Restoration activities are premised on the assumption that restoring or enhancing habitat towards some reference condition will have a positive effect on wildlife populations, yet this assumption is rarely tested (Block and others, 2001). Without monitoring and subsequent data analysis, it is impossible to know whether projects are achieving their goals (Kondolf, 1996). Despite the potential value of monitoring data to validate the assumptions of restoration projects and enable management to adapt through “learning by doing,” monitoring of restoration projects is rarely or poorly done (Bash and Ryan, 2002; Bernhardt and others, 2005).
Monitoring is often described as having three phases (Morrison and Marcot, 1995; Busch and Trexler, 2003): implementation, effectiveness, and validation.
• Implementation monitoring refers to assessing whether management actions for restoration were conducted as planned;
• Effectiveness monitoring is used to determine whether the management activities are having the desired habitat response; and
• Validation monitoring assesses the correctness of basic assumptions about how management actions will affect biological outcomes, often for the purpose of modeling.
Of these, implementation and effectiveness monitoring are the most relevant to evaluating restoration projects (Block and others, 2001). Implementation monitoring is a fairly straightforward assessment of whether design parameters were achieved. Effectiveness monitoring requires development of clearly articulated objectives and identification of informative indicators. One approach is to monitor changes in habitat resulting from the restoration activity (for example, whether expected changes in riparian vegetation occurred after installation of cattle-exclusion fences and planting of native willows). Ideally, monitoring also would include indicators of wildlife response (for example, did the removal of junipers in sagebrush steppe habitat increase the number of sage grouse leks?) (Block and others, 2001). Regarding restoration projects that involve private landowners, Lewis and others (2009) recognized that effectiveness monitoring can occur at a wide range of precision and effort levels depending on the availability and duration of funding as well as project-specific information needs. Phases of monitoring are defined in table 1 to reflect this situation.
The accommodation of both qualitative and quantitative effectiveness monitoring in table 1 recognizes that statistically rigorous sample frames, quantitative measurements, and frequent revisits are not feasible for most restoration projects, nor are they always necessary to assess the effectiveness of the restoration action. Implementation and effectiveness determinations for habitat restoration projects are often visually obvious and do not require extensive quantitative measurements. This is especially true when projects attempt to change a targeted habitat parameter by 50 percent or more (Kocher and Harris, 2005). Moreover, qualitative monitoring is able to identify a broad range of concerns that might not be detected by a more narrowly focused quantitative approach (Lewis and others, 2009). However, quantitative monitoring provides objective data that is less subject to varying interpretations of project results (Lewis and others, 2009). Consequently, both qualitative and quantitative monitoring have their place and purpose and can be complementary to each other.

Introduction 3
Table 1. Definitions of monitoring phases.
[Data from Lewis and others (2009)]
Monitoring type Definition Example question
Pre-Project or Baseline Documentation of current site conditions andhow they support project selection and design.
What are the existing site conditions and thereasons for implementing a project at the site?
Implementation Monitoring to confirm that the project was implemented according to the approved designs, plans, and permits. Determining whether the agreed upon work was completed as planned.
Was the project installed according to designspecifications, permits, and funding landowner agreements?
Effectiveness Monitoring to assess post-project site conditions and to document changes resulting from the implemented projects. This is done through comparison with pre- project conditions to establish trends in the condition of resources at the site.
Did attributes and components at the project site change in magnitude as expected over the appropriate time frame?
Qualitative Effectiveness A type of effectiveness monitoring based on qualitative assessment of the degree of achievement of clearly stated objectives that are often visually obvious. Photograph point monitoring is a very useful qualitative technique.
Did canopy cover increase from 0 percent pre-project to 50 percent or greater at River Mile 13 during mid-July 5 years after fence installation?
Quantitative Effectiveness A type of effectiveness monitoring that is data-driven with rigorous sampling designs and assesses changes in project site characteristics.
Did a statistically significant change in canopy cover occur pre-project and 5-year post project using the Harris and others (2005) Line Intercept Transect protocol and the Flosi and others (1998) spherical densiometer protocol?
Validation Monitoring to confirm the cause and effect relationship between the project and biotic (wildlife) or physical (water quality) response. For example, this includes the change in use, presence, or abundance of desired salmon or migratory songbirds at the project site.
Did fish or wildlife populations increasein response to the changes in physical orbiological attributes or components broughtabout by the revegetation project?
Current Monitoring Requirements and Practices
Implementation and effectiveness monitoring are required components of the Partners Program (FWS Manual Chapter 640 1, 1.14) and are important for ensuring that program accomplishments reported in terms of acres/miles restored or enhanced are functioning as expected. The draft Coastal Program Manual Chapter also requires field staff to assess whether restoration projects have met their biological and partnership objectives. The Department of the Interior has issued an adaptive management policy to encourage the use of adaptive management as appropriate as a tool in managing lands and resources (522 DM 1). That policy calls for monitoring to advance scientific understanding and help adjust policies or operations as part of an iterative learning process. Moreover, all programs within the FWS are guided by the Strategic Habitat Conservation (SHC) framework. This framework calls for adaptive resource management and has been adopted by the FWS for making management decisions about where and how to efficiently deliver conservation to achieve specific biological outcomes. SHC is a way of thinking and of doing business that requires setting specific biological objectives, making strategic
decisions, and encouraging FWS biologists and managers to constantly reassess and improve habitat conservation actions (U.S. Fish and Wildlife and U.S. Geological Survey, 2006). SHC promotes monitoring to evaluate assumptions made in population-habitat models and decision support tools, habitat responses to conservation actions, population responses to conservation actions, and progress toward habitat and population objectives.
In practice, implementation monitoring is routinely conducted during the early phase of the Region 1 Partners and Coastal restoration projects, but management or maintenance actions are rarely monitored after the project is in place. Effectiveness monitoring is currently conducted by partners (Universities, non-governmental organizations, etc.) for several Partners and Coastal habitat restoration projects each year; however, it is conducted inconsistently by project type or even within individual field offices. Restoration objectives are often inadequately defined leading to ambiguity as to whether a project was successful when follow-up visits are made. In addition, no mechanism exists for reporting conclusions. Consequently results are often anecdotal and the opportunity for outcomes of past projects to guide planning for new projects is lost.

4 Monitoring Habitat Restoration Projects
Improved Monitoring Approach
Future monitoring of Region 1 Partners Program and Coastal Program projects will make use of the fact that together these programs implement an average of 120 projects every year. Although each project is unique, each also is a replicate of a habitat class (shoreline, riparian corridor, stream channel, etc.), treatment (fencing, dike removal, prescribed grazing, culvert modification, etc.), and ecological classification (Temperate Pacific Tidal Salt and Brackish Marsh, North Pacific Lowland Mixed Hardwood-Conifer Forest, Columbia Plateau Low Sagebrush Steppe). Standardized monitoring information can be summarized by these categories to draw conclusions regarding the efficacy of various treatments within habitat classes and/or ecological classifications to achieve specific goals. Example conclusions might include determining that riparian fencing projects have higher success rates in one area than another. Perhaps assumptions about shade from willow saplings inhibiting invasive plants in riparian areas over time are valid in some areas and less so in others. Maybe culverts established according to the guidelines of one state are more successful than those using guidelines from other states. All of these conclusions can lead to further questions (why are riparian fencing projects more successful in some areas?) and closer examination of project records; or to changes in practices (more intensive follow-up required for invasive plant eradication projects during the first 4 years of initial treatment), ultimately resulting in more successful projects. Systematic monitoring will facilitate institutional learning for both Partners Program and Coastal Program biologists and partners’ restoration staff.
Recognizing the potential value of a monitoring program for Partners Program and Coastal Program projects, this monitoring approach was designed to address several constraints. One constraint is that the diverse ecoregions, habitat types, and partnership base within the Pacific Region and the uniqueness of each project means that projects are not completely comparable. Projects also range widely in size and FWS involvement and monitoring efforts should be scaled accordingly. However, the primary constraint is the lack of resources for monitoring in general. Staff time and/or project funds spent on monitoring represent an opportunity lost for implementing projects. This has negative consequences for Bureau-wide performance reporting metrics and future funding allocations.
The monitoring approach for the Region 1 Partners Program and Coastal Program addresses these constraints while maximizing the potential benefits afforded by monitoring efforts. To minimize the cost in time and money to assess project success, the program allows for the use of qualitative information when quantitative data would be prohibitive. To insure that the assessment is justified
and repeatable by any evaluator, the protocol calls for clear, explicit objectives described in terms of specific, observable indicators, which are supported by photographic documentation when possible. In recognition that some habitat objectives may take time to achieve (for example, tree establishment requires years), objectives are developed for different time frames of the project so that progress is compared with a realistic goal. To minimize time requirements and maximize travel efficiencies, the revisit schedule can be tailored to each project. Data entry requirements are minimized and data analysis facilitated by using the FWS’s Habitat Information Tracking System (HabITS) national accomplishment database and requiring that only a few new fields be entered. Although this approach may be expanded in the future, at present it represents a first step towards a robust monitoring program with the potential to provide some program accountability for biological outcomes and a basis for adapting restoration methods. This approach will fulfill FWS policy requirements and is consistent with the SHC principle of reassessing and improving habitat conservation actions.
A key component for any successful monitoring effort is the identification of clear objectives (Noon and others, 1999; Niemi and McDonald, 2004). Without clear objectives, it is difficult to choose effective indicators. Purposes of defining objectives for restoration projects include:
• Focus and sharpen thinking about the desired state or condition of the restored habitat;
• Describe to others the desired condition of the restored habitat;
• Provide a measure of restoration success (Elzinga and others, 1998); and
• Provide direction for the appropriate type of monitoring.
As explained in SOP 2: Effectiveness Assessments, this protocol requires that Specific, Measurable, Achievable, Relevant, and Time bound (SMART; Doran, 1981) objectives be established for most habitat restoration projects.
Although rigorous, quantitative effectiveness monitoring is beyond the capability of the Partners Program and Coastal Program, such monitoring is sometimes conducted by other partners and agencies. These data will be acquired, archived, and used whenever possible. It also is important that restoration projects be considered in the larger context of other initiatives that may be conducting effectiveness monitoring. One example of such an effort is the Intensively Monitored Watersheds effort funded by Pacific States Marine Fish Commission in Idaho, Washington, and Oregon, to determine if the collective effect of restoration and/or management actions result in an improved watershed condition or population parameter of interest. Another example is the Integrated Status and Effectiveness Monitoring Project funded by the Bonneville Power Administration to assess the status of

Introduction 5
anadromous salmonid populations, their tributary habitat and restoration and management actions on a subbasin-scale in the Wenatchee River, John Day River, and Salmon River basins. Region 1 Partners Program and Coastal Program staff will work with their partners and other FWS programs and strive to have Partners and Coastal projects be part of these larger-scale validation or outcome-based monitoring efforts, especially those that are SHC or Landscape Conservation Cooperative efforts.
The Partners Program and Coastal Program also intend to use information from effectiveness assessments to identify and prioritize restoration techniques and project types needing a more quantitative or robust approach. Working with partners, including other FWS Programs, Partners and Coastal program staff would then implement a rigorous sampling design, such as before-after-control-impact paired series (BACIPS, Stewart-Oaten and others, 1986), on a subset of funded projects to increase scientific knowledge on the effects of restoration actions on habitat characteristics in key habitat types. In summary, the overall goals for this monitoring protocol are to:
1. Identify specific measurable objectives for each project prior to project implementation;
2. Assess whether projects were implemented as intended;
3. Assess whether accomplishment-specific objectives were achieved;
4. Standardize the reporting of monitoring results;
5. Enable staff to learn from each project and thereby improve implementation of future projects;
6. Identify information and research needs; and
7. Incorporate select individual Partners and Coastal Projects in larger scale validation or population-response response monitoring efforts.
Protocol Components
This monitoring protocol includes three components that will help meet the above goals: 1. An optional implementation data sheet to track
project implementation, landowner satisfaction, and landowner compliance with the project agreement (SOP 1: Monitoring Project Implementation) for offices that do not already have a standardized implementation monitoring protocol in place.
2. An effectiveness assessment data sheet to assess progress toward meeting the specific biological and/or physical objectives established for the project (SOP 2: Effectiveness Assessments), and
3. Guidance and data sheets for collecting and documenting digital images to substantiate assessments of project success for indicators that can be illustrated with photographs (SOP 3: Taking Images for Documentation of Restoration Projects).Accomplishments are defined by HabITS protocols
and for purposes of this document, accomplishments consist of wetland and upland acres that were enhanced, created, or restored; riparian and instream miles that were enhanced or restored; and fish passage barriers that were removed or modified. Each project consists of one or more accomplishments. For example, a project designed to manage cattle grazing may have both an upland and a riparian accomplishment. Implementation monitoring will be conducted for all Partners Program and Coastal Program restoration projects as described in SOP 1: Monitoring Project Implementation, or in accordance with existing office procedures and protocols. Effectiveness assessments will be conducted for a subset of restoration project accomplishments when Partners of Coastal Program biologists play a key role in the project design or implementation, and/or when the Partners or Coastal Program provides 50 percent or more of the project funding. Effectiveness assessments may be based on qualitative observations made by Partners or Coastal Program Staff or on quantitative data collected by partners and will be reported as described in SOP 2: Effectiveness Assessments. Annual guidance will be provided by the FWS’s Pacific Regional Office on the number and types of effectiveness assessments that will be undertaken each year.
Protocol Implementation
Information on how all objectives of this protocol will be accomplished is given in table 2.
Reporting
All Partners Program and Coastal Program projects are recorded in the national database, HabITS. The current HabITS monitoring section consists of a narrative field and a field for recording the date of the visit. Fields to address the following information needs will be added to HabITS to allow for queries of the various monitoring efforts by habitat type, restoration technique, various spatial scales, or other category. 1. Are maintenance activities occurring as needed to
sustain the project? (for example, is riparian fencing being maintained by landowner, are water levels being managed per project plan, etc.): NA (all natural processes, no management necessary), Yes or No (if no, explain proposed remedy in existing narrative field).

6 Monitoring Habitat Restoration Projects
2. Are landowner objectives being met? (for example, landowner objective may be enhancing his view, whereas biological objective may be to change plant composition and structure to a more natural state), Yes or No (if no, explain proposed remedy in existing narrative field).
3. Are species objectives being met? NA (no project-specific species monitoring occurring), Yes or No (indicate source of information – landowner observation, state agency report, etc. in existing narrative field and upload available documentation into HabITS).
4. Visit assessment result: Fully, Mostly, Partially, or Not Successful. This determination should be based on whether specified measurable objectives specified at project onset are being accomplished. Results should be substantiated by photographs, data, and/or monitoring reports from partners (uploaded as attachments). Upload effectiveness assessment generated for SOP 2: Effectiveness Assessments into HabITS.
5. Source of results: Qualitative Assessments or Quantitative Data (indicate if qualitative assessments or quantitative data were used to support the assessment result reported in item 4).
Schedule and Purpose of Visits
Partners Program projects typically consist of a project and an agreement phase. The project phase is when the “dirt work” is underway, for example, the culvert is being replaced, dikes are being breached, fencing is being installed, or plants are being planted. The project phase can last from several weeks to several years. Implementation monitoring occurs during the project phase.
The agreement phase refers to a signed agreement with private landowners that they will not intentionally compromise the integrity of the restoration site for a minimum of 10 years. Depending on the project and the agreement terms, the landowner may commit to conduct some maintenance of the restoration project during the agreement phase (for example, manage water levels, maintain fencing, control weeds, etc.). Effectiveness assessments occur during the agreement phase. Coastal Program projects may occur on Federal and State lands and do not always have landowner agreements associated with them. Coastal Program biologists therefore have additional flexibility when determining the appropriate duration for effectiveness monitoring. Both Partners and Coastal Program biologists are encouraged to conduct long-term effectiveness monitoring and should consider including provisions for such when negotiating agreement documents.
Table 2. Steps taken to achieve protocol objectives.
Protocol objective Means to achieve objective
1. Assess whether projects were implemented as intended.
Use of SOP 1: Monitoring Project Implementation or office-specific tool for implementation monitoring.
2. Define objectives for each project Use of SOP 2: Effectiveness Assessments to develop SMART objectives. 3. Assess if accomplishment – project specific
objective(s) were achieved.Use SOP 2: Effectiveness Assessments for effectiveness, assessments, use SOP 3: Taking Images for Documentation of Restoration Projects for substantiating assessments and documenting digital images, and/or use partner’s quantitative data.
4. Standardize effectiveness monitoring and assessment reporting.
Upload monitoring results in HabITS as specified in section, “Reporting.”
5. Enable staff to learn from projects and improve implementation of future projects.
Run monitoring queries in HabITS by habitat type, restoration technique, ecoregion, etc., discuss results at annual Regional Partners and Coastal Program biologist’s workshops.
6. Identify information and research needs. Use information from Workshops and HabITS (described above) to identify projects needing more rigorous effectiveness monitoring, potentially including quantitative studies.
7. Incorporate subset of individual Partners and Coastal projects in larger scale biological response monitoring efforts as appropriate.
Work with partners to identify opportunities to participate in more rigorous effectiveness monitoring efforts. Strive to be engaged in at least one validationor population response monitoring effort for each Focus Area by 2012.

Introduction 7
This protocol balances the costs of a strict revisit schedule, involving both travel and staff time, against the need for timely information by allowing revisits be made at frequencies most suitable for the project, and providing for flexibility to combine monitoring site visits with needs for other projects that are in the same area. Figure 1 displays a timeline for a typical Partners Program monitoring visit schedule.
Over the project duration, staff should visit each project site a minimum of three times according to the general monitoring schedule listed below. 1. Baseline – (Pre-project, required): Prior to this visit,
Partners Program or Coastal Program biologists will have determined if quantitative effectiveness data will be collected by and/or with partners, or whether qualitative effectiveness assessments will be conducted by Partners Program or Coastal Program biologists. At this visit, project staff (and partners if appropriate) will document baseline conditions and identify indicators to support future assessment of project objectives. Examples of indicators include qualitative assessment of percent native vegetation, presence or absence of fish passage barriers, and/or the documentation of the presence or absence of target species, as appropriate. Specific information to be documented is dependent on the determination of those pertinent factors that can be reasonably measured and are needed to address the project objectives. Future monitoring likely will be based on additional indicators, anecdotal evidence, and unforeseen developments; but this process will ensure that some minimal baseline information is collected for each habitat restoration objective. Some indicators will be amenable to photographic documentation, either using permanent or opportunistic photographs. If photograph points are desired and permanent marking is permitted by the landowner, markers should be installed. Otherwise,
careful documentation of camera and photograph locations will have to be sufficient for re-locating the points. Project staff also will determine the monitoring frequency for mid-agreement visits (see item 4 below).
2. Implementation (Mid-project, optional): This visit primarily will address project implementation issues. These include checking and documenting the status (for example, active, on schedule, complete) of all project activities described in the project agreement scope of work; ensuring that the landowner and other partners have carried out their responsibilities (technical or financial) as stated in the agreement; assessing whether the landowner and/or contractor(s) have technical or other issues that need resolving; and documenting and tracking the resolution of each. Photograph documentation may be useful. The Partners or Coastal Program biologist has the discretion to determine if this visit is needed for general project management purposes. In some cases, the Partners or Coastal Program biologist may be on-site every day or every phase of project implementation, whereas others may be less involved.
3. Implementation (Post-project, required): This visit should occur immediately following scheduled completion of project activities or shortly thereafter and will primarily address project implementation elements. For projects with quickly realized results, such as fish passage improvement projects, it may be appropriate to address effectiveness monitoring at this time. This may involve taking repeat or opportunistic photographs.
4. Progress Assessment (Mid-agreement, optional or multiple): The frequency and number of mid-agreement visit(s) is project specific, and will be determined by the project biologist. Factors affecting the frequency of mid-agreement visits are described in the Risk Urgency Matrix for Determining Frequency of Mid-Agreement
Figure 1. Timeline of typical Partners Program project visit schedule.
1 2 3 4 5 6 7 8 9 10
BaselineVisit
Optional Mid-Project
Visit
Post-Project
Visit
Optional Progress
Assessment
Optional Progress
Assessment
Final Assessment
Agreement Phase (Effectiveness Assessment)
Year
Project Phase (Implementation Monitoring)

8 Monitoring Habitat Restoration Projects
Visits (fig. 2). For example, a project designed to restore natural processes may only need one mid-agreement visit, perhaps after a significant weather event to ensure it remains a self-sustaining action. Whereas a meadow restoration project is better served by frequent repeated visits during the first 2 years after planting to control invasive plants and ensure adequate watering. Mid-agreement visits may address both implementation and effectiveness monitoring. If the agreement included specific habitat maintenance responsibilities for the landowner and/or the FWS, the Partners or Coastal Program biologist will need to determine if these implementation responsibilities are being carried out as specified in the agreement, evaluate and document whether the implementation and/or maintenance practices are achieving the desired results, and develop recommendations to resolve issues as appropriate. The
effectiveness of the project also will be assessed by documenting the current status of indicators for judging each objective as well as any other pertinent data. This may involve taking repeat or opportunistic photographs.
5. Final Assessment – (End-of-Agreement, required): Implementation and effectiveness monitoring elements should be evaluated as described for the mid-agreement visit. In addition, in the notes section of the final data sheet, the FWS biologist should develop project conclusions based on all project information collected and evaluated throughout the life of the project. For example, what went well with this project, what did not go well, and why? What are the documented benefits of this project to Federal trust resources? What are the additional data needs? What should be avoided and/or recommended in future projects? Is the landowner likely to keep the project in place after the agreement expires?
HIGH RISK LOW URGENCY
Post-ProjectMid-Agreement
End of Agreement
HIGH RISK HIGH URGENCY
Post-ProjectMultiple Mid-Agreement
End of Agreement
MEDIUM RISK MEDIUM URGENCY
Post-ProjectMid-Agreement
End of Agreement
LOW RISK LOW URGENCY
Post-ProjectEnd of Agreement
LOW RISK HIGH URGENCY
Post-ProjectMultiple Mid-Agreement
End of Agreement
Low Medium High
Low
M
ediu
m
Hig
h
Urgency of Action
Potential to CorrectPotential for Outside Factors to Affect Project Success
Significance of Failure
High
High
High
Low
Low
Low
Risk
of F
ailu
re
Com
plex
ityTe
chni
que
Area
Com
plex
New
Sim
ple
Esta
blish
edFa
milia
r
Partn
erFa
milia
rNe
w
New
Figure 2. Risk Urgency Matrix for determining frequency of mid-agreement visits.

References Cited 9
References Cited
Bash, J.S., and Ryan, C.M., 2002, Stream restoration and enhancement projects: is anyone monitoring? Environmental Management, v. 29, p. 877-885.
Bernhardt, E.S., Palmer, M.A., Allan, J.D., Alexander, G., Barnas, K., Brooks, S., Carr, J., Clayton, S., Dahm, C., Follstad-Shah, J., Galat, D., Gloss, S., Goodwin, P., Hart, D., Hassett, B., Jenkinson, R., Katz, S., Kondolf, G.M., Lake, P.S., Lave, R., Meyer, J.L., O’Donnell, T.K., Pagano, L., Powell, B., and Sudduth, E., 2005, Synthesizing U.S. river restoration efforts: Science, v. 308, no. 5722, p. 636-637, doi:10.1126/science.1109769.
Block, W.M., Franklin, A.B., Ward Jr., J.P., Ganey, J.L., and White, G.C., 2001, Design and implementation of monitoring studies to evaluate the success of ecological restoration on wildlife: Restoration Ecology, v. 9, issue 3, p. 293-303, doi:10.1046/j.1526-100x.2001.009003293.x.
Busch, D.E., and Trexler, J.C., 2003, The importance of monitoring in regional ecosystem initiatives, in Busch, D.E., and Trexler, J.C., eds., Monitoring ecosystems: Interdisciplinary approaches for evaluating ecoregional initiatives: Island Press, Washington D.C., p. 1-23.
Doran, G.T., 1981, “There’s a S.M.A.R.T. way to write management goals and objectives”: Management Review, v. 70, no. 11, p. 35-36.
Elzinga, C.L., Salzer, D.W., and Willoughby, J.W., 1998, Measuring and monitoring plant populations: Bureau of Land Management, Technical Reference 1730-1, BLM/RS/ST-98/005+1730.
Flosi, G., Downie, S., Hopelain, J., Bird, M., Coey, R., and Collings, B., 1998, California salmonid stream habitat restoration manual, 3rd ed.: California Department of Fish and Game Website, accessed January 28, 2011, at http://www.dfg.ca.gov/fish/Resources/HabitatManual.asp.
Harris, R.R., Kocher, S.D., Gerstein, J.M., and Olson, C., 2005, Monitoring the effectiveness of riparian vegetation restoration: University of California Center for Forestry, accessed January 28, 2011, at http://forestry.berkeley.edu/comp_proj/DFG/Monitoring%20the%20Effectivenes%20of%20Riparian%20Vegetation%20Restorat.pdf.
Kocher, S.D., and Harris, R.R., 2005, Qualitative monitoring of fisheries habitat restoration: University of California, Center for Forestry, Berkeley, California, 166 p.
Kondolf, G.M., 1996, A cross section of stream channel restoration: Journal of Soil and Water Conservation March-April 1996, p. 119-125.
Lewis, D., Lennox, M., and Nossaman, S., 2009, Developing a monitoring program for riparian riparian revegetation projects: University of California Division of Agriculture and Natural Resources, accessed February 1, 2011, at http://www.ucanr.org/freepubs/docs/8363.pdf.
Morrison, M.L., and Marcot, B.G., 1995, An evaluation of resource inventory and monitoring program used in national forest planning: Environmental Management, v. 19, p. 147-156.
Niemi, G.J., and McDonald, M.E., 2004, Application of ecological indicators: Annual Review of Ecological and Evolutionary Systems, v. 35, p. 89-111.
Noon, B.R, Spies, T.A., and Raphael, M.G., 1999, Conceptual basis for designing an effectiveness monitoring program, in Mulder, B.S., Noon, B.R., Spies, T.A., Raphael, M.G., Palmer, C.J., Olsen, A.R., Reeves, G.H., and Welsh, H.H., technical coordinators, The strategy and design of the effectiveness monitoring program for the Northwest Forest Plan. Portland, OR: U.S. Forest Service, Pacific Northwest Research Station, General Technical Report PNW-GTR-437, p. 49-68.
Palmer, C.J., 2003, Approaches to quality assurance and information management for regional ecological monitoring programs, in Busch, D.E., and Trexler, J.C., eds., Monitoring ecosystems: interdisciplinary approaches for evaluating ecoregional initiatives: Island Press, Washington D.C., p. 211-226.
Stewart-Oaten, A., Murdoch, W.W., and Parker, K.R., 1986, Environmental impact assessment—pseudoreplication in time?: Ecology, v. 67, p. 929-940.
U.S. Fish and Wildlife Service, 2010, Pacific Region Partners for Fish and Wildlife Program and Coastal Program Strategic Plan, July 2010 Update: U.S. Fish and Wildlife Service, Portland, Oregon, 146 p.
U.S. Fish and Wildlife Service, 2008, U.S. Fish and Wildlife Service, Strategic Habitat Conservation Handbook, A Guide to Implementing the Technical Elements of Strategic Habitat Conservation (Version 0), 22 p.
U.S. Fish and Wildlife Service and U.S. Geological Survey, 2006, U.S. Fish and Wildlife Service and U.S. Geological Survey, Strategic Habitat Conservation: Final Report of the National Ecological Assessment Team, 46 p.

10 Monitoring Habitat Restoration Projects
This page left intentionally blank

SOP 1: Monitoring Project Implementation (Optional) 11
Monitoring Habitat Restoration Projects: U.S. Fish and Wildlife Pacific Region Partners for Fish & Wildlife Program and Coastal Program Protocol
Preface
Most of the information on this data sheet will be tracked at the field station level and is a function of the Partners Program and Coastal Program biologists project management responsibilities. Field stations that do not have an established system for tracking project implementation milestones are encouraged to use this data sheet. Field stations that already have an established process for obtaining and recording project implementation information may choose to continue using those processes provided they capture the information within this SOP. Maintenance activities that affect project success (for example, fence maintenance or continued control of invasive plant species) have been added to the Effectiveness Assessments data sheet (see SOP 2: Effectiveness Assessments).
Introduction
This SOP provides direction for completing the data sheet “Implementation Monitoring” (fig. 1.1). This information documents the implementation of the project and compliance of landowner, cooperator, and other partner actions called for in the project agreement. It is meant to be conducted prior to project implementation, mid-point during project implementation (if appropriate), at the end of project implementation, one or more mid-points during the agreement (if appropriate), and at the end of agreement. It is meant to be completed concurrently with the Effectiveness Assessments data sheet (SOP 2) at the post-project, mid-agreement, and end of agreement project stages. The field data form can be created from the template (fig. 1.1).
Data sheets should be copied or scanned upon returning from the field and copies should be stored separately from the originals.
Project Information
Project Name: Enter the project name as entered in “Project Name” field of HabITS.
Accomplishment Name: Enter the accomplishment name(s) as entered in HabITS.
HabITS Project ID Number: Enter the project number as assigned by HabITS.
Landowner/Partner name(s): Enter the names of landowners and/or partners who should be contacted to arrange the site visit.
Landowner/Partner phone: Phone number(s) for contacting landowners and/or partners prior to the site visit.
Landowner Objectives: Describe the landowner’s objectives for entering into a habitat restoration project with the FWS. In some cases, the landowner’s objectives are the same as the FWS’s objectives (increasing net area of wetland, or promoting native vegetation structure, composition, and diversity), but in other cases, the landowner objectives may be different. For example, the FWS may have an objective of increasing fish passage while the landowner’s objectives are to first protect their water rights, and help improve fish passage provided it does not interfere with irrigation. The FWS may have a primary objective of restoring amphibian habitat, whereas the landowner’s objective may be more focused on winter waterfowl food production. Other landowners may be willing to allow for riparian restoration projects, provided their primary objective of maintaining their view of the river is met. It is important to identify the landowner objectives prior to entering into any agreement with them, and then continue to track progress toward meeting that landowner objective throughout the agreement. If the landowner objectives are not being met, it is unlikely the project will persist into the future.
Standard Operating Procedure (SOP) 1:
Monitoring Project Implementation (Optional)
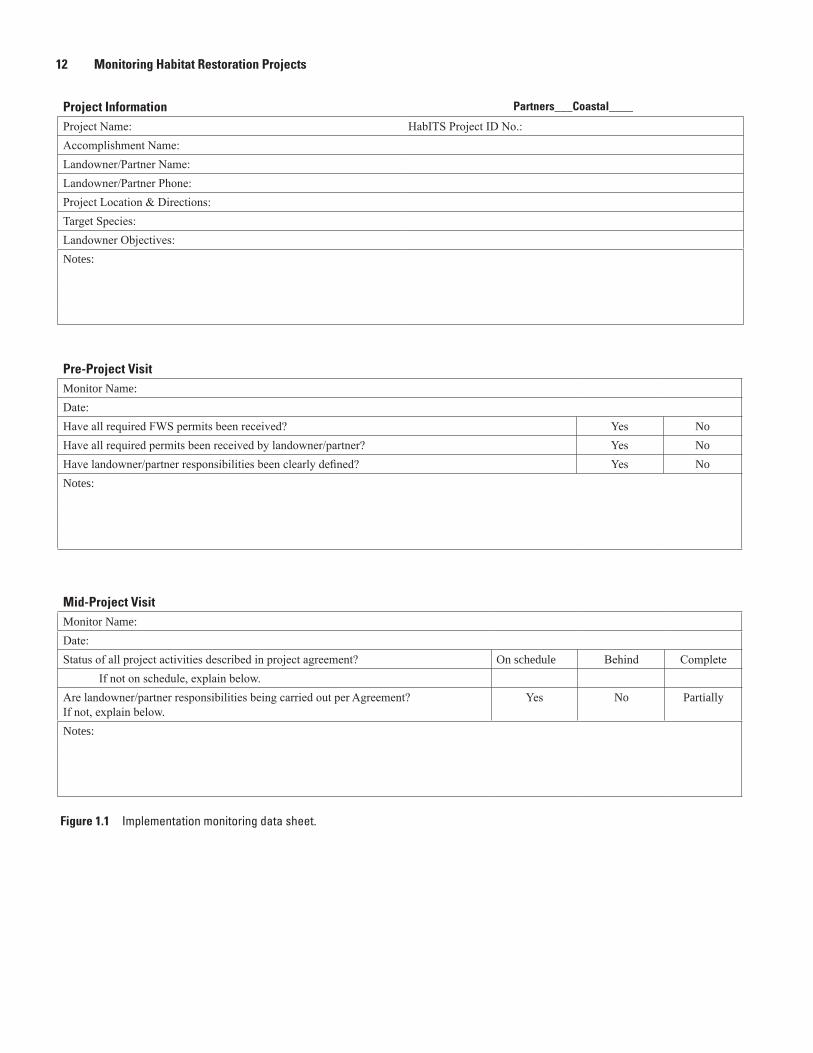
12 Monitoring Habitat Restoration Projects
Project Information Partners___Coastal____
Project Name: HabITS Project ID No.:Accomplishment Name:Landowner/Partner Name:Landowner/Partner Phone:Project Location & Directions:Target Species:Landowner Objectives: Notes:
Pre-Project Visit Monitor Name:Date:Have all required FWS permits been received? Yes NoHave all required permits been received by landowner/partner? Yes NoHave landowner/partner responsibilities been clearly defined? Yes NoNotes:
Mid-Project Visit Monitor Name:Date:Status of all project activities described in project agreement? On schedule Behind Complete If not on schedule, explain below.Are landowner/partner responsibilities being carried out per Agreement? If not, explain below.
Yes No Partially
Notes:
Figure 1.1 Implementation monitoring data sheet.

SOP 1: Monitoring Project Implementation (Optional) 13
Post-Project Visit Monitor Name:Date:Status of all project activities described in project agreement? Behind Complete If not complete, explain below.Are landowner/partner responsibilities being carried out per Agreement? If not, explain below.
Yes No Partially
Are landowner objectives being met? If not, explain below. Yes NoWas project implementation successful? If not, explain below. Yes NoNotes:
Mid-Agreement Visit Monitor Name:
Date:
Are landowner/cooperator responsibilities being carried out per Agreement? If not, explain below.
Yes No Partially
Are landowner objectives being met? If not, explain below. Yes NoNotes:
End of Agreement Visit Monitor Name:
Date:
Were landowner/partner responsibilities carried out per Agreement?If not, explain below.
Yes No Partially
Were landowner objectives met? If not, explain below. Yes NoIs landowner likely to extend life of restoration action beyond the Agreement Termination date? If not, explain below.
Yes No
Notes: (What went well/did not go well with this project and why? What are the documented benefits of this project to Federal trust resources?What are the additional data needs? What should be avoided and/or recommended in future projects?)
Figure 1.1 Implementation monitoring data sheet—Continued.

14 Monitoring Habitat Restoration Projects
Pre-Project Visit
PURPOSE OF VISIT: Ensure that all permitting and compliance processes have been completed and that all participants understand their responsibilities. Date: Enter date of site visit.
Monitor name: First and last name of person(s) making site visit and evaluating the project.
FWS Program Permits: Ensure that all permitting and compliance processes that are the responsibility of the Partners or Coastal Programs have been completed.
Landowner/Partner Permits: Ensure that all permitting and compliance processes that are the responsibility of the landowner or other partners have been completed.
Partner Responsibilities: Ensure that the landowner and other partners clearly understand their responsibilities during project implementation and during the term of the agreement.
Mid-Project Visit
PURPOSE OF VISIT: Evaluate whether the project is on schedule, everyone is meeting their responsibilities and if not, issues are addressed. Status of Project Activities: Indicate if project
implementation is on schedule, behind schedule, or complete. If not on schedule, explain the issue in the notes section, and identify a plan for correction if appropriate.
Partner Responsibilities: Indicate if landowner and other partners are implementing their responsibilities called for in the agreement. If any entity is not carrying out their responsibility, identify the issue and identify a corrective remedy, including follow-up by the FWS.
Technical Issues: If landowner or other partner have technical issues needing resolution by the FWS, identify the issue and identify a corrective remedy, including follow-up by the FWS.
Post-Project Visit
PURPOSE OF VISIT: Determine whether project was implemented as planned and landowner is satisfied with the results. Partner Responsibilities: Indicate if landowner and
other partners have implemented all actions called for in the agreement at this time. Were all planned habitat improvement activities completed as planned? Were all planned technical and financial assistance contributions met by all partners as identified in the plan? If any entity is not carrying out their responsibility, identify the issue and identify a corrective remedy, including follow-up by the FWS.
Landowner Objectives: Indicate if landowner objectives are being met and if not, identify the issue and a corrective remedy if appropriate.
Mid-Agreement Visit
PURPOSE OF VISIT: The primary purpose of this visit is to ensure that landowner objectives are continuing to be met, and that any ongoing landowner/cooperator responsibilities are continuing to take place. For projects that require active management (manipulation of water levels, periodic control of invasive plants, repair of riparian fencing, etc.) partner responsibilities can be very important for achieving project objectives. However, in the context of projects designed to restore natural processes (connecting floodplain, removing roads, installing large wood, etc.) the ‘action’ is mostly front loaded and there are little or no specific partner management responsibilities that need to take place during the agreement.
End of Agreement Visit
PURPOSE OF VISIT: At this stage, the goal for monitoring is to continue documentation of landowner responsibility implementation, and to assess landowner satisfaction with how well their objectives were met. Determine whether the landowner is likely to extend the restoration action and/or continue implementing their responsibilities beyond the agreement termination date.
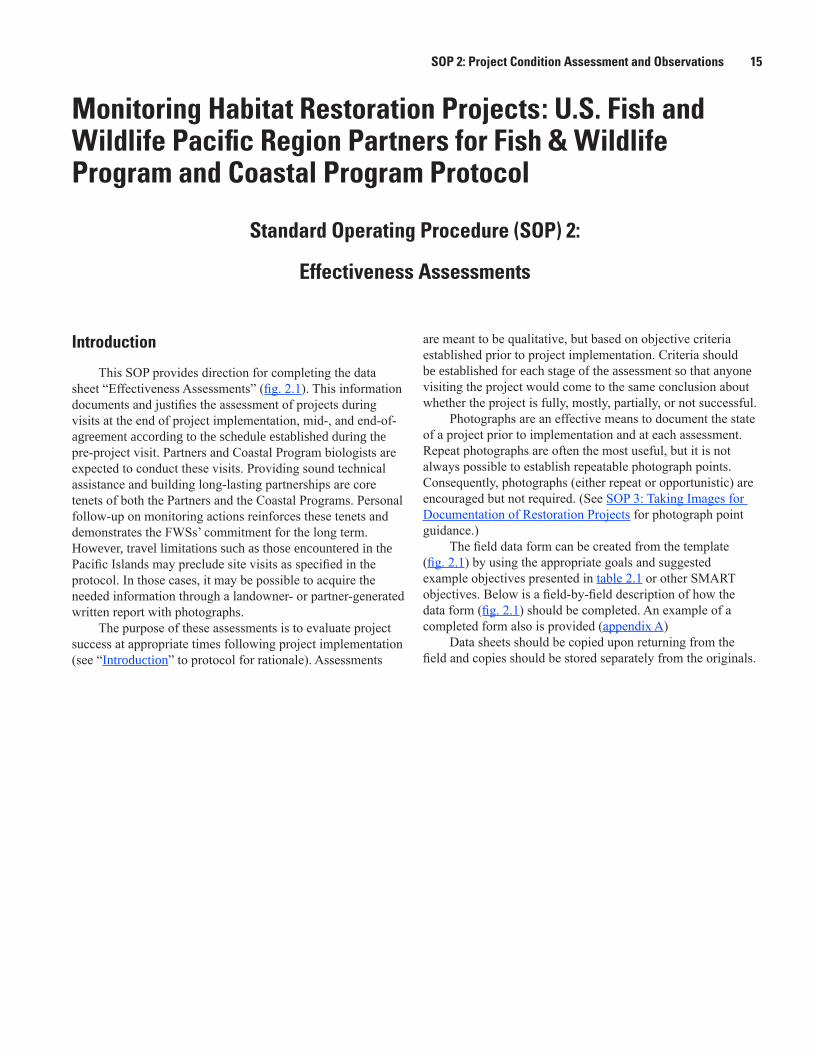
SOP 2: Project Condition Assessment and Observations 15
Monitoring Habitat Restoration Projects: U.S. Fish and Wildlife Pacific Region Partners for Fish & Wildlife Program and Coastal Program Protocol
Introduction
This SOP provides direction for completing the data sheet “Effectiveness Assessments” (fig. 2.1). This information documents and justifies the assessment of projects during visits at the end of project implementation, mid-, and end-of-agreement according to the schedule established during the pre-project visit. Partners and Coastal Program biologists are expected to conduct these visits. Providing sound technical assistance and building long-lasting partnerships are core tenets of both the Partners and the Coastal Programs. Personal follow-up on monitoring actions reinforces these tenets and demonstrates the FWSs’ commitment for the long term. However, travel limitations such as those encountered in the Pacific Islands may preclude site visits as specified in the protocol. In those cases, it may be possible to acquire the needed information through a landowner- or partner-generated written report with photographs.
The purpose of these assessments is to evaluate project success at appropriate times following project implementation (see “Introduction” to protocol for rationale). Assessments
are meant to be qualitative, but based on objective criteria established prior to project implementation. Criteria should be established for each stage of the assessment so that anyone visiting the project would come to the same conclusion about whether the project is fully, mostly, partially, or not successful.
Photographs are an effective means to document the state of a project prior to implementation and at each assessment. Repeat photographs are often the most useful, but it is not always possible to establish repeatable photograph points. Consequently, photographs (either repeat or opportunistic) are encouraged but not required. (See SOP 3: Taking Images for Documentation of Restoration Projects for photograph point guidance.)
The field data form can be created from the template (fig. 2.1) by using the appropriate goals and suggested example objectives presented in table 2.1 or other SMART objectives. Below is a field-by-field description of how the data form (fig. 2.1) should be completed. An example of a completed form also is provided (appendix A)
Data sheets should be copied upon returning from the field and copies should be stored separately from the originals.
Standard Operating Procedure (SOP) 2:
Effectiveness Assessments

16 Monitoring Habitat Restoration Projects
Figure 2.1. Effectiveness assessments.
EFFECTIVENESS ASSESSMENTS
Project name: Accomplishment name: HabITS Project ID No.: Were quantitative data collected?
Goal(s):
Potential barriers to success:
Landowner objective(s):
Species objective(s):
SMART objective: (No. ___ of ___)
Indicator(s) Pre-project conditions and photograph file names
Post-Project Conditions Mid-Agreement Conditions End of Agreement Conditions
Desired state during follow-up visits
Assessment tool(s)
Estimated state during follow-up:date of visit, description, photographfile names
Assessment results
Are species objectives being met?
Are landowner objectives being met?
Are maintenance activities occurring as needed?
Comments
Item to check next time* Blue fields will be reported in HabITS.

SOP 2: Effectiveness Assessments 17 17
Table 2.1 Example biological and physical goals with example objectives, indicators, and desired state of indicators through time that would indicate that the project is fully successful.
Illustrative goals with example objectives
Indicator Baseline Post-project Mid-agreement End agreement
Improve stream habitat
Example: Increase streamhabitat diversity by placingsufficient LWD to achievean abundance of A pieces/mi of B species andC diameter.
Pieces/mi B pieces/mi X pieces/mi No less thanY pieces/mi
No less thanZ pieces/mi
Example: Improve streamhabitat by excavating toreduce width/depth to A.
Width/depth W/D = B W/D = X W/D no more than Y
W/D no more than Z
Improve/restore fish passage
Example: Restore fishpassage by installing Adiameter culvert andremoving outlet drop.
Outlet drop B outlet drop 0 outlet drop No more than X cm outlet drop
Improve riparian habitat
Example: Reduce riparianplant species compositionfrom 90 percent non-nativeto 90 percent native byremoving invasives andplanting natives.
Plant composition Non-native blackberry and thistle dominant species (90–100 percent)
Blackberry and thistle cleared, native trees (spruce, hemlock, willow)and native shrubs (ninebark and twinberry) planted
Native trees and shrubs now dominant species with less than 10 percent non-native blackberry and thistle
Native trees and shrubs now dominant specieswith less than10 percent non-native blackberry and thistle
Example: Plant deciduousriparian trees to create A percent cover for stream shade during summer.
Cover after leaf-out B percent cover during summer
Too early to evaluate
At least Y percent cover during summer
At least Z percent cover during summer
Establish/promote native vegetation structure, composition and diversity in upland habitat
Example: Plant A treespecies to improve nestinghabitat for B bird species.
Survival of planting No plantings 99 percent survival Y percent survival of plantings
Z percent survival of plantings
Example: Maintain nativeplant community byremoving junipers.
Plant composition Initial stage of juniper infestation, native understory showing signs of stress
No juniper leftstanding
Dominantcommunity deeprooted perennials(big sagebrush,Idaho fescue,and bluebunchwheatgrass) withless than 10 percentannual grasses
Dominantcommunity deeprooted perennials(big sagebrush,Idaho fescue,and bluebunchwheatgrass) withless than 10 percentannual grasses
Example: Plant groundcover of A species toprevent erosion.
Survival of planting No plantings 95 percent survival Y percent survival of plantings
Z percent survival of plantings

18 Monitoring Habitat Restoration Projects
Table 2.1 Example biological and physical goals with example objectives, indicators, and desired state of indicators through time that would indicate that the project is fully successful.—Continued
Illustrative Goals with example objectives
Indicator Baseline Post-project Mid-agreement End agreement
Establish/promote native vegetation structure, composition, and diversity in wetland habitat
Example: Remove reedcanary grass from edge ofpond
Cover of invasive B m2 of invasive 0 m2 of invasive No more than X m2
of invasiveNo more than Y m2
of invasive
Establish/improve wetland size and/or hydrology
Example: Excavate pondof A depth and B surfacearea to create nesting habitatfor C species
Depth in mid-summer
No pond X m deep At least Y m deepin mid-summer
At least Z m deepin mid-summer
Improve/restore coral reef habitat
Example: Install buoylines to reduce coral reefdamage by boat anchors toless than 10 percent
Percent cover of freshly damaged corals within a 50-m radius of themooring buoy
No mooring buoyin place, more than 25 percent of coral cover within 50-m of the buoy arefreshly broken ordamaged
Mooring buoyin place; too earlyto see any beneficial effects
Mooring buoyintact; no freshlydamaged coralobserved within50-m of themooring buoy
Mooring buoyintact; less than10 percent of coral within 50-m radiusshow fresh anchordamage
Improve/restore coastal dunes
Example: Lower duneheight to allow for waveoverwash and facilitatecontrol of invasive beachgrass to create habitat forWestern snowy plover
Frequency ofoverwash
No over wash Too early toevaluate
Over wash at least1x per year
Over wash at least1x per year
Example: Mechanicallyremove European beachgrass from beach
Percent coverEuropean beachgrass
B percent cover 0 percent cover No more than 25 percent cover
No more than 25 percent cover

SOP 2: Effectiveness Assessments 19
Fields to Complete Prior to Assessments
This is a field-by-field explanation of how to complete the data sheet. If there is more than one goal appropriate for a project then additional data sheets should be completed for each additional goal. Project name: Enter the project name as entered in “Project
Name” field of HabITS.
Accomplishment name: Enter the accomplishment name as entered in “Accomplishment Name” field of HabITS.
HabITS Project ID No.: Enter the project number as entered in Project ID No. field of HabITS.
Were quantitative data collected: Enter yes or no. If quantitative data collected by a partner, enter source of data in comments field and upload report or data into HabITS.
Goal(s): Broadly state the biological goal [for example: Restore (fill in blank) type of habitat for (fill in blank)target species or group of species by (fill in blank) type of restoration treatment(s).] This information will provide context for future observers as they evaluate the project.
Potential barriers to success: Note any factors that you foresee as potential impediments to the project. These could be related to environmental factors (for example, field conditions prevented a culvert from being installed exactly according to specification, drought conditions could adversely affect plant survival), project design (for example, it involves a new technique), or any other factor that could influence project success. Identifying potential weaknesses may help identify effective indicators and it may enhance learning from the success or failure of the project.
Landowner(s) objective: In some cases, the landowner objectives may differ from those of the Partners and Coastal Programs. If this is true, describe the landowner’s objectives.
Species objective(s): This field provides an opportunity to state a species-related objective when appropriate. This objective may reflect the goals of another partner conducting quantitative monitoring. The objective also could be something as anecdotal as increased observations of a particular bird speies by the landowner.
SMART objective: ‘SMART’ refers to objectives that are Specific, Measurable, Achievable, Relevant, and Time bound. These are objectives that present a detailed description of the desired measurable results of a project at a given time following project implementation. Examples are given under each goal in table 2.1. Stating these objectives should lead directly to the identification of appropriate indicators. If the project includes more than one accomplishment, indicate which number this one is out of the total.
Indicator(s): Identify characteristics of the project that will be used as indicators to assess the condition or progress towards attainment of desired project conditions at each revisit. Be sure that indicators can be assessed at the times of year that the revisits are likely to happen (for example, do not include an indicator that can only be assessed in winter unless you expect to visit the project in winter). This list does not preclude using other characteristics if they become pertinent with time; the purpose for identifying indicators at this point is to insure that useful baseline data are noted before the project is implemented. More than one indicator can be used for each objective.
Pre-project conditions and photograph file names: Describe the state of the indicators prior to project implementation and provide file names for photographs used to document the situation.
Desired state during follow-up visits: For each of the required assessments (that is, post-project, end of agreement, and one or more mid-agreement visits) describe the condition of the indicators that would constitute project success. Be as quantitative as possible. (See appendix A for examples.)
Assessment tool(s): List the means by which you will acquire and document the condition of the indicator. These will most likely require a field visit (for example to estimate cover of plants or take photographs of changes). Some may involve some other means (for example, a telephone call to the landowner, or other partners).

20 Monitoring Habitat Restoration Projects
Fields to Complete for Each Assessment
Estimated state during follow-up: Indicate the date of the assessment, briefly describe the condition of each indicator and list file names of photograph files.
Assessment Results: Indicate whether the project is Fully, Mostly, Partially, or Not Successful based on the condition of the indicators developed for SMART objectives compared with the desired state for that assessment stage. (Landowner and species objectives are evaluated separately.) This is a subjective call, but it should be justified by evaluation of the indicators and substantiated by photographs or other data if possible. This could include data collected by other agencies. Guidelines for determining project condition follow:
• Fully: the project conditions have met or exceeded the desired state identified for this visit.
• Mostly: there are some minor deficiencies in meeting the desired state identified for this visit, but project condition is still satisfactory.
• Partially: there are some major deficiencies in meeting the desired state identified for this visit that may cause problems in the future. Remedial action may be required and is likely to occur.
• Not Successful: the desired state identified for this visit has not been met; remedial action is required to improve habitat conditions but is unlikely to occur; and/or the project is causing deleterious effects on the habitat.
Are species objectives being met?: A simple yes or no is sufficient (and indicate source of information). Responses may include NA (not appropriate for the project, not available because too soon to tell, or other reason).
Are landowner objectives being met? A simple yes or no is sufficient. If no, identify what is not being met and how it will be remedied or addressed.
Are maintenance activities that affect project success being accomplished? For those projects with commitments from landowners or others to meet obligations, are they being met? If not, clarification should be provided.
Comments: These fields are an opportunity to mention anything else noteworthy about the project or anything that might clarify or qualify the assessment results.
Items to check next time: Given that there may be many years between visits, note anything that the next observer should pay attention to in case it is a new observer, or the original observer has forgotten the details of the project.

SOP 3: Taking Photographic Images for Documentation of Restoration Projects 21
Monitoring Habitat Restoration Projects: U.S. Fish and Wildlife Pacific Region Partners for Fish & Wildlife Program and Coastal Program Protocol
Standard Operating Procedure (SOP) 3:
Taking Photographic Images for Documentation of Restoration Projects
Introduction
Fundamentally, the purpose of photo monitoring for Partners and Coastal Projects is to document conclusions about whether a project is fully, mostly, partially, or not successful. Photographs are one means whereby qualitative assessments can be validated as being repeatable by other observers. The literature contains many protocols and much guidance for conducting photo monitoring, some citations of which are found in the references section of this protocol. An especially useful reference with application to Partners and Coastal Projects is Shaff and others (2007).
Many of the rigorous aspects of formal photo monitoring protocols, such as permanently marked photo points, use of range poles for scale, and taking advantage of the quality of morning and evening light, will not be practical for all Partners and Coastal projects. However, some standards can be met:
• Using at least 2.3 mega-pixel image size.• Not aiming the camera into the sun.• Repeatable framing (including a feature, such as
a distinctive tree that can be used to relocate the photograph and that provides scale).
• Mapping camera points and photo subjects.• Using a naming convention for image files to enable
efficient archiving.
In this protocol, we will consider repeat and opportunistic photographs. Repeat photographs are taken of the same subject from approximately the same place during each visit. Photographs are an especially effective way to document changes through time. However, it will not always be possible to return to the same camera point, the subject may become obscured from the camera point over time, and/or unforeseen subjects may become important for documenting the condition of the project. In these cases, the use of opportunistic photographs may be appropriate. In the case of both repeat and opportunistic photographs, photo subjects should support evaluation of the indicators identified on the Effectiveness Assessments form (SOP 2). Examples of the types of photographs that can be used to document a variety of changes due to restoration projects are shown in table 3.1.
A minimal list of equipment required for photo monitoring is shown in table 3.2.

22 Monitoring Habitat Restoration Projects
Table 3.1. Guidelines for specific types of photo monitoring.
[Compiled from Shaff and others (2007) and Gerstein and Kocher (2005)]
Riparian Habitat/Streambank Stabilization Projects
Restoration Action Pre-project Photographs Post-project Photographs
Livestock fencing Photograph should capture representative streambank profiles prior to fencing.
Post-project photographs should show fencing, changes in vegetation and streambank erosion.
Riparian planting (planting survival/change in seral stage)
Pre-project photographs should capture future planting location before site preparation. From opposite bank where possible.
Post-project photographs should document changes in riparian vegetation.
Non-native plant management Pre-project photograph should capture area conditions prior to treatment. (Ensure photograph documents enough of conditions to detect visual change in the vegetation; that is, landscape photograph)
Post-project photographs include the identical area captured by the pre-treatment photograph.
Riparian planting (increased canopy cover; improved riparian corridor continuity and patch size)
Photographs taken from mid-channel of riparian vegetation on left bank, right bank, channel upstream, channel downstream and overhead.
Photographs at same location after treatment.
Properly installed streambank stabilization with preserved integrity
Photographs taken from opposite bank and mid-channel looking across channel to where treatment is to be placed.
Photographs taken from opposite bank and mid-channel looking across channel at the treatment. Photograph taken from the bank with the treatment looking down on the treatment.
Improved channel geometry, reduced bank erosion, increased riparian vegetation
Photographs of channel upstream and downstream of future treatment location. Photograph of channel at future treatment location from opposite bank.
Photographs of channel upstream and downstream of treatment. Photograph of channel at treatment location from opposite bank.
Wetland Habitat Projects
Restoration Action Pre-project Photographs Post-project Photographs
Reestablishment of wetland hydrology Photograph area in landscape style where hydrology will be restored. Make sure to retake photograph during same time during the growing season.
Photograph area in landscape style after hydrology is restored. Make sure to capture enough of the site to detect change post-project. Several years of repeat photography may illustrate project success better than one year post project.
Planting Pre-project photographs should capture the future planting location before site preparation.
After planting, take photographs that show changes in the vegetation structure. Several years of repeat photography may be more illustrative than one post-project year.
Non-native plant management Photograph area to be treated. Make sure you capture enough of the treatment area in the photograph to detect change in post project photographs.
Photograph area after the treatment is complete.
Instream Habitat Projects
Restoration Action Pre-project Photographs Post-project Photographs
Large wood/boulder placement Photographs taken from mid-channel looking upstream and downstream from each future structure location and photograph taken from either right or left bank looking down upon the future structure.
Photographs taken from mid-channel looking upstream and downstream from each structure location and photograph taken from either right or left bank looking down upon structure.
Increase in targeted habitat units (for example, pools, gravel bars)
Habitat at future location of each structure Habitat formed by each structure (pool, shelter, undercut banks, gravels, side channels, etc.)
Weirs/grade control Take pre-project photographs from mid-channel looking upstream and downstream from each structure location. Take more photographs from either bank looking down upon structure
Take post-project photographs from mid-channel looking upstream and downstream from each structure location. Take more photographs from either bank looking down upon structure
Bank stabilization Take pre-project photographs from the opposite bank and from mid-channel, looking across stream to future treatment location.
Take post-project photographs from the opposite bank and from mid-channel, looking across stream to treatment location.

SOP 3: Taking Photographic Images for Documentation of Restoration Projects 23
Fish Passage Improvement Projects
Restoration Action Pre-project photographs Post-project photographs
Installation of fish passage structure Photograph area where structure will be installed Photograph the functioning structureCulvert removal/replacement Take photographs immediately upstream and
downstream of culvert showing either existing impassable culvert or location of new culvert. Take more photographs from either bank looking down on structure. Take photographs looking towards channel upstream from project (for detection of channel incision), and downstream as well.
Take photographs immediately upstream and downstream of culvert showing either existing impassable culvert or location of new culvert. Take more photographs from either bank looking down on structure. Take photographs looking towards channel upstream from project (for detection of channel incision), and downstream as well. If replacement is a bridge or other “bottomless” feature, establish a representative place to photograph the streambed for evaluation of substrate persistence.
Stream crossing removal Take photographs showing the crossing to be removed from upstream, downstream and above. Take photographs looking towards channel upstream from project (for detection of channel incision), and downstream as well.
Take photographs showing the crossing to be removed, from upstream, downstream and above. Take photographs looking towards channel upstream from project (for detection of channel incision), and downstream as well.
Push-up dam removal Photograph the structure blocking fish passage and the available habitat above the barrier.
Take photographs showing that the area now passes fish.
Area of habitat made accessible Photograph conditions causing fish barrier. Photograph habitat above barrier
Photograph location of former barrier. Photograph habitat above former barrier.
Increased attraction flows (barrier modification)
Photograph of attraction flow at barrier during fish movement
Photograph of attraction flow at former barrier during fish movement.
Address incision, instability or sedimentation as a fish movement barrier
Photographs of channel conditions taken from mid channel upstream of barrier, downstream, and at barrier.
Photographs taken from mid-channel of channel upstream and downstream of former, and at former barrier.
Upland Habitat Restoration Projects
Restoration Action Pre-project Photographs Post-project Photographs
Juniper management Pre-project photographs (landscape level) should capture areas where juniper treatment will occur. Include ground so that vegetation reestablishment and reduction of sediment loss can be captured in post-project photographs.
Photographs at the same location after treatment. Landscape level.
Non-native plant management Pre-project, photograph (landscape level) area to be treated. Make sure to capture enough in the pre-project photographs to enable someone not familiar with the project to detect changes in the post-project photographs.
Photographs at the same location after treatment. Landscape level.
Grazing management Photograph area prior to change in use andimplementation of grazing management.
Photograph the same areas again in following years.
Forest stand composition Photograph site of future treatment. Make sure to show enough detail in the photograph to detect change post-project.
Photographs at same location after treatment.
Reduced barren ground/exposed soil Photographs of areas of bare ground/exposed soil. Appropriate scale will vary with site.
Photograph at same location after treatment.
Table 3.1. Guidelines for specific types of photo monitoring.—Continued
[Compiled from Shaff and others (2007) and Gerstein and Kocher (2005)]

24 Monitoring Habitat Restoration Projects
Table 3.2 Equipment List.
Copies of previous photos Data sheets o Photo Point Site Map o Photo Point Log Compass Digital camera with at least 2.3 mega-pixel image size
Optional: Maps o USGS quad showing Township-Range-Section of project location and surrounding area o Close-up detailed topo map to show photo point locations Photo identification labels (figure 3.X) Measuring tape (30 meters or 100 feet) GPS*
*Some cameras have built-in GPS units and would be extremely useful for photo monitoring.
Fence
Western
Hemlock Vinemaple
S a l m o n b e r r y
A
1
2X
X
XX
X
X
XX
Blackberry removed
1 1 m , 2 2 0 º
13
m,
10
º
1 0 m , 5 0 º
Opportunistic#1
Planted seedlings
N
Figure 3.1 Example of a sketch map of a project illustrating how to mark camera points, photo subjects, opportunistic photos and other features.

SOP 3: Taking Photographic Images for Documentation of Restoration Projects 25
Mapping Photographs
A map of the camera locations relative to the subject of photographs will facilitate repeating the photograph at a later date and will put each photograph in the context of the larger project. Maps can be made on Google Earth© images, topographic maps, or they can simply be sketches of the area (see fig. 3.1 for example).
The map should be attached to or drawn on the Photo Point Site Map (fig. 3.2). The project name and HabITS project number should be indicated. Because the map can be modified at each visit if photographs are taken from new locations, it also will be useful to indicate which visits are represented on each map. Camera locations are indicated with circled capital letters and the subject of the photographs are indicated with circled numbers. Arrows connecting camera locations with photograph subjects are annotated with measured or estimated distance and direction. More than one subject can be associated with each camera location. Also, it may be helpful to indicate distance and direction of camera locations from prominent objects. Locations of other features that give the map context (for example, fences, roads) may be indicated.
Details regarding the photographs and their purpose should be entered on the Photo Point Log (fig. 3.3). The project name, HabITS number, date, time of day, personnel, and the visit type should be noted. Each repeat photograph should be listed according to the camera location and subject number indicated on the map; opportunistic photograph subjects are numbered on the map. GPS locations can be entered if time allows and equipment if available. Some cameras have built in GPS units, and these would be ideal for this application. If a GPS is used, the appropriate datum should be recorded. Notes should be taken regarding the purpose of the photograph and anything else of interest (see fig. 3.4 for example describing the map in fig. 3.1). In case a label in the photograph is desired, a template is provided (fig. 3.5).
Labeling Photographs
It is important to download images immediately after returning from the field. Download the images as .tiff files if possible. Images should be given file names that use the naming convention:
Permanent photo point: • six digit date, month, year,
• HabITS project number,
• pp, camera point letter,
• two digit photo number, each separated by underscores, or DDMMYY_#######_ppA_##.tif.
For example, a file name could be 030609_123456_ppA_01.tif.
Opportunistic, feature and other photographs: • two digit year,
• project number,
• op, two digit photo number, each separated by underscores, or DDMMYY_#######_op##.tif.
For example, a file name could be 030609_123456_op03.tif.
Files will be stored per individual field station protocols and in HabITS. The HabITS project number will link the photograph to all other information regarding the project.

26 Monitoring Habitat Restoration Projects
Photo Point Site Map
Project Name ______________________ HabITS Project No. _________________
Completed Site Visits Pre-Project Mid-Project Post-Project Mid-Agreement End of Agreement
Map
Directions: Indicate camera locations with circled capital letters; indicate subject of photos with circled numbers corresponding to photo numbers on log; connect camera point with photo point with an arrow labeled with distance and direction; indicate ‘witness’ features and connect them to camera or photo points using lines labeled with distance and direction; indicate any other features (e.g., roads, fences, ridgelines, distinctive trees, etc.). Map should be copied and taken to the field for each site visits; new photos should be marked.
Figure 3.2. Photo Point Site Map data sheet. This should be copied and updated with each site visit.

SOP 3: Taking Photographic Images for Documentation of Restoration Projects 27
Photo Point Log
Project Name ________________________ HabITS No. _______________________
Date:_______________ Time:________________ Personnel_____________________
Visit: Pre-Project Mid-Project Post-Project Mid-Agreement End of Agreement
Permanent Photo Points (indicate on map)
GPS (if time allows)
Camera Location Subject No. Northing Easting Notes (purpose of photo, features, etc.)
Opportunistic Photo Points (indicate roughly on map)
GPS (if time allows)Photo No. Northing Easting Notes (purpose of photo, features, etc.)
Figure 3.3. Photo Point Log data sheet.

28 Monitoring Habitat Restoration Projects
Photo Point Log
Project Name _____________________ HabITS No. _____________________
Date:__________ Time:_____________ Personnel_____________
Visit: Pre-Project Mid-Project Post-Project Mid-Agreement End of Agreement
Permanent Photo Points (indicate on map)
GPS (if time allows)Camera Location
Subject No.
Northing Easting Notes (purpose of photo, features, etc.)
A 1 Document seedling survival
A 2 Document blackberry removal
GPS datum (if used) _NAD 83_______
Opportunistic Photo Points (indicate roughly on map)
GPS (if time allows)
Photo No. Northing Easting Notes (purpose of photo, features, etc.)1 Document mountain beaver damage to planted seedlings
GPS datum (if used) _______
Figure 3.4. Example Photo Point Log data sheet corresponding to map in figure 3.1.
X
Smith Place 123456
9/9/09 3 pm J.Smith

SOP 3: Taking Photographic Images for Documentation of Restoration Projects 29
DATE:TIME:PROJ. NO.:PHOTO PT. NO.:
Figure 3.5. Photo label (Hall, 2002).

30 Monitoring Habitat Restoration Projects
References
Adams, J., 1979, Gravel size analysis from photographs: Journal of the Hydraulics Division, Proceeding of the American Society of Civil Engineers, v. 105, no. HY10.
Bauer, S.B., and Burton, T.A., 1993, Monitoring protocols to evaluate water quality effects of grazing management on western rangeland streams. I: Establishing permanent photo points, EPA 910/R-93-017: Seattle, WA, U.S. Environmental Protection Agency, Region 10, p. 145-149.
Bormann, M.M., 1995, Photo monitoring: Corvallis, Oreg., The Grazier, Oregon State Extension Service, 282 (May), p. 2-6.
Bunte, K., and Abt, S.R., 2001, Sampling surface and subsurface particle-size distributions in wadeable gravel- and cobble-bed streams for analyses in sediment transport, hydraulics, and streambed monitoring: General Technical Report RMRS-GTR-74, Fort Collins, Colorado, U.S. Department of Agriculture, Forest Service, Rocky Mountain Research Station, 428 p.
Chan, S.S., McCreight, R.W., Walstad, J.D., and Spies, T.A., 1986, Evaluating forest vegetation with computerized analysis of fisheye photographs: Forest Service, v. 32, no. 4, p. 1085-1091.
Gerstein, J.M., and Kocher, S.D., 2005, Photographic monitoring of salmonid habitat restoration projects: Berkeley, California, University of California, Center for Forestry, 21 p. Available only online at http://forestry.berkeley.edu./comp/_proj/DFG/Photographic%20Monitoring%20of%20Salmonid%20Habitat%2020March%202005.pdf.
Gilvear, D., and Bryant, R., 2004, Analysis of aerial photography and other remotely sensed data, in Kondolf, M., and Piegay, H., eds., Tools in Fluvial Geomorphology: England, John Wiley and Sons Ltd., p. 135-171.
Hall, F.C., 2001, Ground-based photographic monitoring: General Technical Report PNW-GTR-503, Portland, Oregon, U.S. Department of Agriculture, Forest Service, Pacific Northwest Research Station, 340 p.
Hall, F.C., 2002, Photo point monitoring handbook: Part A – Field procedures: General Technical Report, PNW-GTR-526: Portland, Oregon, U.S. Department of Agriculture, Forest Service, Pacific Northwest Research Station, 48 p. Available online only at http://www.fs.fed.us/pnw/pubs/gtr526/.
Ibbeken, H., and Schleyer, R., 1986, Photo-sieving: A method for grain-size analysis of coarse-grained, unconsolidated bedding surfaces: Earth Surface Processes and Landforms, v. 11, p. 59-77.
Lewis, D.J., Tate, K.W., and Harper, J.M., 2000, Sediment delivery inventory and monitoring – A cethod for water quality management in rangeland watersheds: University of California Division of Agriculture and Natural Resources. Available online only at http://anrcatalog.ucdavis.edu/pdf/8014.pdf.
Lucey, W.P., and Barraclough, C.L., 2001, A user guide to photopoint monitoring techniques for riparian areas – Field test edition: Kimberely, B.C., Aqua-Tex Consulting Ltd., 90 p.
McDougald, N., Frost, B., and Dudley, D., 2003, Photo-monitoring for better land use planning and assessment: University of California Division of Agriculture and Natural Resources. Available online only at http://www.ucanr.org/freepubs/docs/8067.pdf.
Nader, G., DeLasaux, M., Delms, R., and others, 1995, “How to” monitor rangelands, Handbook Level-1: Alturas, California, University of California, Cooperative Extension Service, Modoc County, 44 p.
Oregon Watershed Enhancement Board, 1993, Photo plots: A guide to establishing points and taking photographs to monitor watershed projects: Salem, Oregon, Oregon Watershed Enhancement Board.
Peter, A., and Deboot, T., 1996, Using photos to monitor riparian areas: Riparian Restoration and Monitoring Workshop, April 30–May 3, 1996: La Grande, Oregon, Sponsored by Department of Rangeland Resources, Oregon State University.
Reid, L.M., and Dunne, T., 1996, Rapid evaluation of sediment budgets: Reiskirchen, Germany, Catena Verlag (GeoEcology paperback), 164 p.
Shaff, C., Reiher, J., and Campbell, J., 2007, OWEB guide to photopoint monitoring: Salem Oreg., OWEB, Available online only at http://www.oregon.gov/OWEB/docs/pubs/PhotoPoint_Monitoring_Doc_July2007.pdf.
Watershed Professionals Network, 1999, Oregon watershed assessment manual, Prepared for the Oregon Watershed Enhancement Board: Salem Oregon, Oregon Watershed Enhancement Board.
Whitman, M.S., Moran, E.H., and Ourso, R.T., 2003, Photographic techniques for characterizing streambed sediment: Transactions of the American Fisheries Society, v. 132, p. 605-610.
Glossary 31
Glossary
Accomplishment Means of reporting acres or miles of habitat that have been created, enhanced, or restored in the FWS’s national database, HabITS. Most often reported by habitat type associated with national performance measures, such as number of wetland acres restored or number of fish passage barriers removed. A restoration project may consist of one or more accomplishments. For example, a cattle management project may include restoring 30 acres of upland habitat, 0.25 mile of riparian habitat, and 0.5 acre of wetland habitat.Effectiveness Monitoring Used to determine whether the management activities are having the desired effect.Focus Area Geographic areas identified in the Partners Program and the Coastal Program Strategic Plans where the Programs will concentrate their habitat restoration efforts. Fully Successful The project conditions have met or exceeded the desired state identified for this visit.Implementation Monitoring Assessing whether management operations were conducted as planned. Mostly Successful There are some minor deficiencies in meeting the desired state identified for this visit, but project condition is still satisfactory. Not Successful The desired state identified for this visit has not been met; remedial action is required to improve habitat conditions but is unlikely to occur; and/or the project is causing deleterious effects on the habitat.
Partially Successful There are some major deficiencies in meeting the desired state identified for this visit that may cause problems in the future. Remedial action may be required and is likely to occur.Project Defined by the lead biologist and usually associated with a funding agreement, such as a cooperative agreement. A project can be a single site or piece of property that has a single accomplishment, it could be multiple sites that have multiple accomplishments on each site; or it could be multiple sites that have a single accomplishment happening on all sites. For example, a project may be removal of an invasive species from one property (one upland acre restoration accomplishment). Another project could have multiple discrete accomplishments within one property boundary working with one landowner (upland acre restoration, wetland acre enhancement, and fish passage barrier removal). Qualitative Effectiveness Monitoring Effectiveness monitoring conducted based on qualitative assessment of the degree of achievement of clearly stated objectives that are often visually obvious.Quantitative Effectiveness Monitoring Effectiveness monitoring that is data-driven with rigorous sampling designs and assesses changes in project site characteristics.Validation Monitoring Assesses the correctness of basic assumptions about how management actions will affect biological outcomes, often for the purpose of modeling.

32 Monitoring Habitat Restoration Projects
This page intentionally left blank.

Appendix A 33
Appendix A. Examples of Completed Effectiveness Assessment Datasheets
Example 1. Western Snowy Plover Coastal Dune Restoration EFFECTIVENESS ASSESSMENTS
Project name: Miller Dune Restoration HabITS Project ID No.: 8324 Were quantitative data collected? No
Goal(s): Restore coastal dune habitat for Western snowy plovers and pink sand verbena by lowering spit elevation to facilitate wave over wash and mechanically clear European beach grass
Potential barriers to success: Reestablishment of beachgrass and dune accretion
Landowner objective(s): Lower dune height to improve ocean view and restore coastal dune habitat
Species objective(s): Documented presence and nesting of WSP by annual ODFW surveys
SMART objective: Restore coastal dune habitat to maintain no more than 25 percent cover of European beach grass and allow for at least annual over wash after 10 years. (No. 1 of 1)
Indicator(s) Pre-project conditions and photograph file names
Amount of European beach grass; overwash frequency 90% European beach grass cover project site, see 08_8324_pp01_01.tif, 08_8324_pp01_02.tif, 08_8324_pp02_01.tif
Post-Project Conditions Mid-Agreement Conditions End of Agreement Conditions
Desired state during follow-up visits 0 percent European beach grass; too early to assess overwash
0–25 percent European beach grass; annual overwash
25 percent European beach grass; annual overwash
Assessment tool(s) Photographs per protocol/biologist BPJ Photographs per protocol/landowner interview for overwash frequency/biologist BPJ
Photographs per protocol/landowner interview for overwash frequency/biologist BPJ
Estimated state during follow-up: date of visit, description, photograph file names
Oct. 1, 2009: Excellent results with mechanical clearing, 0 percent European beach grass present: see 09_8324_pp01_01.tif, 09_8324_pp01_02.tif,09_8324_pp02_01.tif
Aug. 14, 2015: Excellent results still in place, less than 10 percent beach grass present, overwash occurring annually, see 15_8324_pp01_01.tif, 15_8324_pp01_02.tif, 15_8324_pp02_01.tif
Oct. 15, 2019: Evidence of dune accretion, beach grass covering approximately 50 percent of site, and overwash no longer occurring, see 19_8324_pp01_01.tif, 19_8324_pp1_02.tif, 19_8324_pp2_01.tif
Assessment results Fully Fully Not successful
Are species objectives being met? NA (too soon to tell) Yes, ODFW surveys confirm use by WSP No
Are landowner objectives being met? Yes Yes No
Are maintenance activities occurring as needed?
NA NA NA
Items to check next time
Comments None Good opportunity for follow-up project
* Blue fields will be reported in HabITS.

34 Monitoring Habitat Restoration Projects
Example 2. Jetson Ranch Riparian ProjectProject name: Jetson Ranch HabITS Project ID No.: 53935 Were quantitative data collected? No
Goal(s): Increase and improve wet meadow habitat by installing rock J-Hook vane in Camas Creek to raise water level similar to historic levels, protect creek bank from further erosion, increase spring flooding of area, and by fencing entire spring and wetland complex to exclude cattle.
Potential barriers to success: Damage to cattle exclusion fence, failure to exclude cattle, failure to install rock vane correctly, wrong design for rock vane.
Landowner objective(s): Improve wildlife habitat while continuing to graze cattle.
Species objective(s): Restore coastal dune habitat to maintain no more than 25 % cover of European beach grass and allow for at least annual over wash after 10 years. (No. 1 of 1).
SMART objective: By year 10 after project implementation, reduce bare ground on stream bank from 50 to 5 %, reduce bare ground on floodplain from 50 to 5 %, and increase spring flooding from once every 5 years to once a year. (No. 1 of 1)
Indicator(s) Pre-project conditions and photograph file names
Amount of vegetation cover on floodplain, amount of vegetation cover on banks, flood frequency information from landowner
07/15/03 Dry depressions with no willow or sedge/rush species, Heavily grazed and degraded wetland system with over 50% of the floodplain area bare ground and cattle induced bank erosion evident (over 50% bare ground), flood frequency approximately once every 5 years, see 071503_53935_ppA_01.tif, 071503_53935_ppA_02.tif, 071503_53935_ppB_01.tif, 071503_53935_ppB_02.tif, 071503_53935_ppC_01.tif, 071503_53935_ppC_02.tif
Post-Project Conditions Mid-Agreement Conditions End of Agreement Conditions
Desired state during follow-up visits
Rock vane placed and oriented per design, fence in place and cattle excluded, no willow sedge/rush in overflow channels, bank erosion and bare ground still evident (approximately 50% bare ground, and 50% herbaceous cover). Flood frequency approximately once every 5 years.
Rock vane intact, cattle exclusion fence intact and no evidence of cattle within, willow sedge/rush establishing in overflow channels, bank no more than 20% bare. Floodplain no more than 20% bare. Flooding each spring.
Rock vane intact, cattle exclusion fence intact and no evidence of cattle within, willow sedge/rush growing in overflow channels, bank no more than 5% bare. Floodplain no more than 5% bare. Flooding each spring.
Assessment tool(s) Visual assessments, permanent photopoints, landowner interviews
Visual assessments, permanent photopoints, landowner interviews
Visual assessments, permanent photopoints, landowner interviews
Estimated state during follow-up: date of visit, description, photograph file names
09/30/03 Rock vane placed and oriented per design, fence in place and cattle excluded, no willow sedge/rush in overflow channels, bank erosion and bare ground still evident (approximately 50% bare ground, and 50% herbaceous cover). Flood frequency approximately once every 5 years. see 093003_53935_ppA_01.tif, 093003_53935_ppA_02.tif, 093003_53935_ppB_01.tif, 093003_53935_ppB_02.tif, 093003_53935_ppC_01.tif, 093003_53935_ppC_02.tif
10/12/08 Rock vane intact, cattle exclusion fence intact and no evidence of cattle within, vigorous sedge/rush establishment in overflow channels and approx. 200 willow saplings approx. 4’ high distributed throughout floodplain. Bank is less than 10% bare ground, and floodplain has no bare ground. Landowner reports that flooding has occurred each spring. Landowner has removed approx. 10 Russian Olive seedlings each year. 101208_53935_ppA_01.tif, 101208_53935_ppA_02.tif, 101208_53935_ppB_01.tif, 101208_53935_ppB_02.tif, 101208_53935_ppC_01.tif, 101208_53935_ppC_02.tif
08/03/13 Rock vane intact, cattle exclusion fence intact now, but landowner was absent for 2 year period and manager did not repair storm damage to fence and cattle grazing occurred during spring of 2012. Fence was repaired upon landowner’s return in summer of 2012. Bank is approximately 10% bare ground, and Russian olive seedlings have become established on south end of wetland, but landowner is committed to remove them and ensure cattle exclusion in the future. Approximately 150 willows are over 10’ tall, and wetland has flooded 9 of 10 springs. 080313_53935_ppA_01.tif, 080313_53935_ppA_02.tif, 080313_53935_ppB_01.tif, 080313_53935_ppB_02.tif, 080313_53935_ppC_01.tif, 080313_53935_ppC_02.tif
Assessment results Fully Fully Mostly
Are species objectives being met?
N/A too early to tell Yes, see below Yes, see below
Are landowner objectives being met?
Yes – Landowner pleased with rock vane and fence installation
Yes Yes
Are maintenance activities occurring as needed?
Yes – Landowner maintaining fence and excluding cattle
Yes – Landowner enthusiastic about project success to date.
Yes
Items to check next time Look for Russian olive seedlings Continue to look for Russian olives
Comments None IDFW and landowner report pair of trumpeter swans nesting on site. Landowner also reports use by sandhillcranes, pied-billed grebes, sora rails, coots,black-necked stilts, killdeer, willet, snipe,and kingbirds.
Still a great project, even with fence and bankdamage in 2012. Trumpeter swan nest still inuse and hatched 3 cygnets in 08, 2 cygnets in09, and 3 cygnets in 10. Additional bird usereported by landowner for horned larks, violetgreen and cliff swallows, red-wing, yellow-headedand Brewer’s blackbirds.
* Blue fields will be reported in HabITS.

Appendix A 35
Example 3. Rainy Side Instream Restoration ProjectProject name: Rainy Side Creek HabITS Project ID No.: 3245932 Were quantitative data collected? Yes
Goal(s): Improve coho habitat by increasing instream habitat complexity and creating off channel refugia for juvenile rearing by installing large wood to address lack of overwinter habitat (dominant limiting factor for smolt production).
Potential barriers to success: Large wood placed incorrectly, large storms blow out wood.
Landowner objective(s): Enhance fishing opportunities.
Species objective(s): Increase in over-winter survival of Coho as determined by pre- and post-project ODFW sampling
SMART objective: Place 3 or more pieces of large wood (>12” in diameter and 20’ in length) per section with orientation and spacing to positively influence channel morphology, and reactivate floodplain to provide overwintering habitat by year 10. (No. 1 of 1).
Indicator(s) Pre-project conditions and photograph file names
Amount of large wood (>12 “ diameter and >20’ in length) instream in project reach, evidence of floodplain activation during high flows
09/15/04 Two or less pieces of medium wood (> 12” diameter, 6’ in length) and no large wood per each 200’ section in project reach, disconnected flood plain, see 091504_3245932_ppA_01.tif, 091504_3245932_ppA_02.tif, 091504_3245932_ppB_01.tif, 091504_3245932_ppB_02.tif, 091504_3245932_ppC_01.tif, 091504_3245932_ppC_02.tif
Post-Project Conditions Mid-Agreement Conditions End of Agreement Conditions
Desired state during follow-up visits
3 or more pieces of large wood, and 3 or more pieces of medium wood per each 200’ section, disconnected floodplain.
Presence of large wood with evidence of substrate depositions, floodplain interaction, channel braiding and other key winter habitat features associated with structure placements.
Presence of large wood with evidence of substrate depositions, floodplain interaction, channel braiding and other key winter habitat features associated with structure placements.
Assessment tool(s) Large wood inventory, stream habitat type assessment, photos
Large wood inventory, stream habitat type assessment, photos
Large wood inventory, stream habitat type assessment, photos
Estimated state during follow-up: date of visit, description, photograph file names
08/01/05: Excellent results with wood placement. Field visit reveals that wood was placed and oriented per plan, 3 or more pieces of large wood, and 3 or more pieces of medium wood are located within the instream zone for each 200’ section, 2 or more pieces of large wood also placed in recruitment zone per each 200’ section as well, disconnected floodplain, 080105_3245932_ppA_01.tif, 080105_3245932_ppA_02.tif, 080105_3245932_ppB_01.tif, 080105_3245932_ppB_02.tif, 080105_3245932_ppC_01.tif, 080105_3245932_ppC_02.tif
01/10/09: Recent ice and wind storms have contributed large quantities of canopy litter and riparian wood resources to the active stream channel. This material has worked in concert with the large wood placement to create highly complex full spanning structures, 011009_3245932_ppA_01.tif, 011009_3245932_ppA_02.tif, 011009_3245932_ppB_01.tif, 011009_3245932_ppB_02.tif, 011009_3245932_ppC_01.tif, 011009_3245932_ppC_02.tif
09/13/15: Large flood events occurred in winters of 2011 and 2014. Most large wood placements were uprooted and repositioned by powerful winter hydraulics. The logs are still present and continue to play a significant role in the their new orientation for capturing transient woody debris. Substrate deposition, floodplain interaction, channel braiding and other key winter habitat features associated with large wood placement are evident and suggest that a maturation of channel complexity is in progress. 091315_3245932_ppA_01.tif, 091315_3245932_ppA_02.tif, 091315_3245932_ppB_01.tif, 091315_3245932_ppB_02.tif, 091315_3245932_ppC_01.tif, 091315_3245932_ppC_02.tif
Assessment results Fully Fully Fully
Are species objectives being met?
Yes, see comment section below Yes, see comment section below Yes, see comment section below
Are landowner objectives being met?
Yes Yes Yes
Are maintenance activities occurring as needed?
NA – natural process project, no maintenance or management actions required
NA – natural process project, no maintenance or management actions required
NA – natural process project, no maintenance or management actions required
Items to check next time Schedule next vist after significant storm and/or10 yr flood event
Follow-up with ODFW on survey results
Comments ODFW conducting pre- and post- project comparative sampling with paired snorkel inventories, summer and winter of coho parr rearing. Goal is to conduct pre treatment assessments of over winter survival and to then compare those values to post wood treatment survival rates. Pre-project survey results in project file and uploaded in HabITS.
ODFW coho snorkel inventories underway but survey results not yet available.
ODFW snorkel surveys indicate that pre-project coho overwinter survival rates were 4.74%. and post-project coho overwinter survival rates were 21.03%. Final report is located in project file and executive summary was uploaded in HabITS.
* Blue fields will be reported in HabITS.

36 Monitoring Habitat Restoration Projects
Example 4. Hawaiian Ungulate Fence and Rare Plant RestorationProject name:Hawaiian Ungulate Fence and Rare Plant Restoration HabITS Project ID No.: 9386 Were quantitative data collected? Yes
Goal(s): Restore native plant community by building ungulate-proof fence and removing ungulates within the fence.
Potential barriers to success: Other alien herbivorous species (e.g., rodents and snails) not excluded by the fence.
Landowner objective(s): Reduce long-term costs of ungulate control.
Species objective(s): Increase in number and diversity of native plants.
SMART objective: Exclude all ungulates from the project area for 10 years. (No. 1 of 1).
Indicator(s) Pre-project date, conditions, and photograph file names
Amount of large wood (>12 “ diameter and >20’ in length) instream in project reach, evidence of floodplain activation during high flows
09/15/04 Two or less pieces of medium wood (> 12” diameter, 6’ in length) and no large wood per each 200’ section in project reach, disconnected flood plain, see 091504_3245932_ppA_01.tif, 091504_3245932_ppA_02.tif, 091504_3245932_ppB_01.tif, 091504_3245932_ppB_02.tif, 091504_3245932_ppC_01.tif, 091504_3245932_ppC_02.tif
Post-Project Conditions Mid-Agreement Conditions End of Agreement Conditions
Desired state during follow-up visits
No pig sign within the fence No pig sign within the fence No pig sign within the fence
Assessment tool(s) Photos per protocol/biologist BPJ Photos per protocol/Biologist BPJ/landowner interview
Photos per protocol/Biologist BPJ/landowner
Estimated state during follow-up: date of visit, description, photograph file names
January 14, 2011: Fence completed, trees overhanging fence removed, and no sign of pigs within fence after 2 weeks of hunting with dogs and 4 months of pig trapping. Heavy November rains resulted in good recruitment of native plant seedlings with no sign of pig herbivory. See photos 11_9386_pp1_01.tif through _07.tif.
October 6, 1016: Noted downed tree that breached fence and pig tracks in SW corner (about 10%) of project area. However, no pigs were found within the fence following repairs by landowner. Three previously un-recorded native plant speices observed within the fence. See photos 16_9386_pp01.tif through _11.tif.
February 18, 2021: Small area (3m x 2 m = to less than 1% of project area) of uprooted vegetation noted adjacent to hole dug under fence. Landowner filled hole March 2, 2012 and looked for pigs within the fence – none found. Rodent seed predation (partially chewed seeds) noted. One previously un-recorded plant species observed.
Assessment results Fully Fully Mostly
Are species objectives being met?
Yes Yes Yes
Are landowner objectives being met?
Yes Yes Yes
Are maintenance activities occurring as needed?
Yes, see below Yes, see below Yes, see below
Items to check next time Check fence integrity Check fence integrity
Comments Walked all accessible parts of 22-acre projectarea – no pig sign observed.
Landowner repaired fence breachon November 18, 2016, as perconditions of cooperative agreement.Recommended that landowner increasefence line integrity surveys to once permonth.
Due to seed predation by rodents,worked with landowner to designrodent control program using baitboxes and diphacinone.
* Blue fields will be reported in HabITS.

Publishing support provided by the U.S. Geological Survey Publishing Network, Tacoma Publishing Service Center
For more information concerning the research in this report, contact the Director, Forest and Rangeland Ecosystem Science Center, U.S. Geological Survey, 777 NW 9th Street Corvallis, Oregon 97330 http://fresc.usgs.gov

Woodw
ard and Hollar— M
onitoring Habitat Restoration Projects—Techniques and M
ethods 2–A11