Monitoring Cassandra: Don't Miss a Thing (Alain Rodriguez, The Last Pickle) | C* Summit 2016
68
Licensed under a Creative Commons Attribution-NonCommercial 3.0 New Zealand License MONITORING CASSANDRA: DON'T MISS A THING! Alain Rodriguez
Transcript of Monitoring Cassandra: Don't Miss a Thing (Alain Rodriguez, The Last Pickle) | C* Summit 2016

Licensed under a Creative Commons Attribution-NonCommercial 3.0 New Zealand License
MONITORING CASSANDRA: DON'T MISS A THING!
Alain Rodriguez

Introduction

About The Last Pickle

About The Last Pickle and Alain Rodriguez

About The Last Pickle and Alain Rodriguez
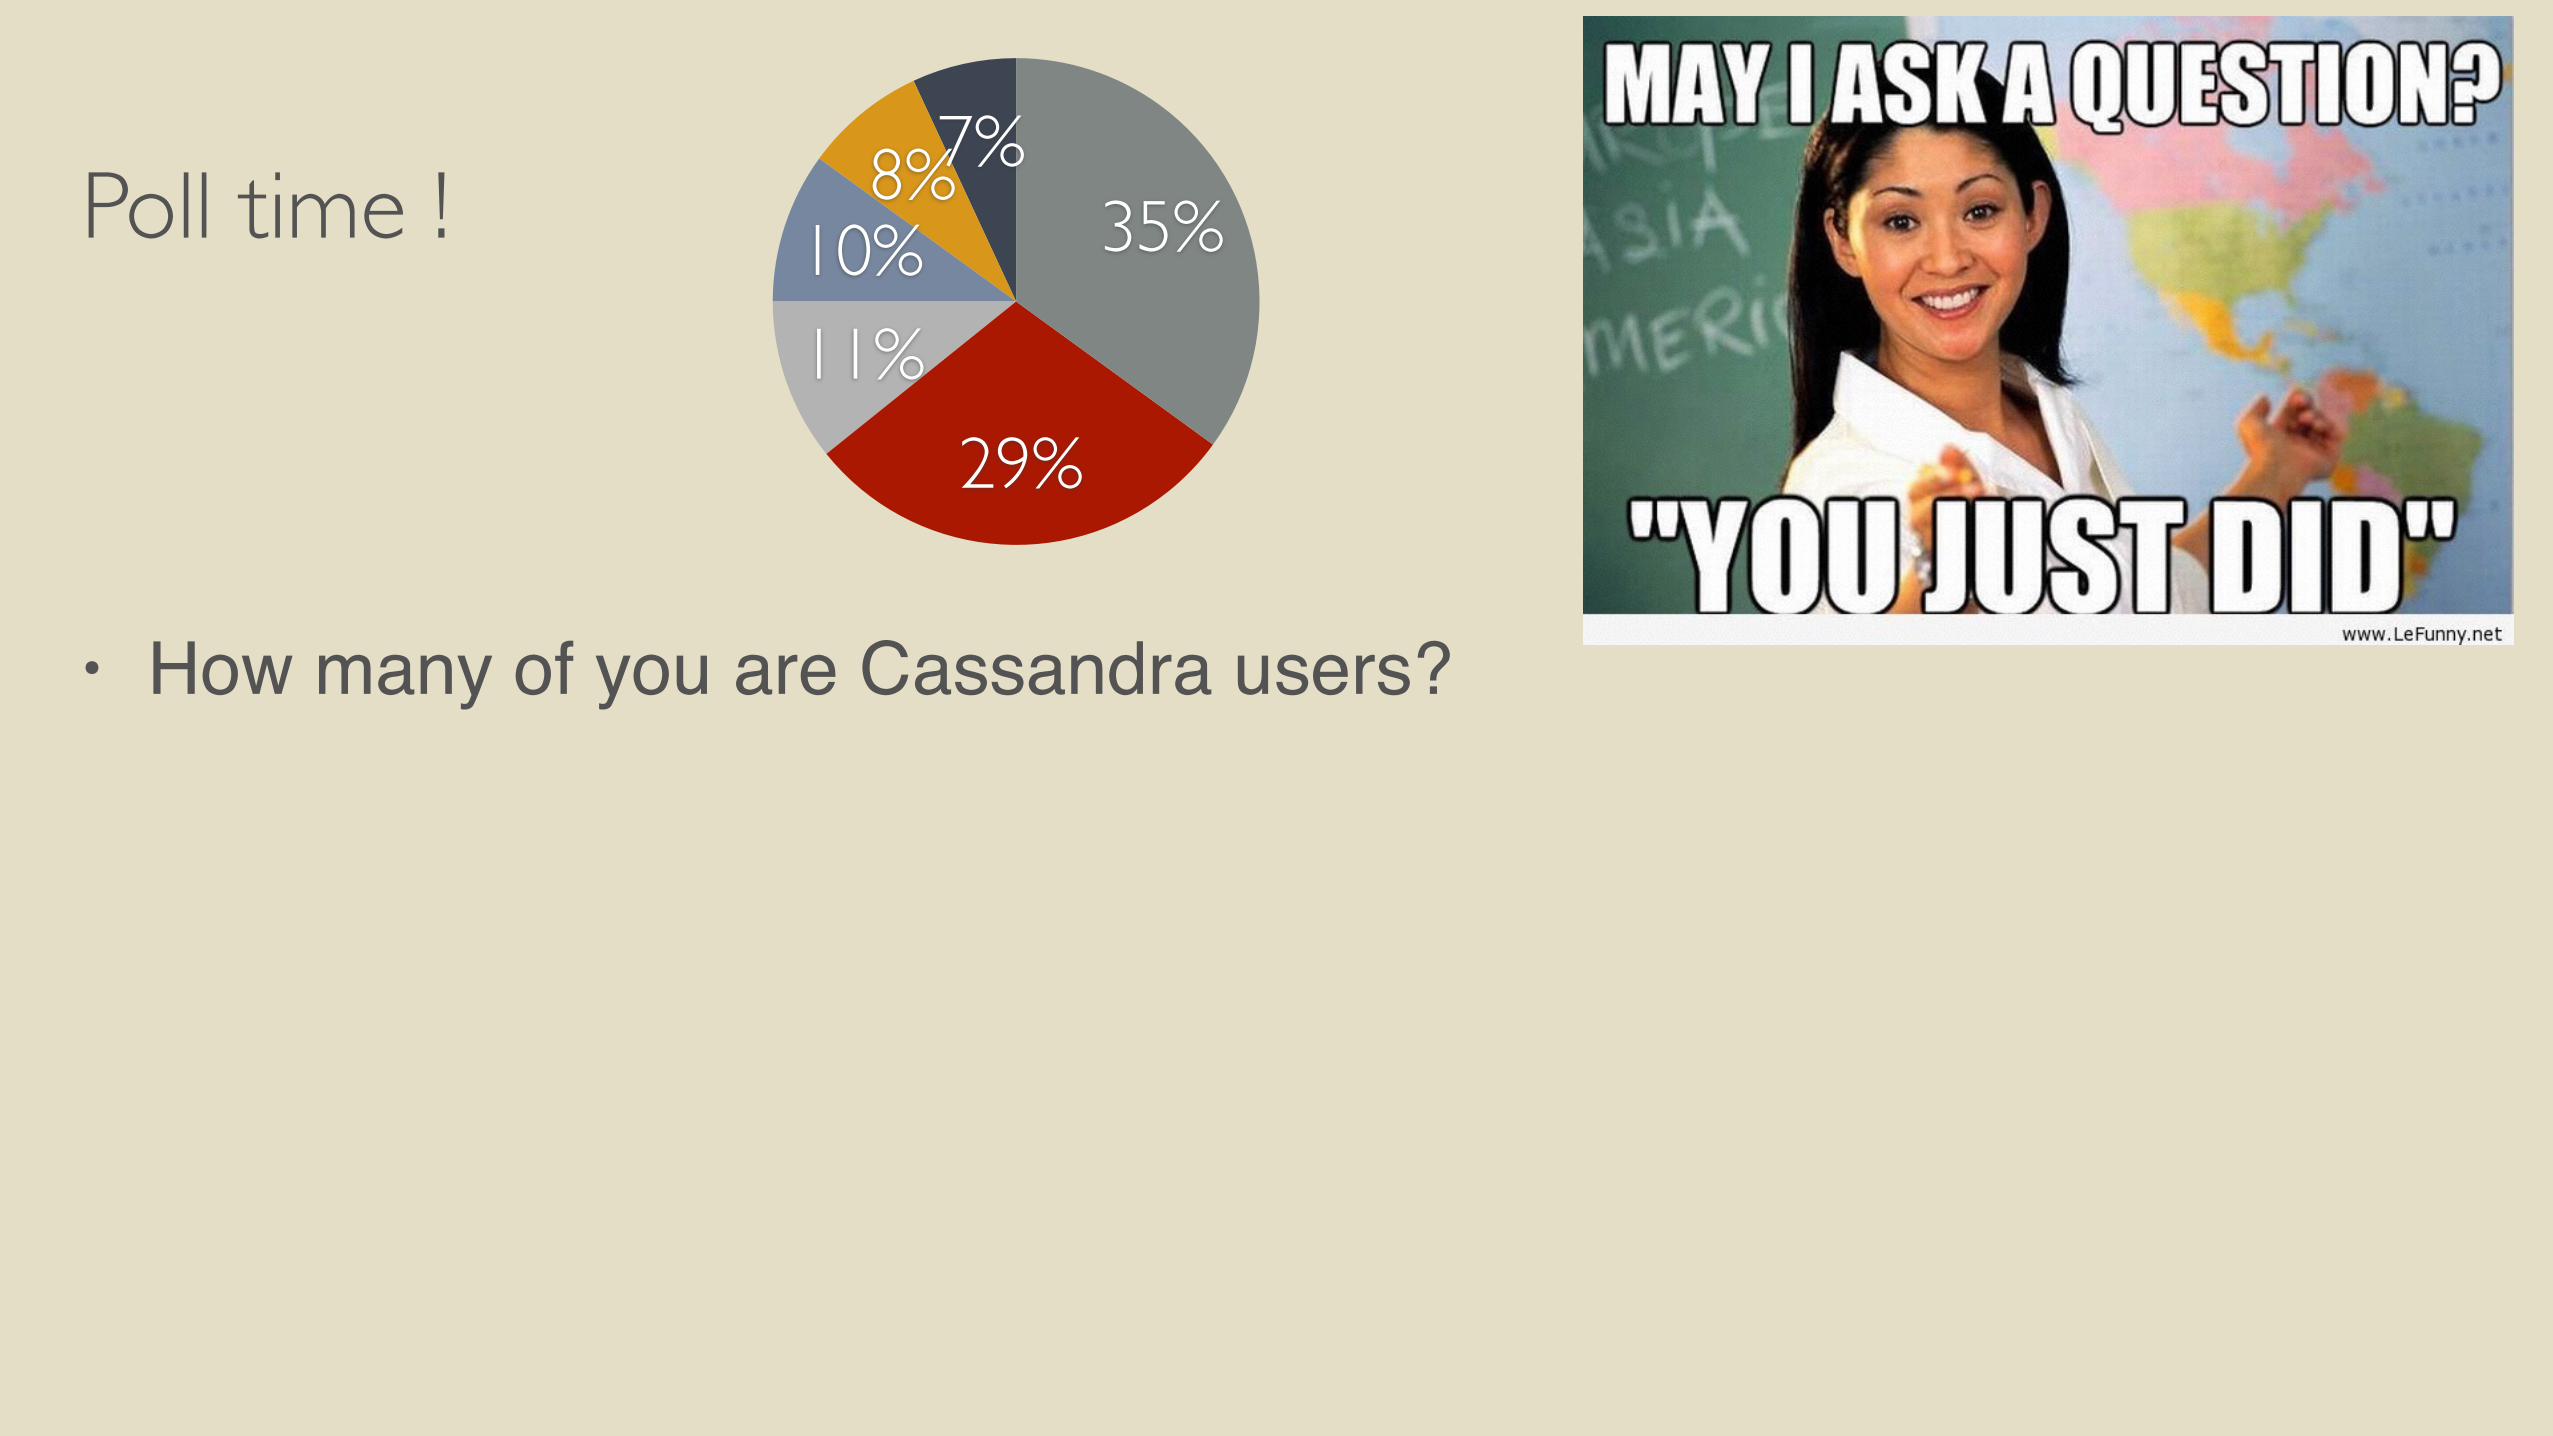
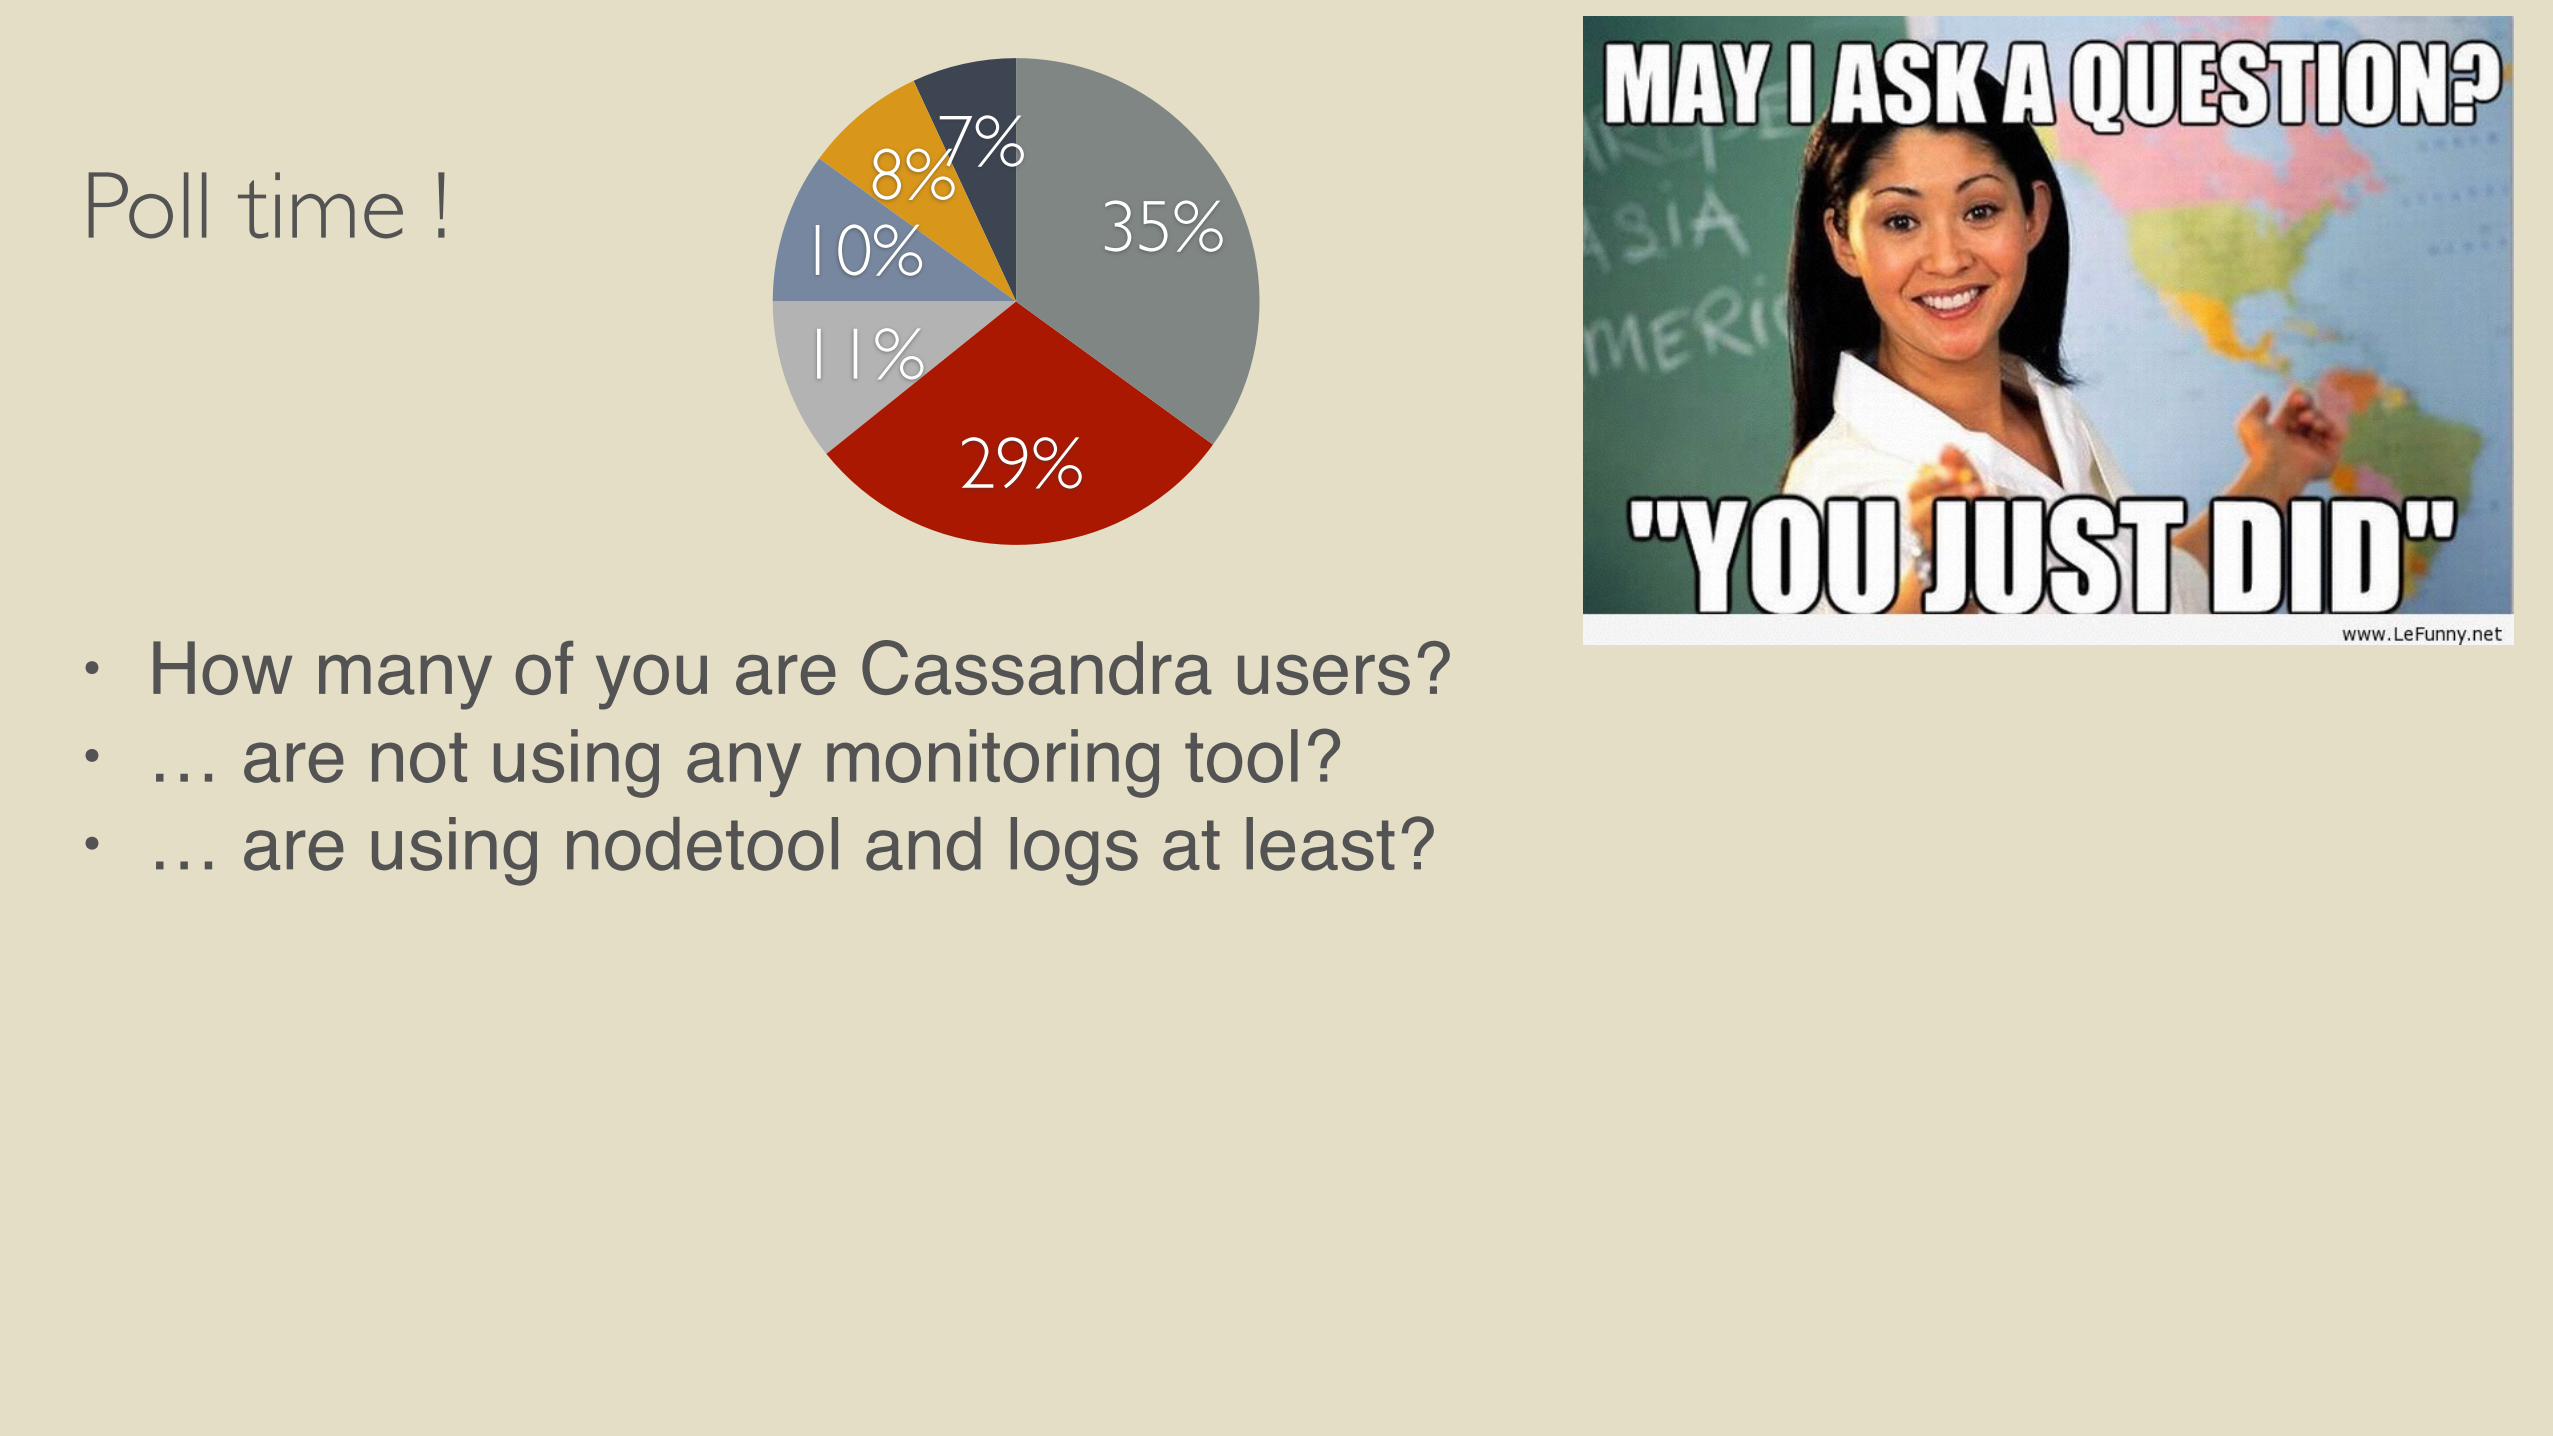
Poll time !
• How many of you are Cassandra users?
7%8%10%11%
29%
35%
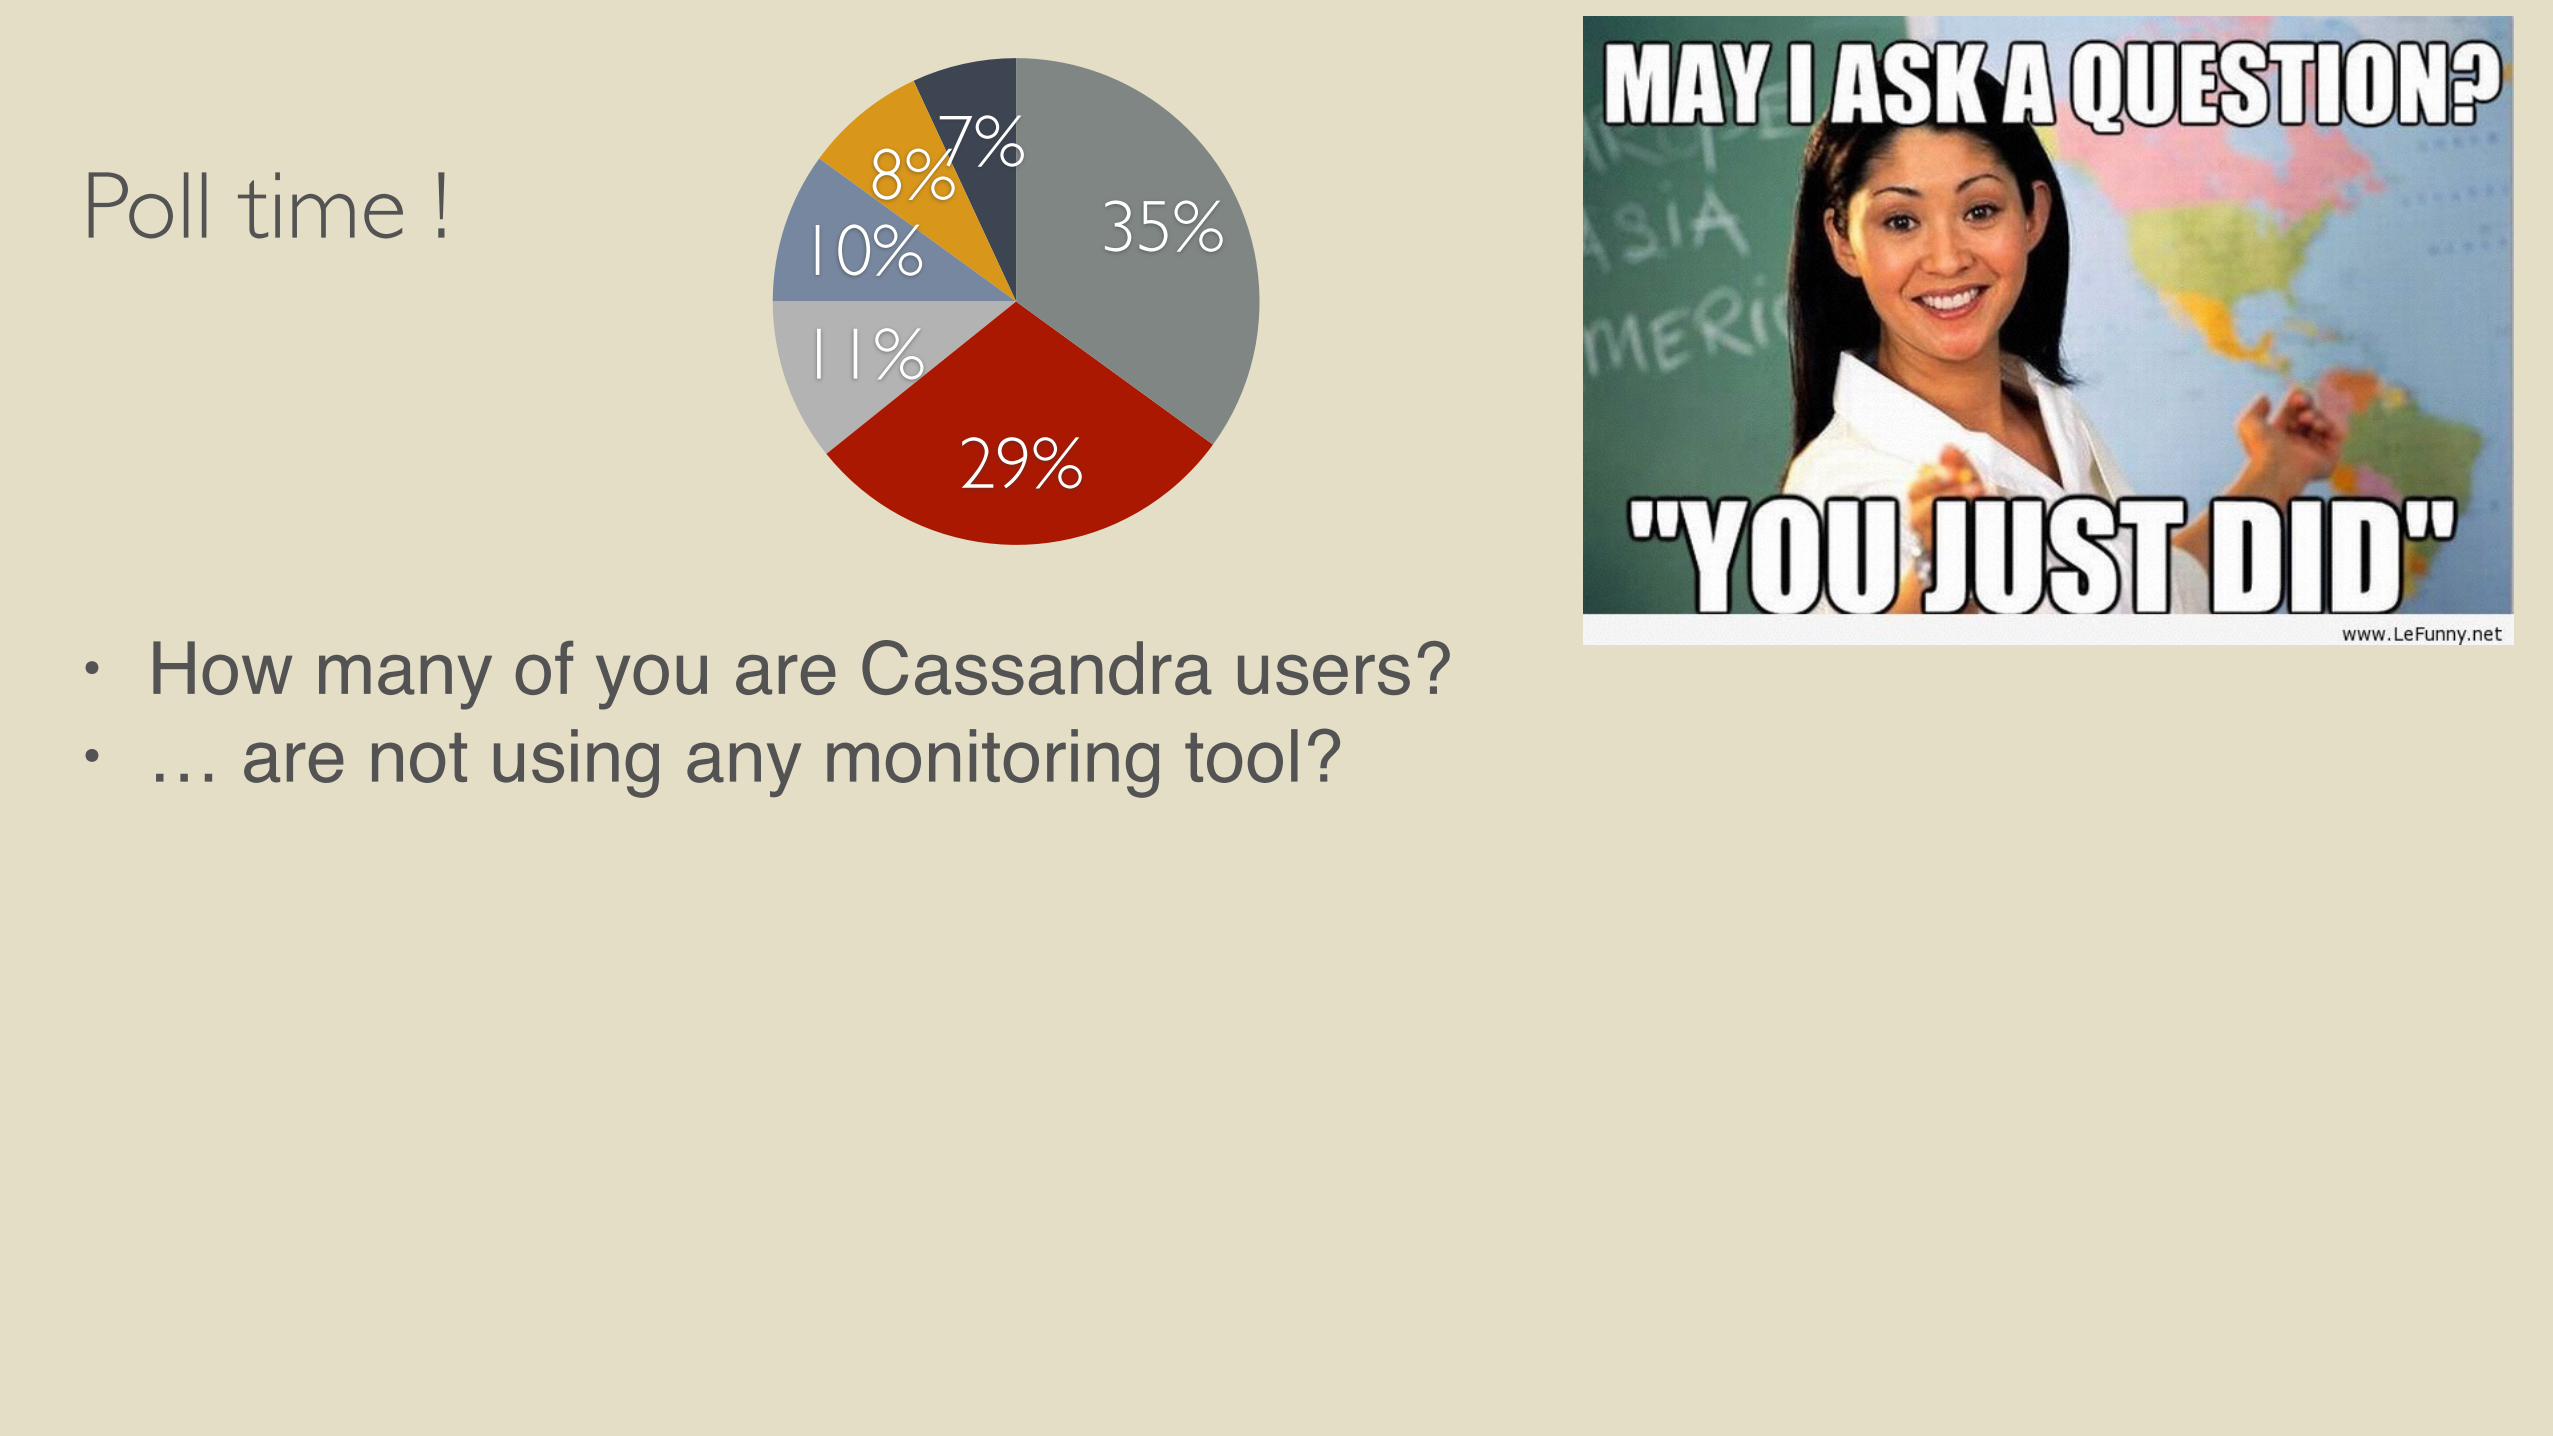
Poll time !
• How many of you are Cassandra users?• … are not using any monitoring tool?
7%8%10%11%
29%
35%
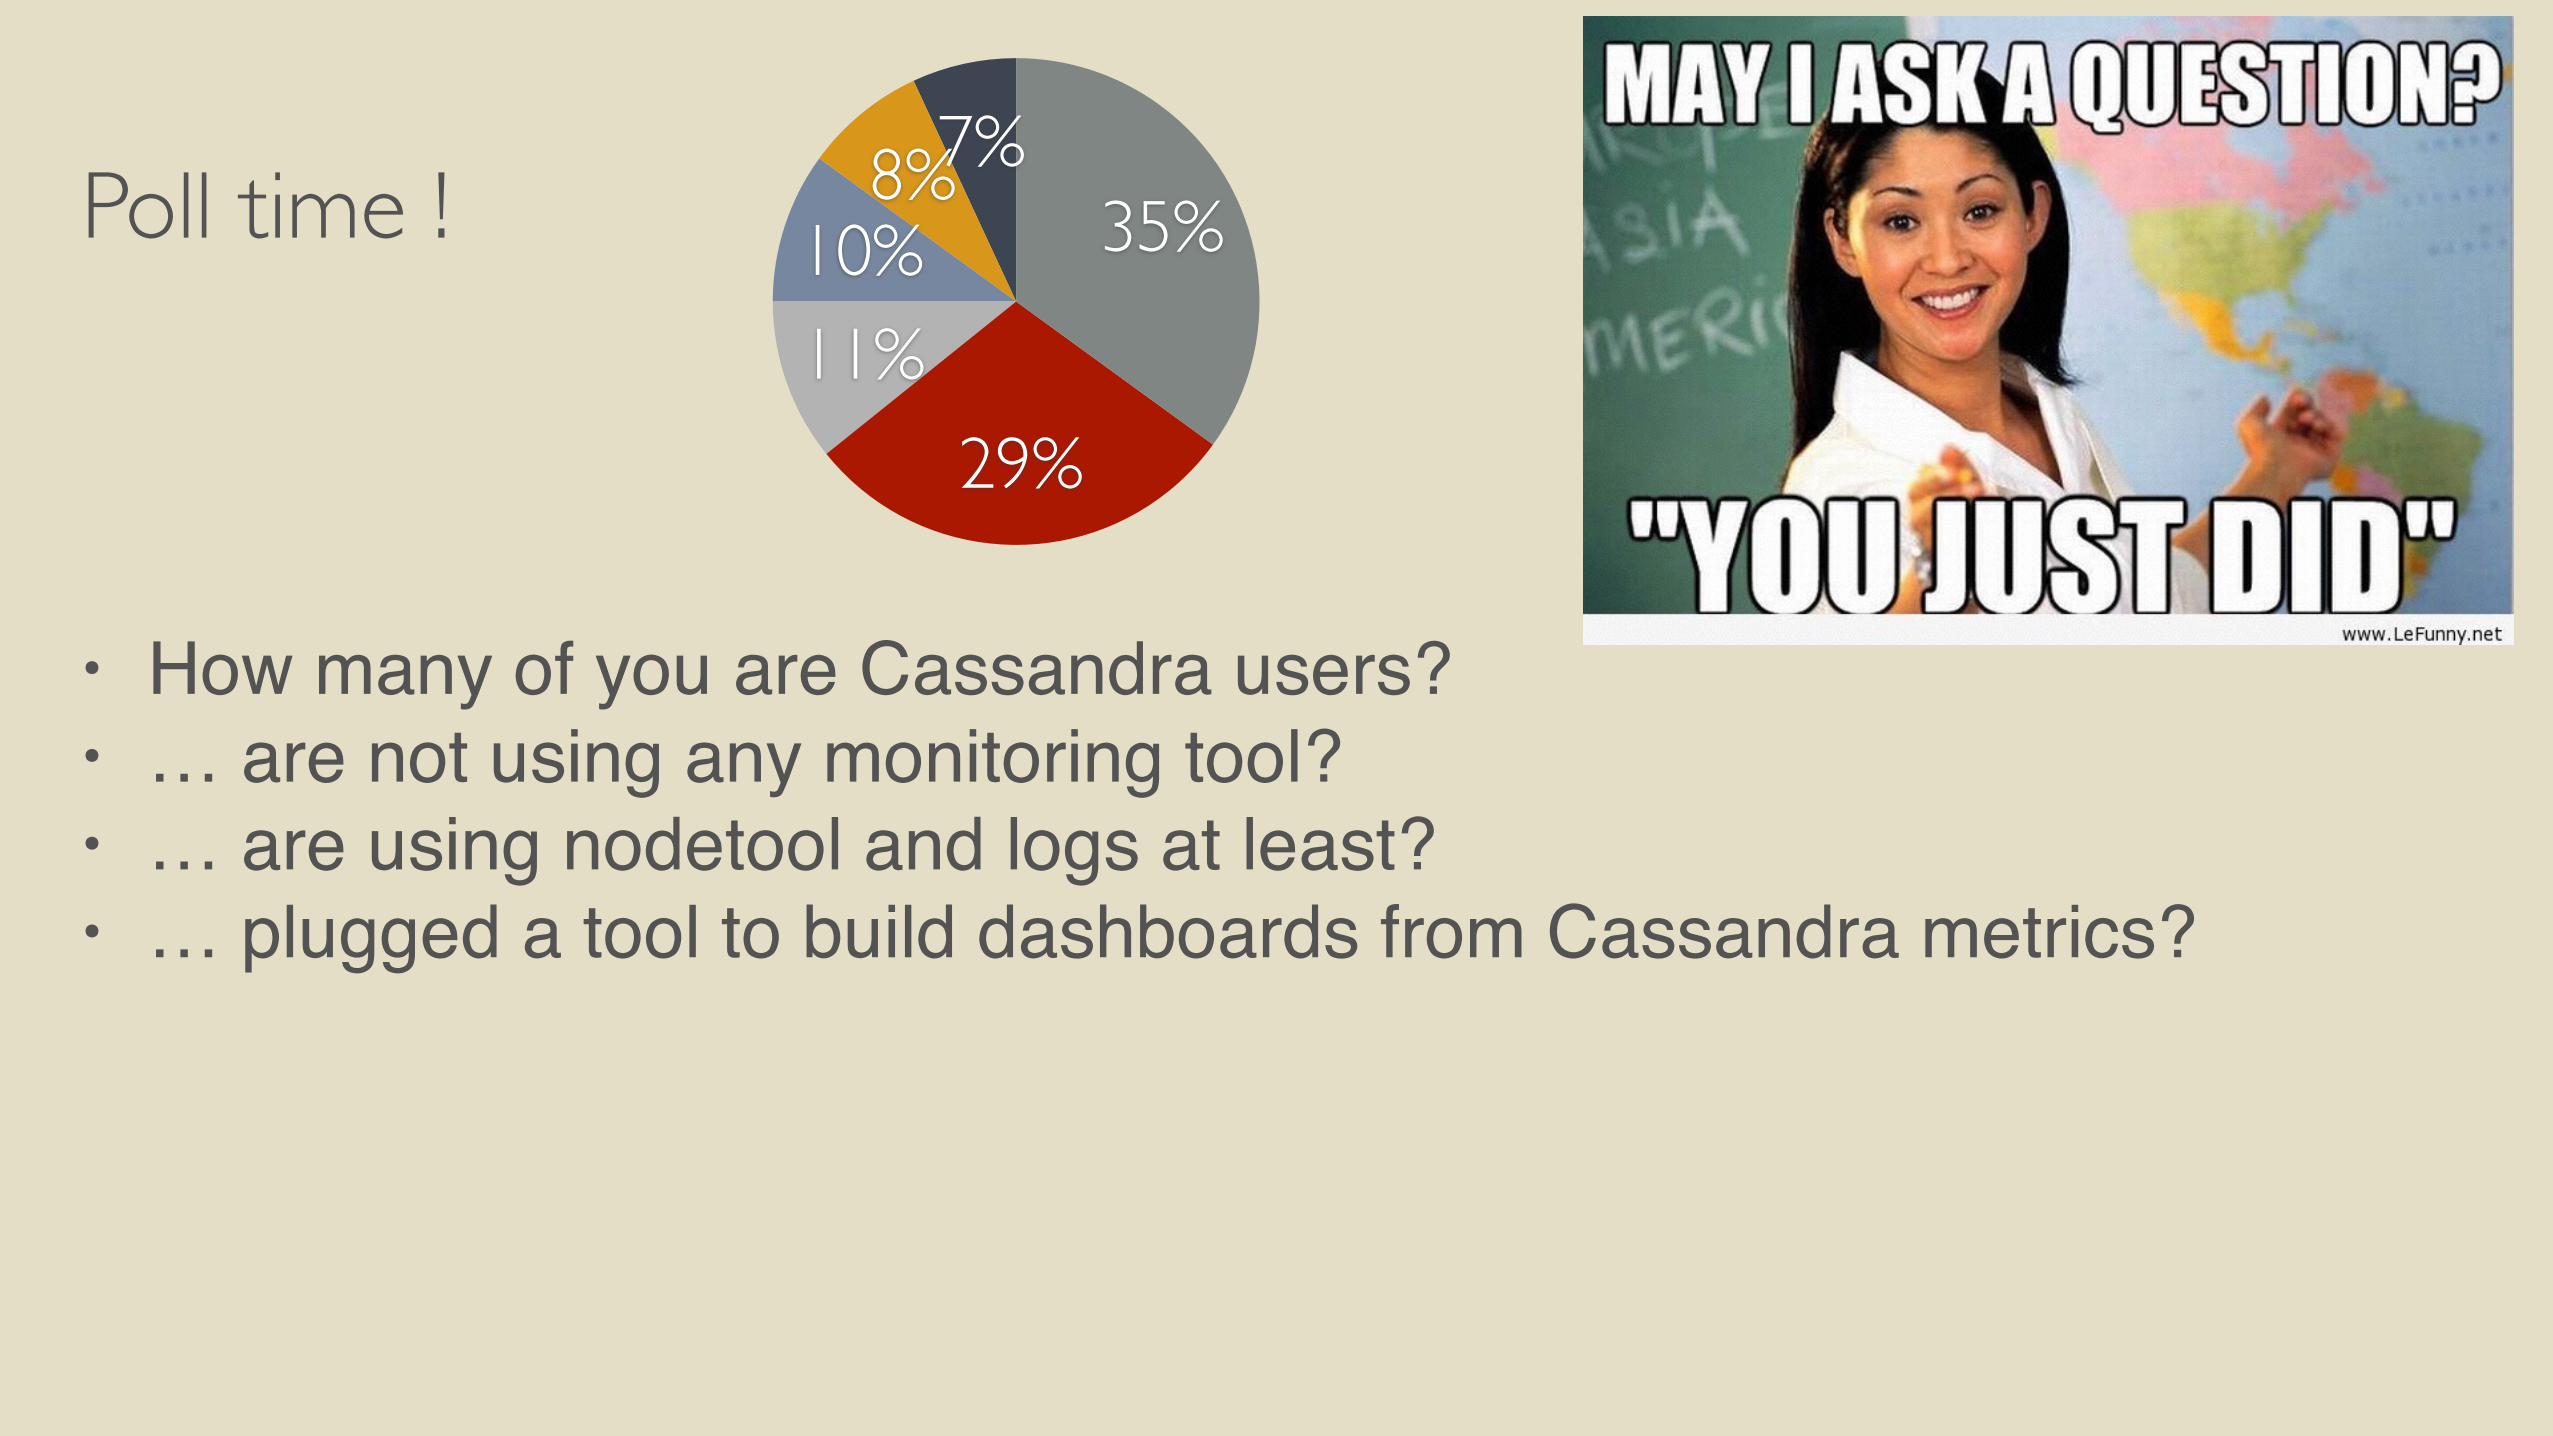
Poll time !
• How many of you are Cassandra users?• … are not using any monitoring tool?• … are using nodetool and logs at least?
7%8%10%11%
29%
35%
Poll time !
• How many of you are Cassandra users?• … are not using any monitoring tool?• … are using nodetool and logs at least?• … plugged a tool to build dashboards from Cassandra metrics?
7%8%10%11%
29%
35%
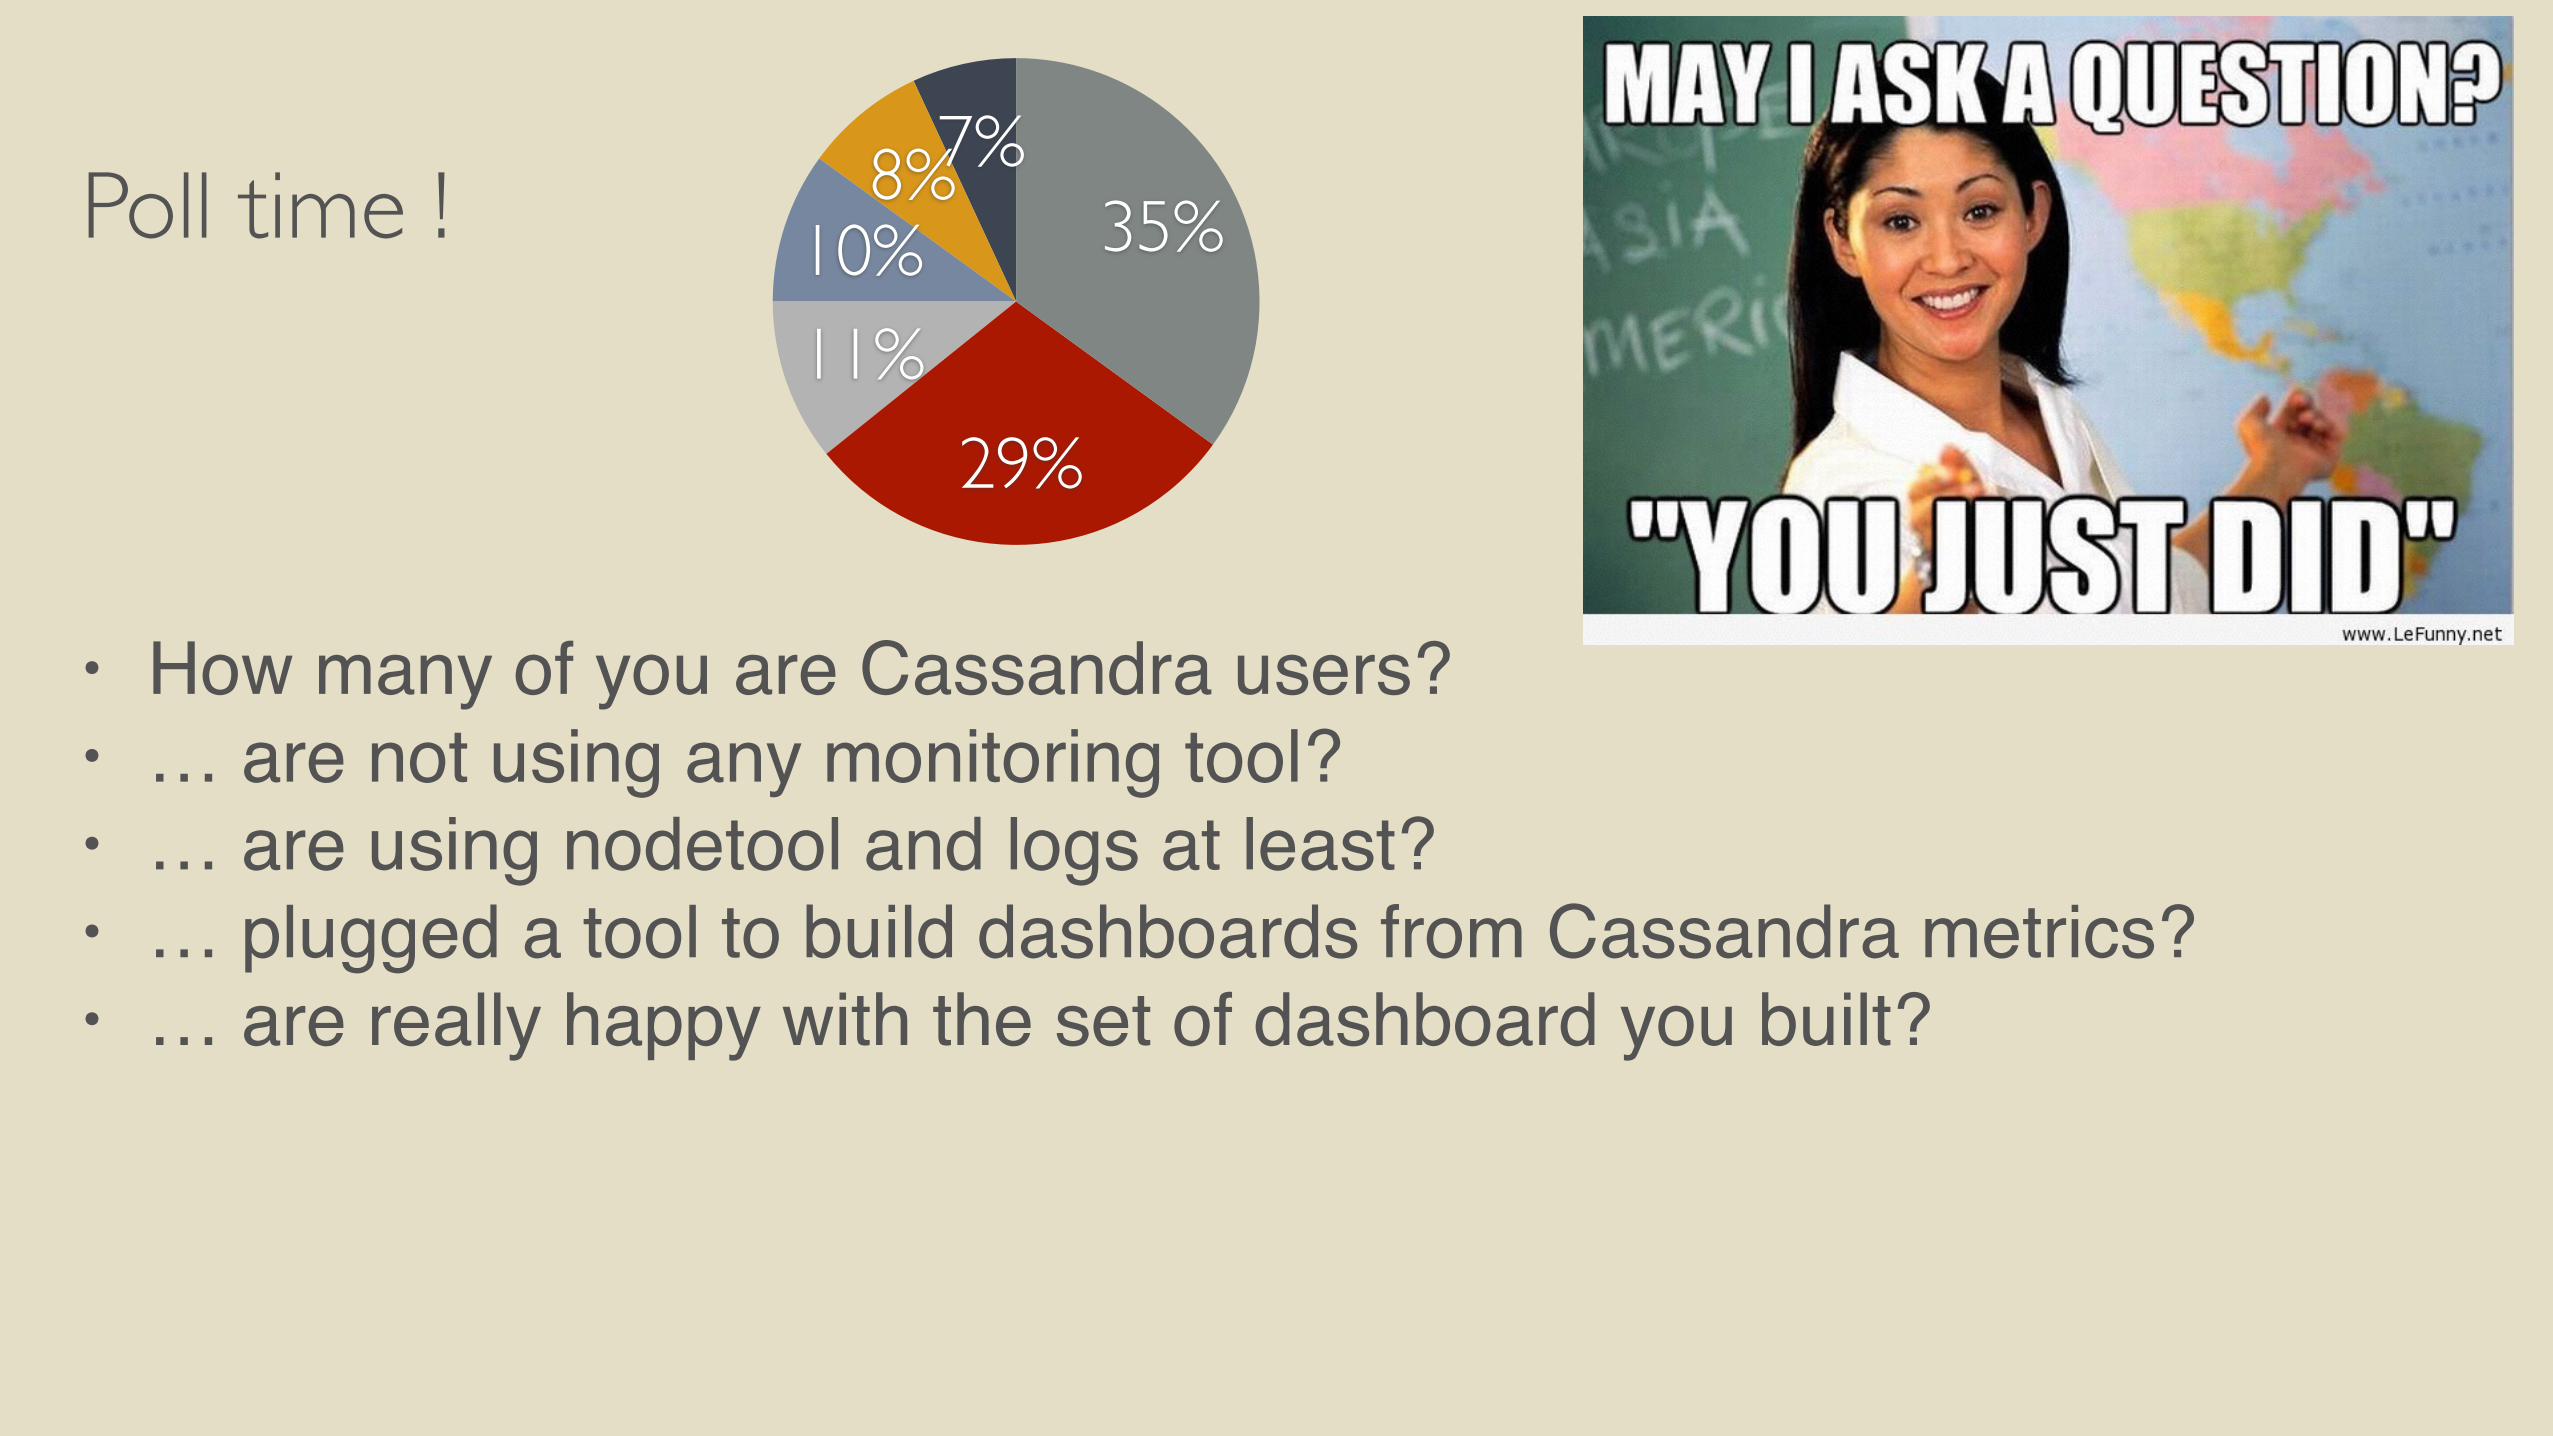
Poll time !
• How many of you are Cassandra users?• … are not using any monitoring tool?• … are using nodetool and logs at least?• … plugged a tool to build dashboards from Cassandra metrics?• … are really happy with the set of dashboard you built?
7%8%10%11%
29%
35%

CTO’s call…
CTO:
“Hi Alain, WTF is happening with Cassandra?”
Many possible outcomes to this discussion…
CTO’s call…
Without monitoring
Me: “What are you talking about? Anyway, ask the Devs about it!”

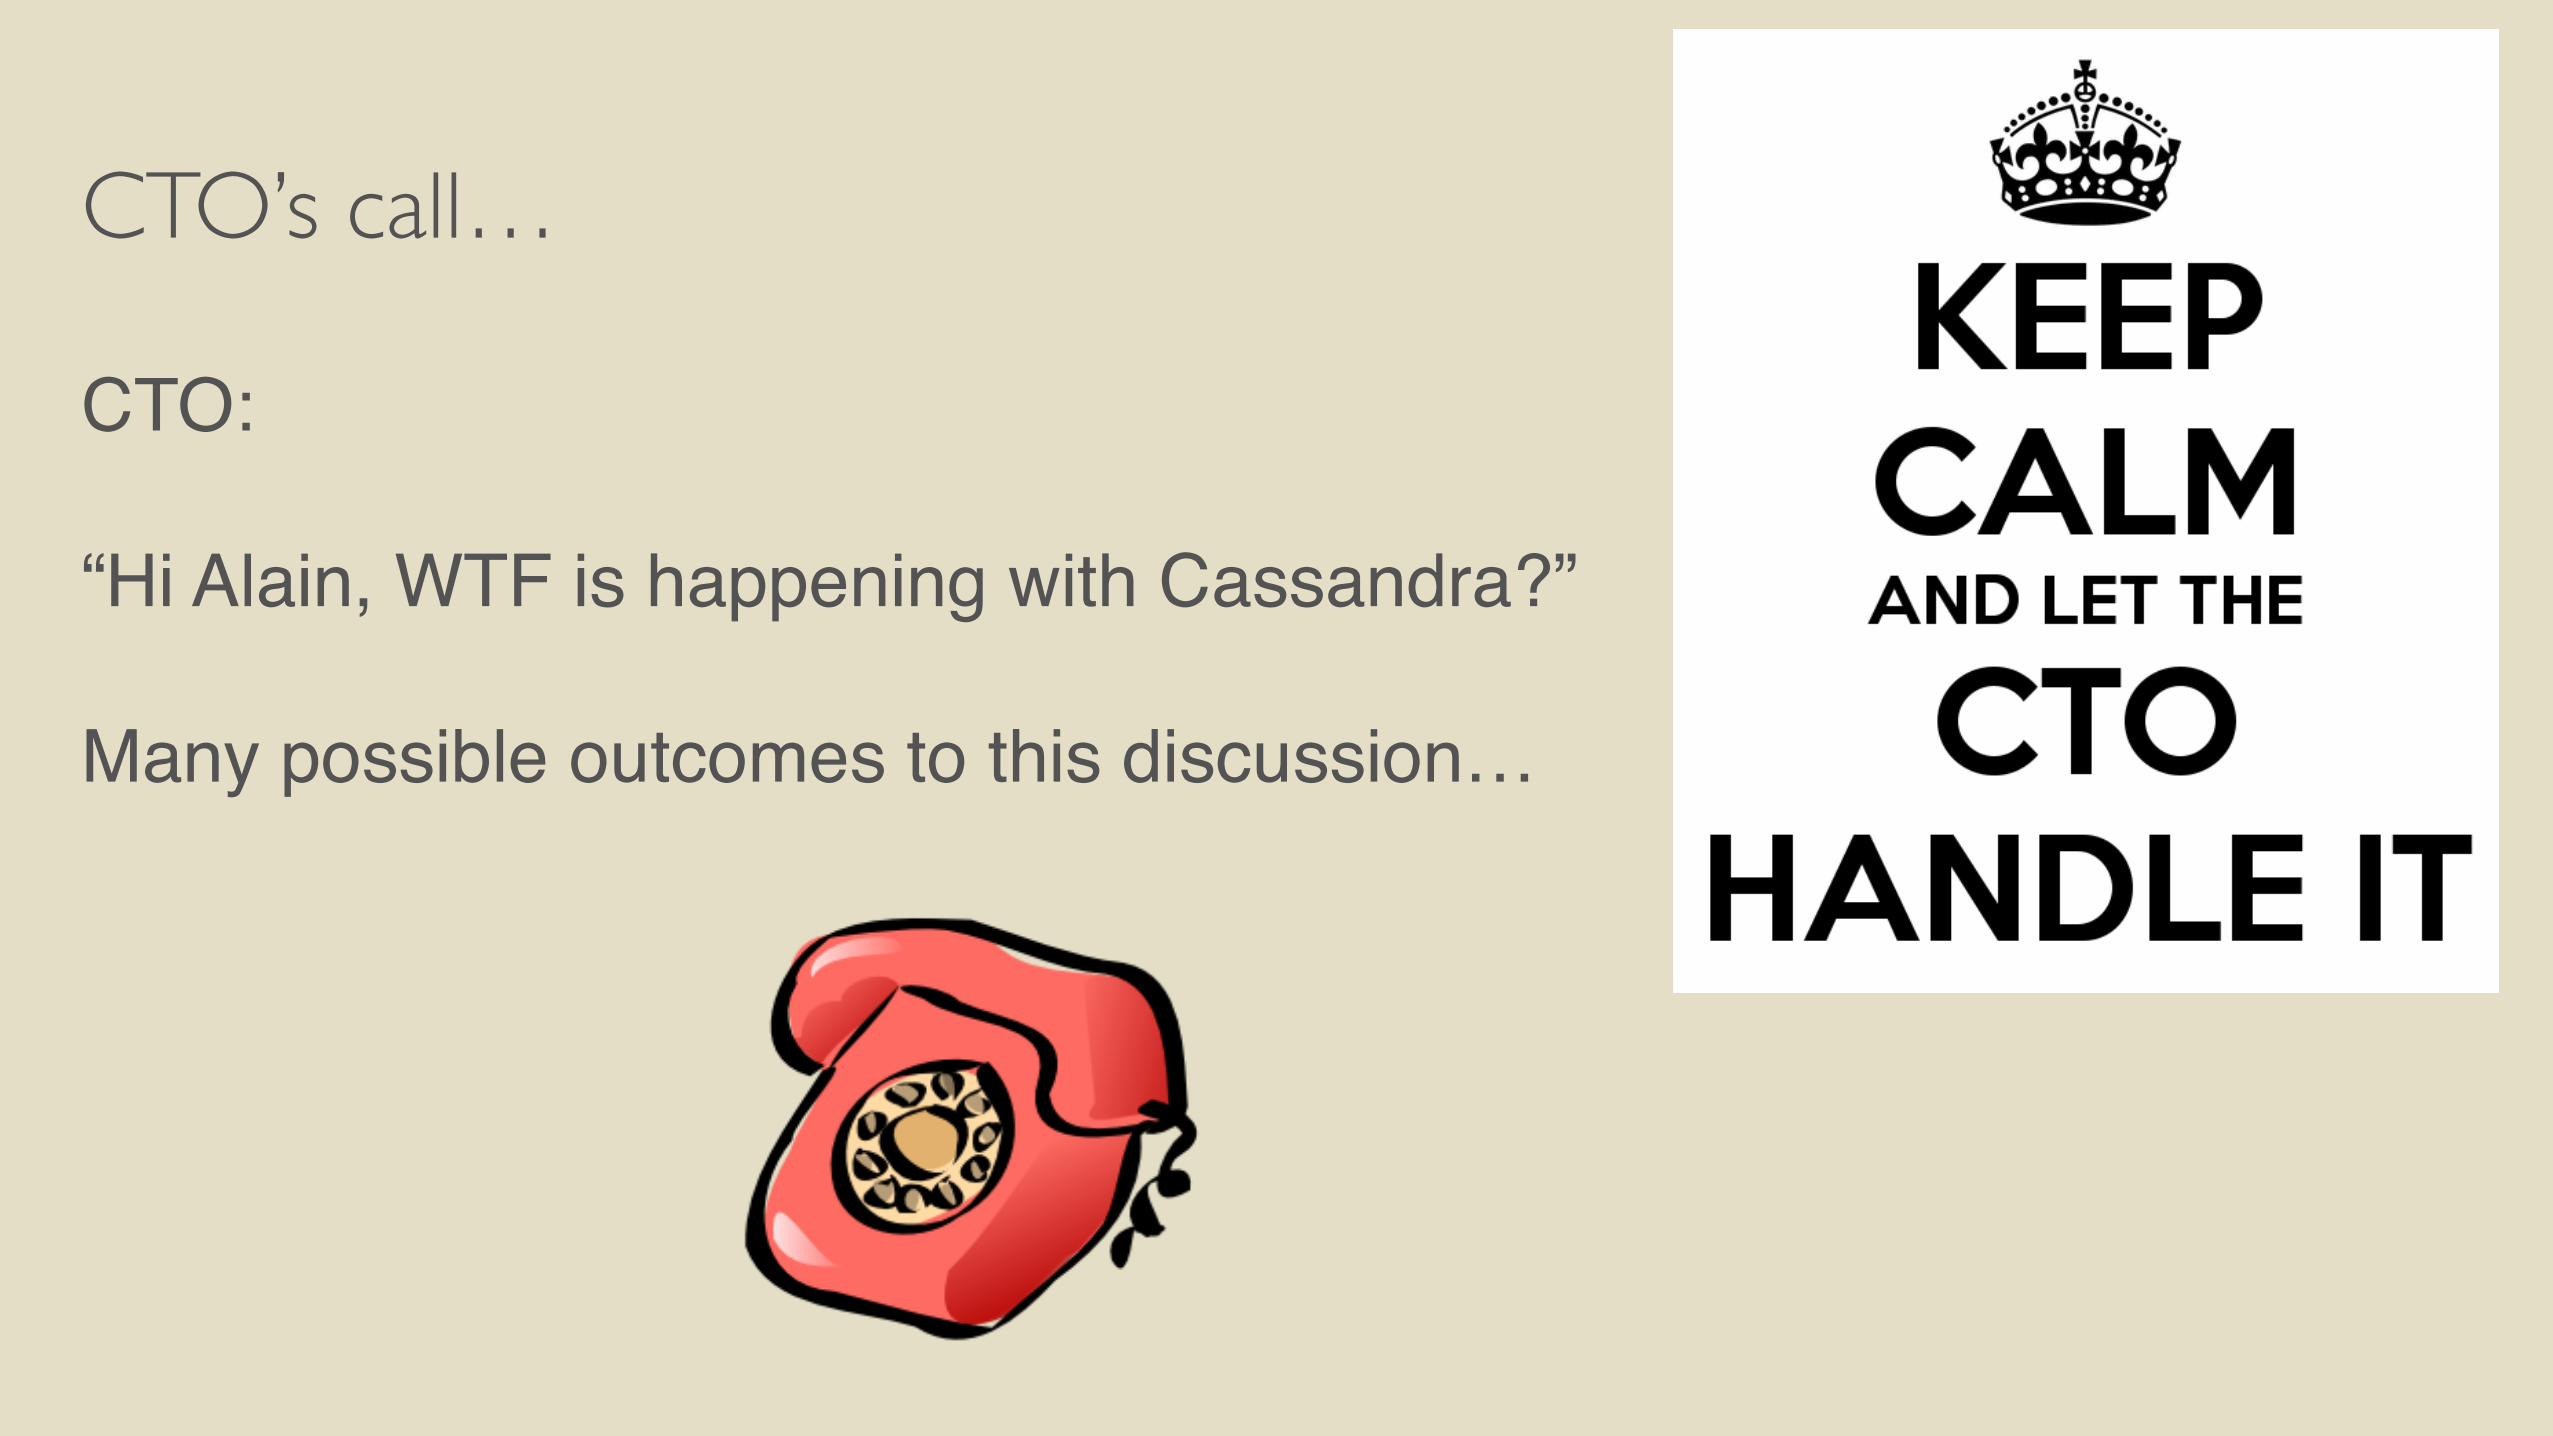
CTO’s call…
CTO:
“Hi Alain, WTF is happening with Cassandra?”
Many possible outcomes to this discussion…
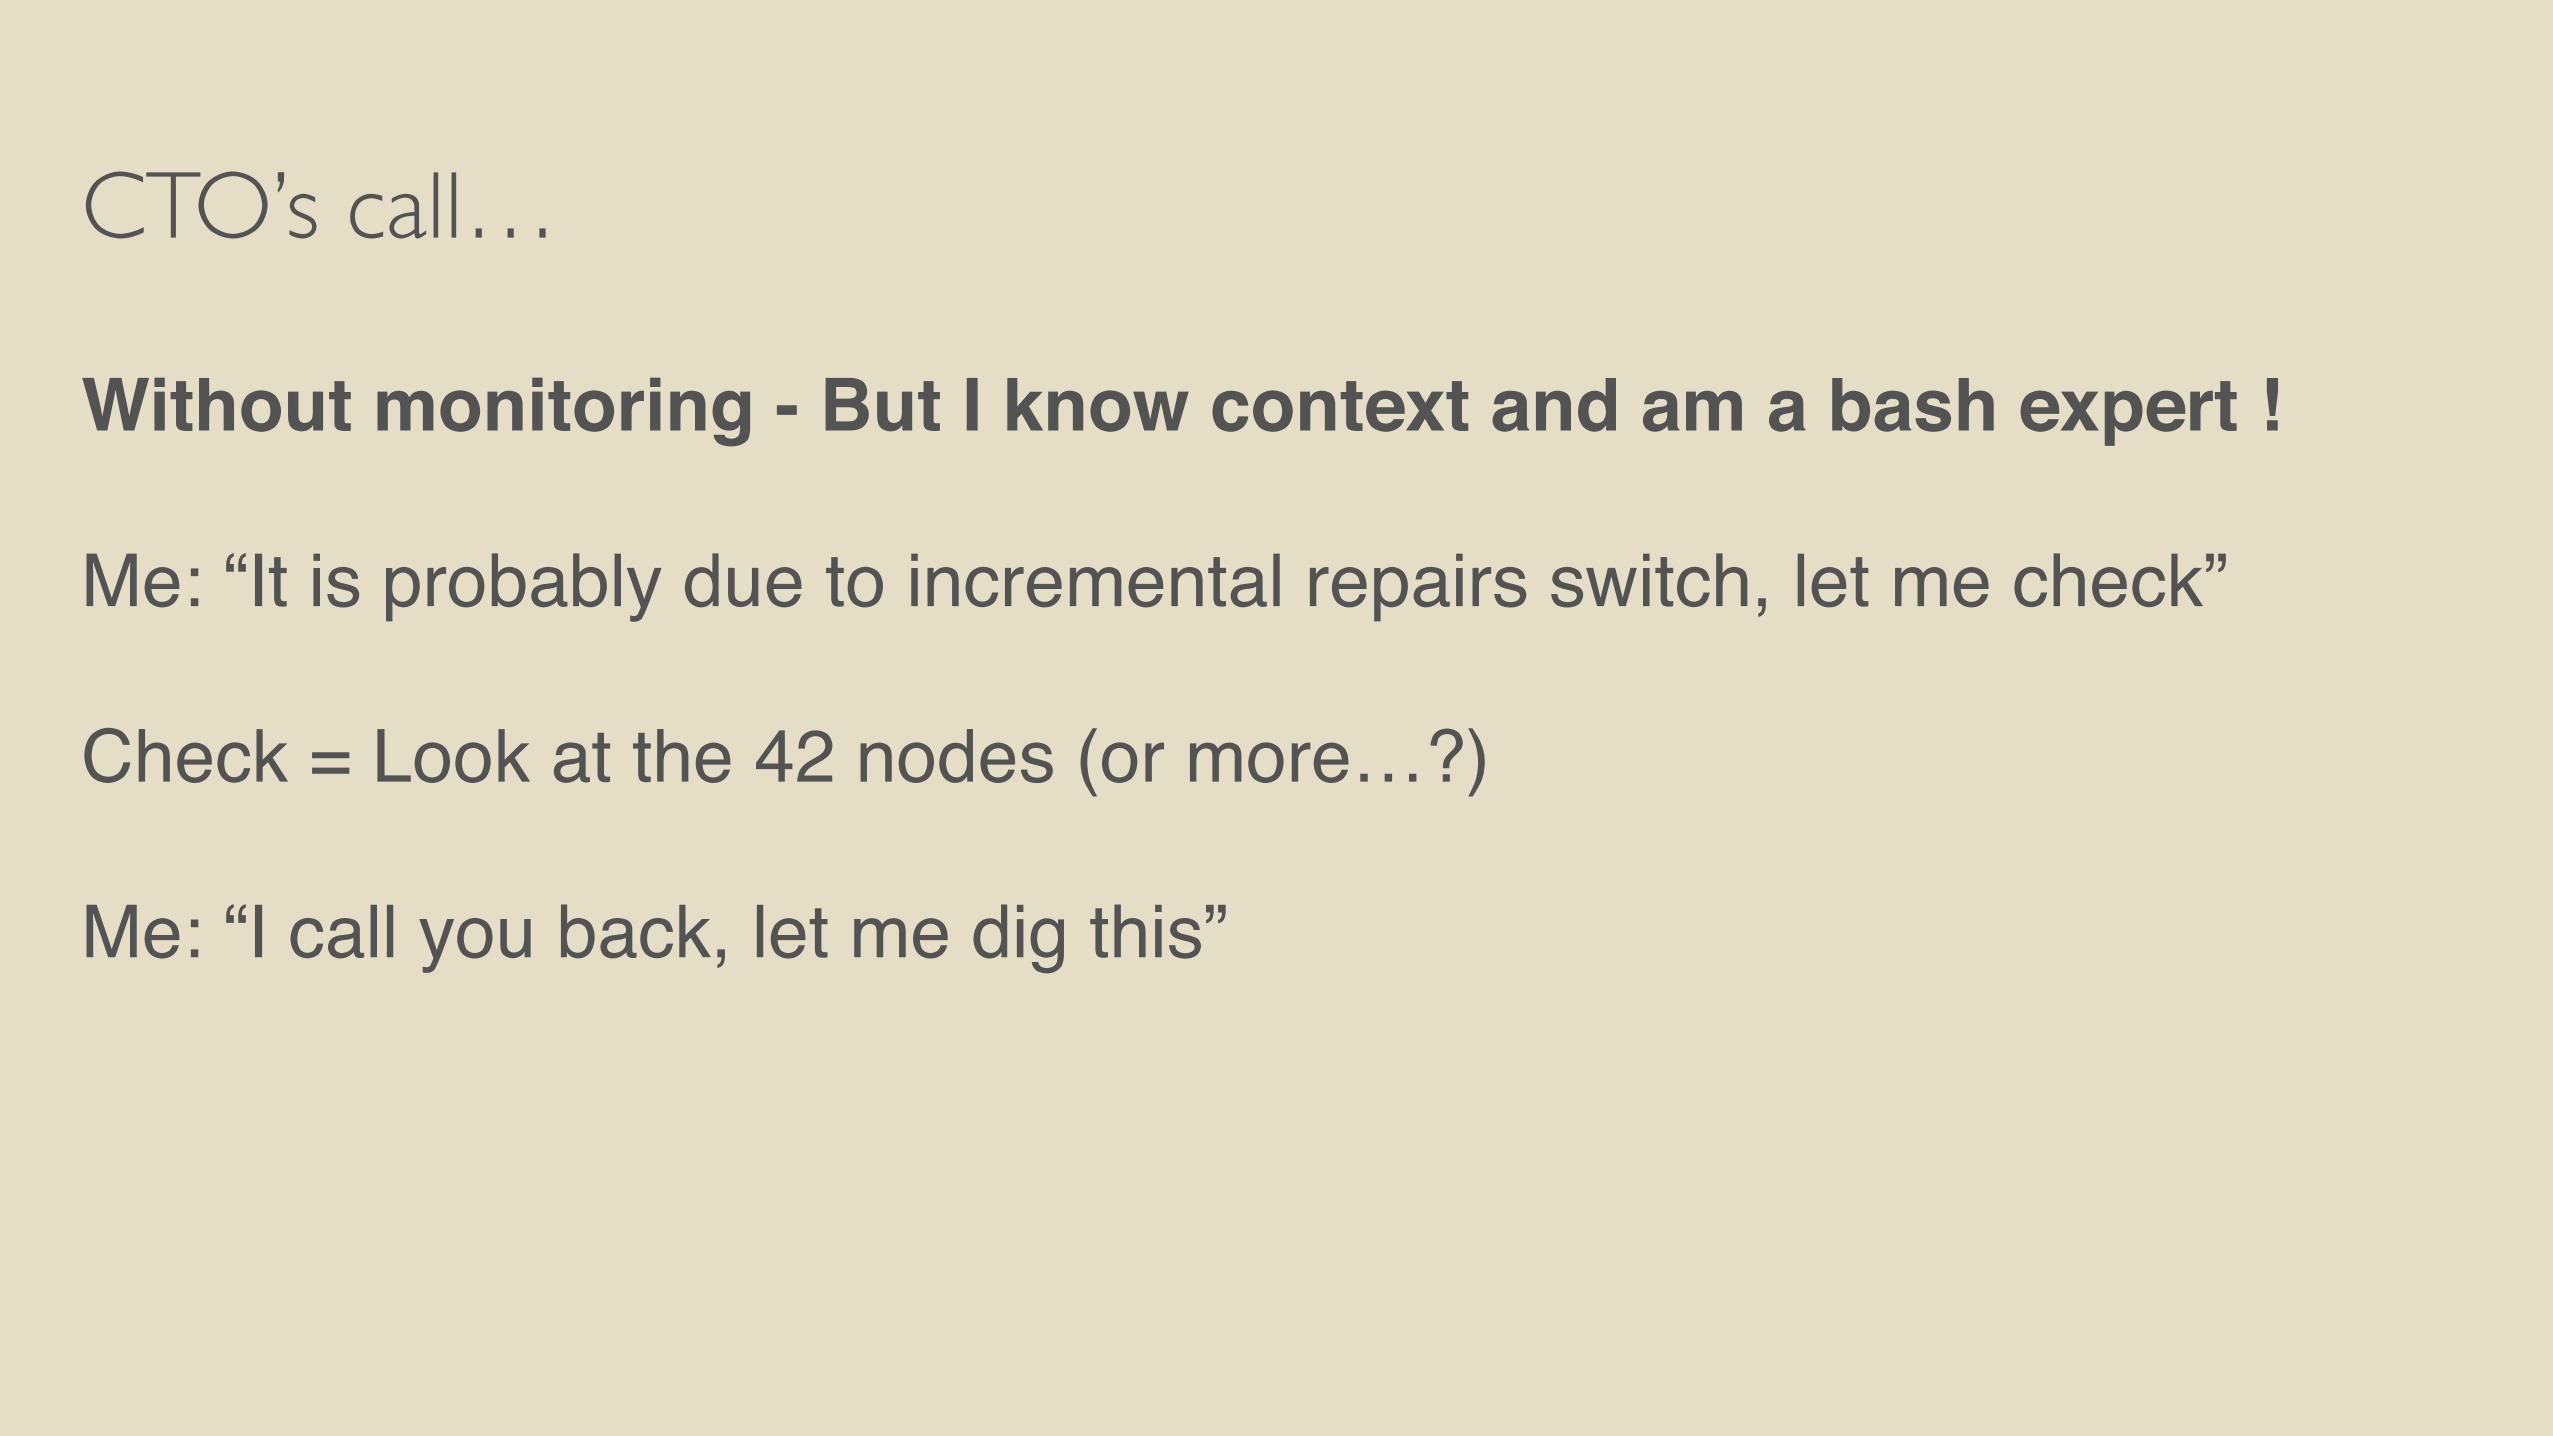
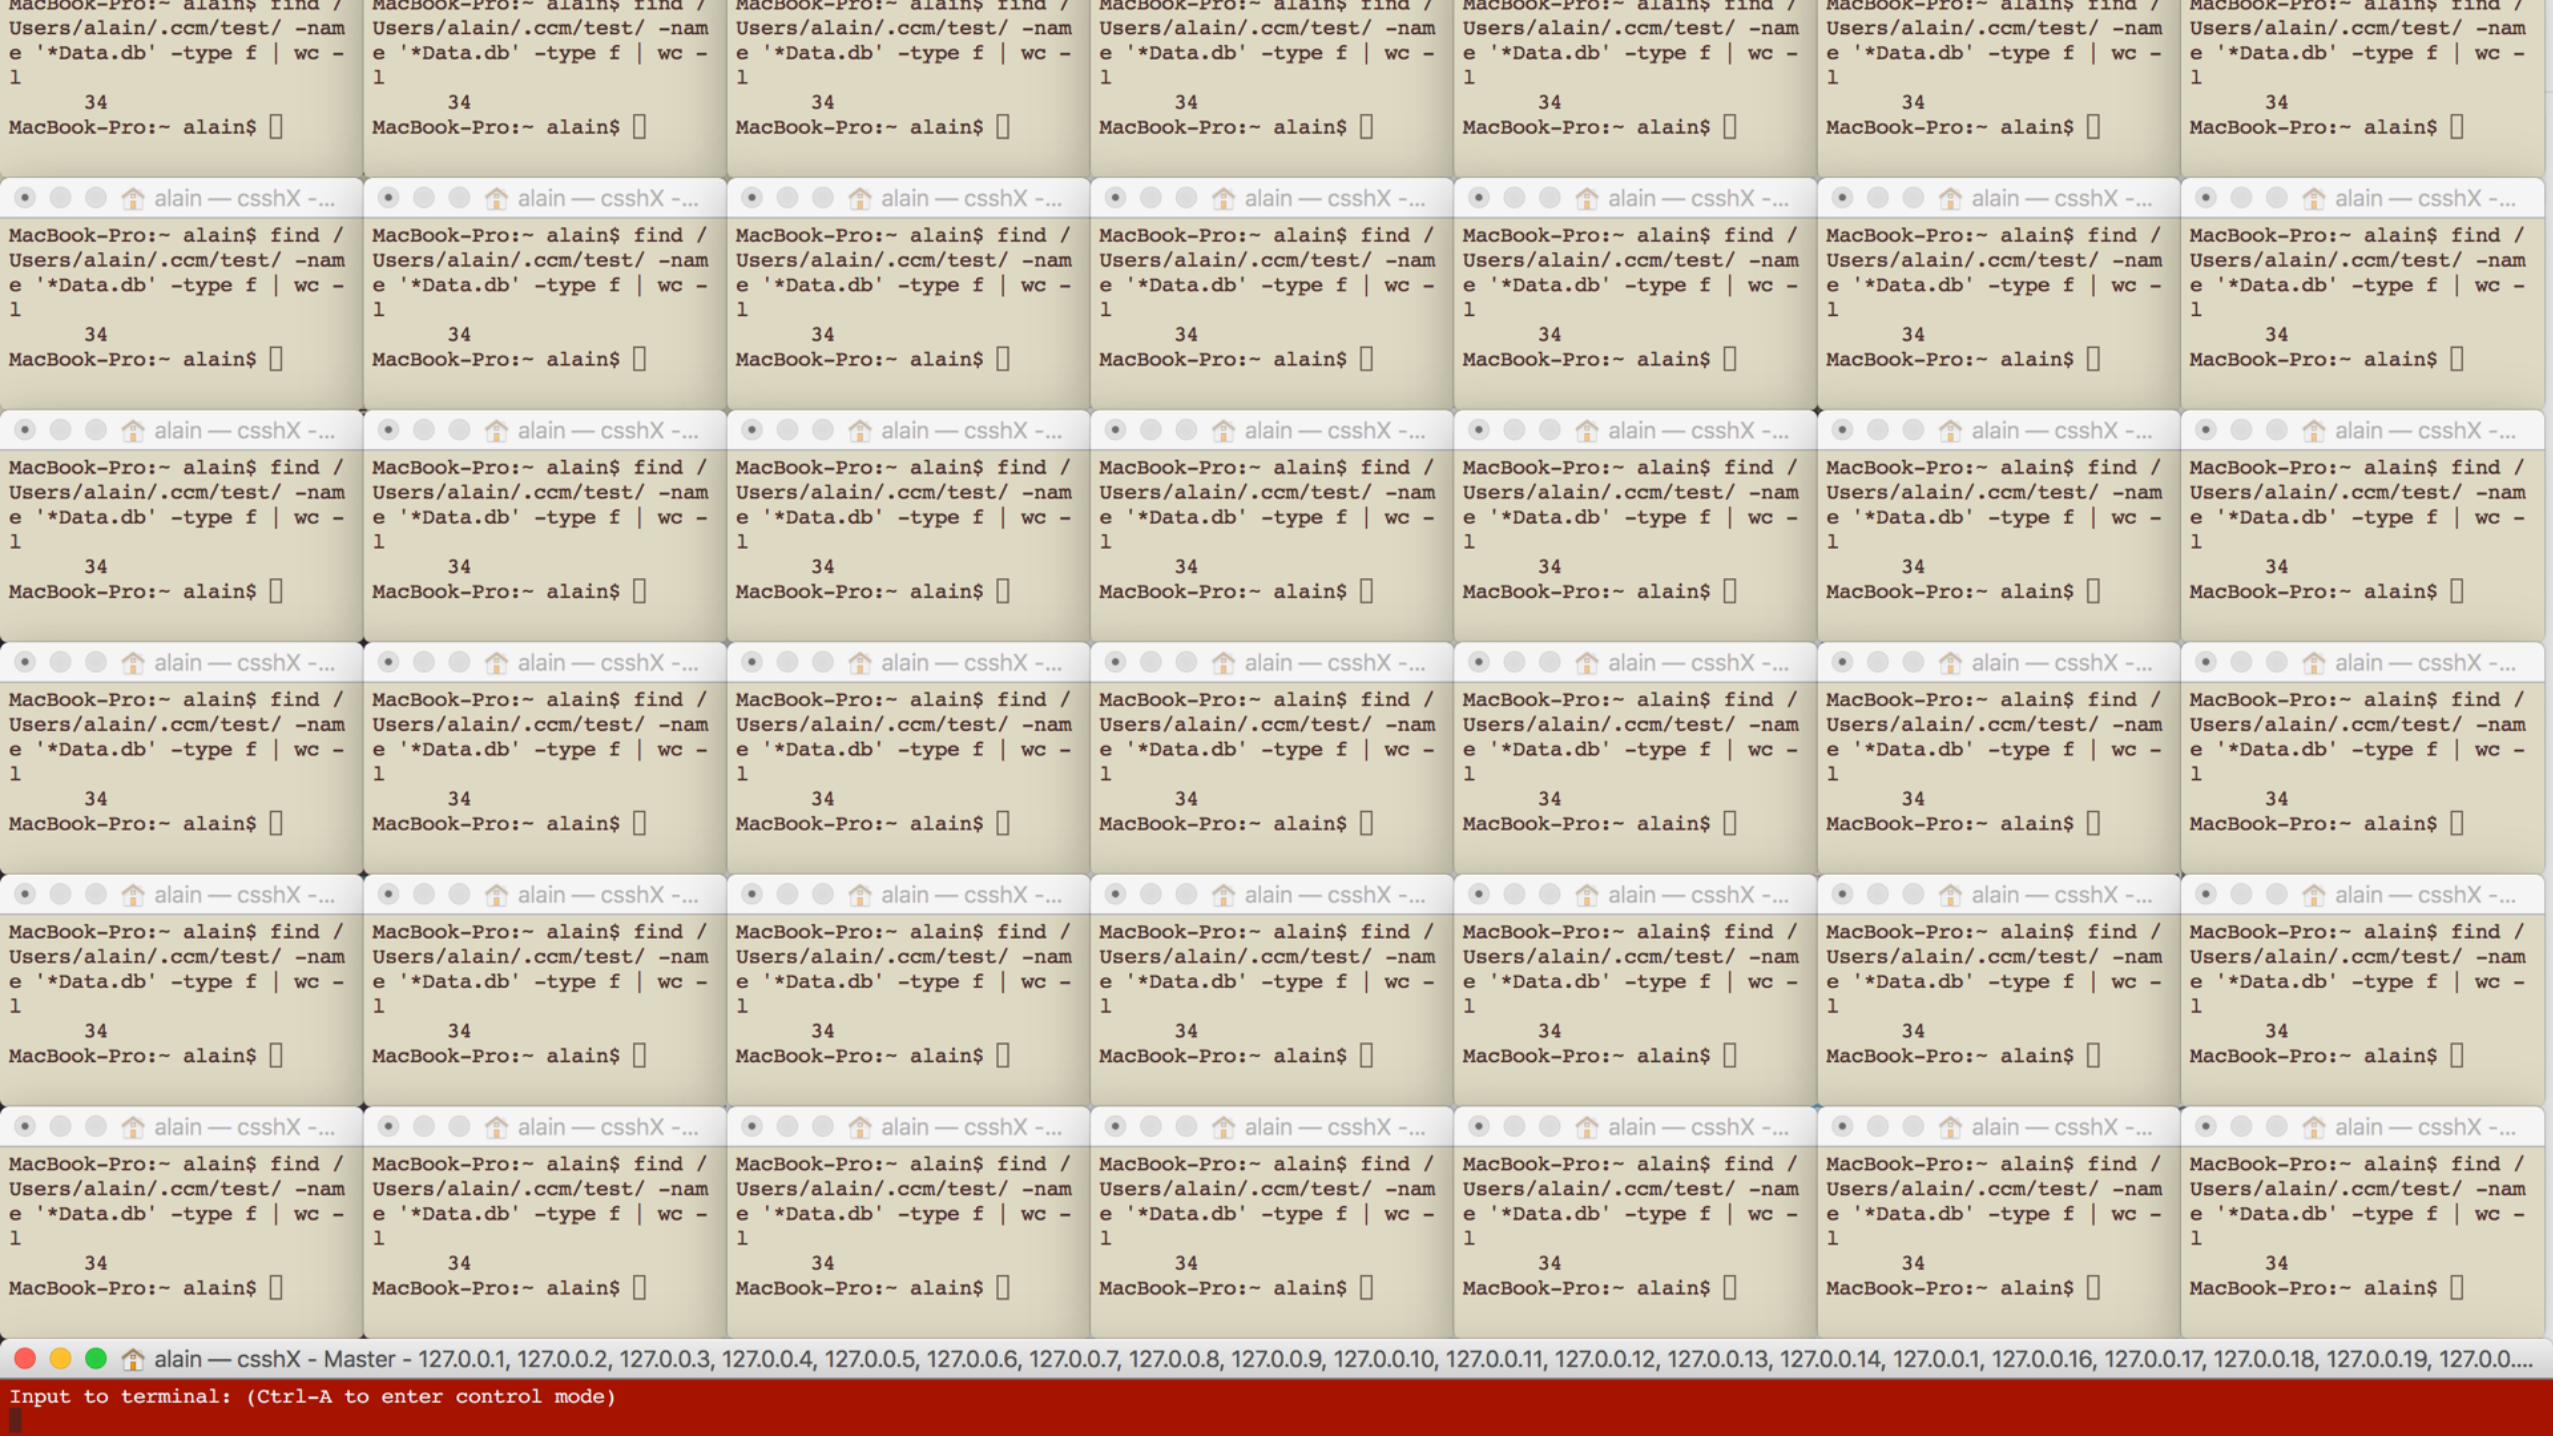
CTO’s call…
Without monitoring - But I know context and am a bash expert !
Me: “It is probably due to incremental repairs switch, let me check”
Check = Look at the 42 nodes (or more…?)
Me: “I call you back, let me dig this”
CTO’s call…
CTO:
“Hi Alain, WTF is happening with Cassandra?”
Many possible outcomes to this discussion…
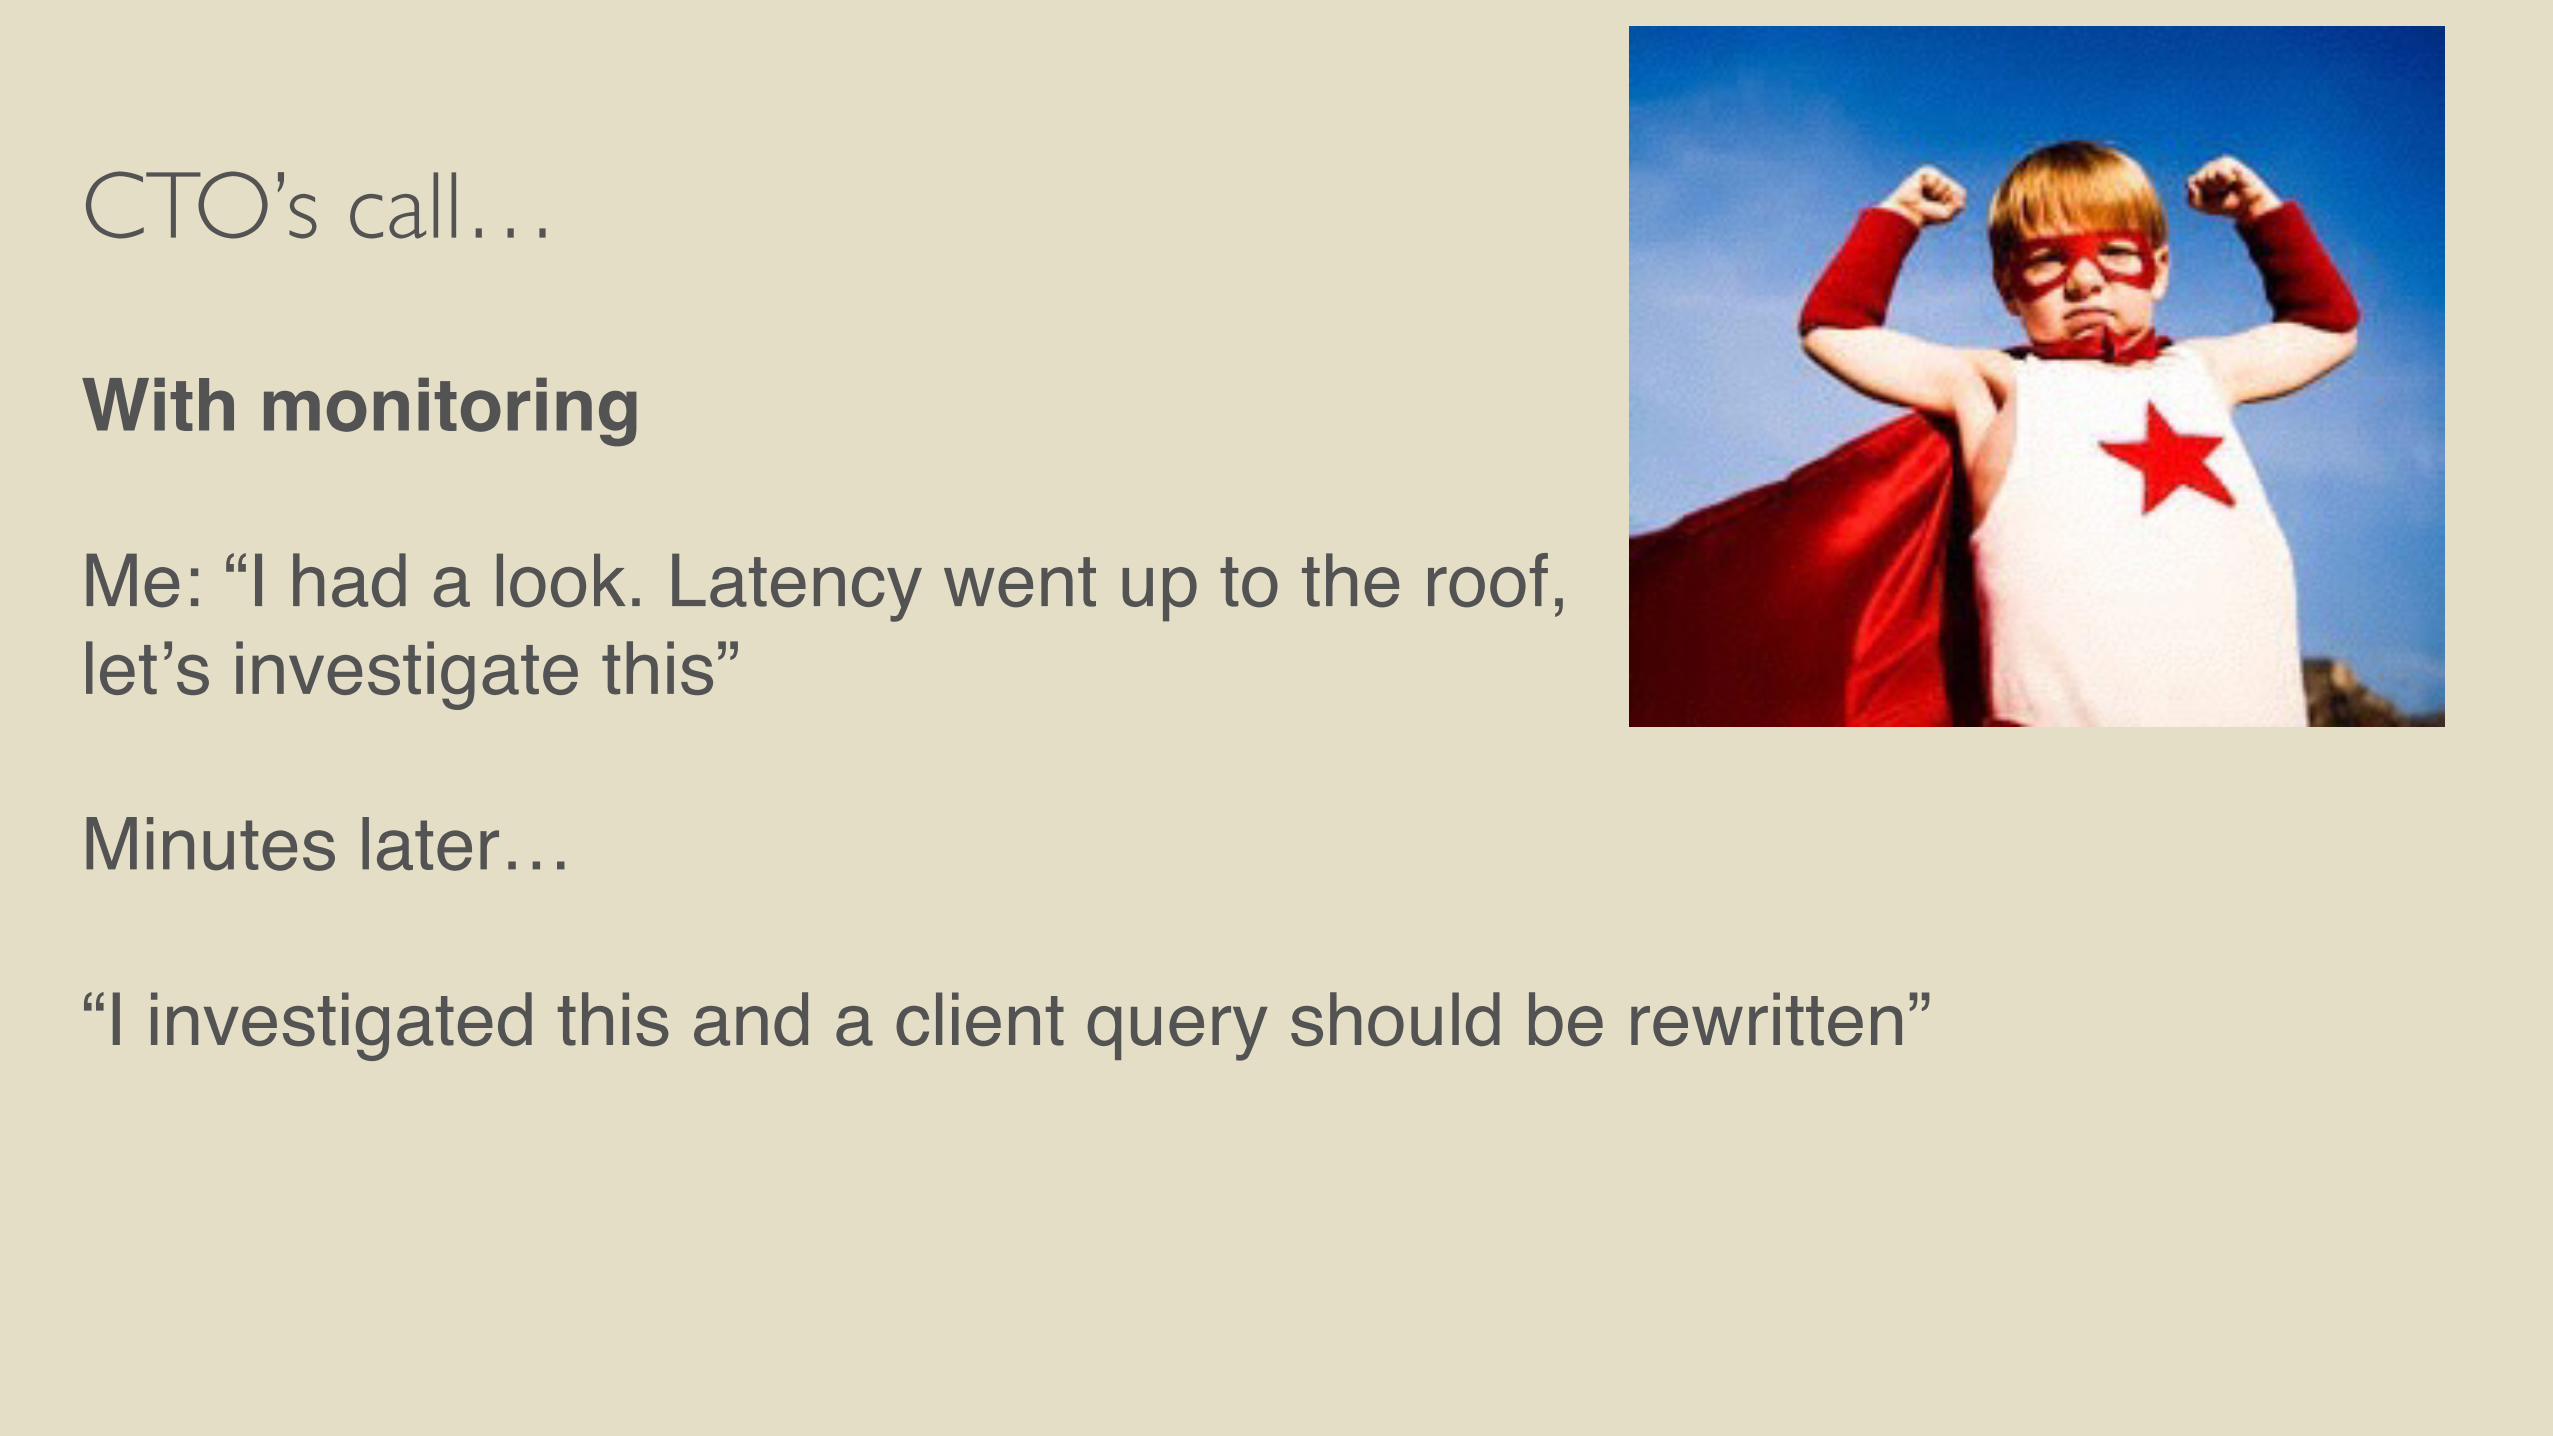
CTO’s call…
With monitoring
Me: “I had a look. Latency went up to the roof, letʼs investigate this”
Minutes later…
“I investigated this and a client query should be rewritten”
CTO’s call…
CTO:
“Hi Alain, WTF is happening with Cassandra?”
Many possible outcomes to this discussion…
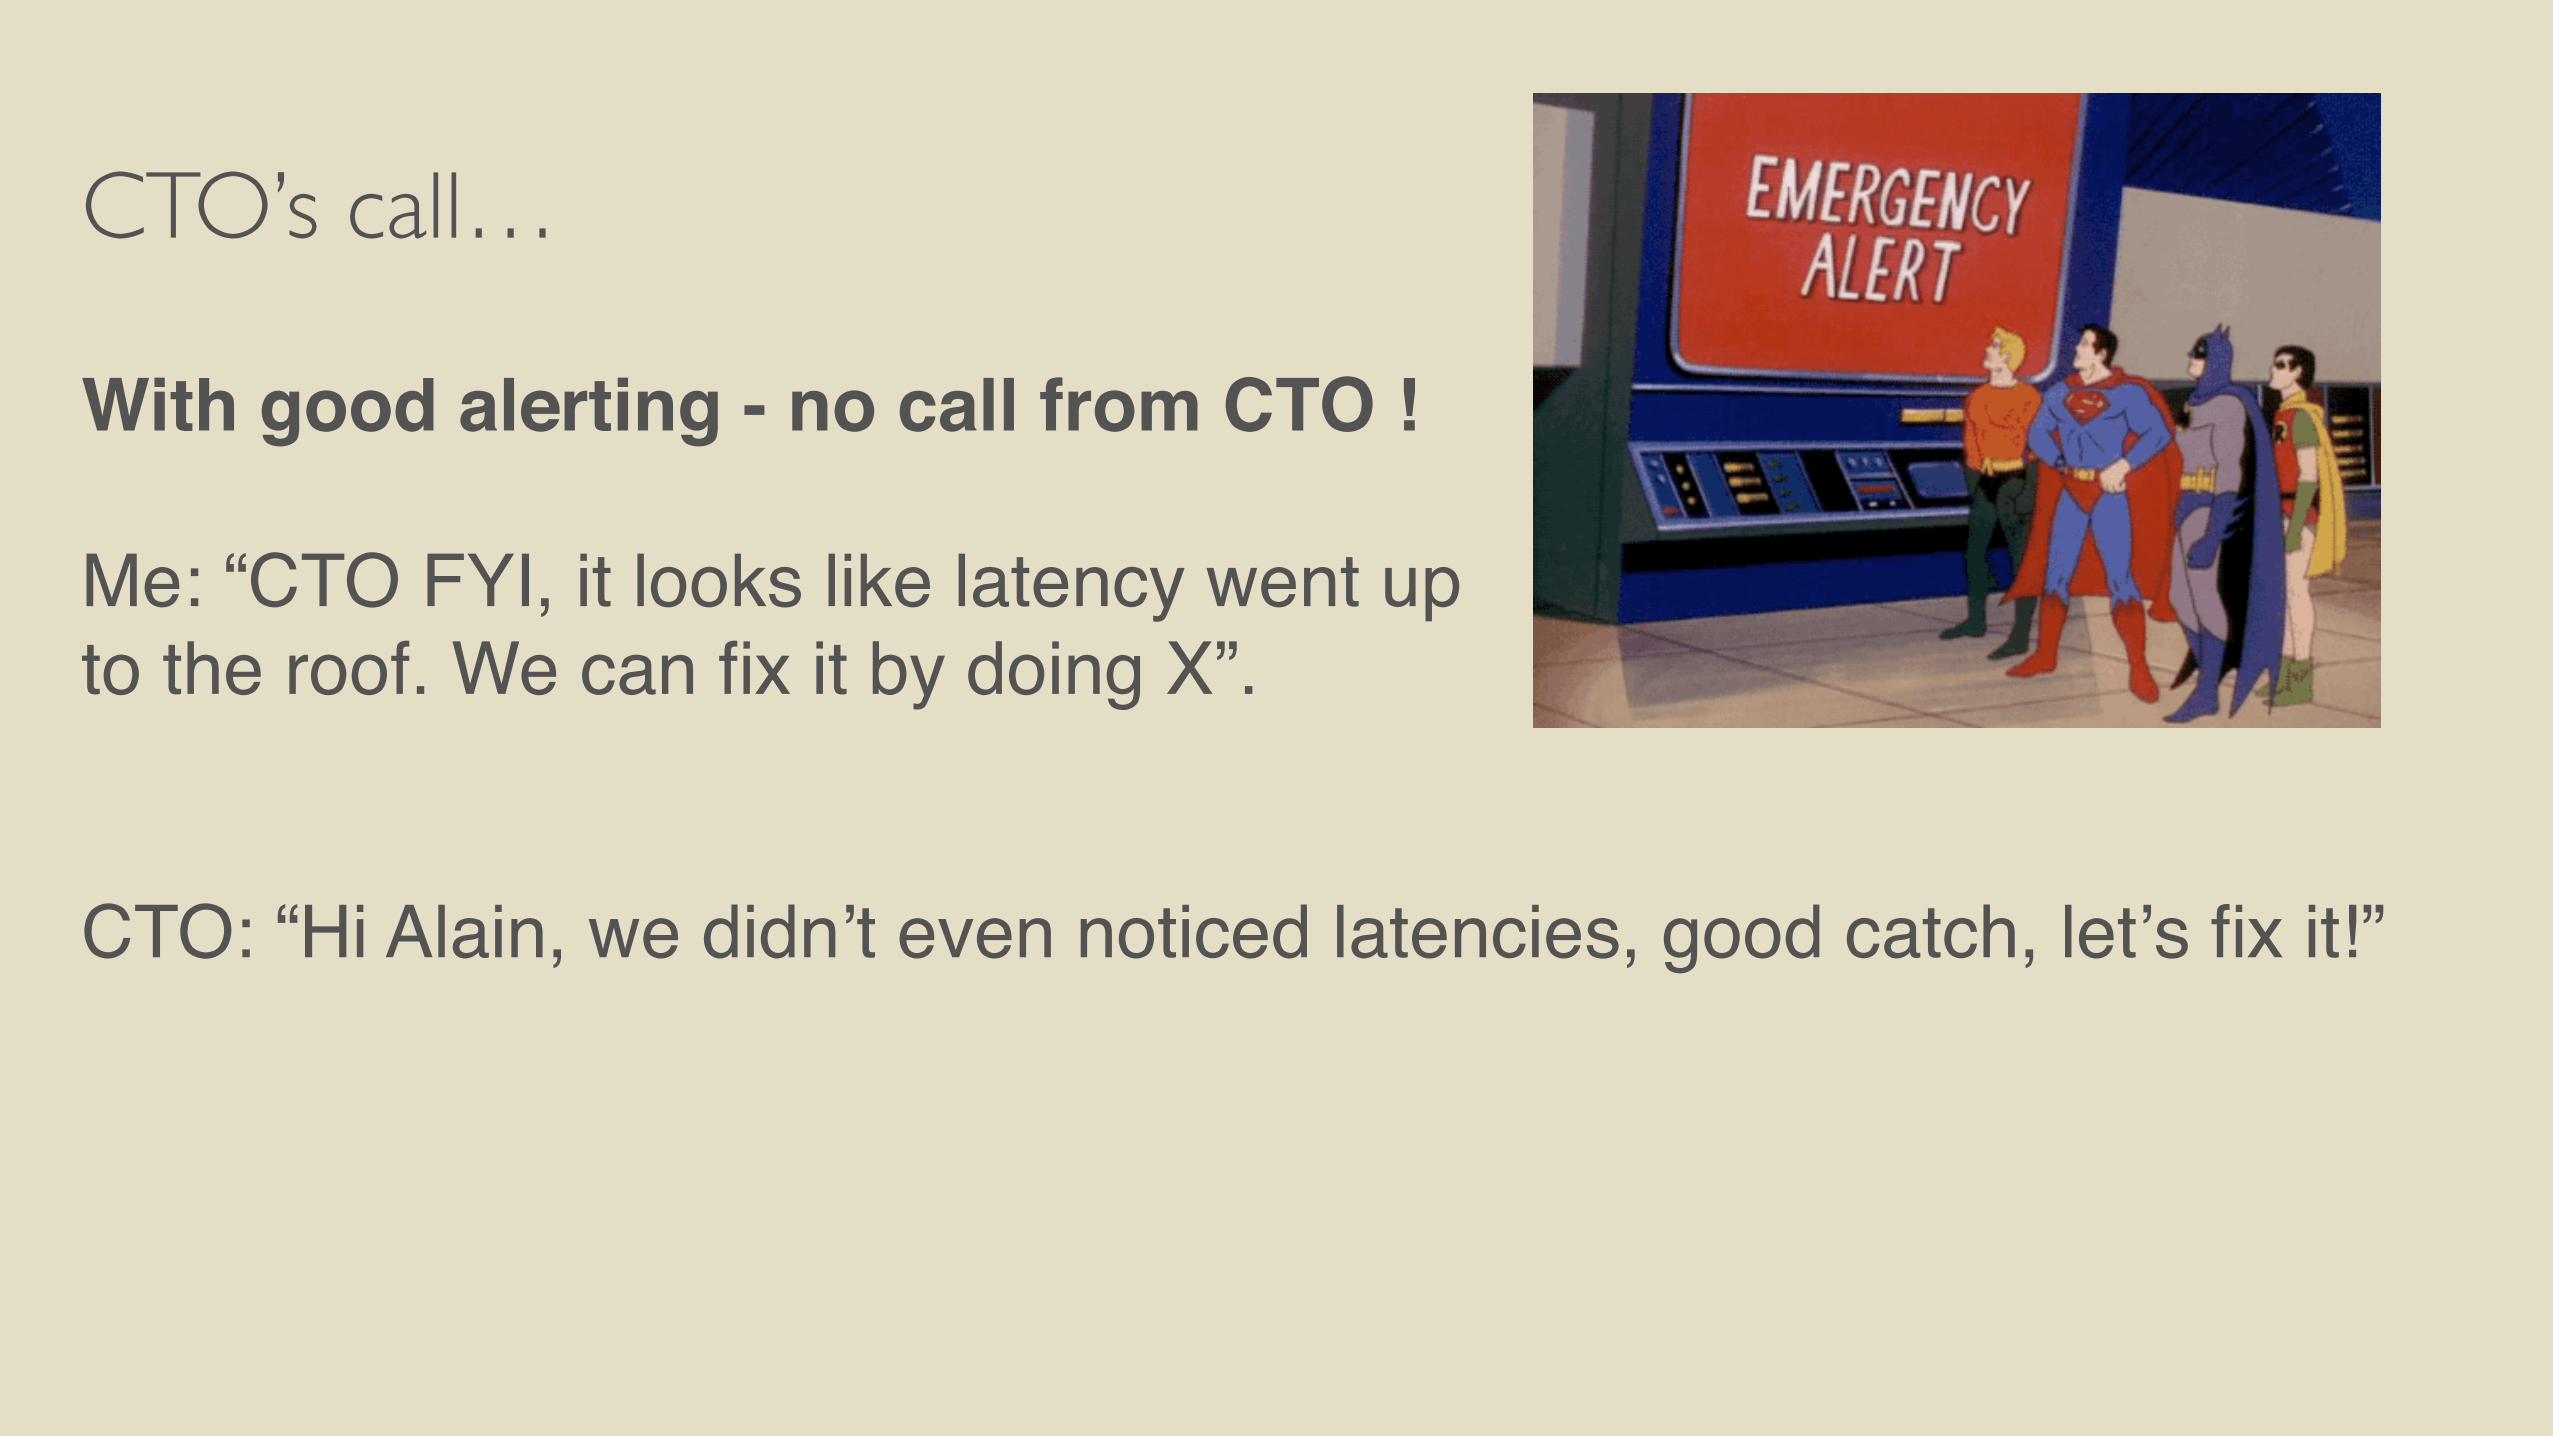
CTO’s call…
With good alerting - no call from CTO !
Me: “CTO FYI, it looks like latency went up to the roof. We can fix it by doing X”.
CTO: “Hi Alain, we didnʼt even noticed latencies, good catch, letʼs fix it!”

Why and what to monitor?
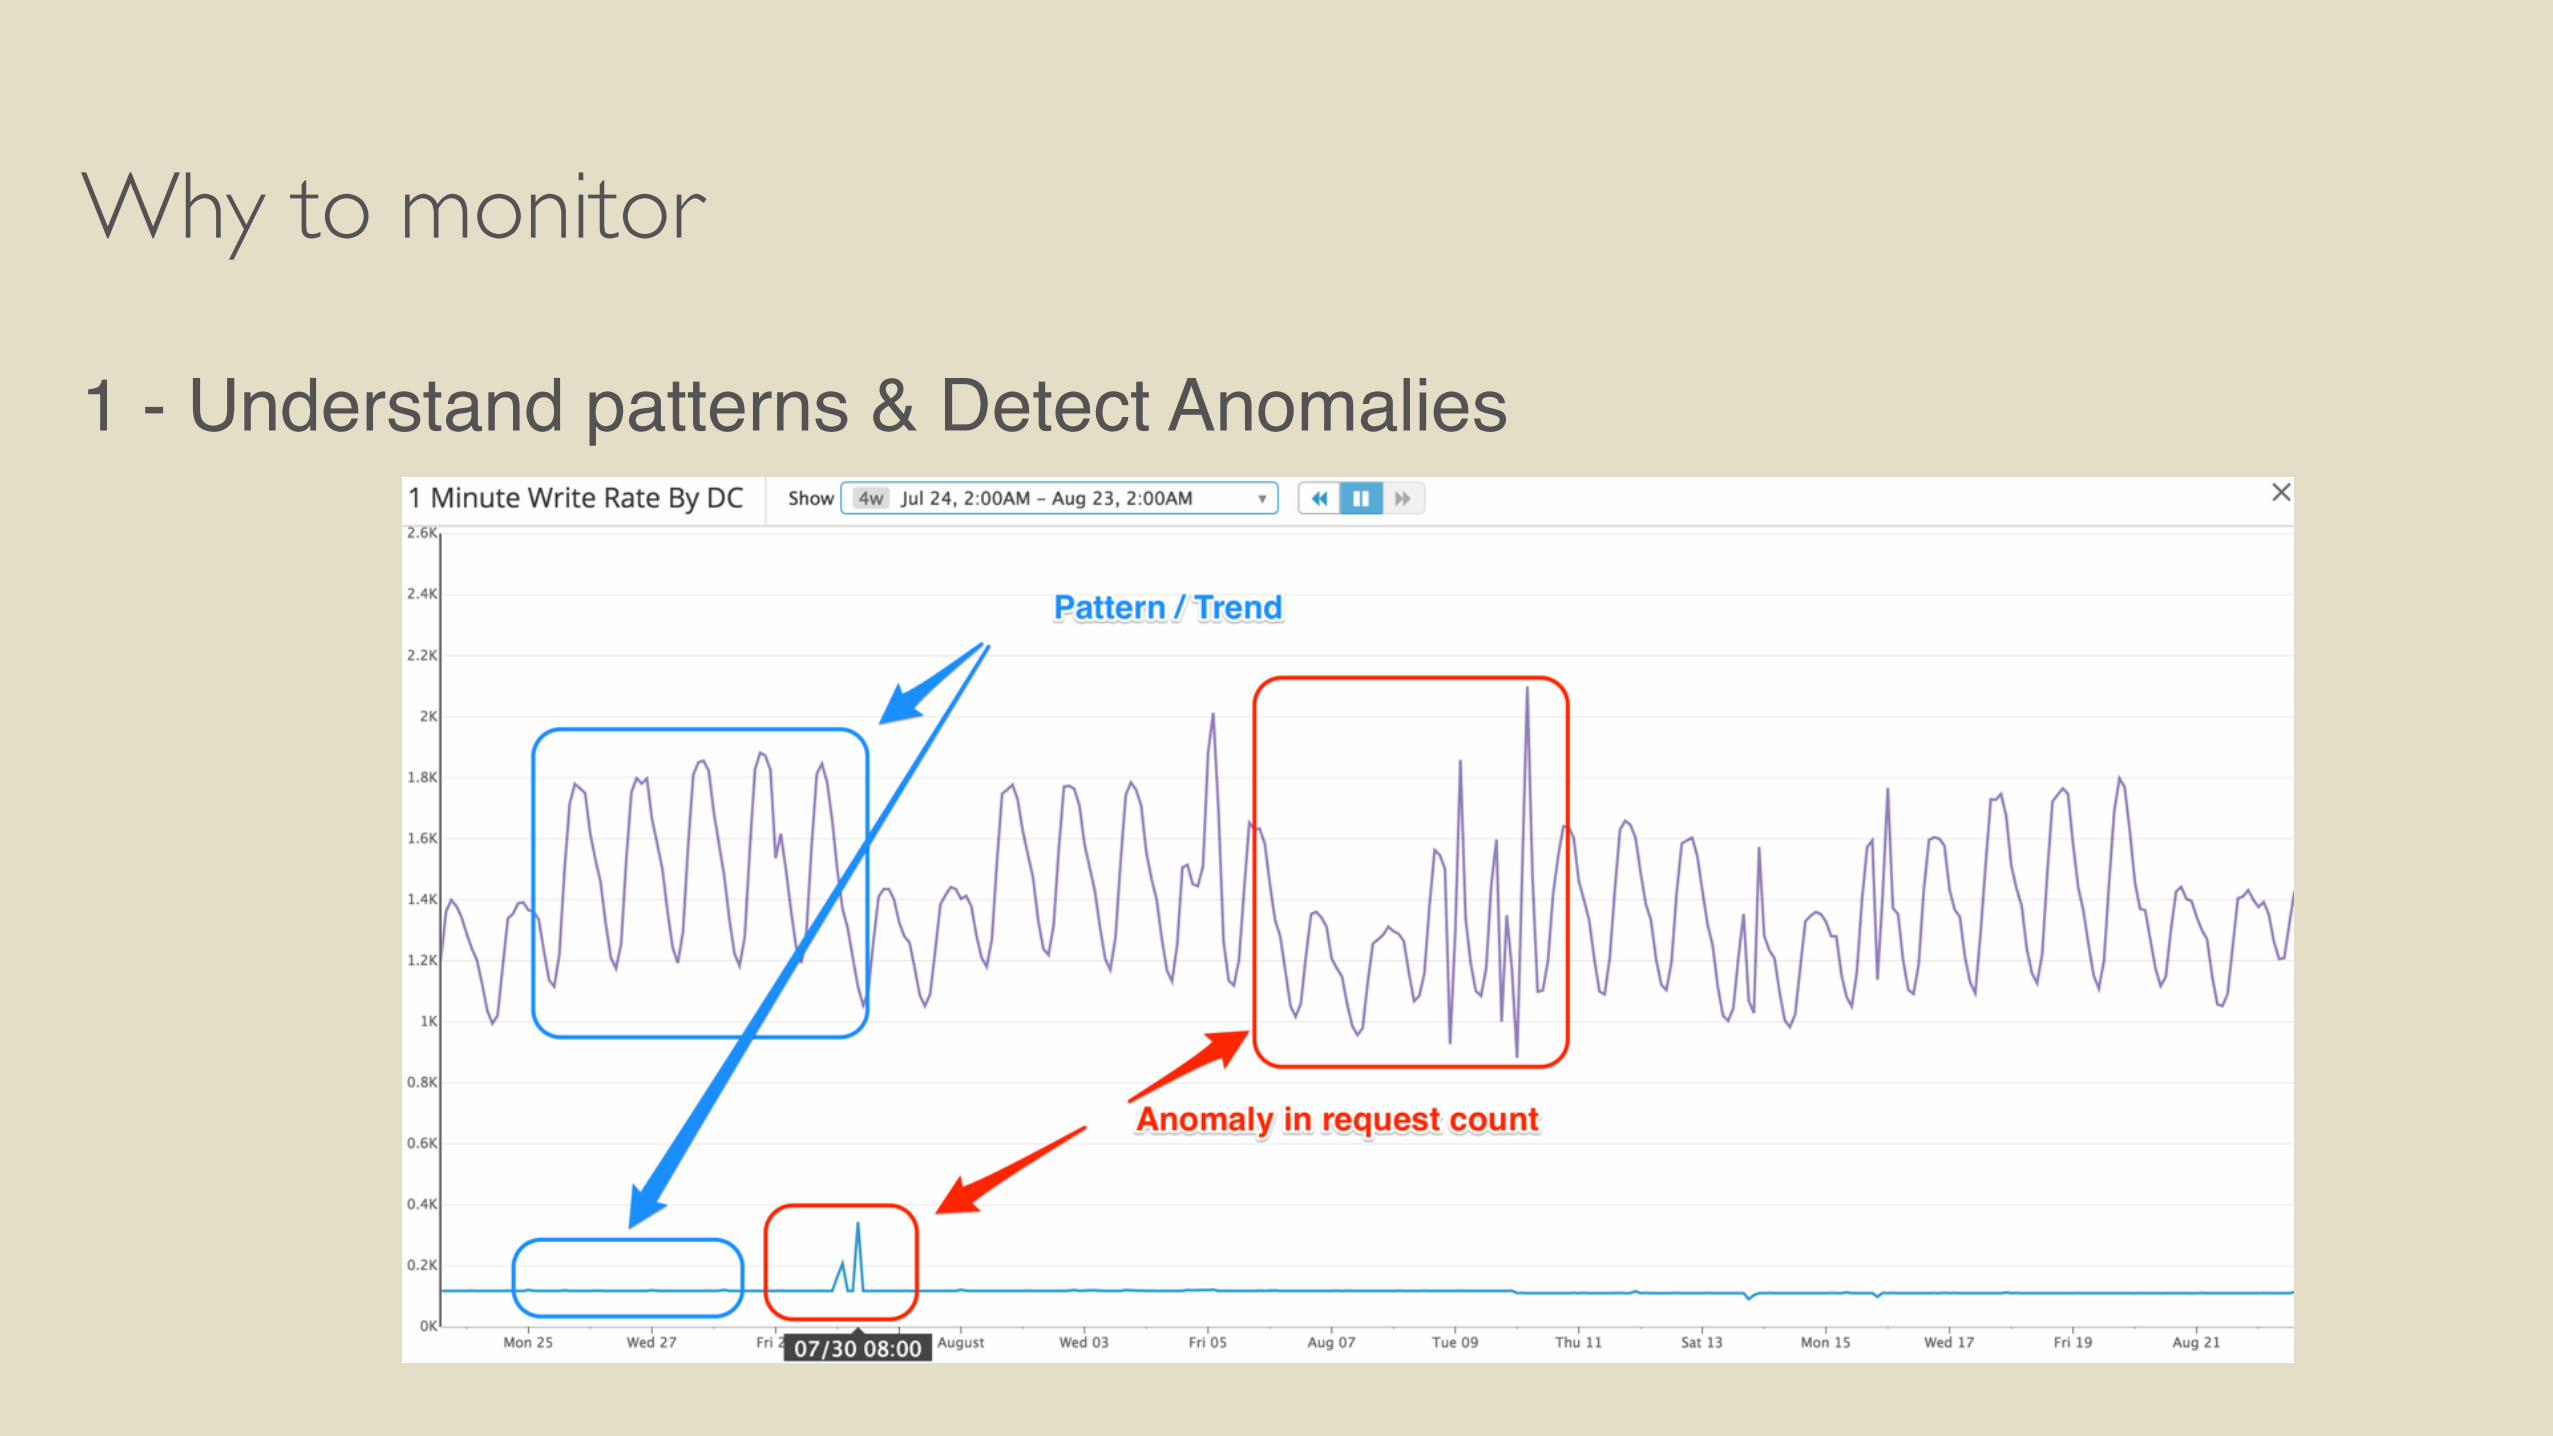
Why to monitor
1 - Understand patterns & Detect Anomalies
Why to monitor
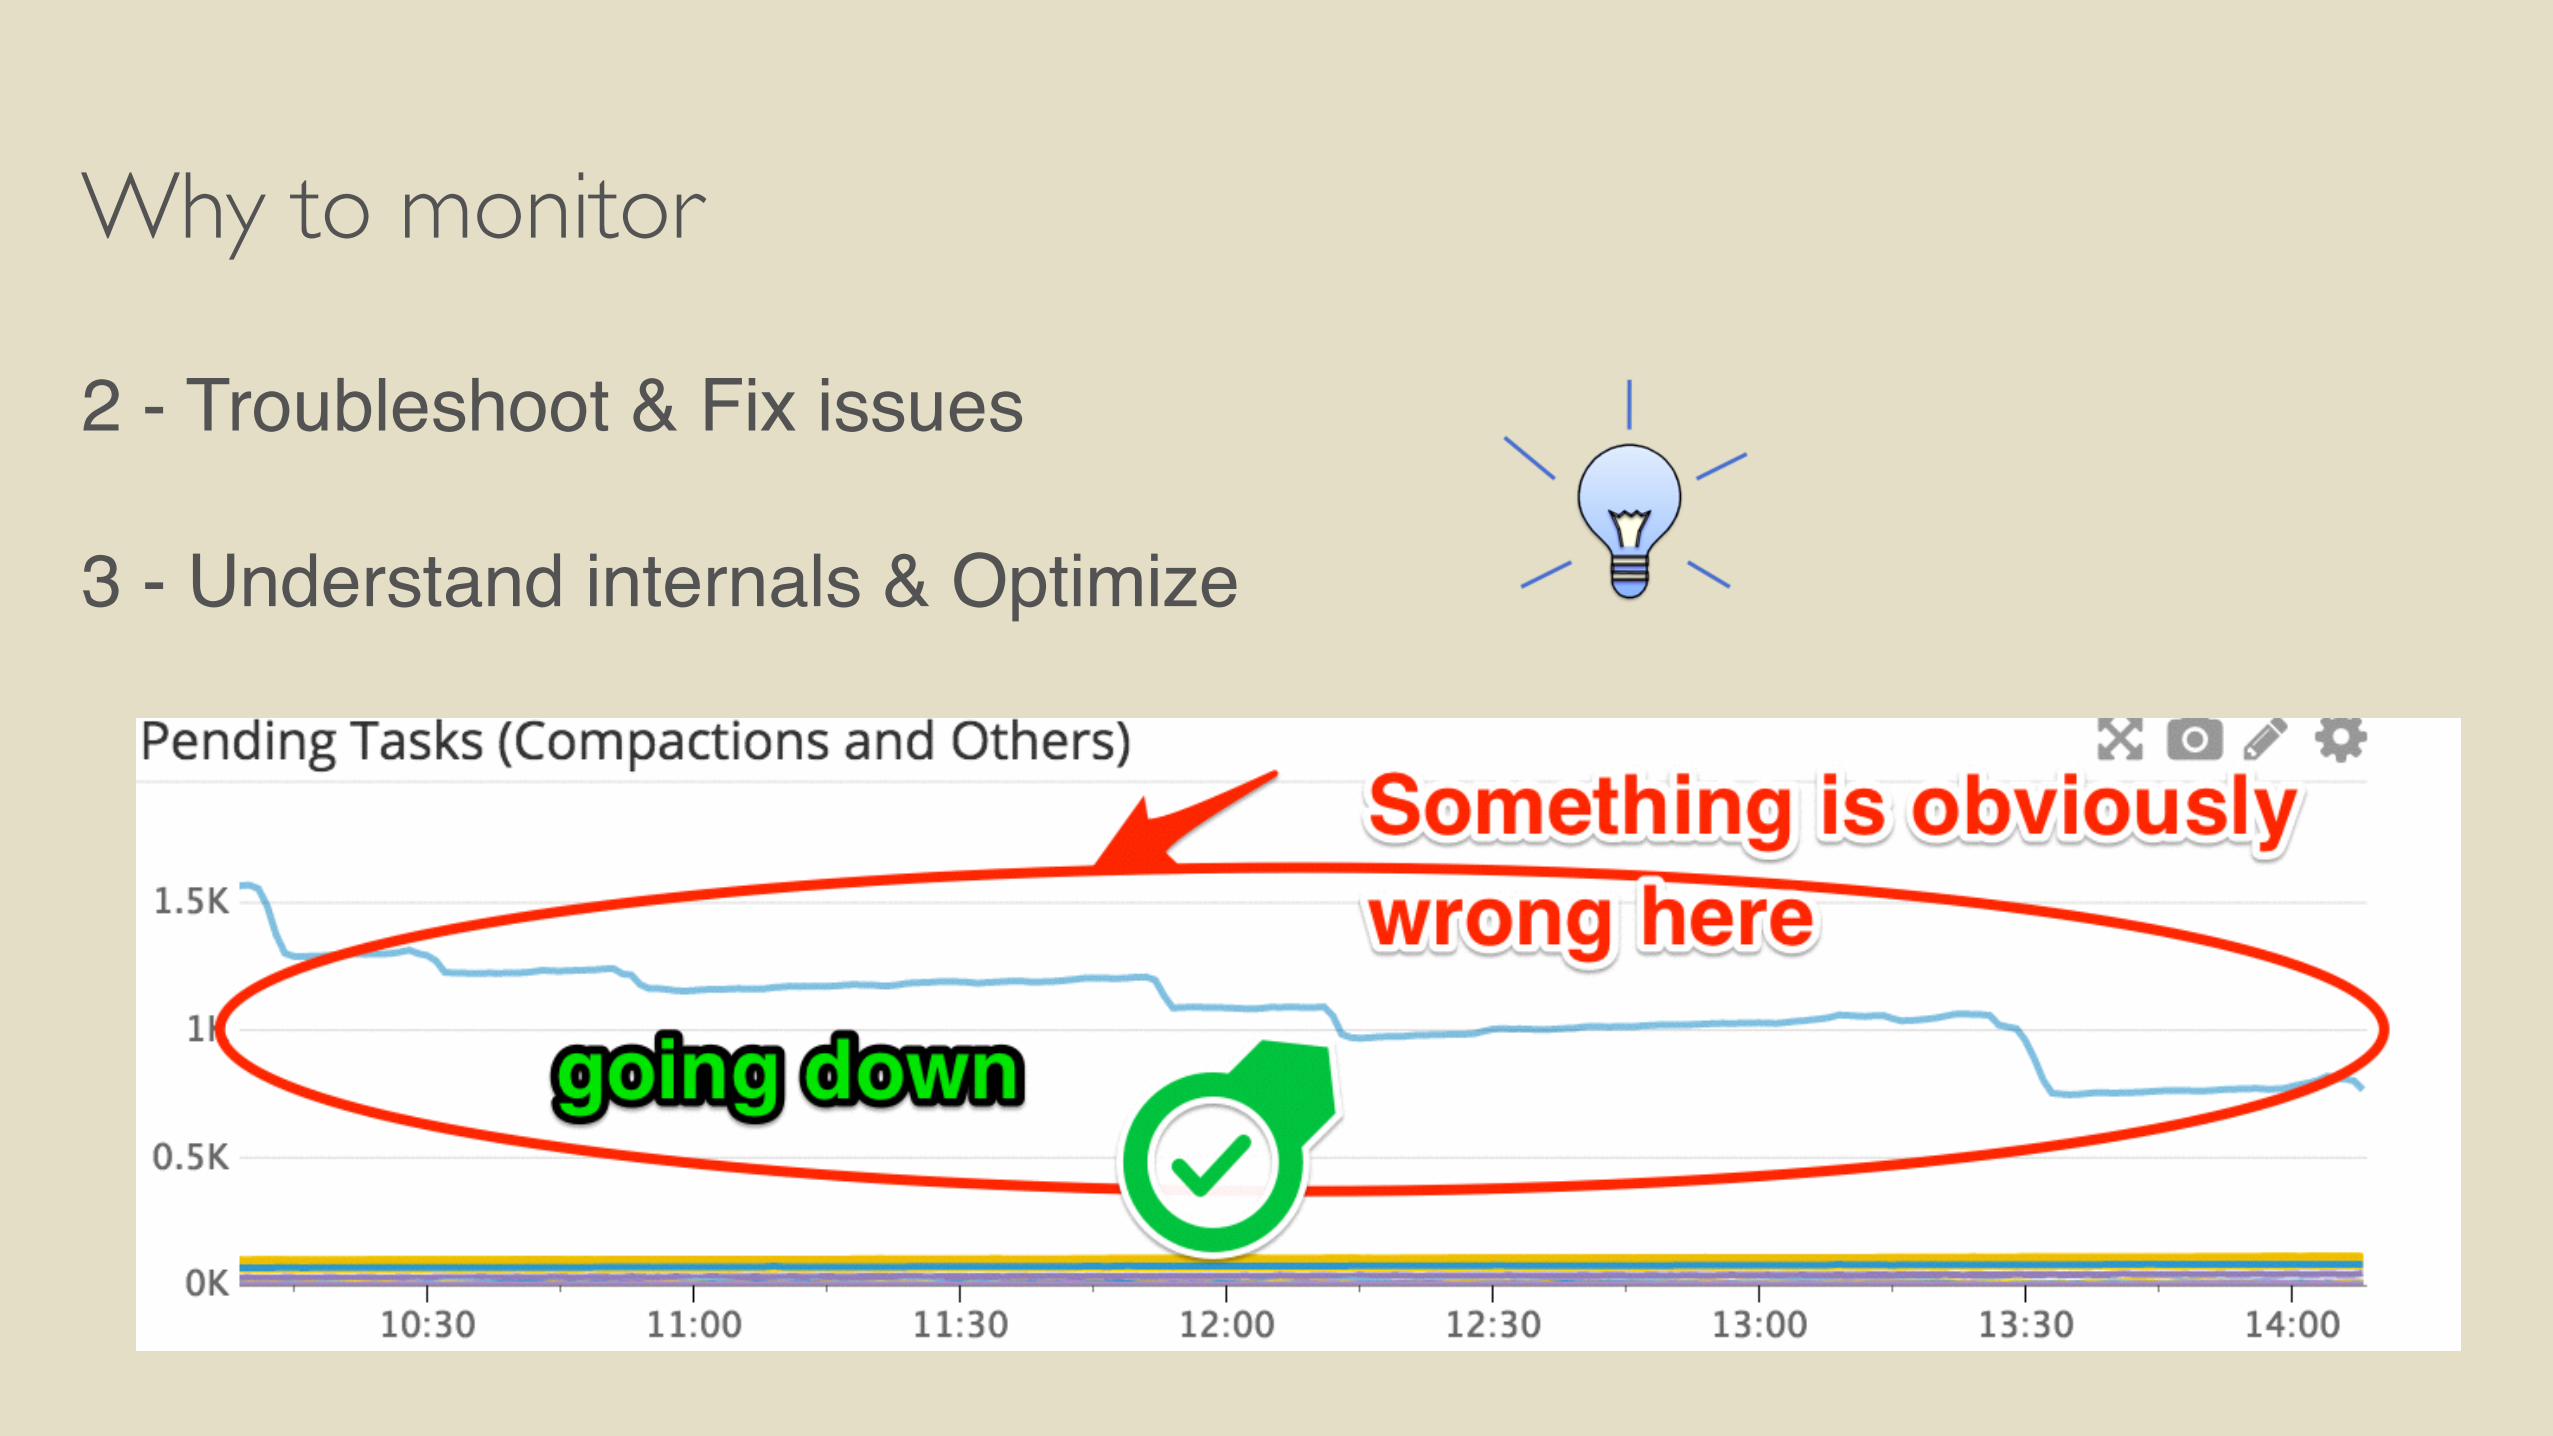
2 - Troubleshoot & Fix issues
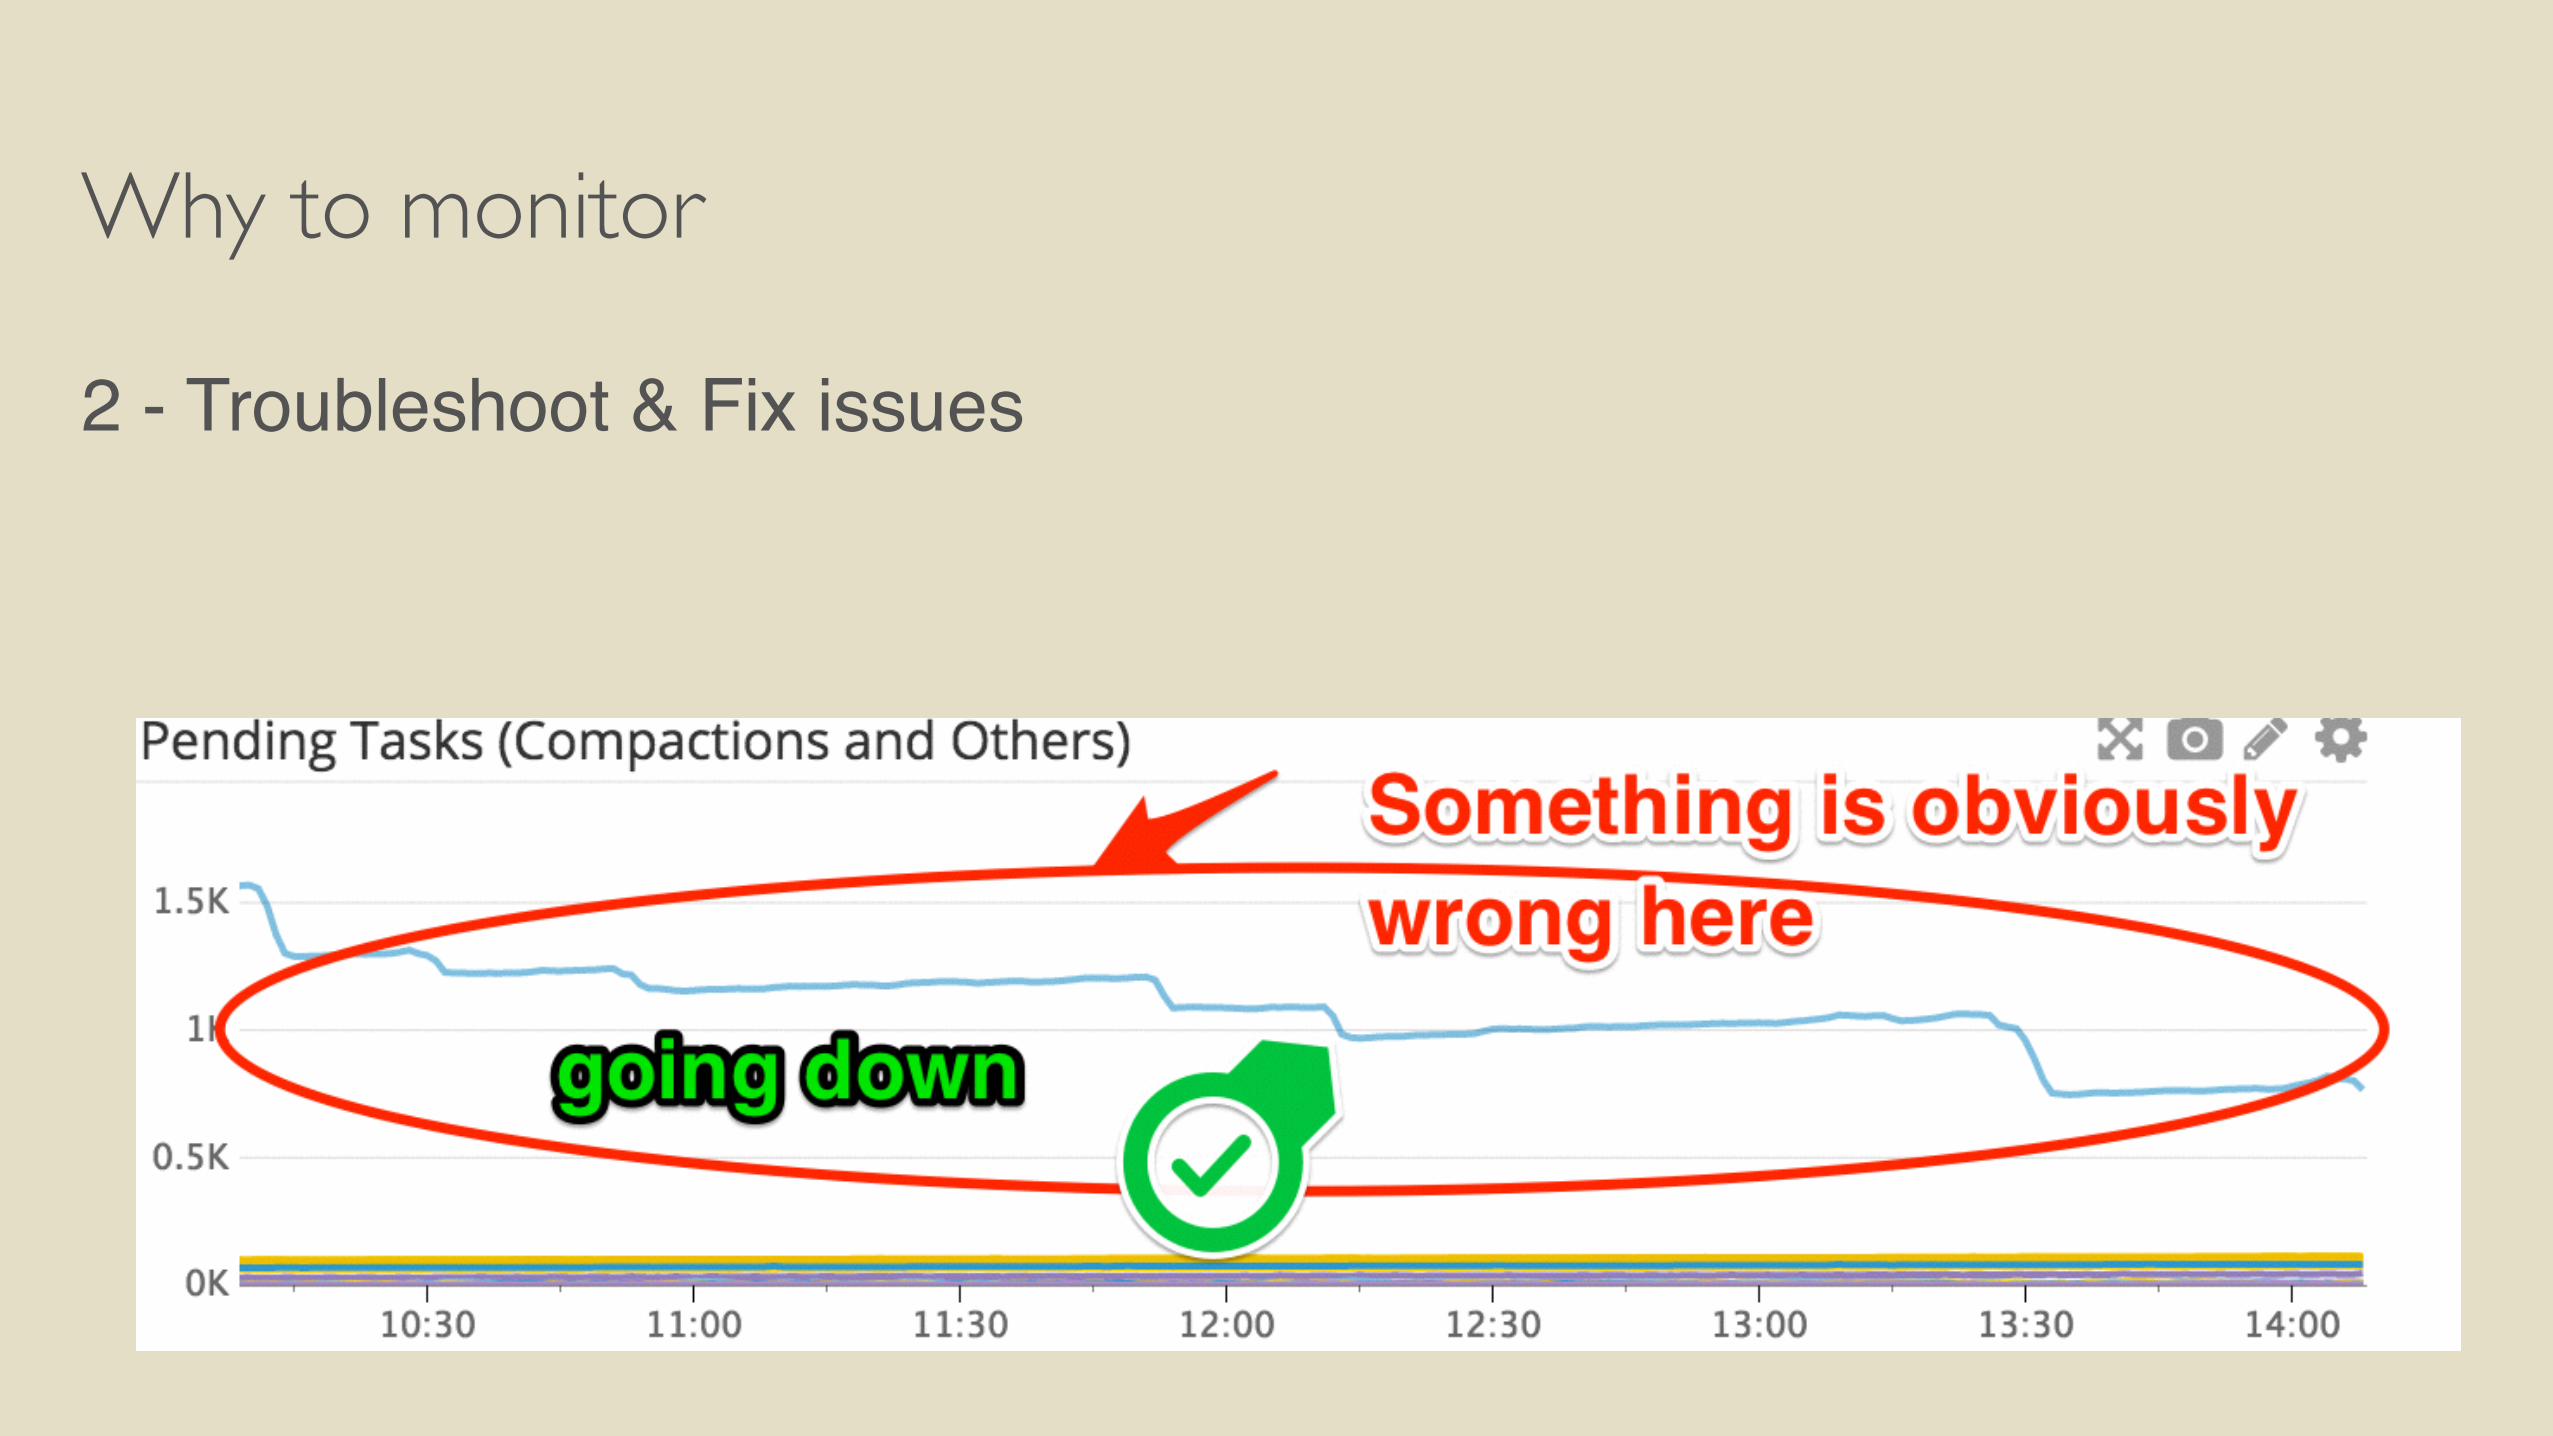
Why to monitor
2 - Troubleshoot & Fix issues
3 - Understand internals & Optimize
What to monitor : Detect Anomalies!
What to monitor : Detect Anomalies!
• Be minimalist: small set of charts, in 1 dashboard !
What to monitor : Detect Anomalies!
• Be minimalist: small set of charts, in 1 dashboard !
• What is necessary and sufficient to detect any issue
What to monitor : Detect Anomalies!
• Be minimalist: small set of charts, in 1 dashboard !
• What is necessary and sufficient to detect any issue
• Think about your own KPI
What to monitor : Detect Anomalies!
• Be minimalist: small set of charts, in 1 dashboard !
• What is necessary and sufficient to detect any issue
• Think about your own KPI
• Set alerts on this dashboard and / or keep an eye on it.
What to monitor : Detect Anomalies!
• Be minimalist: small set of charts, in 1 dashboard !
• What is necessary and sufficient to detect any issue
• Think about your own KPI
• Set alerts on this dashboard and / or keep an eye on it.
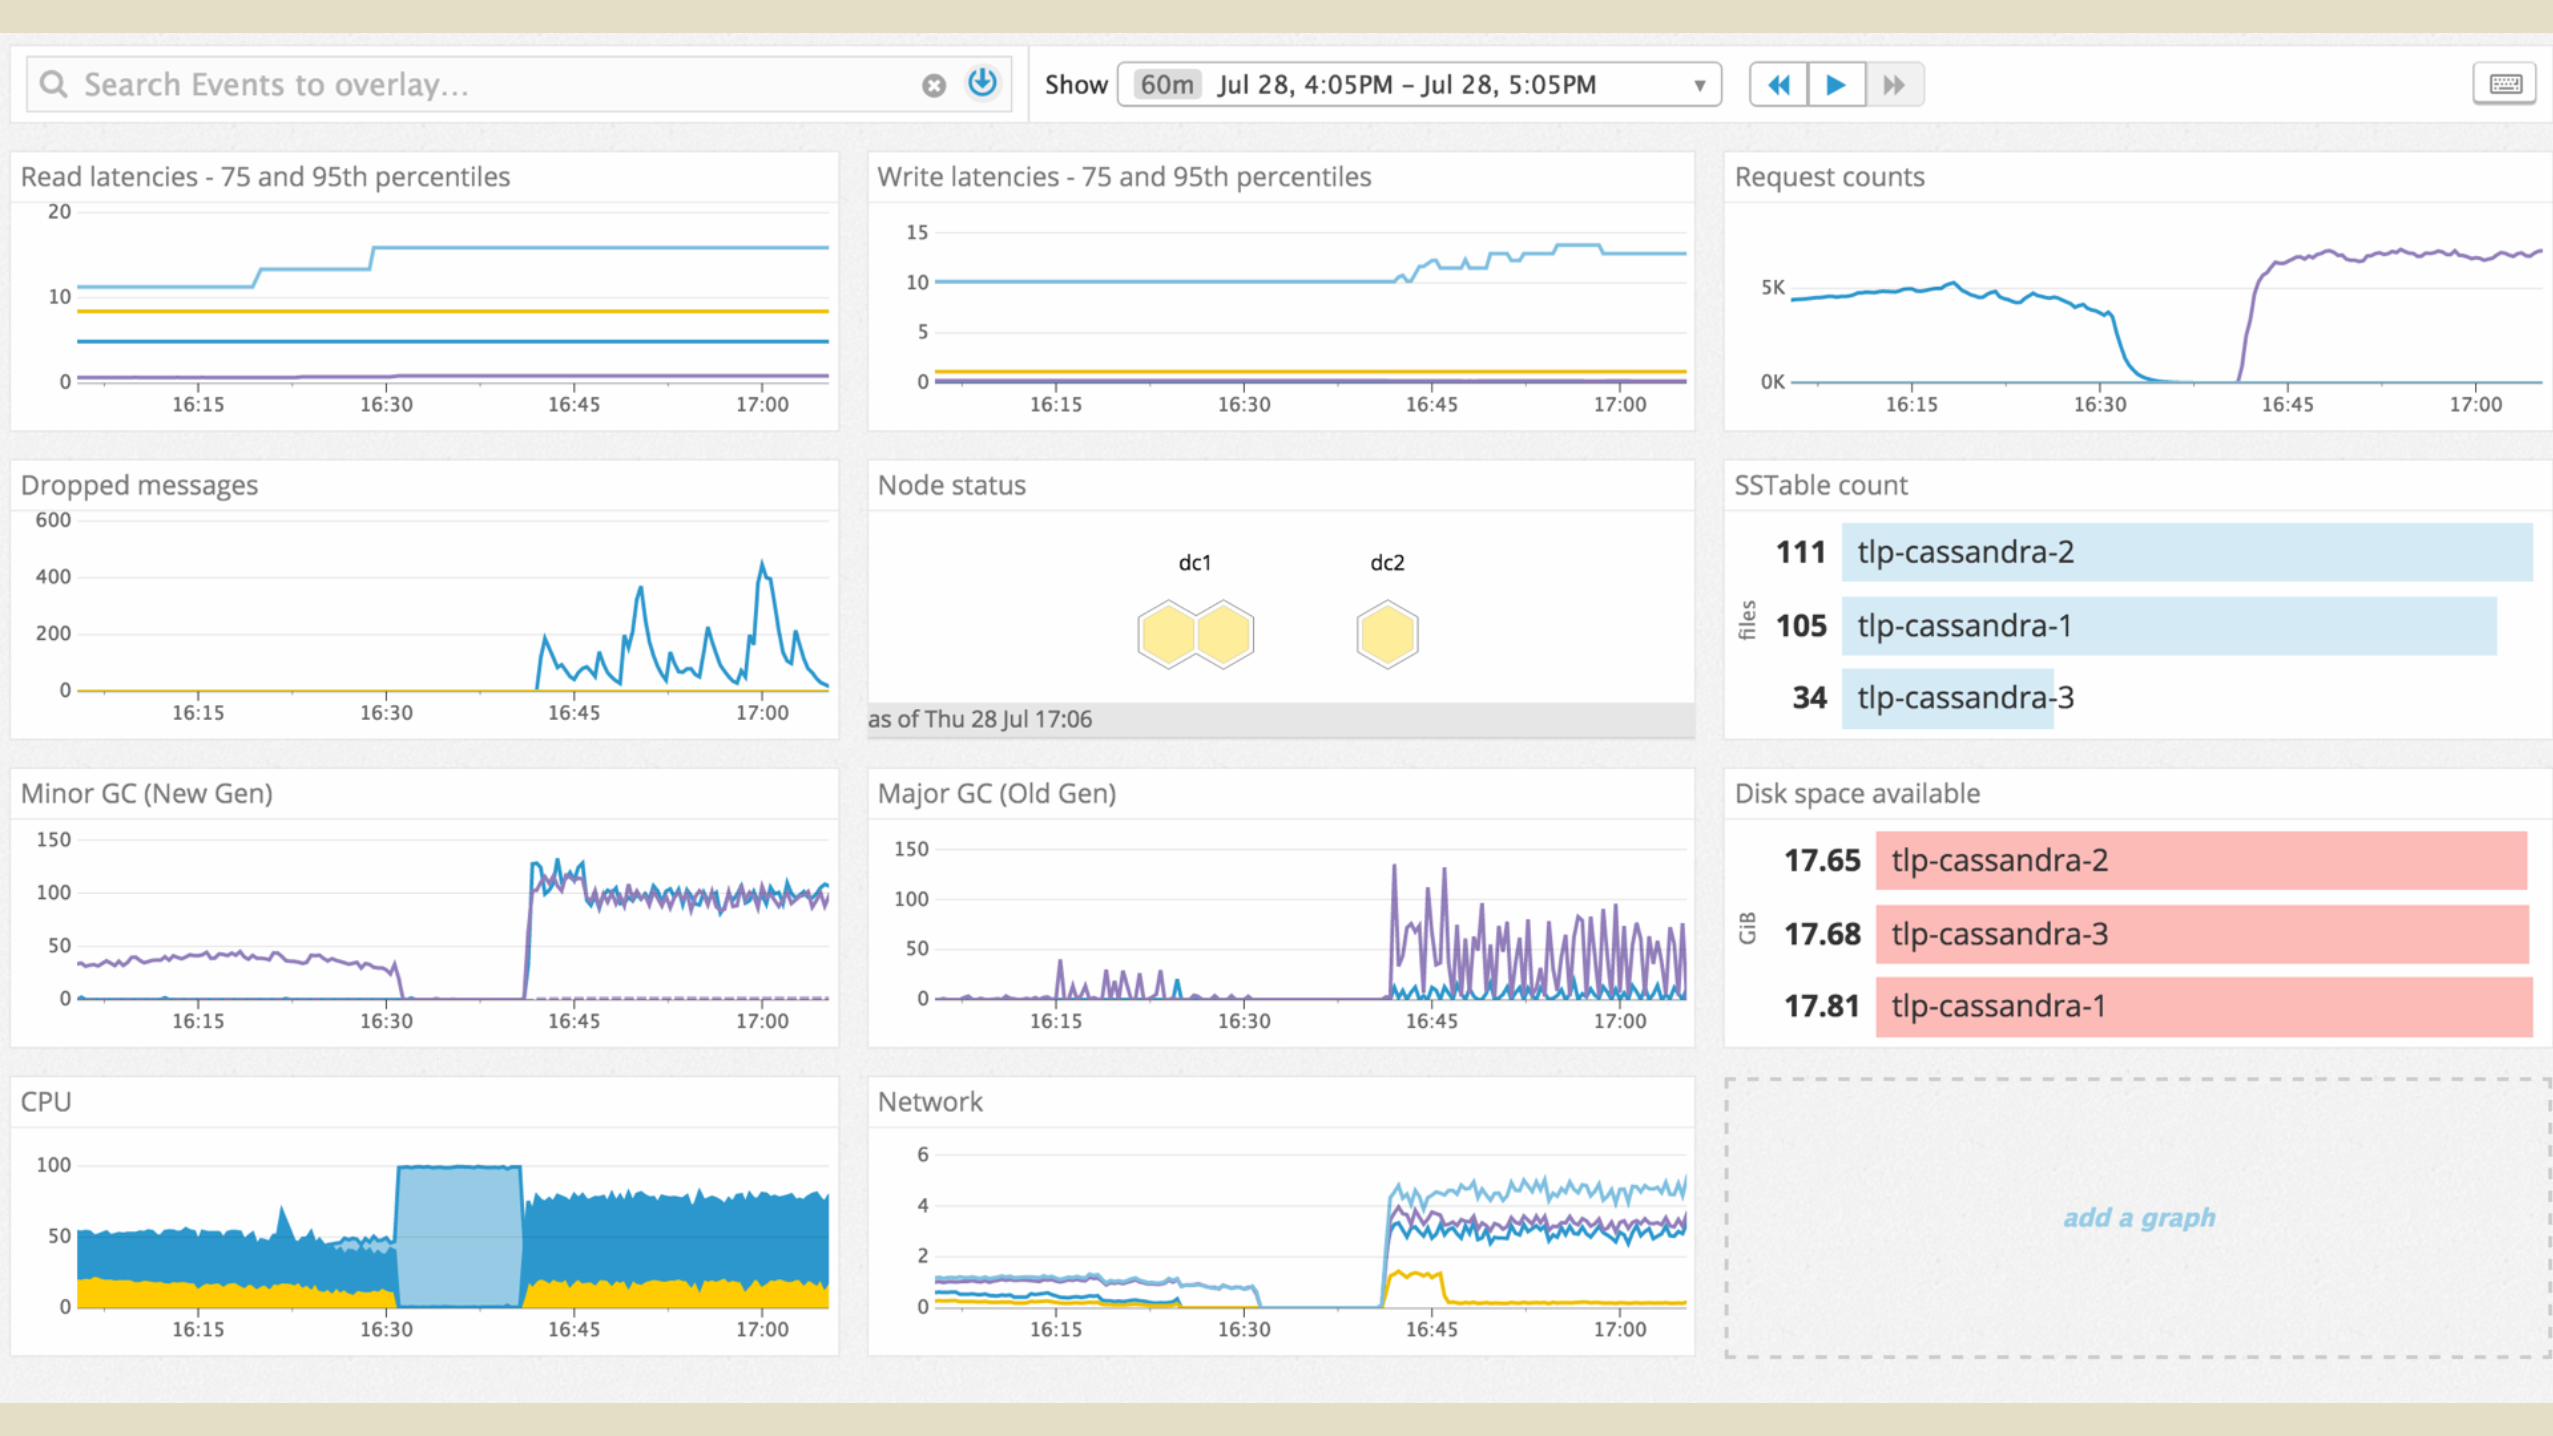
Overview Dashboard
What to monitor : Troubleshoot!
What to monitor : Troubleshoot!
• Maximise useful information
What to monitor : Troubleshoot!
• Maximise useful information
• Themed dashboards (Read path, Client connections, …)
What to monitor : Troubleshoot!
• Maximise useful information
• Themed dashboards (Read path, Client connections, …)
• Reuse charts and metrics, when relevant
What to monitor : Troubleshoot!
• Maximise useful information
• Themed dashboards (Read path, Client connections, …)
• Reuse charts and metrics, when relevant
• Missing something? Add it!
What to monitor : Optimize!
What to monitor : Optimize!
• Mostly using same dashboards than for troubleshooting
What to monitor : Optimize!
• Mostly using same dashboards than for troubleshooting
• Having a good set of dashboards highlights bottlenecks
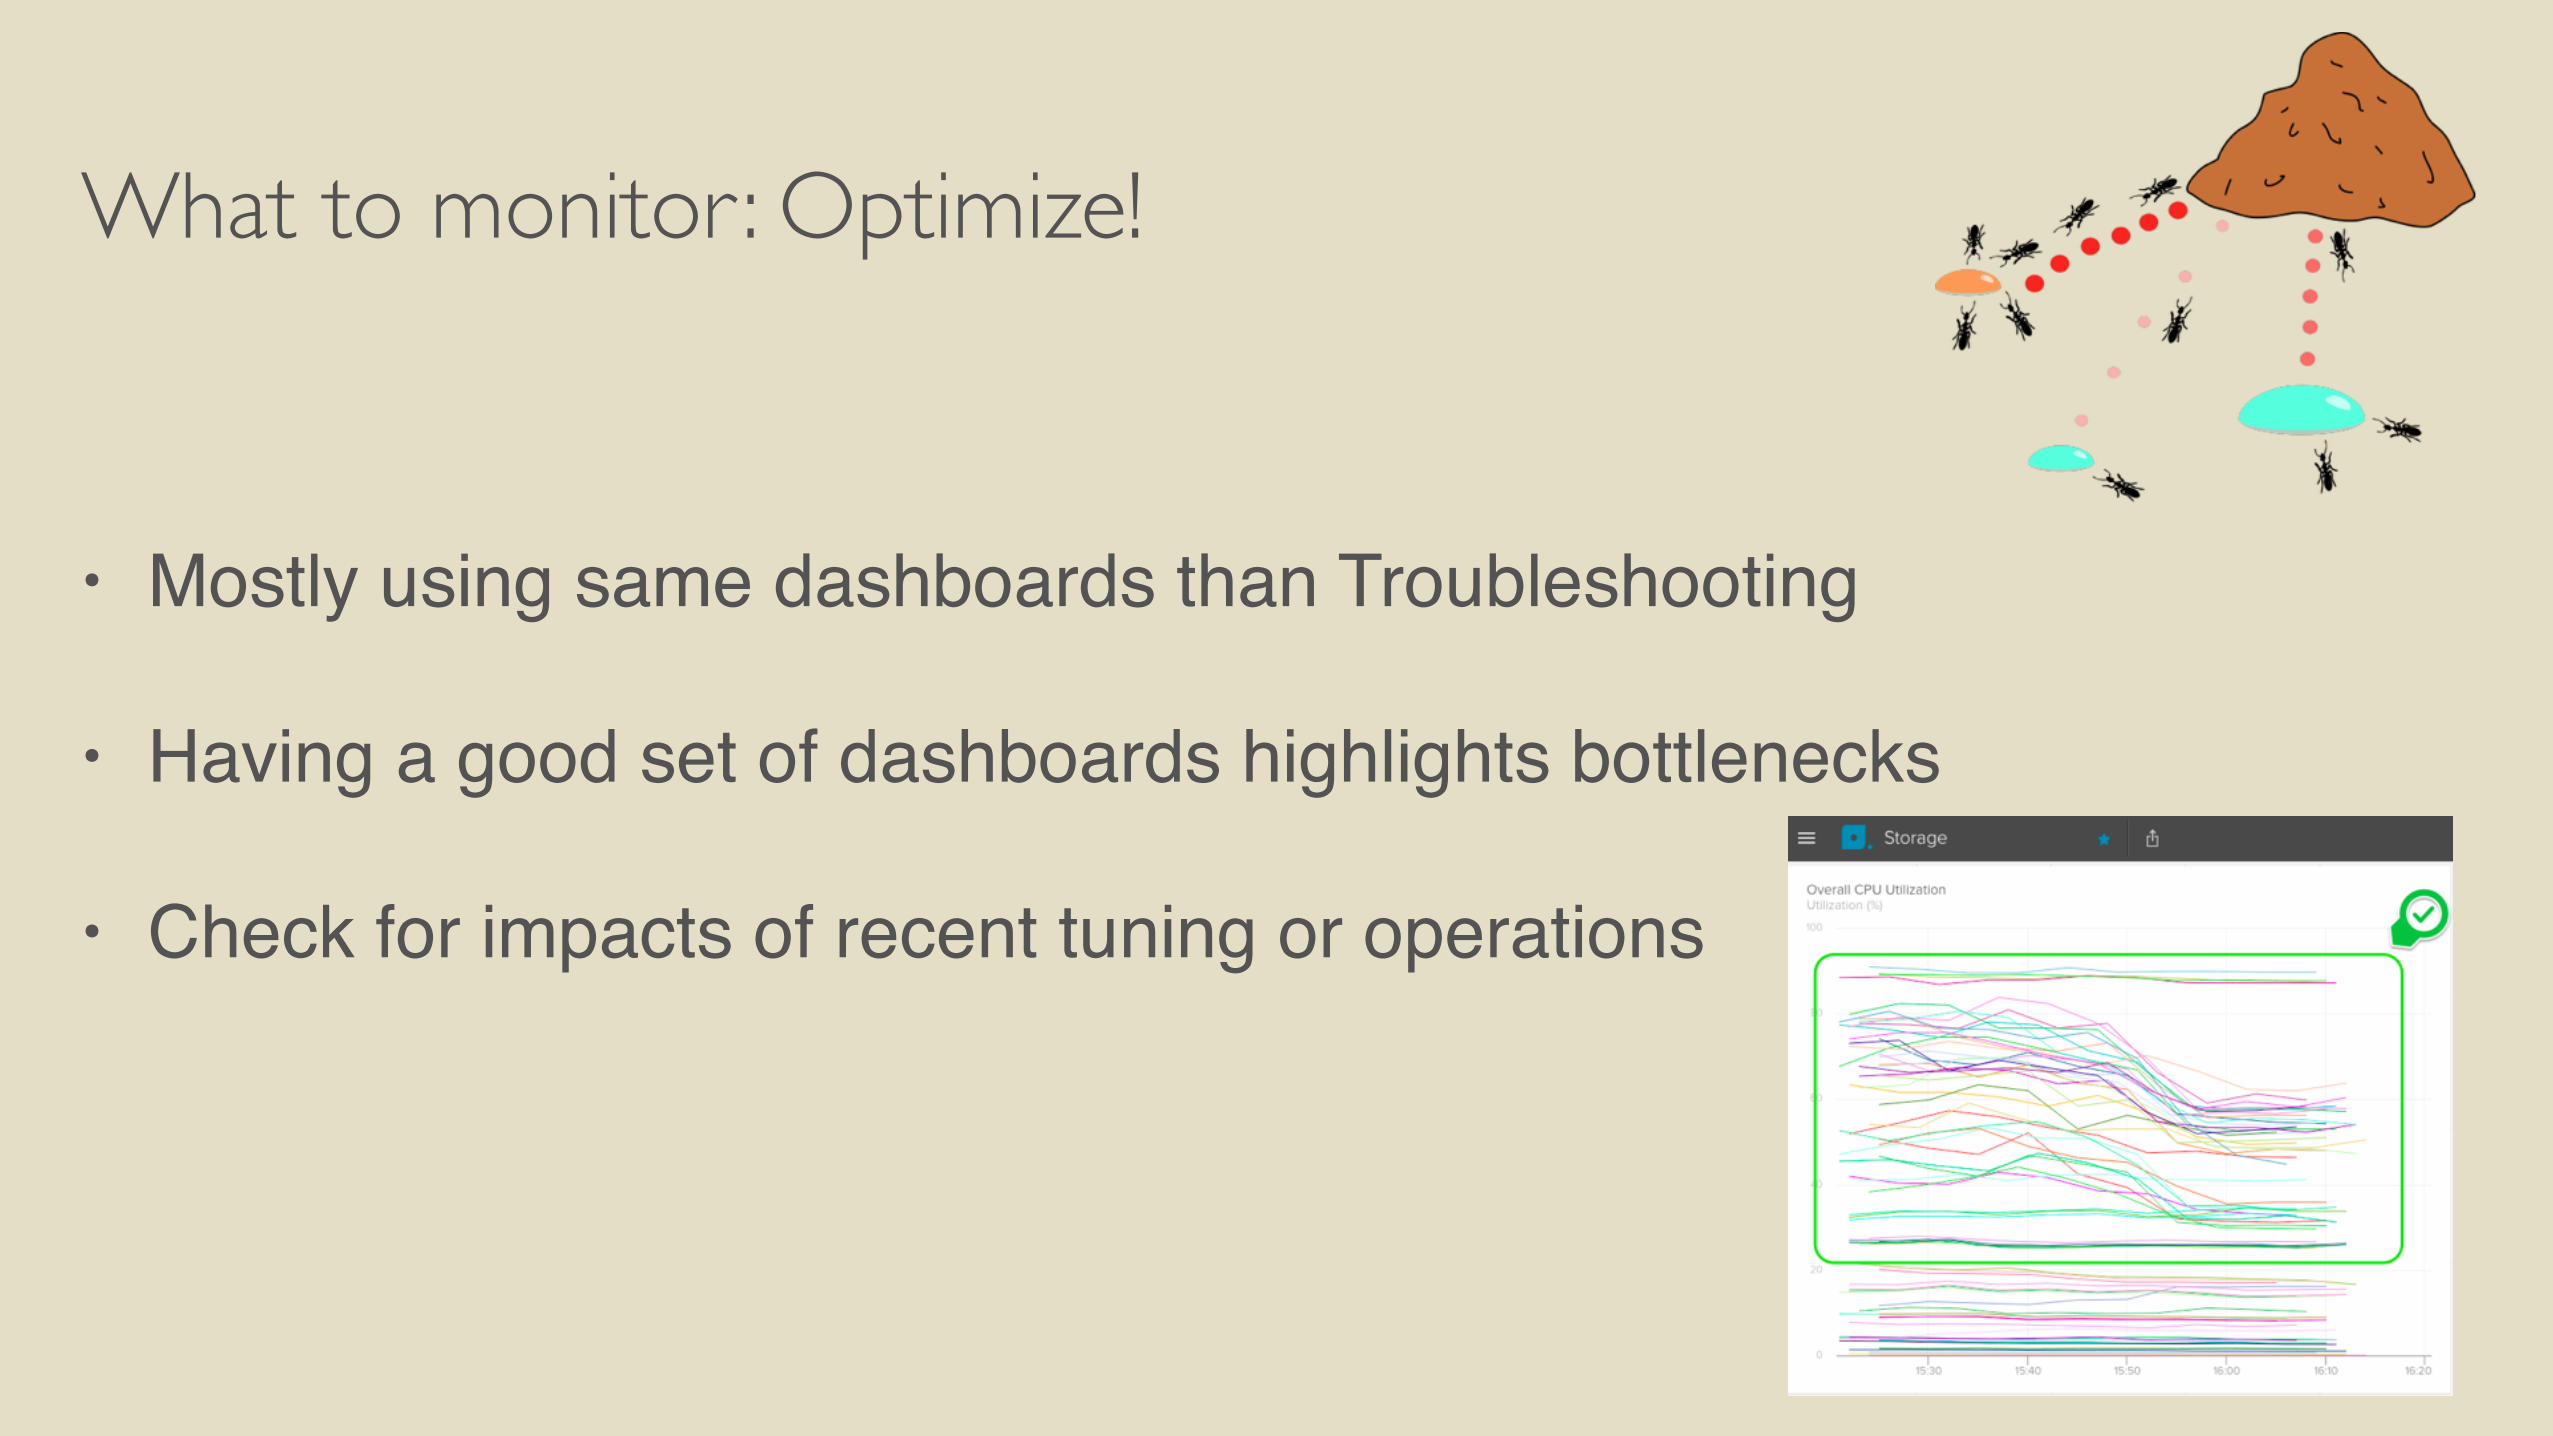
What to monitor : Optimize!
• Mostly using same dashboards than Troubleshooting
• Having a good set of dashboards highlights bottlenecks
• Check for impacts of recent tuning or operations
Monitoring limits
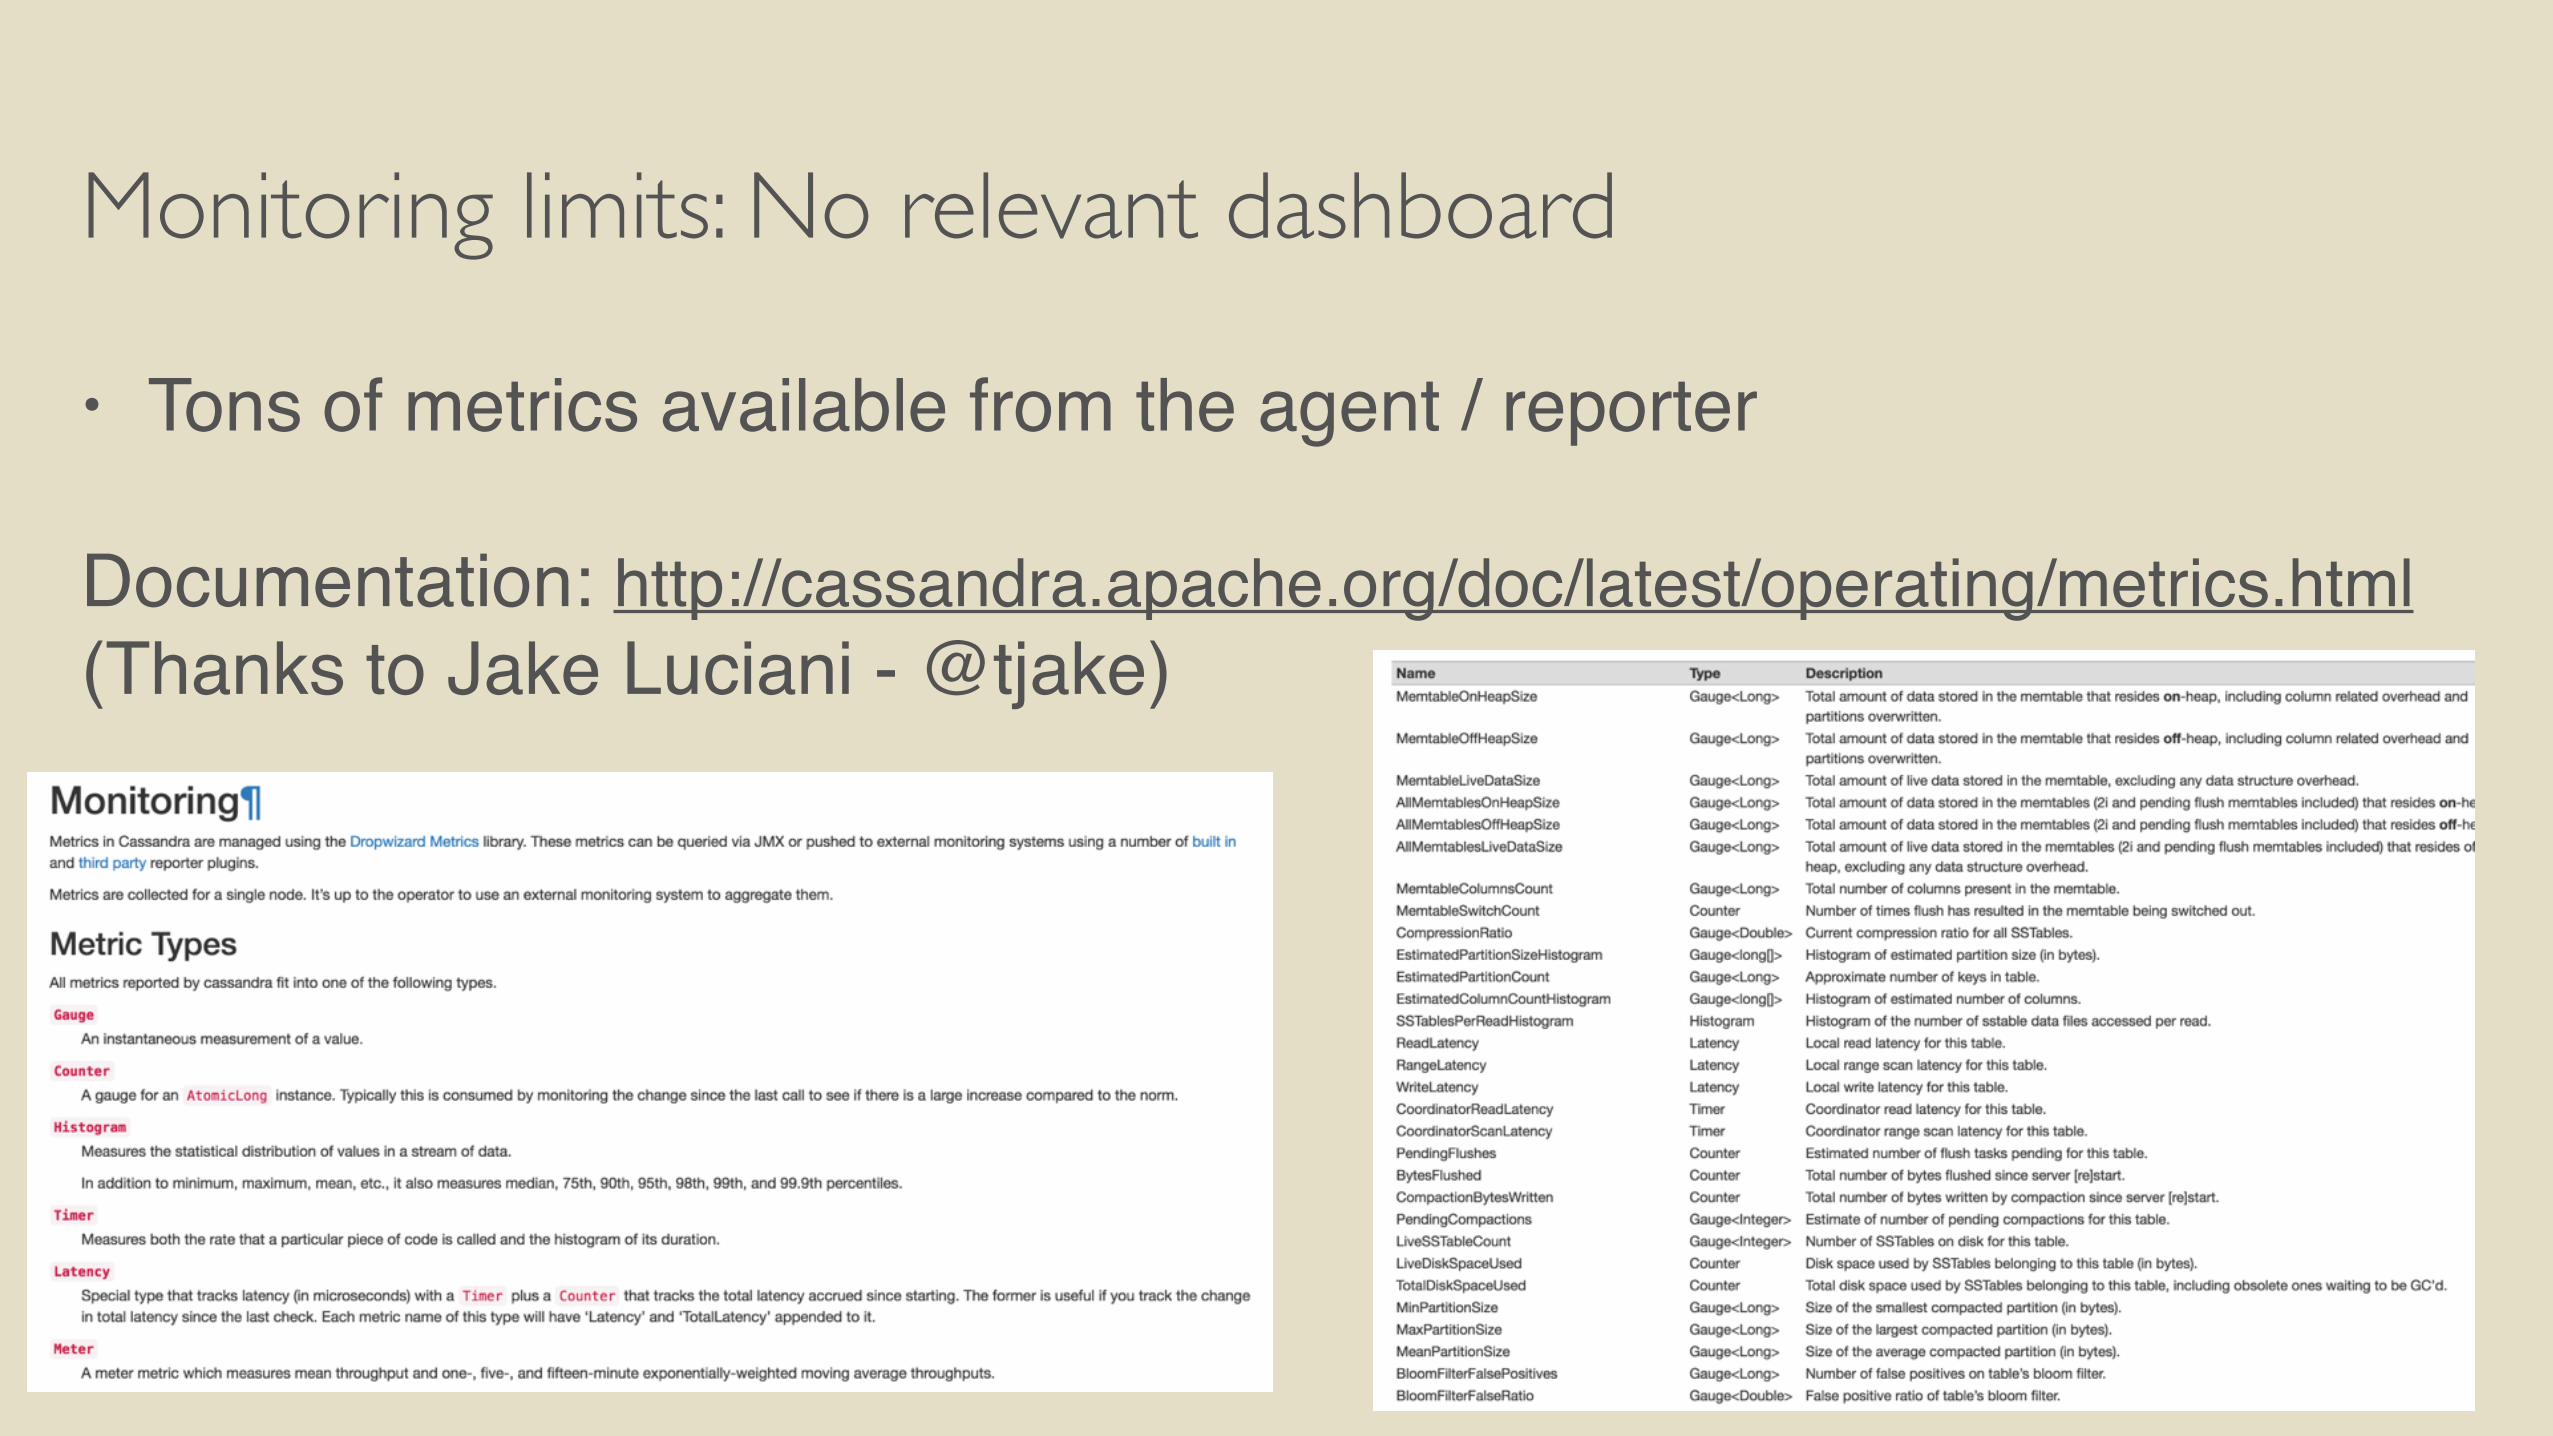
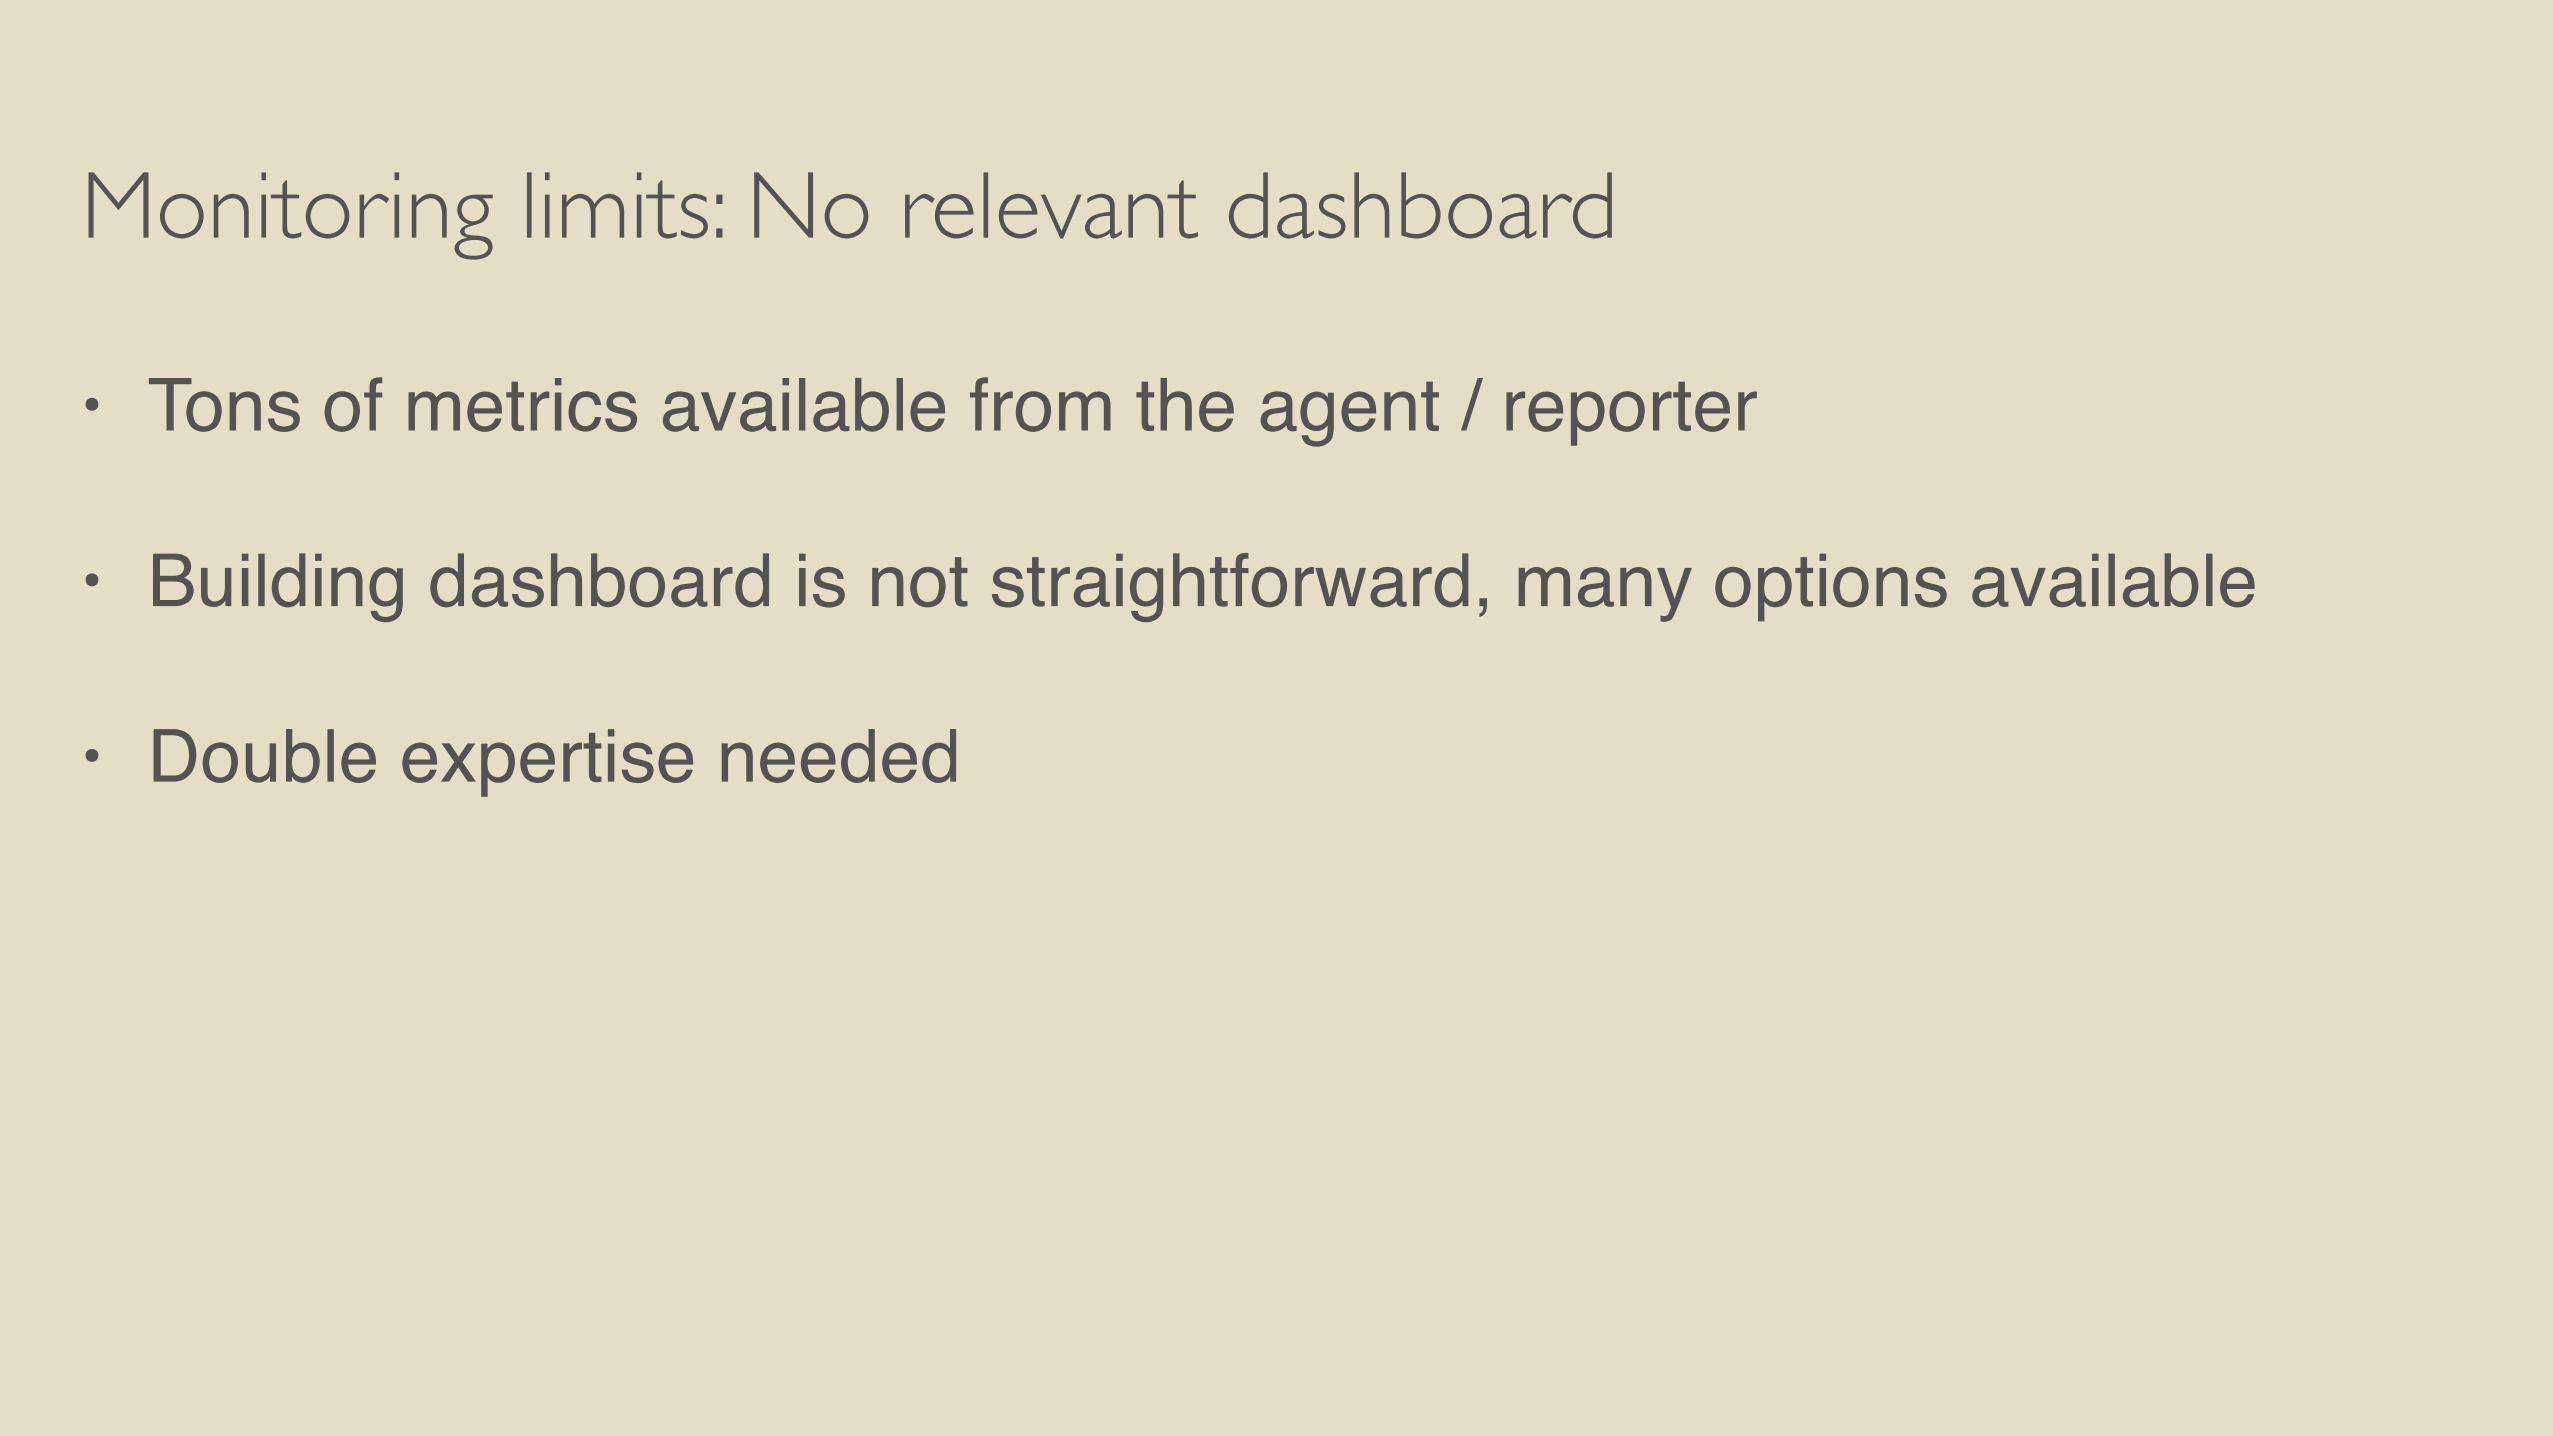
Monitoring limits: No relevant dashboard
• Tons of metrics available from the agent / reporter
Documentation: http://cassandra.apache.org/doc/latest/operating/metrics.html(Thanks to Jake Luciani - @tjake)
Monitoring limits: No relevant dashboard
• Tons of metrics available from the agent / reporter
• Building dashboard is not straightforward, many options available
Monitoring limits: No relevant dashboard
• Tons of metrics available from the agent / reporter
• Building dashboard is not straightforward, many options available
• Double expertise needed
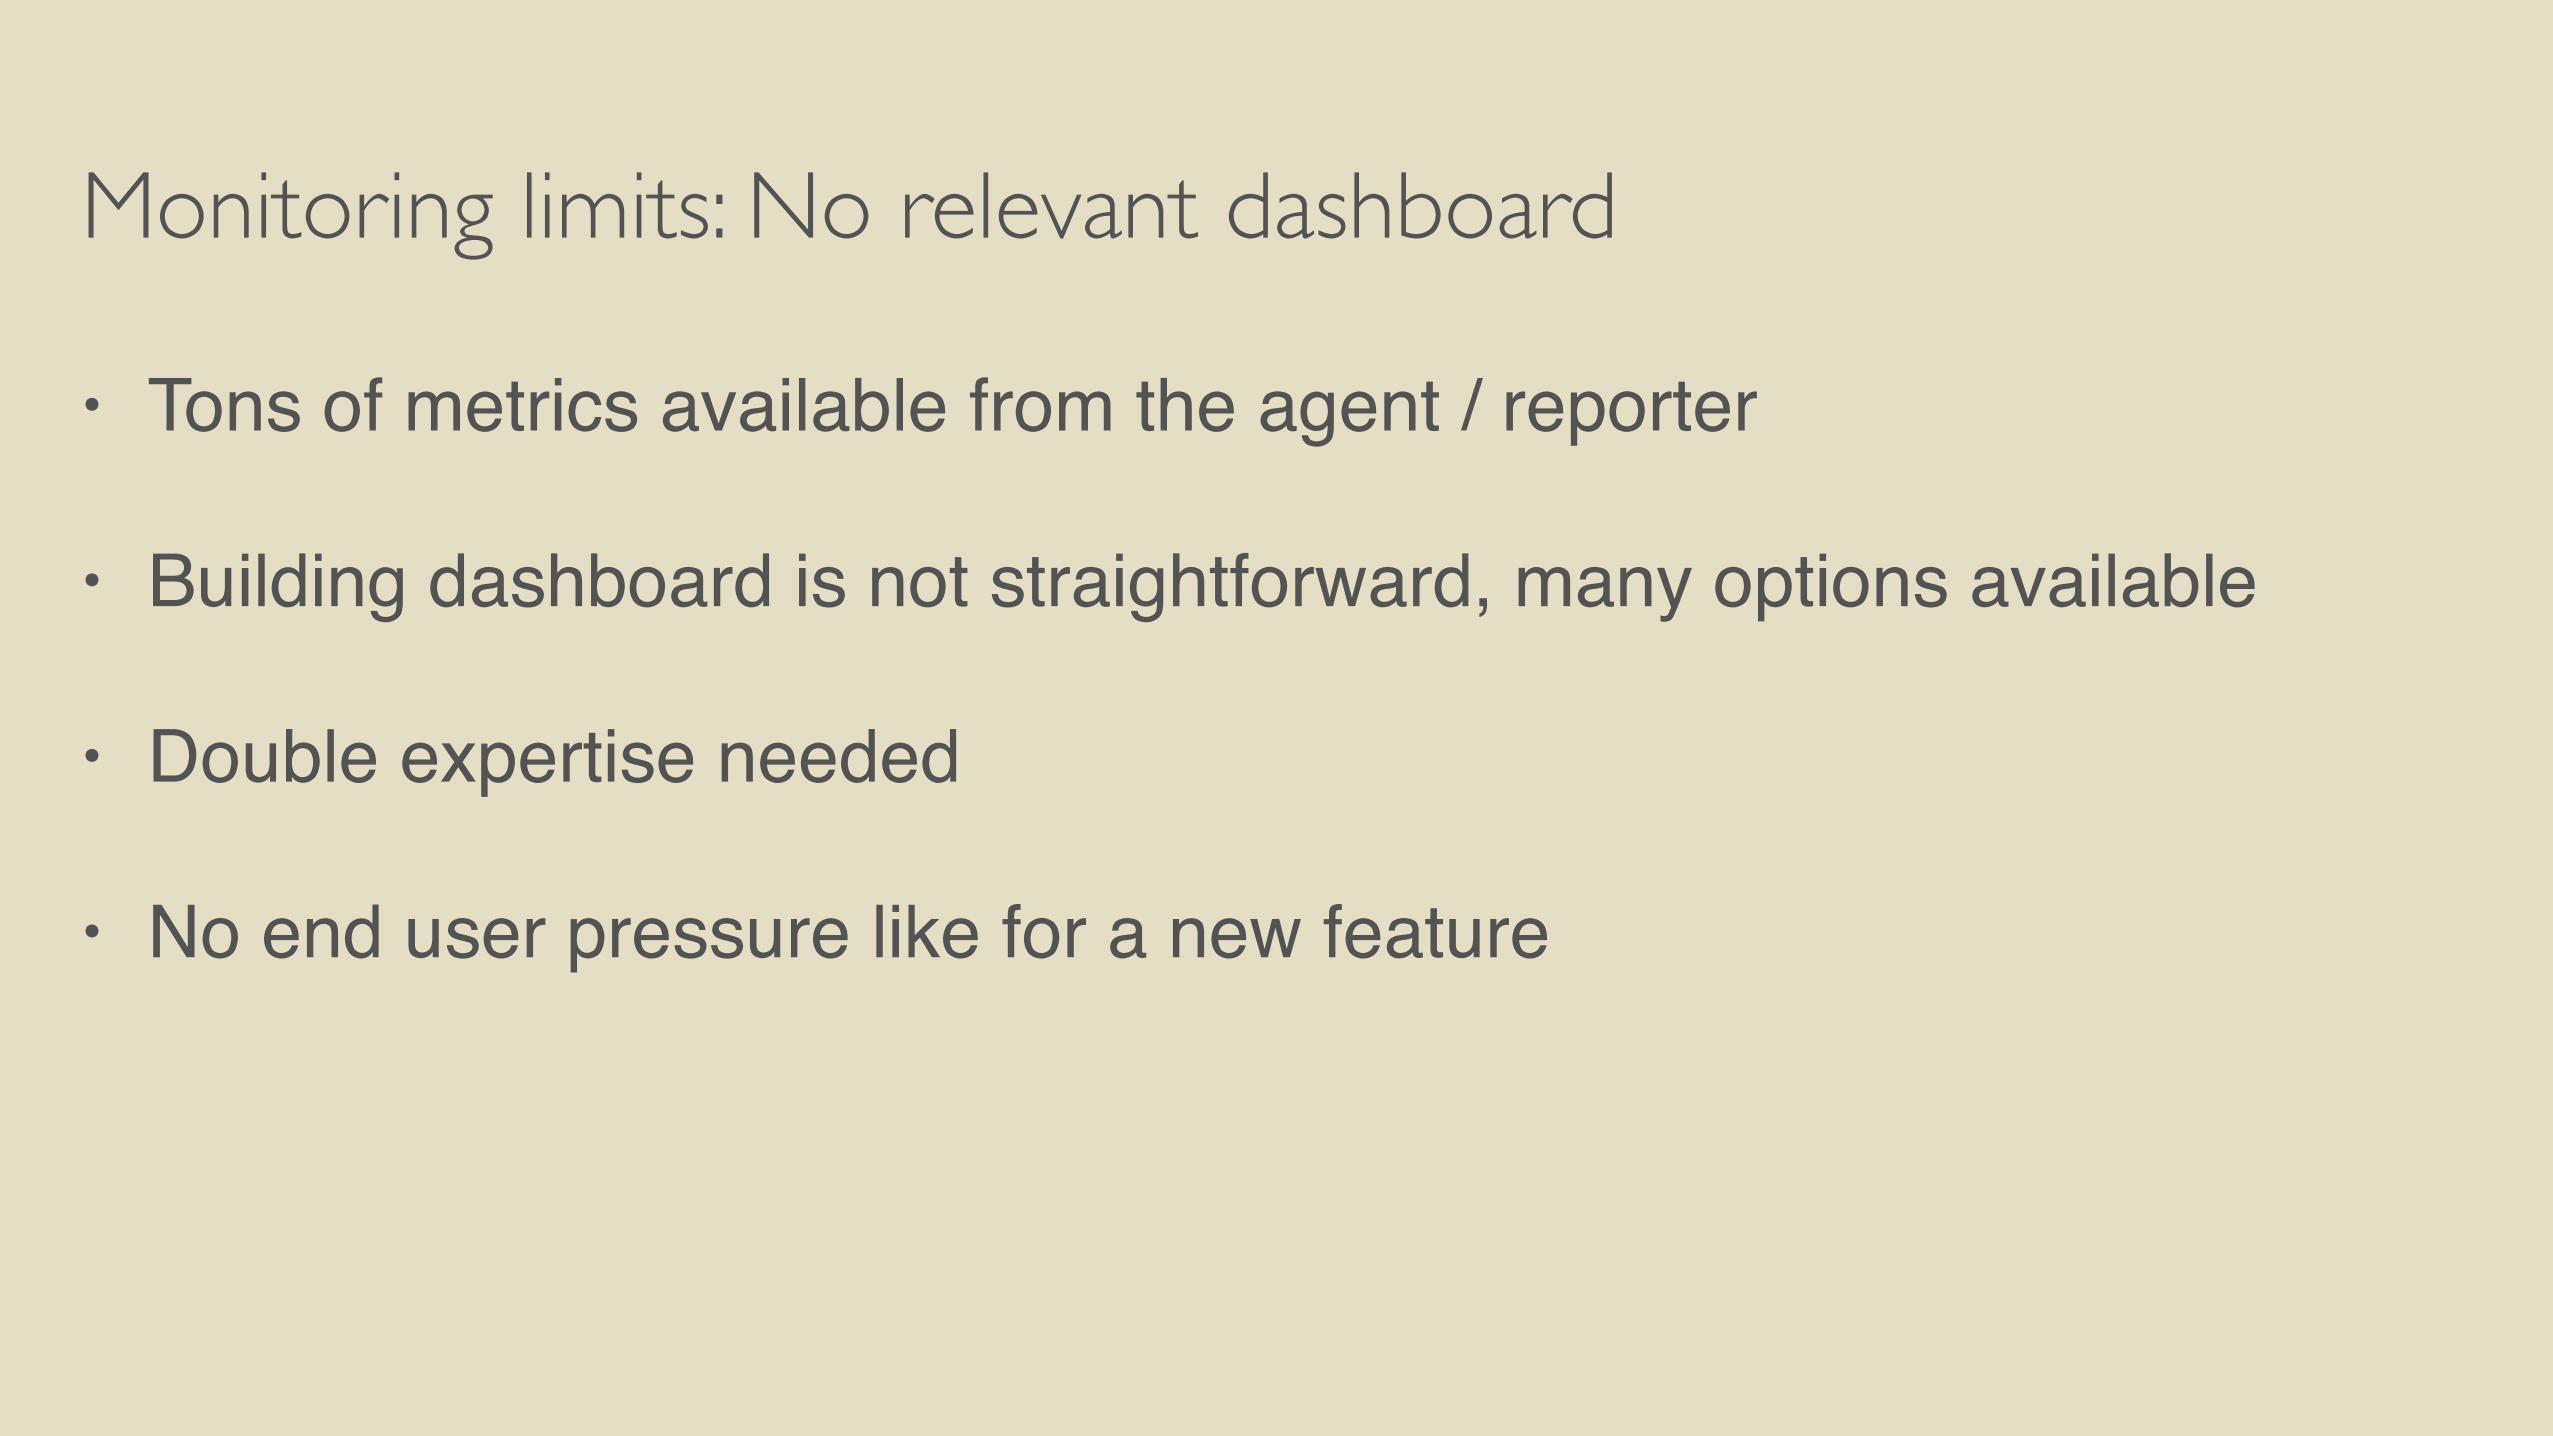
Monitoring limits: No relevant dashboard
• Tons of metrics available from the agent / reporter
• Building dashboard is not straightforward, many options available
• Double expertise needed
• No end user pressure like for a new feature
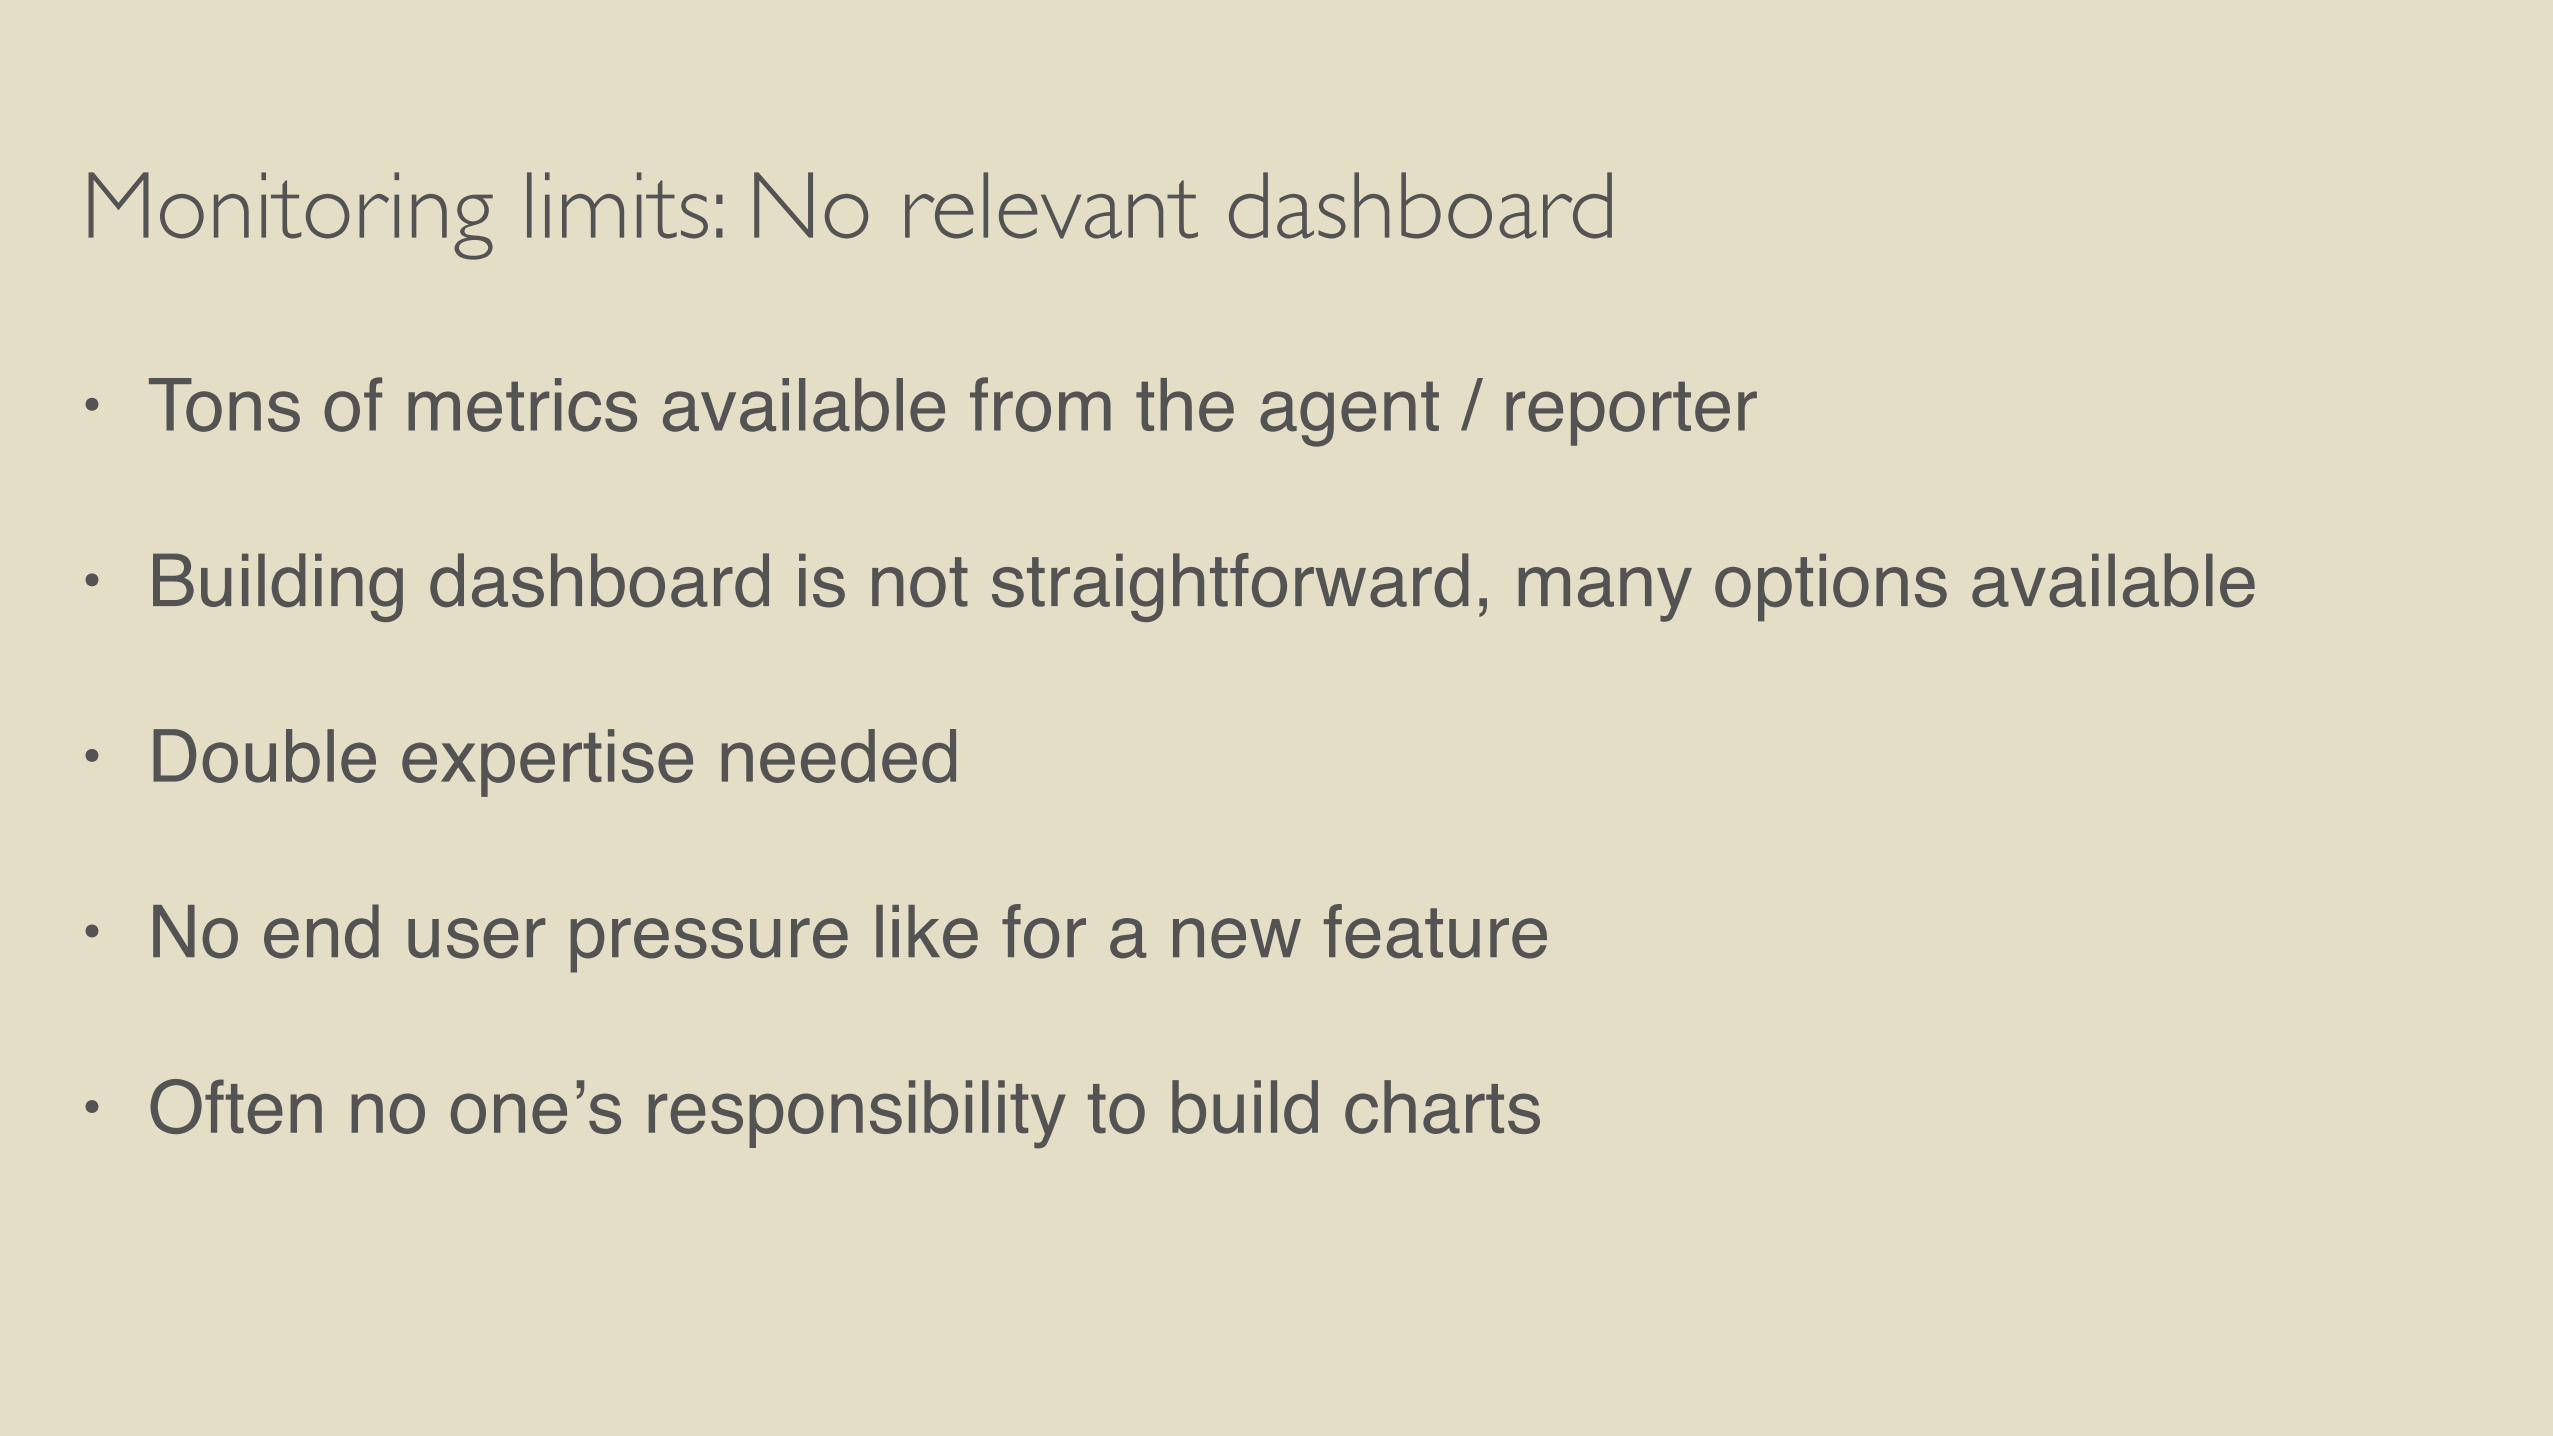
Monitoring limits: No relevant dashboard
• Tons of metrics available from the agent / reporter
• Building dashboard is not straightforward, many options available
• Double expertise needed
• No end user pressure like for a new feature
• Often no oneʼs responsibility to build charts
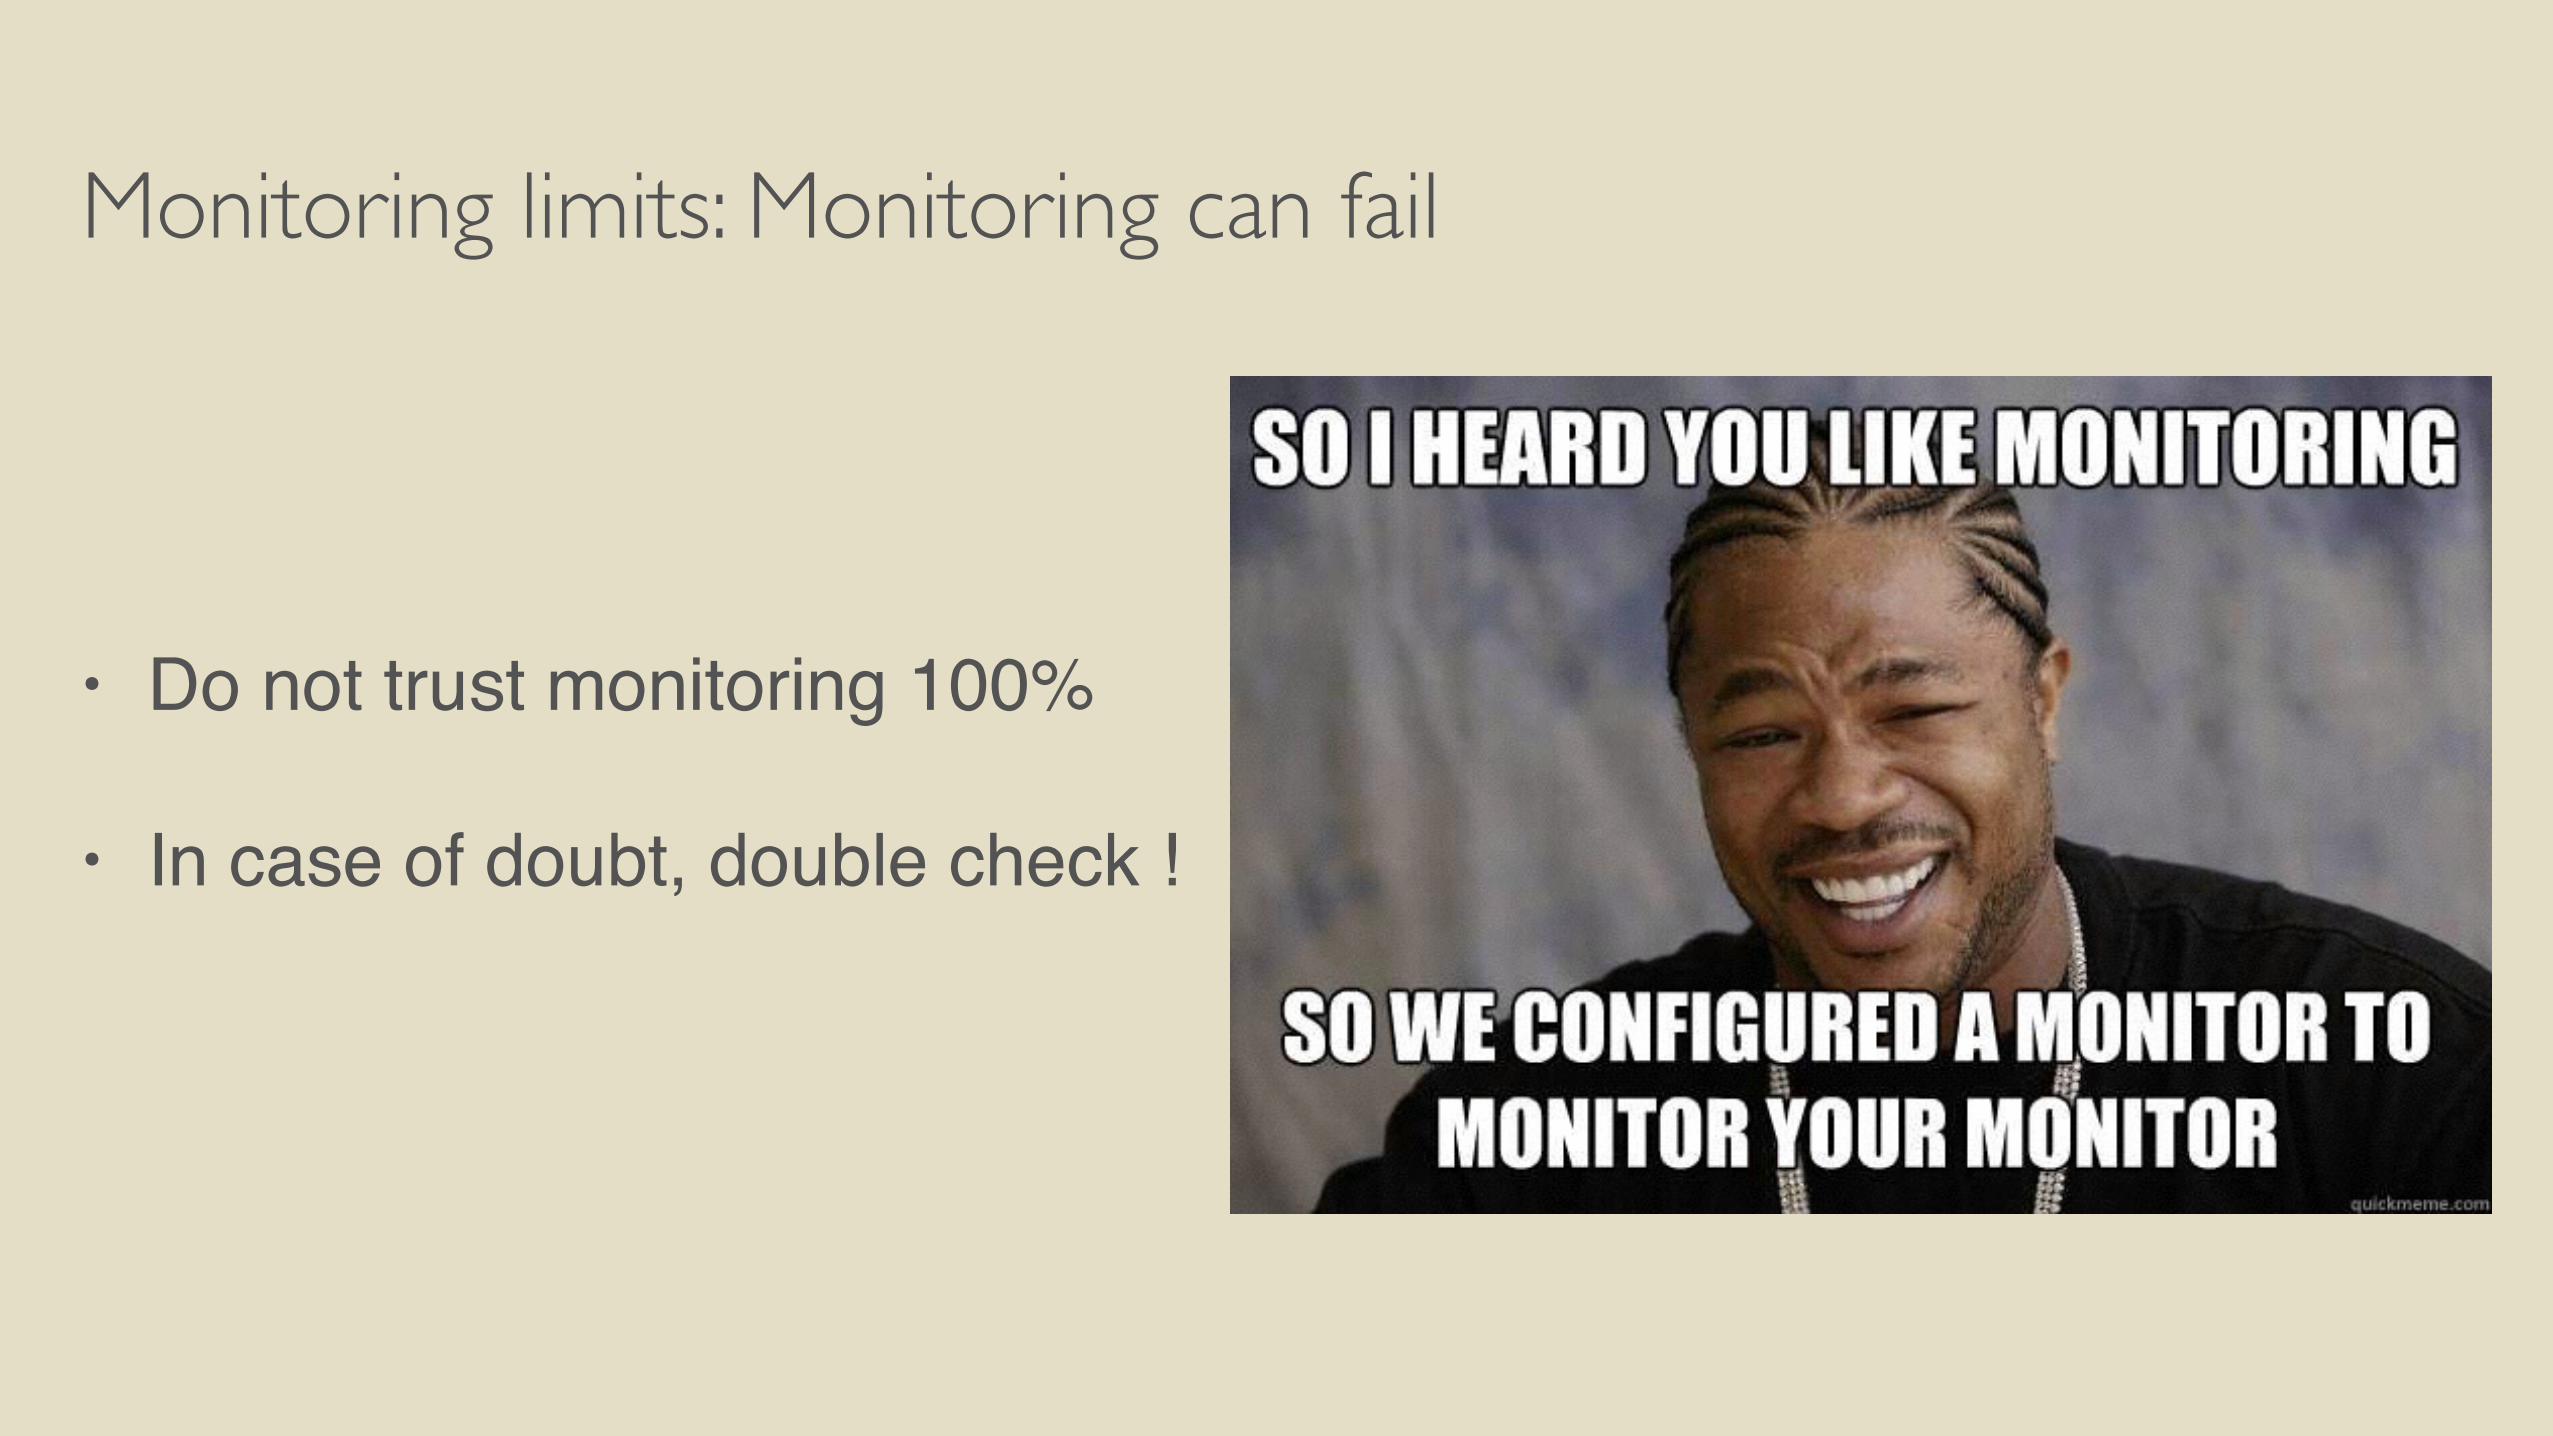
Monitoring limits: Monitoring can fail
• Do not trust monitoring 100%
• In case of doubt, double check !
Monitoring limits: Tip for Datastax Opscenter
• Troubles with Datastax Opscenter in the past
• Opscenter data should be stored outside from the production C* cluster

Building dashboards
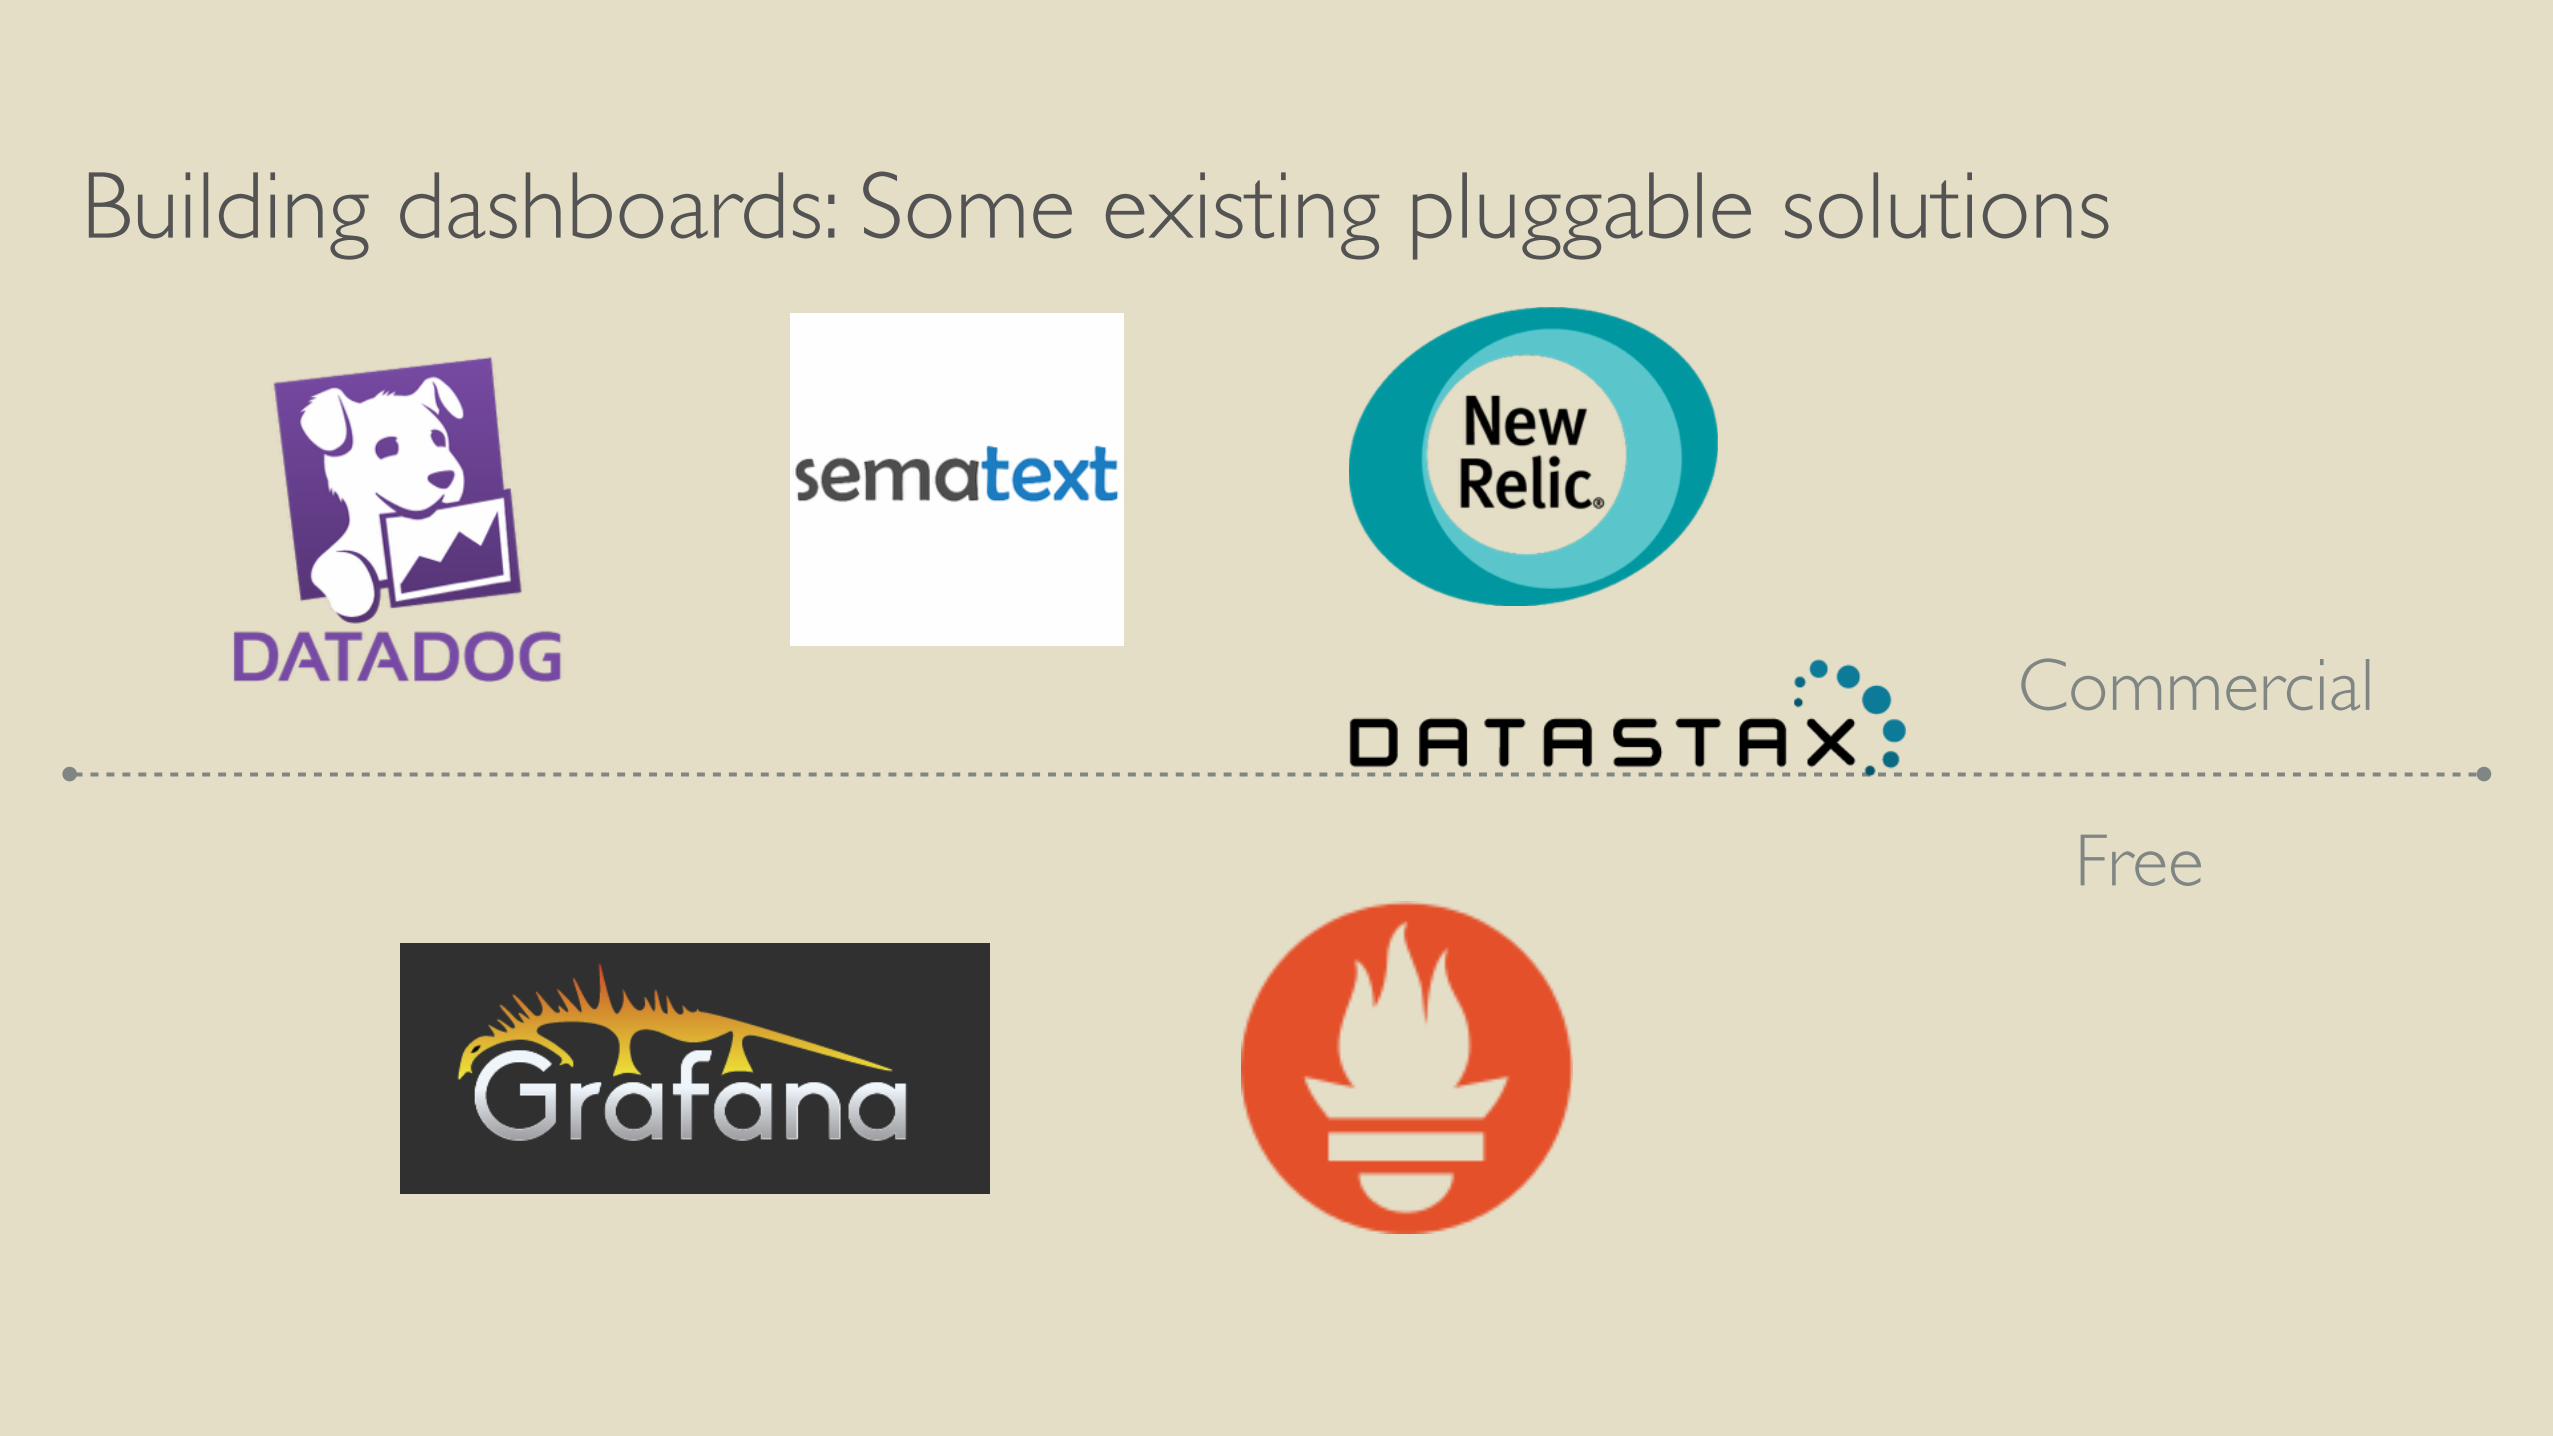
Building dashboards: Some existing pluggable solutions
Commercial
Free
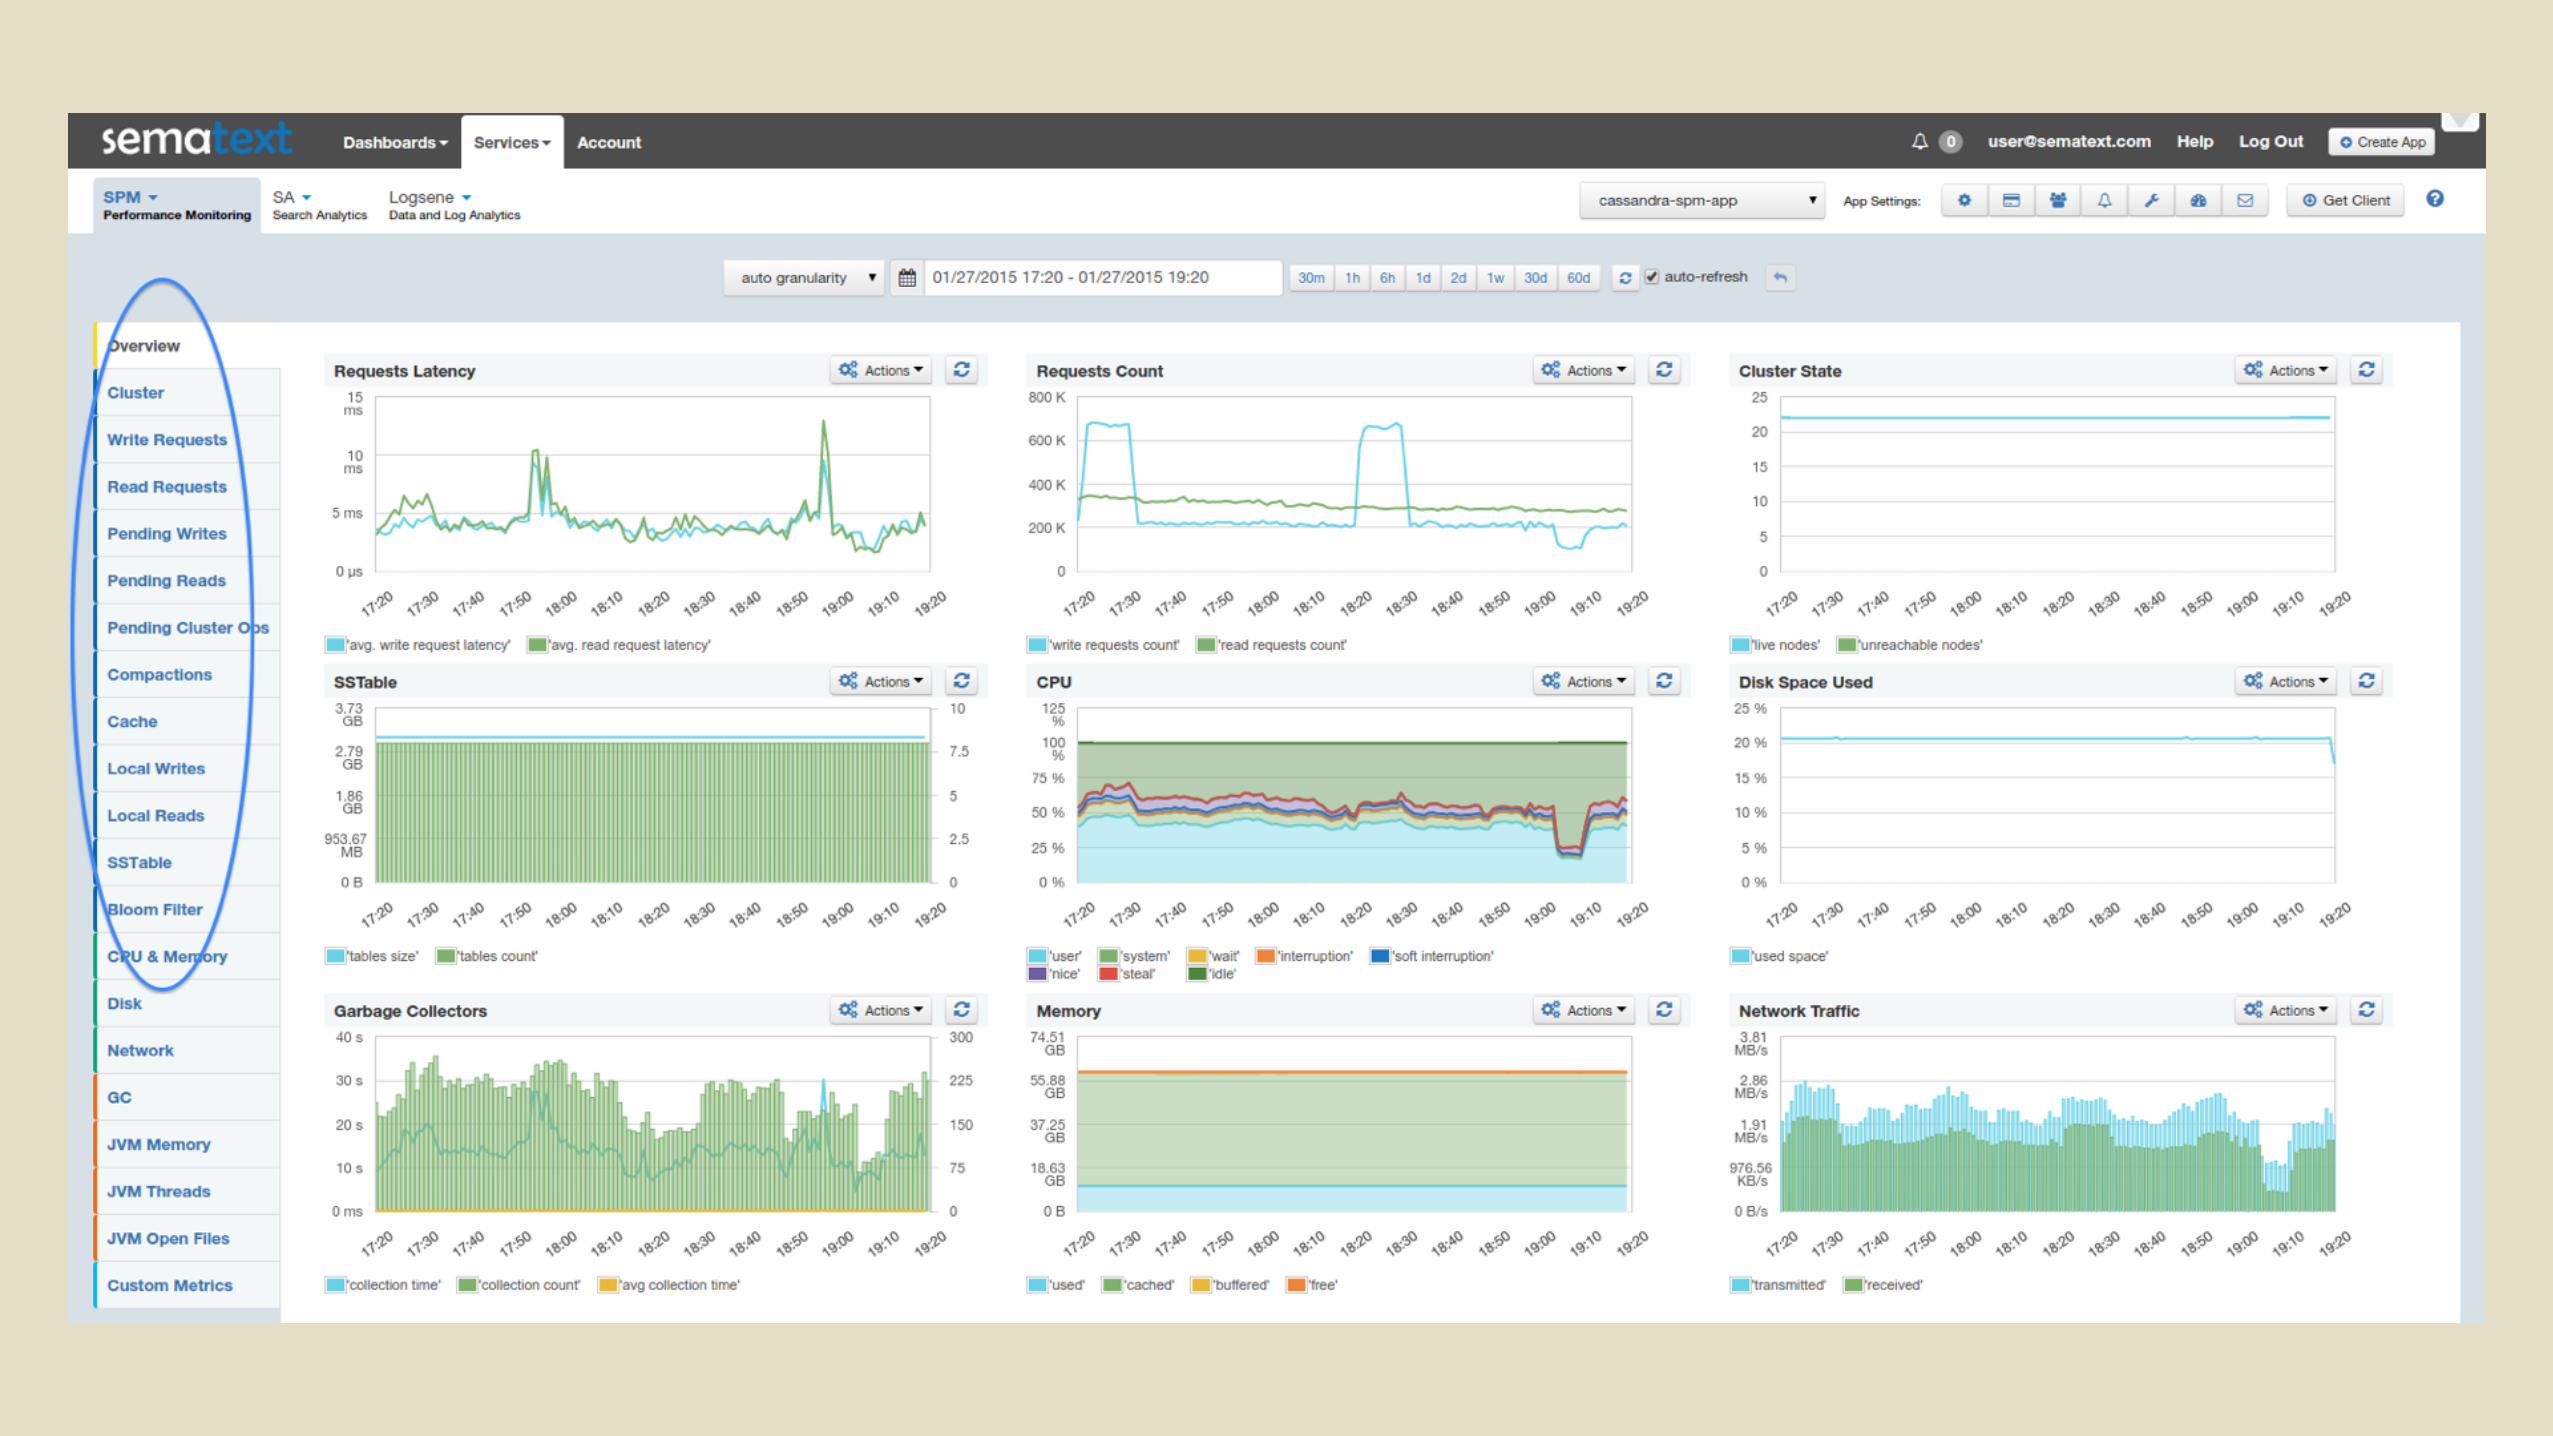
Building dashboards: Existing expert set of dashboard
• No “out of the box” and “complete” dashboards available
Building dashboards: Existing expert set of dashboard
• No “out of the box” and “complete” dashboards available
• Sematext-SPM is the winner from this perspective
Building dashboards: Existing expert set of dashboard
• No “out of the box” and “complete” dashboards available
• Sematext-SPM is the winner from this perspective
Building dashboards: Templates idea origin
• TLP = Consulting company = many Cassandra clusters
Building dashboards: Templates idea origin
• TLP = Consulting company = many Cassandra clusters
• Need to build dashboards for many clients
Building dashboards: Templates idea origin
• TLP = Consulting company = many Cassandra clusters
• Need to build dashboards for many clients
• I am lazy, I do not like repeating tasks
Building dashboards: Templates idea origin
• TLP = Consulting company = many Cassandra clusters
• Need to build dashboards for many clients
• I am lazy, I do not like repeating tasks
=> Decided to build templates and share to the community
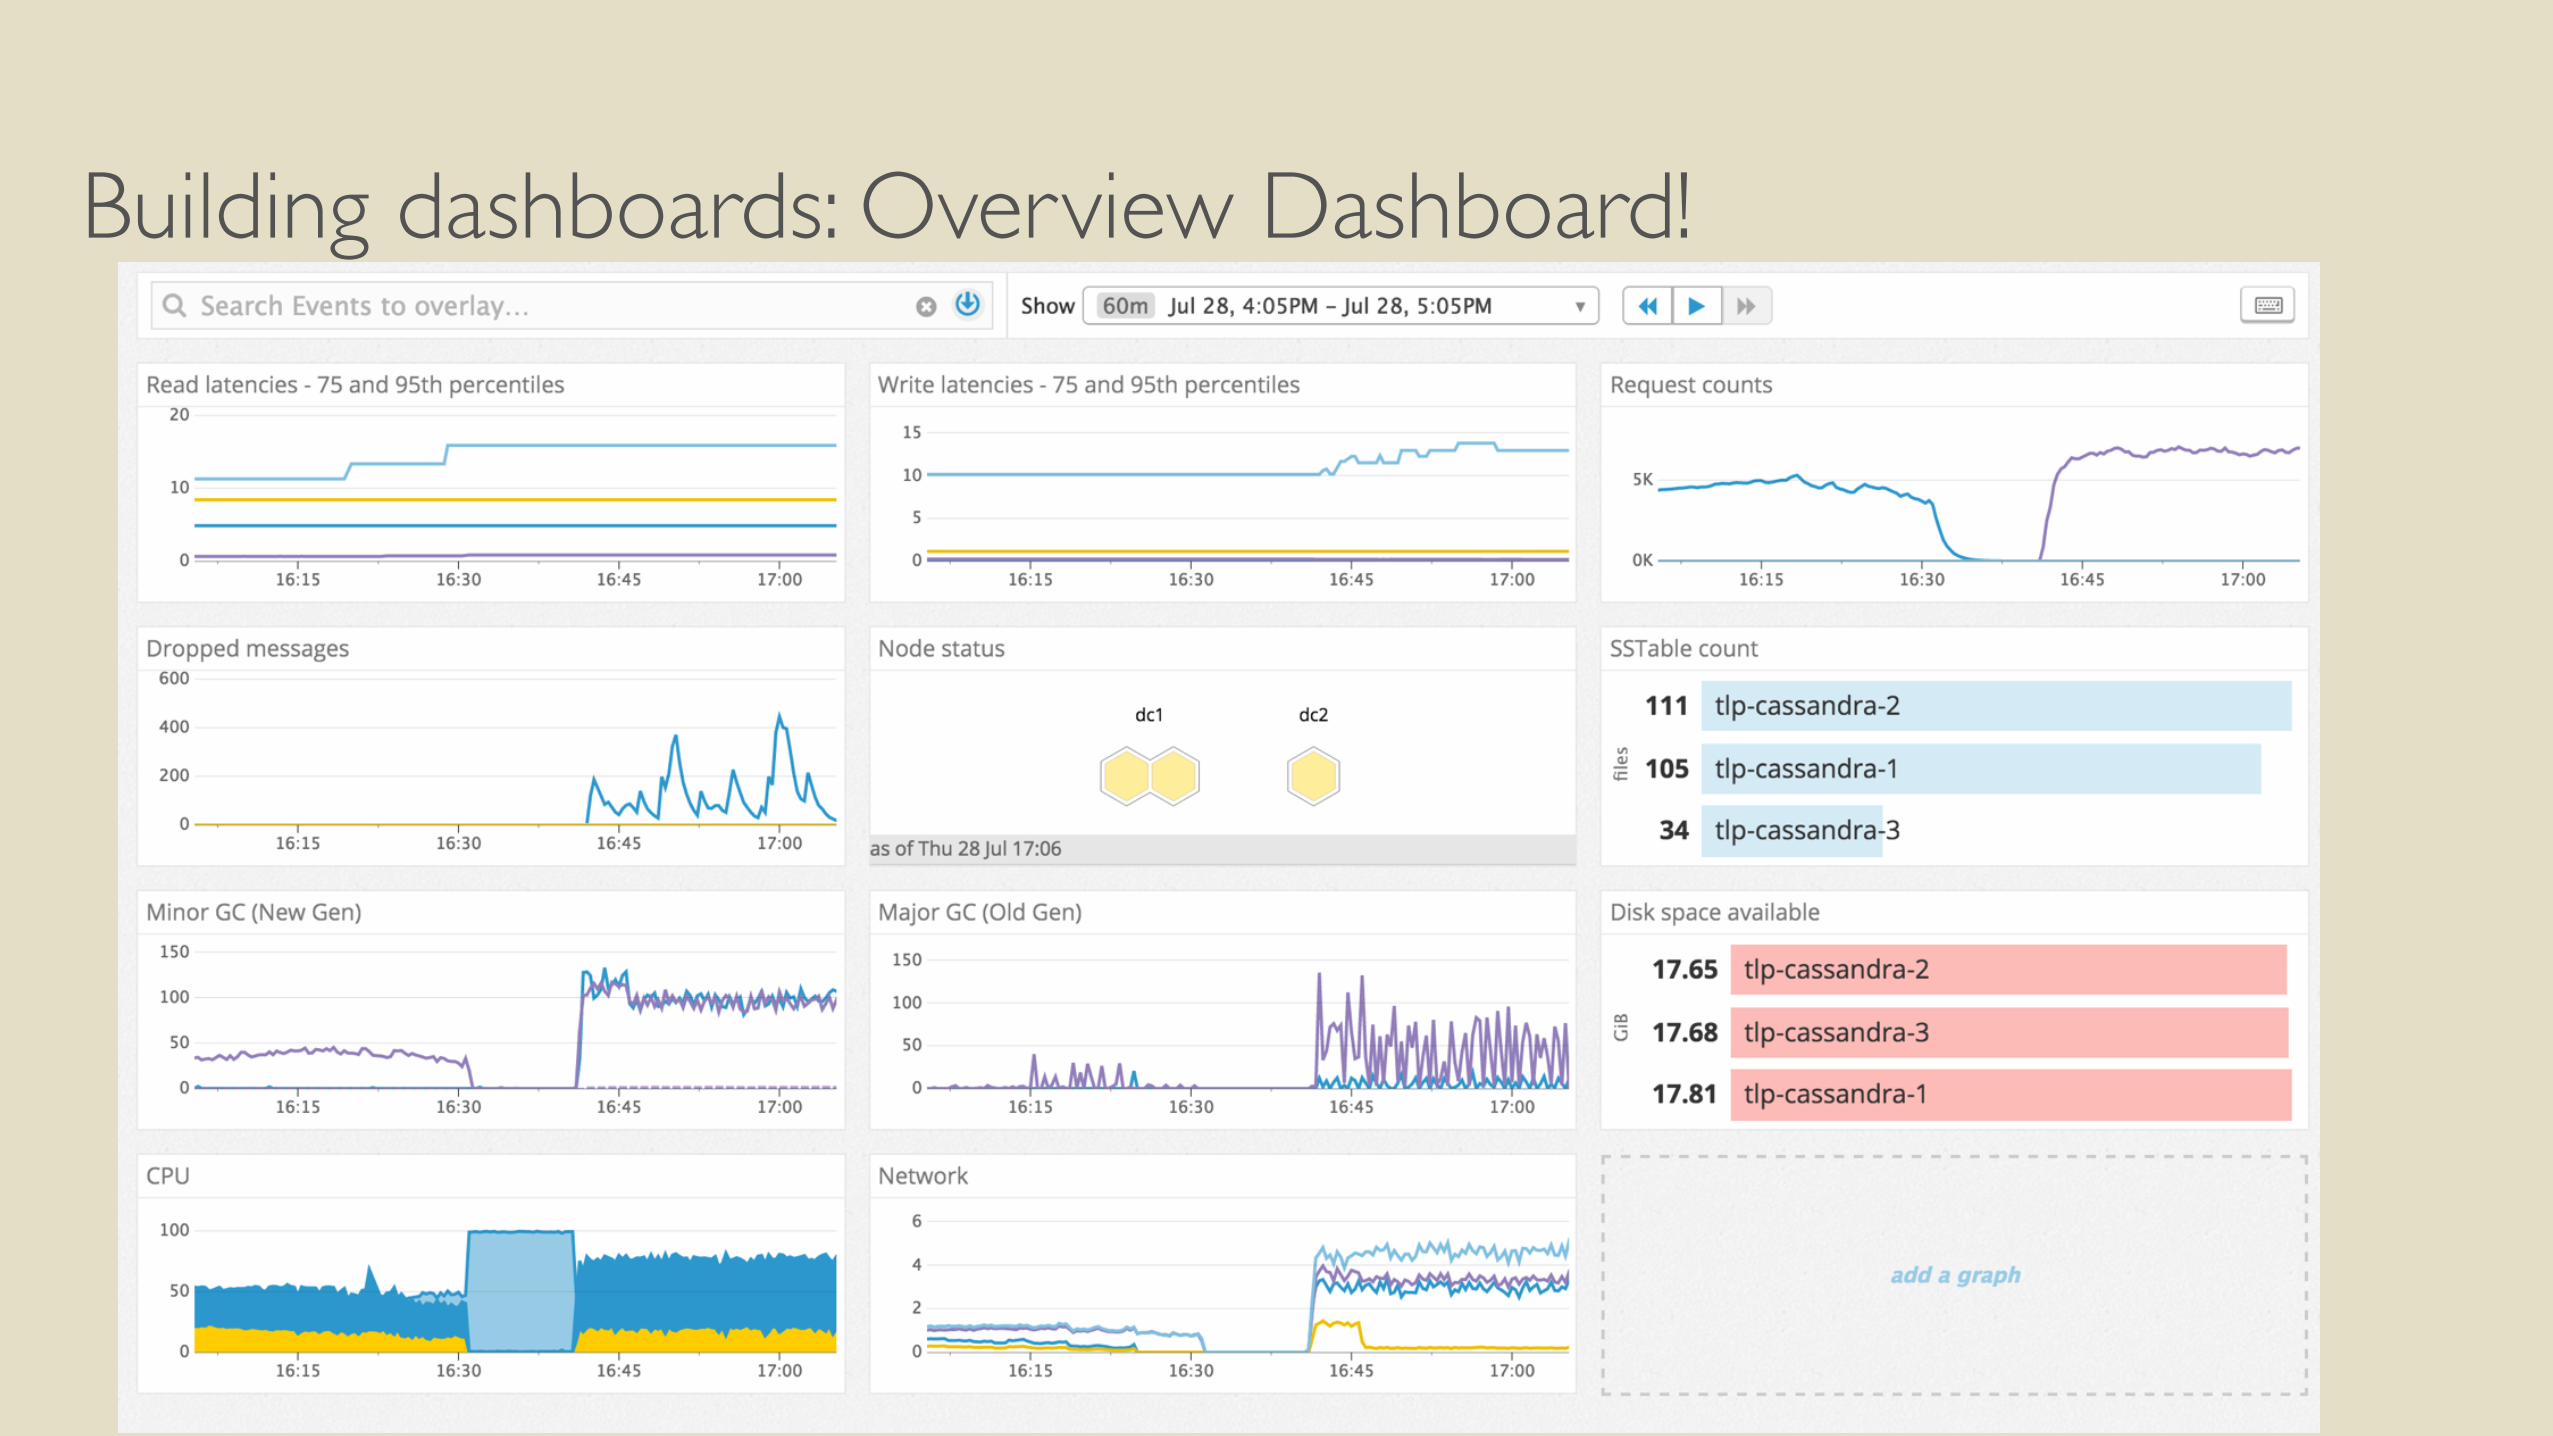
Building dashboards: Overview Dashboard!
• ADD screenshot when done with this dashboard.
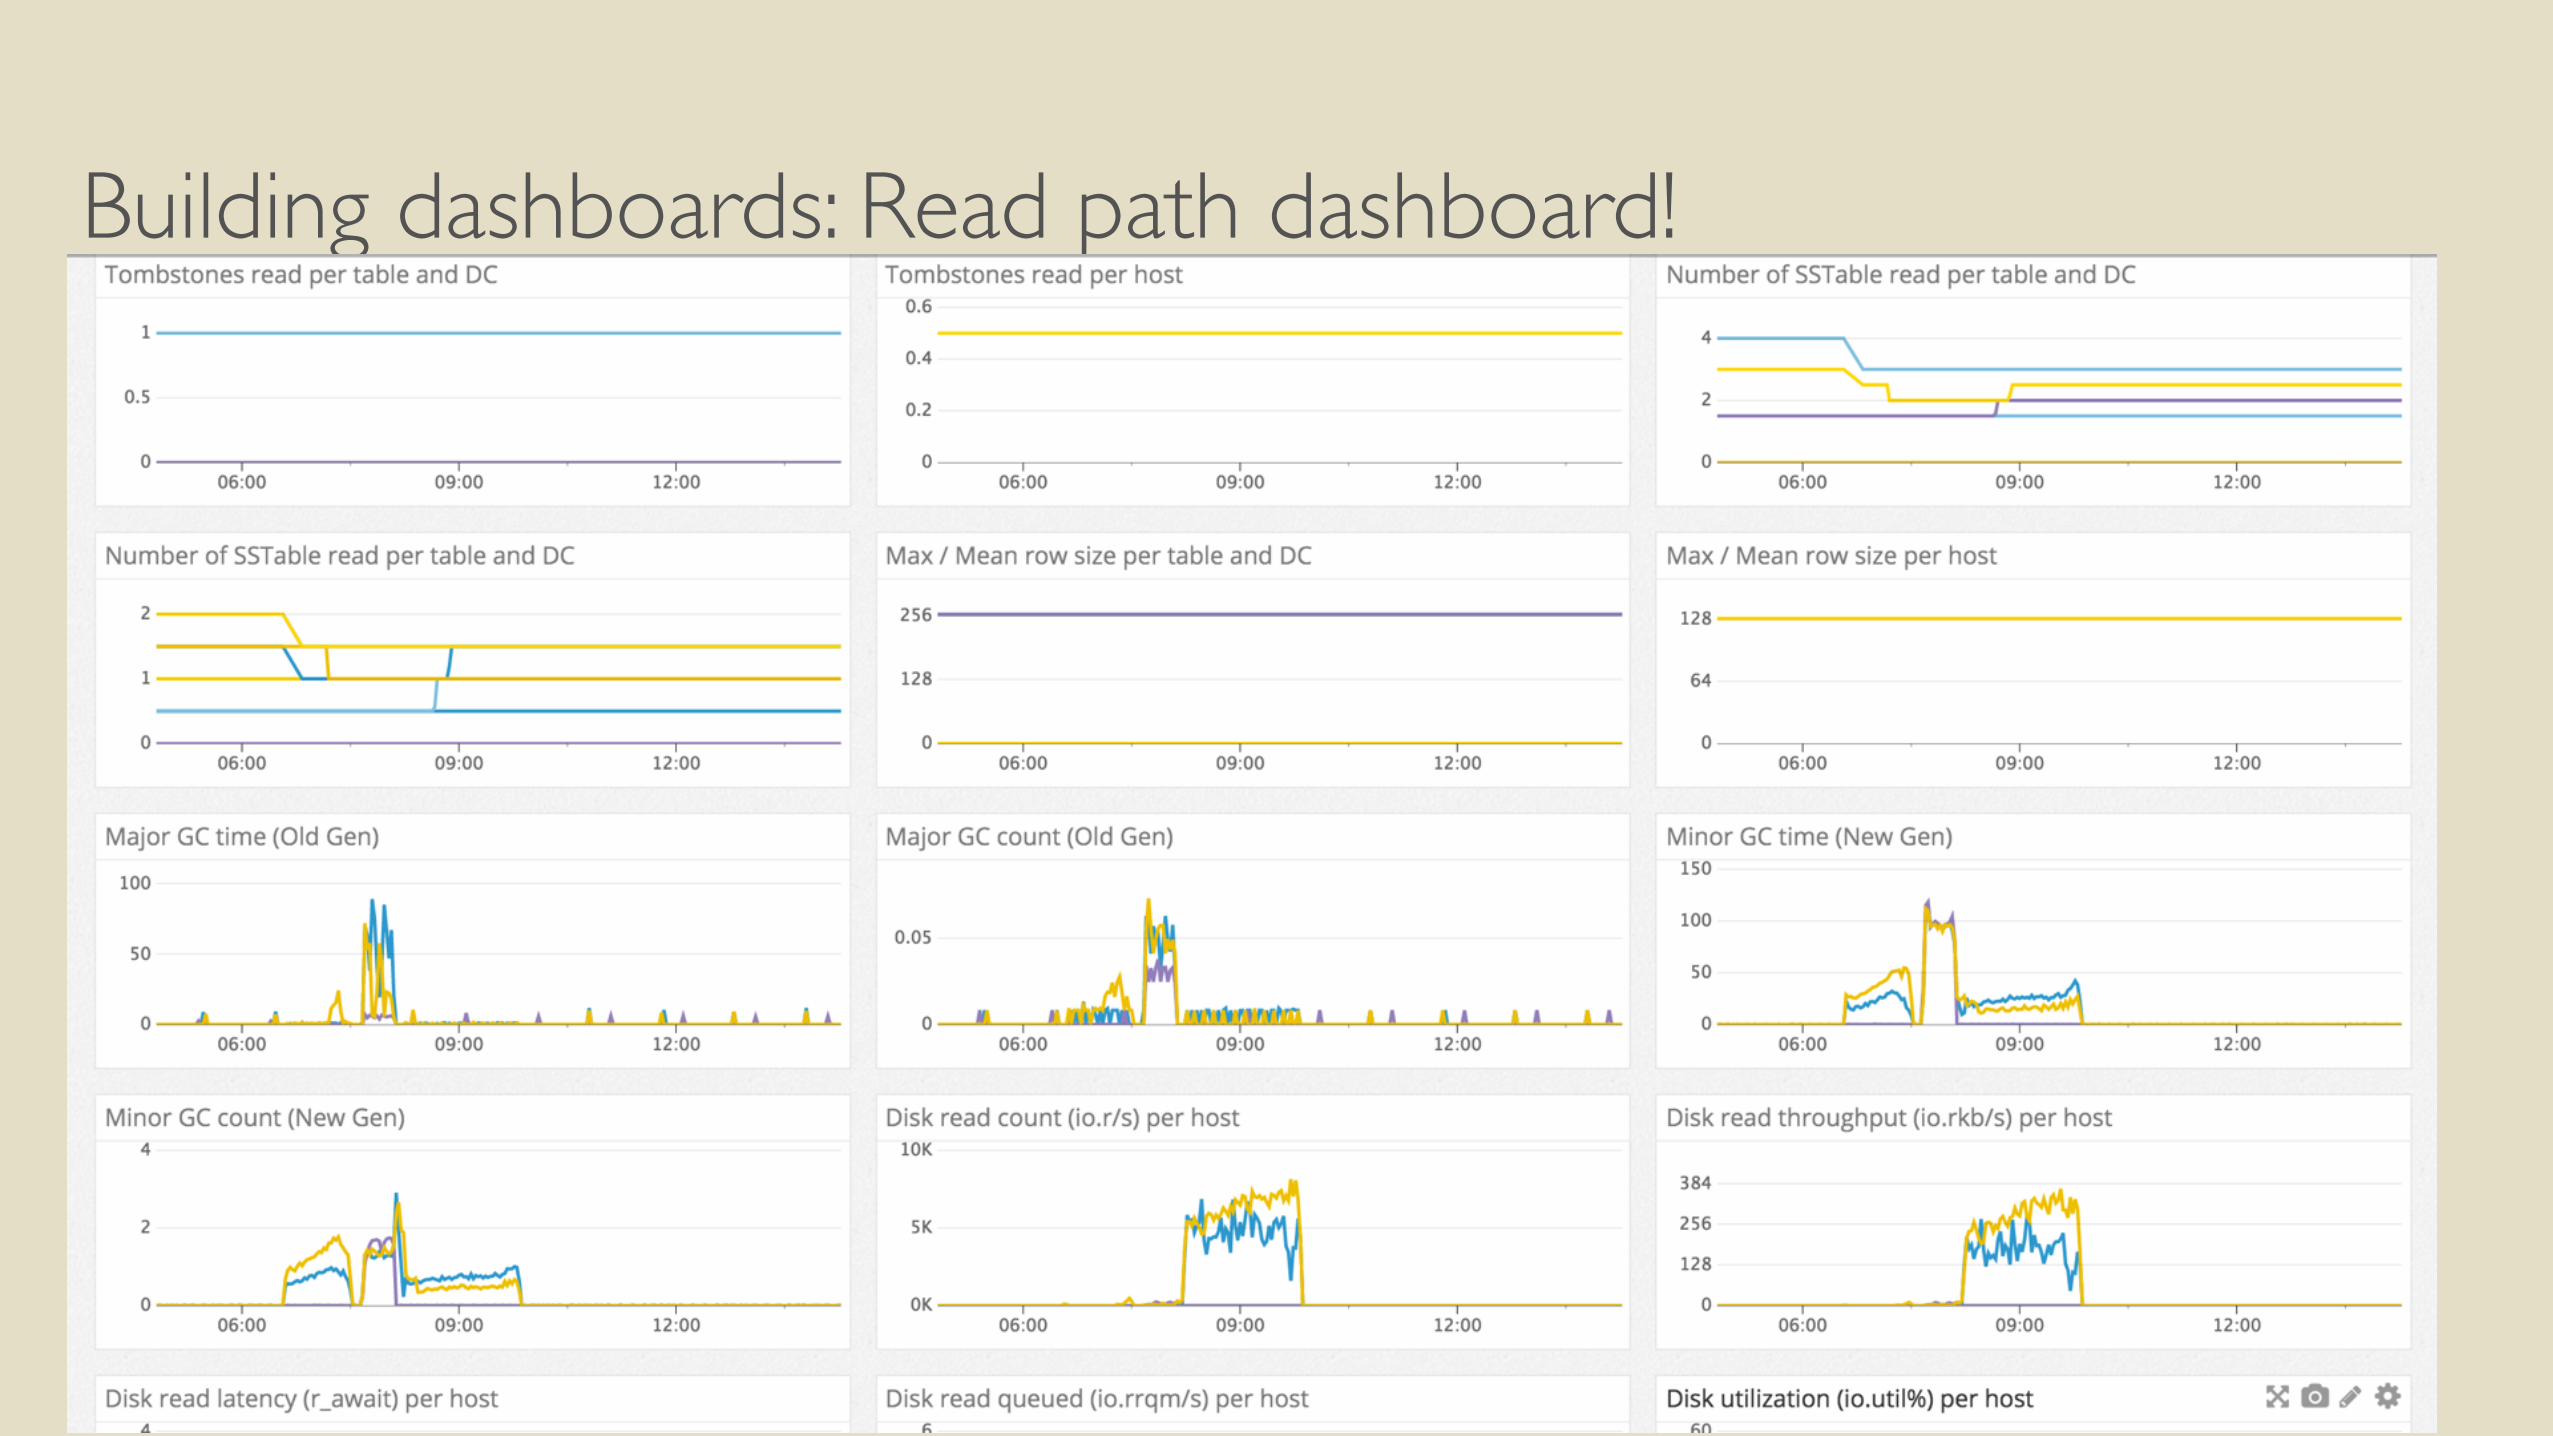
Building dashboards: Read path dashboard!
• ADD screenshot when done with this dashboard.
Building dashboards: Ongoing work
• This is an ongoing work
Building dashboards: Ongoing work
• This is an ongoing work
• Template will be shared and maintained by TLP (+ Monitoring provider)
Building dashboards: Ongoing work
• This is an ongoing work
• Template will be shared and maintained by TLP (+ Monitoring provider)
• Corresponding reporter / agent configuration will be shared
Building dashboards: Ongoing work
• This is an ongoing work
• Template will be shared and maintained by TLP (+ Monitoring provider)
• Corresponding reporter / agent configuration will be shared
• We will explain our choices and provide metrics in use

Conclusion
Make sure you are actually monitoring something!
• Monitoring is important for QoS and saving money.
• Having a monitoring tool doesnʼtmean things are monitored
Make sure you are actually monitoring something!
Always wonder:
• Was I able to detect latest outages?
• Would I now be able to detect outages I faced in the past?
• Do I find enough info to easily troubleshoot issues I face?
• Am I able to see impacts when I tune Cassandra?

Thank youQuestions ?