Monitoring and Verification Report -...
40
GRID Monitoring and Verification Report Street Lighting and DELP projects Strictly Private and Confidential September 2015
Transcript of Monitoring and Verification Report -...

GRID
Monitoring and Verification Report Street Lighting and DELP projects
Strictly Private and
Confidential
September 2015

Table of Contents
Table of contents
1. Executive Summary 6
1.1. Street Lighting 6
1.2. DELP 7
2. Background of the study 9
2.1. Objective of the study and methodology adopted 10
3. Street Lighting Projects 11
3.1. Overview of Street Lighting in India 11
3.2. Energy Efficiency Potential in Street Lighting in India 12
3.3. EESL service model 12
3.4. Background of the Street Lighting M&V project 12
3.5. Street Lighting projects targets 13
3.6. Current Status of the Projects 13
3.7. Survey Methodology 13
3.7.1. Sample Plan Distribution 13
3.8. Survey Questionnaire 15
3.9. Schedule of Surveys 15
3.10. Observations of the survey 15
3.11. Computation of key parameters 16
3.11.1. Energy Savings 16
3.11.2. Peak load reduction 18
3.11.3. Emission Reduction 19
3.12. Switch Point Measurements 20
3.12.1. Varanasi 20
3.12.2. Jhalawar 22
3.12.3. Mount Abu 23
3.12.4. Visakhapatnam 23
3.12.5. Agartala 25
4. Domestic Energy Efficient Lighting Program 26
4.1. Overview of Domestic Lighting Sector 26
4.2. Introduction 26
4.3. DELP targets 27
4.4. Current Status of the Projects 27
4.5. Survey Methodology 27
4.5.1. Survey Questionnaire 27
4.5.2. Sample Plan Distribution 28

Table of Contents
4.6. Schedule of Surveys 30
4.7. Results of the survey 30
4.8. Computation of key parameters 30
4.8.1. Energy Savings 30
4.8.2. Reduction of peak installed load 32
4.8.3. Emission Reduction 32
5. Conclusion 34
5.1. Street Lights 34
5.2. DELP 34
6. Appendices 35
6.1. Questionnaire for DELP 35
6.2. Questionnaire for Street Lighting 37
6.2.1. Switch point wise measurements for all the cities 37
6.2.2. Individual lighting point wise measurements for all the cities 37
List of Tables
Table 1: Targets for the street lighting projects ......................................................................................................... 13 Table 2: Status of street lighting projects ................................................................................................................... 13 Table 3: Number of LED fixtures installed in 5 cities under the M&V project ........................................................ 13 Table 4: Sample size for street lighting projects ........................................................................................................ 14 Table 5: Schedule of the M&V survey ......................................................................................................................... 15 Table 6: Observations of the M&V survey .................................................................................................................. 16 Table 7: Key results of the M&V survey ...................................................................................................................... 16 Table 8: Peak load reduction for 5 cities .................................................................................................................... 18 Table 9: Assumptions for Emission Reduction.......................................................................................................... 19 Table 10: Emission Reduction for street lighting projects ........................................................................................ 19 Table 11: Lighting levels measurements .................................................................................................................... 20 Table 12: Details of switch points in Varanasi ........................................................................................................... 21 Table 13: Details of switch points in Jhalawar .......................................................................................................... 22 Table 14: Details of switch points in Mount Abu ...................................................................................................... 23 Table 15: Details of switch points in Visakhapatnam ............................................................................................... 23 Table 16: Details of switch points in Agartala ........................................................................................................... 25 Table 17: DELP targets ............................................................................................................................................... 27 Table 18: Status of DELP............................................................................................................................................ 27 Table 19: Project Size of Completed Projects ............................................................................................................ 27 Table 20: Sample Size for DELP ................................................................................................................................ 28 Table 21: Sample distribution for DELP ................................................................................................................... 28 Table 22: Schedule for DELP surveys ....................................................................................................................... 30 Table 23: Results from the survey ............................................................................................................................. 30 Table 24: Assumption for calculations of savings for DELP ..................................................................................... 31 Table 25: Energy Saved for 5 regions ......................................................................................................................... 31 Table 26: Reduction of peak installed load for 5 cities ............................................................................................. 32 Table 27: Assumptions for Emission Reduction ....................................................................................................... 32 Table 28: Emission Reduction for DELP .................................................................................................................. 33

Table of Contents
List of Figures
Figure 1: Barriers limiting use of LED lighting ........................................................................................................... 9 Figure 2: Objectives of 100 Cities LED based Domestic Efficient Lighting Program (DELP) and Street Lighting
National Program ......................................................................................................................................................... 9 Figure 3: Methodology adopted for the assignment ..................................................................................................10 Figure 4: Demand of public lighting in India (in million units) ............................................................................... 11 Figure 5 : Business Models for DELP ........................................................................................................................ 26

Table of Contents
List of Abbreviations and Acronyms
BEE Bureau of Energy Efficiency
CAGR Compounded Annual Growth Rate
CEA Central Electricity Authority
DELP Domestic Efficient Lighting Program
EESL Energy Efficiency Services Limited
GHG Green House Gases
INR Indian Rupees
kWh Kilowatt hour
LED Light Emitting Diodes
M&V Monitoring and Verification
MW Mega watt
tCO2 Tonnes of carbon dioxide
THD Total Harmonics Distortion
ULB Urban Local Bodies
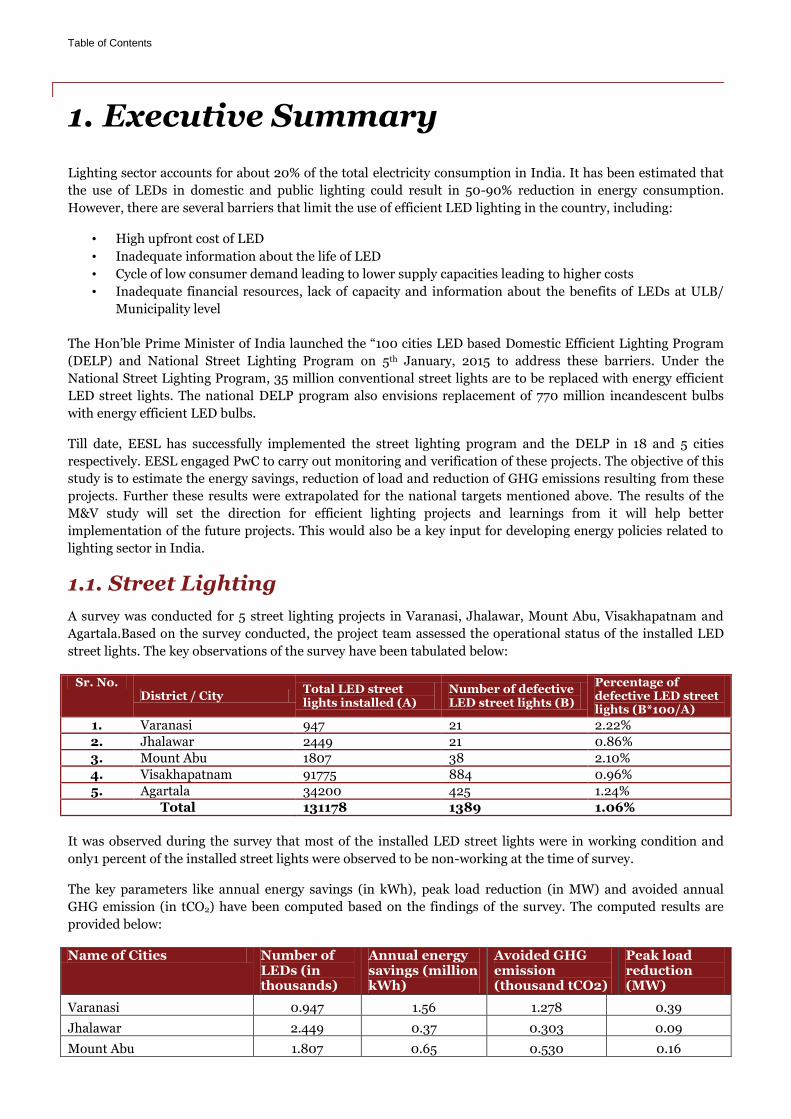
Table of Contents
1. Executive Summary
Lighting sector accounts for about 20% of the total electricity consumption in India. It has been estimated that
the use of LEDs in domestic and public lighting could result in 50-90% reduction in energy consumption.
However, there are several barriers that limit the use of efficient LED lighting in the country, including:
• High upfront cost of LED
• Inadequate information about the life of LED
• Cycle of low consumer demand leading to lower supply capacities leading to higher costs
• Inadequate financial resources, lack of capacity and information about the benefits of LEDs at ULB/
Municipality level
The Hon’ble Prime Minister of India launched the “100 cities LED based Domestic Efficient Lighting Program
(DELP) and National Street Lighting Program on 5th January, 2015 to address these barriers. Under the
National Street Lighting Program, 35 million conventional street lights are to be replaced with energy efficient
LED street lights. The national DELP program also envisions replacement of 770 million incandescent bulbs
with energy efficient LED bulbs.
Till date, EESL has successfully implemented the street lighting program and the DELP in 18 and 5 cities
respectively. EESL engaged PwC to carry out monitoring and verification of these projects. The objective of this
study is to estimate the energy savings, reduction of load and reduction of GHG emissions resulting from these
projects. Further these results were extrapolated for the national targets mentioned above. The results of the
M&V study will set the direction for efficient lighting projects and learnings from it will help better
implementation of the future projects. This would also be a key input for developing energy policies related to
lighting sector in India.
1.1. Street Lighting
A survey was conducted for 5 street lighting projects in Varanasi, Jhalawar, Mount Abu, Visakhapatnam and
Agartala.Based on the survey conducted, the project team assessed the operational status of the installed LED
street lights. The key observations of the survey have been tabulated below:
Sr. No. District / City
Total LED street lights installed (A)
Number of defective LED street lights (B)
Percentage of defective LED street lights (B*100/A)
1. Varanasi 947 21 2.22%
2. Jhalawar 2449 21 0.86%
3. Mount Abu 1807 38 2.10%
4. Visakhapatnam 91775 884 0.96%
5. Agartala 34200 425 1.24%
Total 131178 1389 1.06%
It was observed during the survey that most of the installed LED street lights were in working condition and
only1 percent of the installed street lights were observed to be non-working at the time of survey.
The key parameters like annual energy savings (in kWh), peak load reduction (in MW) and avoided annual
GHG emission (in tCO2) have been computed based on the findings of the survey. The computed results are
provided below:
Name of Cities Number of LEDs (in thousands)
Annual energy savings (million kWh)
Avoided GHG emission (thousand tCO2)
Peak load reduction (MW)
Varanasi 0.947 1.56 1.278 0.39
Jhalawar 2.449 0.37 0.303 0.09
Mount Abu 1.807 0.65 0.530 0.16

Table of Contents
Vizag 91.775 23.54 19.302 5.05
Agartala 34.200 3.90 3.200 0.97
Total (for 5 cities) 131.178 30.02 24.613 6.66 Total (at national level for 3.5 crore street lights) 35000 8008.59 6567.04 1777
It can be seen from the table that the installation of 131,178 LED street lights in the 5 cities has led to an annual
energy savings of 30.02 million kWh, an avoided annual GHG emissions of 24,613 tCO2 and peak load
reduction of 6.66 MW.
Similarly, the installation of 35 million LED street lights will lead to an annual energy savings of 8008.59
million kWh, an avoided annual GHG emissions of 6.57 million tCO2 and peak load reduction of 1,777 MW at
the national level.
In order to check the lighting level on the streets, lux measurements were also carried out during the study at
certain places on a sample basis. It was observed that the lux levels have increased considerably post the
installation of LED street lights.
1.2. DELP
Monitoring and verification activity was carried out for DELP projects implemented in Puducherry and four
districts of Andhra Pradesh. Survey was carried out for 120 households in each of the five project areas. The key
results from the survey are:
Sr No. District / City Total LED bulbs
distributed
Number of LEDs found operational
Number of LEDs
currently not operational
Number of defective
LEDs
Number of LEDs kept for
future purpose and others
[A = B+C] [B] [C = i+ii] [i] [ii]
1 Puducherry 338 331 7 4 3
2 Anantapur 240 237 3 2 1
3 Guntur 240 237 3 2 1
5 Srikakulam 240 237 3 3 0
6 W. Godavari 240 238 2 1 1
Total 1298 1280 18 12 6
Percentage 100.00% 98.61% 1.39% 0.92% 0.46%
For the purpose of the analysis, it is assumed that the broken and damaged bulbs will be replaced with new LED
bulbs by the consumers and therefore included in the number of operational LEDs. It was observed that bulbs
were broken during cleaning (0.84%) and suffered from water damage (1%)
Based on these survey results, the total savings, reduction of peak load and emission reduction for every project
was calculated.
Region Units saved for the overall project (million kWh)
Peak load reduction (MW)
Emission reduction (thousand tCO2)
Puducherry 80.95 15.81 65.6
Anantapur 150.06 29.36 121.5
Guntur 249.33 48.70 202.0
Srikakulam 142.04 27.87 115.1
W. Godavari 214.10 41.82 173.4
Total (for five cities) 836.48 163.56 677.6
National Level (for 77 crores LED bulb distribution)
102901 20122 84379.5

Table of Contents
These results were further extrapolated to the entire national program (replacement of 77 crore domestic
lights). At a national level 102.9 billion kWh would be saved annually resulting in reduction of 20,100 MW peak
load and 84.37 million tCO2 reduction.

Background of the study
Monitoring and Verification Report - Street Lighting and DELP projects
PwC 9
2. Background of the study
Lighting sector accounts for about 20% of the total electricity consumption in India. Most of the lighting needs
in domestic and public lighting sector are met by conventional lights, including highly inefficient incandescent
bulbs in domestic sector and conventional street lights in public lighting sector. LED provides better light
output than conventional light.
Use of LEDs in domestic and public lighting could result in 50-90% reduction in energy consumption.
However, there are several barriers that limit the use of efficient LED lighting in the country. Some of the key
barriers are:
Figure 1: Barriers limiting use of LED lighting
To address these barriers the “100 Cities LED based Domestic Efficient Lighting Program (DELP) and Street
Lighting National Program” was launched by the Prime Minister of India on 5th January, 2015. Energy
Efficiency Services Limited (EESL)has been designated as the implementing agency for the program. The key
objectives of the national program are:
Figure 2: Objectives of 100 Cities LED based Domestic Efficient Lighting Program (DELP) and Street Lighting National Program
High Upfront Cost of LED
Inadqeuate information about the life of LED
Cycle of low consumer demand leading to
lower supply capacities leading to higher costs
Inadequate financial resources and lack of
capacity and information about new technologies at ULB/
Municipality level

Background of the study
Monitoring and Verification Report - Street Lighting and DELP projects
PwC 10
2.1. Objective of the study and methodology adopted
The overall objective of this study is to conduct surveys and measurements to quantify energy savings of five
DELP and street lighting projects individually, extrapolate the savings to overall program and also to evaluate
the GHG emission reductions.
The key output of this study is computation of the total energy saving of the DELP and the EE street lighting
national level. The results of this study would be used in developing energy policies in India.
Figure 3: Methodology adopted for the assignment

Street Lighting Projects
Monitoring and Verification Report - Street Lighting and DELP projects
PwC 11
3. Street Lighting Projects
3.1. Overview of Street Lighting in India
In India, providing public lighting is one important function that urban local bodies (ULB) fulfill. Street lighting
provides an important function; keeping pedestrians, drivers, and other roadway users safe, while promoting
use of public spaces. Studies have shown that proper street lighting can substantially reduce fatalities and
crashes with pedestrians and lighted intersections and highways have fewer crashes than their unlit
counterparts. However, public lighting is costly for local governments. Street lights have high hours-of-use
(they are on for over 4,000 hours per year) and thus are large consumers of energy. Different studies indicate
that municipal street lighting can represent from 5% to over 60% of a ULB’s electric bill, depending on the
municipality’s size, the services it offers, and the efficiency of its public lighting.
As per the 18th Electric Power Survey of Central Electricity Authority (CEA), the estimated energy consumption
in Indian public lighting sector with 2009-10 as the base year was about 8,478 million kWh in 2012-13. This is
expected to grow at a CAGR of 7% during the XII and XIII plan periods. The chart below indicates this trend:
Figure 4: Demand of public lighting in India (in million units)
Source: 18th Electric Power Survey, CEA
Based on the projections, the lighting demand in India for the financial year 2015-16 is 10508 Million Units.
Assuming that the average public light operates for 11 hours a day throughout the year, the total connected load
is 2.62 million kW. Assuming 25% of street lights are not in working condition, the total connected load of
street lights across the country is around 3,400 MW.
Unfortunately, there is no comprehensive data available for street or public lighting specifying luminaire types
currently installed. Some public lighting retrofit reports give detailed information on luminaire types replaced,
but do not provide detail on current public lighting installations. Different type of luminaire being used in
public lighting in India are Incandescent, Tungsten halogen, Compact Fluorescent, High intensity discharge,
Linear fluorescent, etc. Most of these luminaire types are inefficient type of street lighting luminaires in
comparison to the latest technology i.e. LED type luminaires which are highly energy efficient. Thus, there is
79208478
11192
14901
0
2000
4000
6000
8000
10000
12000
14000
16000
2011-12 2012-13 2016-17 2021-22

Street Lighting Projects
Monitoring and Verification Report - Street Lighting and DELP projects
PwC 12
significant potential not only for energy-efficiency retrofits, but also for improved operational procedures in
new or relocated street lighting installations.
3.2. Energy Efficiency Potential in Street Lighting in India
The potential impact for energy savings in street lighting in India is substantial and has been considered as one
of seven key levers that India can use to reduce carbon emissions. Public lighting could have a large, swift
impact, as each ULB has a substantial lighting footprint. In addition to the environmental benefits, any
initiative for energy consumption reduction in public lighting will also lead to the better financial health of the
ULBs.
Based on the projections, the total connected load of street lights across the country is around 3,400 MW that
can be reduced to 1,400 MWby replacing conventional lights with LED based street lights. These replacements
can lead to saving of approximately 9 billion kWh of energy and cost saving of INR 5,500 crore to municipalities
annually.
Despite this potential, the progress in transition to energy efficient street lighting in the Municipalities and
ULBs has been slow. While several states have taken steps to implement energy efficiency in the street light
sector through ESCO mode, the actual implementation on the ground has been largely unsuccessful. This may
be due to many factors including: inadequate baseline data, lack of performance contracts standardization, and
lack of access to finance by Municipalities or poor financial position of ESCOs.
3.3. EESL service model
EESL, justifying its origin, started working in this sector in last 2-3 years as a government ESCO company and
worked towards developing faith of the municipalities in new and innovative technologies and implemented a
few successful projects in ESCO mode. EESL has evolved a service model where it replaces the conventional
street lights with LEDs at its own costs (without any need for municipalities to invest) and the consequent
reduction in energy and maintenance cost of the municipality is used to repay EESL over a period of time. The
contracts that EESL enters into with municipalities are typically of 7 years duration where it not only
guarantees a minimum energy saving (of-typically 50%) but also provides free replacements and maintenance
of lights at no additional cost to the municipality during the contract period. The service model enables the
municipalities to go in for state of the art street lights with no upfront capital cost and repayments to EESL are
within the present level of expenditure. Thus, there is no additional revenue expenditure required to be
incurred by the municipality for change over to energy efficient LED street lights.
3.4. Background of the Street Lighting M&V project
The Hon’ble Prime Minister of India launched the “100 cities LED based Domestic Efficient Lighting Program
(DELP) and National Street Lighting Program on 5th January, 2015. Under the National Street Lighting
Program, the conventional street lights are being replaced with smart and energy efficient LED street lights.
EESL has been given the task of replacing conventional street lights in the selected 100 cities with the LED
street lights.
At present, EESL has already successfully implemented 18 projects for street lighting. To assess the impact of
the implemented projects, EESL has carried out this M&V study through PwC. The objective of this study is to
evaluate the impact in terms of energy savings and reduction of GHG emissions as a result of these projects.
Further, the results have been extrapolated for the entire National Street Lighting Program. The results of the
M&V study will set the direction for the future street lighting projects and learnings from it will help better
implementation of the future projects. This would also be a key input for developing energy policies related to
street lighting in India.

Street Lighting Projects
Monitoring and Verification Report - Street Lighting and DELP projects
PwC 13
3.5. Street Lighting projects targets
The targets for the street lighting projects are:
Table 1: Targets for the street lighting projects
No. of street lights to be replaced 35 million
Expected annual energy savings 9000 million kWh
Expected reduction of installed street light load 1500 MW
Estimated capital investment (excludingO&M) Rs. 35,000 crore
Annual estimated greenhouse gas emission reductions 6.2 million tonnes of CO2
3.6. Current Status of the Projects
To accomplish the targets of replacing35 million conventional street lights with LED street lights across India,
EESL has successfully implemented projects in 18 cities and work is under progress in 82 cities. The current
status of LED street lighting projects is tabulated below:
Table 2: Status of street lighting projects
Parameters Details
No of ULBs enrolled 302
No of ULBs where work has been completed 18
No of ULBs where work is under progress 82
The M&V project has been carried out for LED street lights projects implemented in 5 cities namely Agartala,
Mount Abu, Jhalawar, Visakhapatnam and Varanasi. The total numbers of LED fixtures installed in these 5
cities are reflected as:
Table 3: Number of LED fixtures installed in 5 cities under the M&V project
S. No. City No of LED fixtures installed(nos.)
1. Agartala 34,200
2. Mount Abu 1,807
3. Jhalawar 2,449
4. Visakhapatnam 91,775
5. Varanasi 947
3.7. Survey Methodology
3.7.1. Sample Plan Distribution
The savings from street lighting projects is computed based on the sample measurements of each lighting
fixture types in the towns. The sample sizes decided for the individual measurements based on 80% confidence
level and 10% margin of error have been computed by using the following formula:
𝑆𝑎𝑚𝑝𝑙𝑒 𝑠𝑖𝑧𝑒 𝑛 = 41 𝑋 𝑁
41 + 𝑁

Street Lighting Projects
Monitoring and Verification Report - Street Lighting and DELP projects
PwC 14
For the switch points recording of 4 hours, one sample switch point for each lighting fixture type has been considered for carrying the measurements in all the cities.
Based on the above sampling formula and approved approach for recording measurements in the switch points, the sampling size for various types of LED fixtures types in different cities is provided below.
Table 4: Sample size for street lighting projects
1.Varanasi, Uttar Pradesh
Fixture type & Numbers
S. No. Parameters 120W 160W
(Flood Lights) 160W
(Street Lights) 200W
1 Number of fixtures installed 101 136 102 608
2 Sample size to be covered for each fixture type 30 32 30 39
3 Sample number of switch points to be covered 1 1 1 1
2. Jhalawar, Rajasthan
Fixture type & Numbers
S. No. Parameters 12W 18W 40W 72W 120W 190W
1 Number of fixtures installed 372 1624 157 140 120 36
2 Sample size to be covered for each fixture type 38 41 33 32 31 20
3 Sample number of switch points to be covered 1 1 1 1 1 1
3. Mount Abu, Rajasthan
Fixture type & Numbers
S. No. Parameters 15W 35W 70W 120W
1 Number of fixtures installed 551 119 966 171
2 Sample size to be covered for each fixture type 39 31 40 34
3 Sample number of switch points to be covered 1 1 1 1
4. Visakhapatnam, Andhra Pradesh
Fixture types & Numbers
S. No. Parameters 20W 40W 70W 120W 150W 160W 210W
1 Number of fixtures installed 60395 4084 18392 4578 3000 1200 126
2 Sample size to be covered for each fixture type 42 41 41 41 41 40 32
3 Sample number of switch points to be covered 1 1 1 1 1 1 1

Street Lighting Projects
Monitoring and Verification Report - Street Lighting and DELP projects
PwC 15
5. Agartala, Tripura
Fixture types & Numbers
S. No. Parameters 10W 12W 36W 40W 120W 150W
1 Number of fixtures installed 16930 11286 984 656 3844 500
2 Sample size to be covered for each fixture type 41 41 40 39 41 39
3 Sample number of switch points to be covered 1 1 1 1 1 1
3.8. Survey Questionnaire
The questionnaire prepared for survey capturedthe various parameters including:
Number of LED street lights installed and in working condition and non-working condition
Measurement of electrical parameters like voltage, current, power, power factor, harmonics etc. for the sample of LED fixtures
Recording of measurements of electrical parameters for 4 hours on the feeder i.e. switch point for the sample of lighting fixtures
The results of the questionnaire have been used to extrapolate the number of LED street lights in working
condition. Based on the survey findings, the actual energy savings accrued due to the installation of LED street
lights have also been quantified in terms of estimated energy savings in million units/annum, avoided peak load
reduction in MW and reduction in GHG emissions in tonnes of CO2.
The survey questionnaire prepared is attached as Annexure in this report.
3.9. Schedule of Surveys
The survey was carried out with the help of EESL’s site officials in all the five cities. The dates of the survey are
given below:
Table 5: Schedule of the M&V survey
Sr. No. Area Date of M&V survey
1 Varanasi 9-13 September 2015
2 Jhalawar 16-17 September 2015
3 Mount Abu 18-21 September 2015
4 Visakhapatnam 22-25 September 2015
5 Agartala 1-4 October 2015
3.10. Observations of the survey
Based on the surveys conducted, the project team analyzed the data to evaluate the operational status of the
LED street lights installed. The observations of the survey have been tabulated below:

Street Lighting Projects
Monitoring and Verification Report - Street Lighting and DELP projects
PwC 16
Table 6: Observations of the M&V survey
Sr No. District / City
Total LED street lights installed (A)
Number of defective LED street lights (B)
Percentage of defective LED street lights (B*100/A)
1. Varanasi 947 21 2.22%
2. Jhalawar 2449 21 0.86%
3. Mount Abu 1807 38 2.10%
4. Visakhapatnam 91775 884 0.96%
5. Agartala 34200 425 1.24%
Total 131178 1389 1.06%
It was observed during the survey that most of the LED street lights installed were in working condition and
only 1 percent of the installed street lights were observed to be non-working. Based on discussion with the
officials of Municipal Corporation and local suppliers in these cities, it was found that line faults were the major
reasons for non-working of LEDs. And in most cases, the drivers were replaced/repaired with the new ones.
3.11. Computation of key parameters
The key parameters like annual energy savings (in kWh), peak load reduction (in MW) and avoided annual
GHG emission (in tCO2) have been computed based on the findings of the survey. The computed results are
provided below:
3.11.1. Energy Savings
Energy saved has been computed based on the number of LED Street lights installed. The formula used for
computation is
𝐸𝑛𝑒𝑟𝑔𝑦 𝑆𝑎𝑣𝑖𝑛𝑔𝑠 = 𝐵𝑎𝑠𝑒𝑙𝑖𝑛𝑒 𝐶𝑜𝑛𝑠𝑢𝑚𝑝𝑡𝑖𝑜𝑛 − 𝐶𝑜𝑛𝑠𝑢𝑚𝑝𝑡𝑖𝑜𝑛 𝑝𝑜𝑠𝑡 𝑃𝑟𝑜𝑗𝑒𝑐𝑡 𝐼𝑚𝑝𝑙𝑒𝑚𝑒𝑛𝑡𝑎𝑡𝑖𝑜𝑛
The results of the survey were further extrapolated to the cities as provided below:
Table 7: Key results of the M&V survey
1. Varanasi, Uttar Pradesh
Rating of street lighting lamp before LED installation (W)
Rating of installed LED lamp (W)
Average measured power of installed LED lamp (W)
Annual energy consumption before LED installation (kWh)
Annual energy consumption after LED installation (kWh)
Annual energy savings (kWh)
250 W 120W 113 111517 45673 65843 250 W 160W Street Lights 159 112621 65198 47423
400 W 160W Flood Lights 161 360386 87641 272745 2x400 W,
400 W 200W, 160 W 186 1624910 452910 1172000
Total Savings 2209433 651422 1558011
Total percentage
savings (%) 71%

Street Lighting Projects
Monitoring and Verification Report - Street Lighting and DELP projects
PwC 17
2. Jhalawar, Rajasthan
Rating of street lighting lamp before LED installation (W)
Rating of installed LED lamp (W)
Average measured power of installed LED lamp (W)
Annual energy consumption before LED installation (kWh)
Annual energy consumption after LED installation (kWh)
Annual energy savings (kWh)
20 W 12W 12 29872 18581 11290
40 W 18W 19 299937 125661 174276
70 W 40W 43 47277 27194 20082
150 W 72W 70 95557 39132 56425
250 W 120W 128 132495 61539 70956
400 W 190W 195 65043 28136 36907
Total Savings 670180 300242 369938
Total percentage
savings (%) 55%
3. Mount Abu, Rajasthan
Rating of street lighting lamp before LED installation (W)
Rating of installed LED lamp (W)
Average measured power of installed LED lamp (W)
Annual energy consumption before LED installation (kWh)
Annual energy consumption after LED installation (kWh)
Annual energy savings (kWh)
36 W 15W 16 79642 34293 45348
70 W 35W 39 35834 18526 17308
150 W 70W 76 659343 295789 363554
400 W 120W 129 308954 88885 220069
Total Savings 1083773 437493 646280
Total percentage
savings (%) 60%
4. Visakhapatnam, Andhra Pradesh
Rating of street lighting lamp before LED installation (W)
Rating of installed LED lamp (W)
Average measured power of installed LED lamp (W)
Annual energy consumption before LED installation (kWh)
Annual energy consumption after LED installation (kWh)
Annual energy savings (kWh)
40 W 20W 22.08 13755565 5353873 8401692
70 W 40W 40.71 1431034 667484 763550
150 W 70W 67.66 13291898 4996571 8295327
250 W 120W 115.31 5514201 2119387 3394814
250 W 150W 146.10 3613500 1759796 1853704
250 W 160W 154.16 1445400 742722 702678
400 W 210W 212.43 234549 107466 127083

Street Lighting Projects
Monitoring and Verification Report - Street Lighting and DELP projects
PwC 18
Total Savings 39286147 15747299 23538848
Total percentage
savings (%) 60%
5. Agartala, Tripura
Rating of street lighting lamp before LED installation (W)
Rating of installed LED lamp (W)
Average measured power of installed LED lamp (W)
Annual energy consumption before LED installation (kWh)
Annual energy consumption after LED installation (kWh)
Annual energy savings (kWh)
18 W 10 W 9.03 1223531 613712 609819
18 W 12 W 11.65 815639 527883 287756
85 W 36 W 35.52 335815 140339 195476
85 W 40 W 40.06 223876 105516 118360
250 W 120 W 116.93 4244257 1804622 2439635
250 W 150 W 149.67 552063 300466 251596
Total Savings 7395180 3492538 3902642
Total percentage
savings (%) 53%
3.11.2. Peak load reduction
The peak load reduction refers to the MW savings accrued with the implementation of LED street lighting
projects. This reduces the burden on the already constrained generation capacity of the nation.
The peak load reduction can be calculated by the formula:
𝐿𝑜𝑎𝑑 𝑟𝑒𝑑𝑢𝑐𝑡𝑖𝑜𝑛 𝑖𝑛 𝑘𝑊
=𝑁𝑢𝑚𝑏𝑒𝑟 𝑜𝑓 𝐿𝐸𝐷𝑠 𝑖𝑛𝑠𝑡𝑎𝑙𝑙𝑒𝑑 𝑤𝑎𝑡𝑡𝑎𝑔𝑒 𝑜𝑓 𝑐𝑜𝑛𝑣𝑒𝑛𝑡𝑖𝑜𝑛𝑎𝑙 𝑙𝑖𝑔𝑡𝑠 − 𝑤𝑎𝑡𝑡𝑎𝑔𝑒 𝑜𝑓 𝐿𝐸𝐷𝑠 × 𝑃𝑒𝑎𝑘 𝐶𝑜𝑖𝑛𝑐𝑖𝑑𝑒𝑛𝑐𝑒 𝐹𝑎𝑐𝑡𝑜𝑟
1000
For the computation of peak load reduction from implementation of LED street lighting projects, the peak
coincidence factor has been taken as 1 based on various load research studies.
Table 8: Peak load reduction for 5 cities
Sr. No. Cities Peak load reduction (MW)
1. Varanasi 0.39
2. Jhalawar 0.09
3. Mount Abu 0.16
4. Visakhapatnam 5.05
5. Agartala 0.97
Total (for 5 cities) 6.66
Total (at national level) 1777
Based on the results achieved, the peak load reduction for street lighting projects in these 5 cities is 6.66 MW.
Similarly, the installation of 35 million LED street lights at the national level will lead to peak load reduction
of1,777 MW.

Street Lighting Projects
Monitoring and Verification Report - Street Lighting and DELP projects
PwC 19
3.11.3. Emission Reduction
The reduction in GHG emission has been computed based on the Baseline Carbon Dioxide Emission Database
published by Central Electricity Authority, Government of India.
𝑅𝑒𝑑𝑢𝑐𝑡𝑖𝑜𝑛 𝑖𝑛 𝐺𝐻𝐺 𝑒𝑚𝑖𝑠𝑠𝑖𝑜𝑛𝑠 = 𝐸𝑛𝑒𝑟𝑔𝑦 𝑢𝑛𝑖𝑡𝑠 𝑠𝑎𝑣𝑒𝑑 × 𝐸𝑚𝑖𝑠𝑠𝑖𝑜𝑛 𝐹𝑎𝑐𝑡𝑜𝑟
The most recent emission factors published by Central Electricity Authority (CEA) are:
Table 9: Assumptions for Emission Reduction
Grid Emission factor in tCO2/MWh1
NEWNE 0.82
South 0.81
India 0.82
Based on the above mentioned emission factors, the emission reductions for all these projects are:
Table 10: Emission Reduction for street lighting projects
Sr. No.
Region Units Saved (million kWh)
Emission Factor GHG Emission Reduction (thousand tCO2)
1. Varanasi 1.56 0.82 1.278
2. Jhalawar 0.37 0.82 0.303
3. Mount Abu 0.65 0.82 0.530
4. Visakhapatnam 23.54 0.82 19.302
5. Agartala 3.90 0.82 3.20
Total (for 5 cities) 30.02 0.82 24.613
Total (at national level) 8008.59 0.82 6567.04
Based on the results achieved, the reduction in GHG emissions for street lighting projects in these 5 cities is
24,613tCO2. Similarly, the installation of 35 million LED street lights at the national level will result in the
reduction of total GHG emissions of 6.57 million tCO2.
Lighting levels
The sample lighting levelsmeasurements were carried out at certain locations in the cities. It was observed
during the survey that the lux levels have considerably improved with the installation of LED street lights in
comparison to the conventional street lights. During discussions with the locals in the cities, it was found that
LED street lights have also illuminated those places where there was no illumination or very little illumination.
The findings of the lighting levels measurements are tabulated below:
1 Weighted average emission factor based on “User Guide (Version 10.0) of CO2 baseline database for the Indian Power Sector prepared by Central Electricity Authority, Ministry of Power, GoI.

Street Lighting Projects
Monitoring and Verification Report - Street Lighting and DELP projects
PwC 20
Table 11: Lighting levels measurements
Varanasi
S. No. Name of the location/ switch point Average lighting levels (lux) 1 ASSI Ghat 70 2 Ganga Mahal Ghat 45 3 Bhadaini Ghat 35 4 Harishchandra Ghat 50 5 Hanumana Gardhi Ghat 15
The variation in the lux levels is attributed to the road width, distance between two poles etc. Based on the
discussions, it was found that the lux levels have considerably increased with the installation of LED street
lights as compared to conventional lights.
Visakhapatnam
S. No. Name of the location/ switch point Average lighting levels(lux) 1 PDP/SW/01 7.75 2 VM/SW/01 15.25 3 RKM/SW/01 19.06 4 AS/SW/01 19 5 FOB/SW/01 20.10
The variation in the lux levels is attributed to the road width, distance between two poles etc. It was also
observed that lux levels have considerably increased with the installation of LED street lights as compared to
conventional lights.
Agartala
S. No. Name of the location/ switch point Average lighting levels (lux) 1 Roy Medical Store 46 2 Old Secretariat 42.19 3 Gorka Basti 56.12 4 Governor house 66.13 5 Neta chowmni 7.63
The variation in the lux levels is attributed to the road width, distance between two poles etc. The lux levels
have considerably increased with the installation of LED street lights as compared to conventional lights.
3.12. Switch Point Measurements
3.12.1. Varanasi
There are four types of LED lighting fixtures installed in Varanasi. The electrical parameters for one switch
point of each LED lighting fixture type were recorded for about 4 hours. The consolidated details of switch
points covered and the number of various lighting fixtures types connected to that switch point are provided
below:

Street Lighting Projects
Monitoring and Verification Report - Street Lighting and DELP projects
PwC 21
Table 12: Details of switch points in Varanasi
S. No.
Name/ location of switch point
Details of lighting fixtures Rated load (W)
Average measured load (W)
1 BP/RDP/SW-01 8X120W 960W 984.75W
2 DS/RMG/SW-01 27X160W + 1X120W 4440W 4480W
3 BLP/AG/SW-01 24X200W + 1X120W + 50X160W 12920W 13207.87W
4 DS/CRP/SW-01 4X200W 800W 795.08W
Some of the observations regarding the switch point wise measurements in Varanasi are provided below:
The power profile showed that the average measured load was close to the rated load. The maximum
variation observed in the average measured load and rated load was 2.58 percent.
The voltage and current profile showed that the variation in voltage is inversely proportional to the
variation in current for most of the cases. This is due to the inherent characteristics of LED street lights
in which it draws power close to its rated load. In case of over voltages during night times, the LED
street lights draw a current lesser than the rated current.
The voltage and current harmonics profile showed that the voltage and current harmonics are within
the recommended limits as per IEEE standards.

Street Lighting Projects
Monitoring and Verification Report - Street Lighting and DELP projects
PwC 22
3.12.2. Jhalawar
There are sixtypes of LED lighting fixtures installed in Jhalawar. The electrical parameters for one switch point
of each LED lighting fixture type were recorded for about 4 hours. The consolidated details of switch points
covered and the number of various lighting fixtures types connected to that switch point is provided below:
Table 13: Details of switch points in Jhalawar
S. No.
Name/ location of switch point
Details of lighting fixtures
Rated load (W)
Average measured load (W)
1 Manjhi Mohalla 14X12W + 1X72W 240W 238.08W
2 Police Line 18X72W + 2X190W + 20X18W + 3X70W
2246W 2254.61W
3 Kanchan Residency 24X18W + 3X250W 1182W 1222.51W
4 Satya Chauraha/WN-21/PN-1891 6X40W + 3X90W + 1X190W
700W 620.72W
5 Master Colony Main Road 24X40W + 1X190W 1150W 1111.34W
6 Bada Bazaar (next to Jain Mandir) 33X120W 3960W 4065.24W
Some of the observations regarding the switch point wise measurements in Jhalawar are provided below:
The power profile showed that the average measured load was close to the rated load. The maximum
variation observed in the average measured load and rated load was 11.33 percent.
The voltage and current profile showed that the variation in voltage is inversely proportional to the
variation in current for most of the cases. This is due to the inherent characteristics of LED street lights
in which it draws power close to its rated load. In case of over voltages during night times, the LED
street lights draw a current lesser than the rated current.
The voltage and current harmonics profile showed that the voltage and current harmonics are within
the recommended limits as per IEEE standards.
Street Lighting Projects
Monitoring and Verification Report - Street Lighting and DELP projects
PwC 23
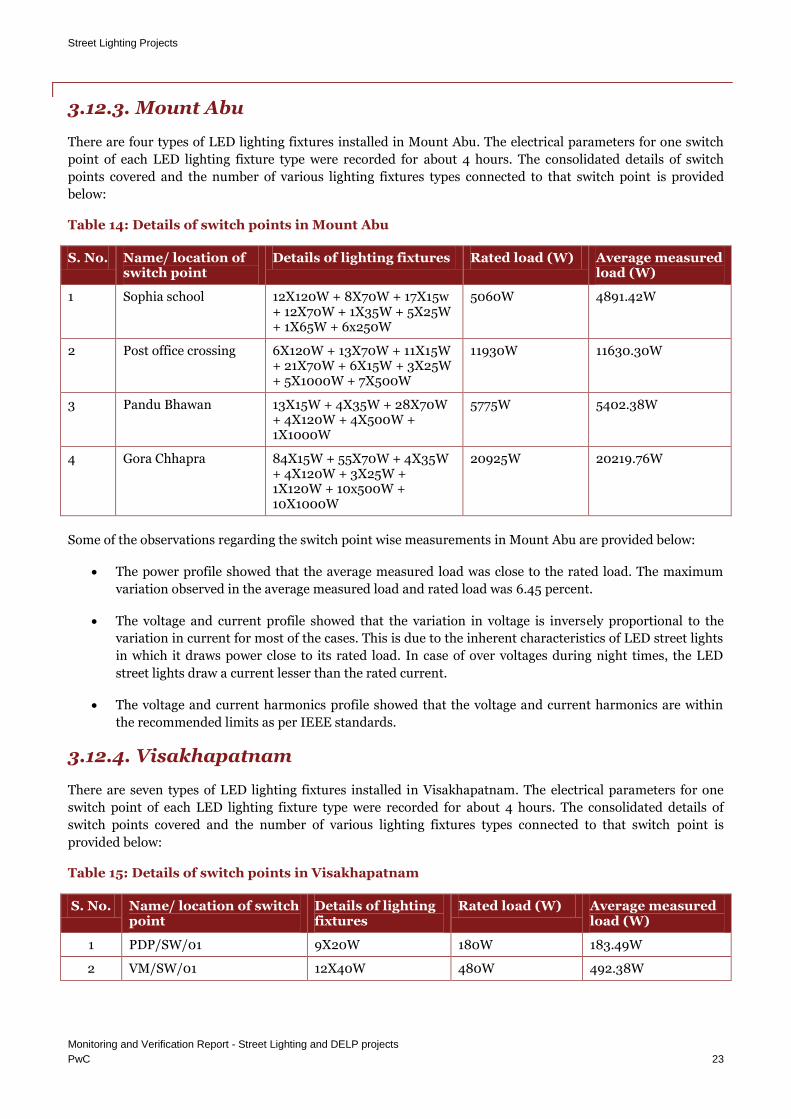
3.12.3. Mount Abu
There are four types of LED lighting fixtures installed in Mount Abu. The electrical parameters for one switch
point of each LED lighting fixture type were recorded for about 4 hours. The consolidated details of switch
points covered and the number of various lighting fixtures types connected to that switch point is provided
below:
Table 14: Details of switch points in Mount Abu
S. No. Name/ location of switch point
Details of lighting fixtures Rated load (W) Average measured load (W)
1 Sophia school 12X120W + 8X70W + 17X15w + 12X70W + 1X35W + 5X25W + 1X65W + 6x250W
5060W 4891.42W
2 Post office crossing 6X120W + 13X70W + 11X15W + 21X70W + 6X15W + 3X25W + 5X1000W + 7X500W
11930W 11630.30W
3 Pandu Bhawan 13X15W + 4X35W + 28X70W + 4X120W + 4X500W + 1X1000W
5775W 5402.38W
4 Gora Chhapra 84X15W + 55X70W + 4X35W + 4X120W + 3X25W + 1X120W + 10x500W + 10X1000W
20925W 20219.76W
Some of the observations regarding the switch point wise measurements in Mount Abu are provided below:
The power profile showed that the average measured load was close to the rated load. The maximum
variation observed in the average measured load and rated load was 6.45 percent.
The voltage and current profile showed that the variation in voltage is inversely proportional to the
variation in current for most of the cases. This is due to the inherent characteristics of LED street lights
in which it draws power close to its rated load. In case of over voltages during night times, the LED
street lights draw a current lesser than the rated current.
The voltage and current harmonics profile showed that the voltage and current harmonics are within
the recommended limits as per IEEE standards.
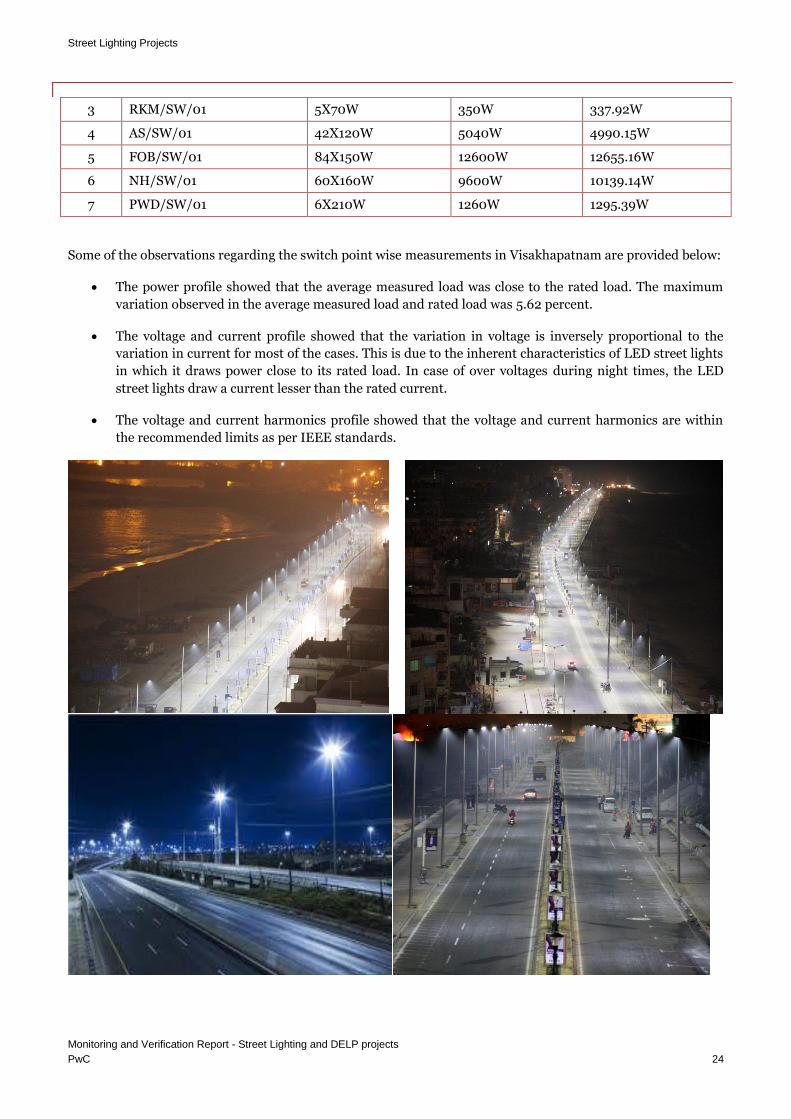
3.12.4. Visakhapatnam
There are seven types of LED lighting fixtures installed in Visakhapatnam. The electrical parameters for one
switch point of each LED lighting fixture type were recorded for about 4 hours. The consolidated details of
switch points covered and the number of various lighting fixtures types connected to that switch point is
provided below:
Table 15: Details of switch points in Visakhapatnam
S. No. Name/ location of switch point
Details of lighting fixtures
Rated load (W) Average measured load (W)
1 PDP/SW/01 9X20W 180W 183.49W
2 VM/SW/01 12X40W 480W 492.38W
Street Lighting Projects
Monitoring and Verification Report - Street Lighting and DELP projects
PwC 24
3 RKM/SW/01 5X70W 350W 337.92W
4 AS/SW/01 42X120W 5040W 4990.15W
5 FOB/SW/01 84X150W 12600W 12655.16W
6 NH/SW/01 60X160W 9600W 10139.14W
7 PWD/SW/01 6X210W 1260W 1295.39W
Some of the observations regarding the switch point wise measurements in Visakhapatnam are provided below:
The power profile showed that the average measured load was close to the rated load. The maximum
variation observed in the average measured load and rated load was 5.62 percent.
The voltage and current profile showed that the variation in voltage is inversely proportional to the
variation in current for most of the cases. This is due to the inherent characteristics of LED street lights
in which it draws power close to its rated load. In case of over voltages during night times, the LED
street lights draw a current lesser than the rated current.
The voltage and current harmonics profile showed that the voltage and current harmonics are within
the recommended limits as per IEEE standards.

Street Lighting Projects
Monitoring and Verification Report - Street Lighting and DELP projects
PwC 25
3.12.5. Agartala
There are six types of LED lighting fixtures installed in Agartala. The electrical parameters for one switch point
of each LED lighting fixture type were recorded for about 4 hours. The consolidated details of switch points
covered and the number of various lighting fixtures types connected to that switch point is provided below:
Table 16: Details of switch points in Agartala
S. No. Name/ location of switch point
Details of lighting fixtures
Rated load (W) Average measured load (W)
1 Ward no-26 kpb/001 31X10W 310W 311.12W
2 Ward no -02/vip/rd/001 15X12W 180W 174.37W
3 Ward no-20/jm/001 37X36W 1332W 1347.03W
4 Ward no-03/nc/001 45X40W 1800W 1788.22W
5 Ward no-31/pg/skk/001 13X120W 1560W 1570.63W
6 Ward no -03/vip/rd/001 12X150W 1800W 1834.69W
Some of the observations regarding the switch point wise measurements in Agartala are provided below:
The power profile showed that the average measured load was close to the rated load. The maximum
variation observed in the average measured load and rated load was 3.13 percent.
The voltage and current profile showed that the variation in voltage is inversely proportional to the
variation in current for most of the cases. This is due to the inherent characteristics of LED street lights
in which it draws power close to its rated load. In case of over voltages during night times, the LED
street lights draw a current lesser than the rated current.
The voltage and current harmonics profile showed that the voltage and current harmonics are within
the recommended limits as per IEEE standards.

Domestic Energy Efficient Lighting Program
Monitoring and Verification Report - Street Lighting and DELP projects
PwC 26
4. Domestic Energy Efficient Lighting Program
4.1. Overview of Domestic Lighting Sector
As per 18th Electric Power Survey, domestic sector would accounts for about 26.5% of India’s total electricity
consumption (16,11,808 GWh) by end of XIII th five year plan. Major part of the energy consumption is used
for lighting. A significant proportion of household lighting needs are met by use of incandescent bulbs, which
are extremely energy inefficient as over 90% of electricity is wasted as heat.
According to recent statistics published by lighting manufacturers association ELCOMA, sales of ICLs were to
the tune of about 77 crores in 2013-142. The replacement of these ICLs will give a huge immediate market for
LEDs which has potential to save more than 100 billion units which is equivalent to around 20000 MW of peak
load reduction. With the cost/lumens of LEDs reaching the levels of CFLs, the overall potential of replacement
by LEDs could also include CFLs.
4.2. Introduction
DELP entails replacement of inefficient incandescent bulbs (ICLs) used in households with energy efficient LED
lights. DELP proposes to promote using the basic architecture of Bachat Lamp Yojana (BLY). It would leverage
DSM as a recovery investment, much in the same manner as CDM was used by BLY. Energy savings is achieved
as LEDs consumes 50% less electricity for comparable quality of service than CFLs and 88% less in the case of
ICLs
EESL has evolved a service model where it works with electricity distribution companies (DISCOMs) through a
benefit sharing approach. The Domestic Efficient LightingProgram (DELP) obviates the need for DISCOMs to
invest in the upfront cost of LED bulbs; EESLprocures the LEDs bulbs and provides to consumers at a rate of
Rs. 10 each as against their marketprice of Rs. 350-400. The upfront investment made by EESL is paid back in
two different ways asindicated under:
Figure 5 : Business Models for DELP
2 Source: ELCOMA
DISCOM Cost Recovery
•The investments of EESL are recovered from the DISCOMs as annuity over a period of 3-10 years by monetizing the energy savings that accrue as a result of replacement of incandescent lamps with LEDs. Each replacement leads to a reduction of load by 53W. The energy savings are monetized based on the peak procurement cost of DISCOM and is used to pay back the investment made by EESL under an approval by the State Electricity Regulatory Commission.
•This model has been adopted in Andhra Pradesh and Puducherry
On Bill Financing (OBF)
•Cost recovery from consumers by deduction of easy instalments of Rs. 10 every month for 8-12 months. The entire cost of the LED bulbs, including the awareness, distribution and cost of capital is recovered from the consumer bills.
•DELP implementation in Delhi, UP and Rajasthan is through "on bill financing mechanism"

Domestic Energy Efficient Lighting Program
Monitoring and Verification Report - Street Lighting and DELP projects
PwC 27
4.3. DELP targets
The targets for DELP are:
Table 17: DELP targets
No of LED lights to be replaced in 3 years 77 crore
Expected annual energy savings 105 billion KWh Expected reduction of installed load 20,000 MW Estimated capital investment (excluding O&M) Rs. 8000 crore Annual estimated greenhouse gas emission reductions 79 million tonnes of CO2
4.4. Current Status of the Projects
The project work has already been completed in 5 towns, namely Puducherry, Guntur, Anantpur, Srikakulam,
and West Godavari, and is going on successfully in 8 more districts.
Table 18: Status of DELP
Parameters Details
No of Towns enrolled 171
No of town where work completed 5 (Puducherry, Guntur, Anantpur, Srikakulam, West Godavari)
No of district / towns where work is under progress 8
The total numbers of bulbs distributed in each of the 5 districts are reflected as:
Table 19: Project Size of Completed Projects
S. No. Project No of BulbsDistributed ( in lakhs .)
1. Puducherry 6.09
2. Guntur 11.22
3. Anantapur 18.61
4. Srikakulam 10.65
5. West Godavari 15.91
4.5. Survey Methodology
4.5.1. Survey Questionnaire
The questionnaire prepared for the survey captures various parameters including:
Number of LED bulbs installed and operating in the household
Number of LED bulbs installed and non-operating in the household(reasons may be given, where relevant);
Number of LED bulbs not installed, fused, broken, missing and/or replaced
The questionnaire prepared for the survey is attached as Annexure in this report.

Domestic Energy Efficient Lighting Program
Monitoring and Verification Report - Street Lighting and DELP projects
PwC 28
4.5.2. Sample Plan Distribution
The saving from DELP projects is computed based on the survey of the sample of population availing the
scheme. The survey sample sizes based on 90% confidence level and 7.5% margin of error are:
Table 20: Sample Size for DELP
S. No.
Project No of BulbsDistributed(nos.)
Sample Size at 90%Confidence Level and 7.5%margin of error
1. Puducherry 609251 120
2. Guntur 1121845 120
3. Anantapur 1860897 120
4. Srikakulam 1065201 120
5. West Godavari 1591230 120
Further, the sample was geographically distributed in the various division and subdivision based on the LED
bulbs distributed in the area. The detailed Sampling plan is given below:
Table 21: Sample distribution for DELP
Sr. No. Area Number of Surveys
1 Puducherry 120
1 Ashok Nagar 20
2 Boomianpet 20
3 Gorimedu 20
4 Lawspet 20
5 Mudaliarpet 20
6 Vengata Nagar 20
2 Anantapur 120
1 Cco Tadipatri 6
2 Dharmavaram 6
3 East/Ananthapuram 6
4 Gooty 6
5 Guntakal 6
6 Hindupur Rurals 6
7 Hindupur Town 6
8 Kadiir 6
9 Kadiri E&W 6
10 Kalyanadurg Rurals 6
11 Kalyanadurg Town 6
12 Madakasira 6
13 Penukonda 6
14 Puttaparthy 6
15 Rayadurg 6
16 Tadipatri 6
17 Town 1/Ananthapuram 6
18 Town 2/Ananthapuram 6
19 Uravakonda 6
20 West/Ananthapuram 6
3 Guntur 120
1 Bapatla 5
2 Cherukupalli 5

Domestic Energy Efficient Lighting Program
Monitoring and Verification Report - Street Lighting and DELP projects
PwC 29
3 Chilakaluripet 5
4 Dachepalli 5
5 Guntur-Rural1 5
6 Guntur-Rural2 5
7 Guntur-Town1 5
8 Guntur-Town2 5
9 Guntur-Town3 5
10 Guntur-Town4 5
11 Gurazala 5
12 Macherla 5
13 Mangalagiri 5
14 Narasaraopet 5
15 Narasaraopet-Rural 5
16 Nrt-Rural 5
17 Piduguralla 5
18 Ponnur 5
19 Repalle 5
20 Sattenapalli 5
21 Tenali-Rural1 5
22 Tenali-Rural2 5
23 Tenali-Town 5
24 Vinukonda 5
4 Srikakulam 120
1 Amadalavalasa 12
2 Narasannapeta 12
3 Palasa 12
4 Pathapatnam 12
5 Rajam 12
6 Seethampeta 12
7 Sompeta 12
8 Srikakulam-Rural 12
9 Srikakulam-Town 12
10 Tekkali 12
5 West Godavari 120
1 Akiveedu 6
2 Bhimadolu 6
3 Bhimavaram 8
4 Eluru 6
5 Eluru- Rural 6
6 Ganapavaram 6
7 Gopalapuram 6
8 Jangareddygudem 12
9 Jelugumilli 6
10 Kovvuru 6
11 Narsapuram 6
12 Nidadavole 6
13 Palakollu 6
14 Pedavegi 6
15 Penugonda 6
16 Tadepalligudem 6
17 Tadepalligudem- Rural 10
18 Tanuku 6

Domestic Energy Efficient Lighting Program
Monitoring and Verification Report - Street Lighting and DELP projects
PwC 30
4.6. Schedule of Surveys
Based on discussions with EESL, the survey was carried out in all the five districts and towns as per the
schedule given below:
Table 22: Schedule for DELP surveys
Sr. No. Project Date of Survey No. of Days
1 Puducherry 11/09/2015-13/09/2015 3
2 Anantapur 14/09/2015-16/09/2015 3
3 Guntur 17/09/2015-19/09/2015 3
4 Srikakulam 20/09/2015-23/09/2015 4
5 West Godavari 20/09/2015-23/09/2015 4
4.7. Results of the survey
Based on the survey conducted the project team analyzed the data to evaluate the operational status of the LED
bulbs distributed. The results of the analysis have been tabulated below:
Table 23: Results from the survey
Sr No. Project Total LED bulbs
distributed
Number of LEDs found operational
Number of LEDs currently not operational
Number of defective
LEDs
Number of LEDs kept for future
purpose and others
[A = B+C] [B] [C = i+ii] [i] [ii]
1 Puducherry 338 331 7 4 3
2 Anantapur 240 237 3 2 1
3 Guntur 240 237 3 2 1
5 Srikakulam 240 237 3 3 0
6 W. Godavari 240 238 2 1 1
Total 1298 1280 18 12 6
Percentage 100.00% 98.61% 1.39% 0.92% 0.46%
For the purpose of the analysis, it is assumed that the broken and damaged bulbs will be replaced with new LED
bulbs by the consumers and therefore included in the number of operational LEDs. It was observed that bulbs
were broken during cleaning (0.84%) and suffered from water damage (1%)
4.8. Computation of key parameters
4.8.1. Energy Savings
Energy saved has been computed based on the number of LED bulbs found operating based on the survey. The
formula used for computation is
𝐸𝑛𝑒𝑟𝑔𝑦 𝑆𝑎𝑣𝑖𝑛𝑔𝑠 = 𝐵𝑎𝑠𝑒𝑙𝑖𝑛𝑒 𝐶𝑜𝑛𝑠𝑢𝑚𝑝𝑡𝑖𝑜𝑛 − 𝐶𝑜𝑛𝑠𝑢𝑚𝑝𝑡𝑖𝑜𝑛 𝑝𝑜𝑠𝑡 𝑃𝑟𝑜𝑗𝑒𝑐𝑡 𝐼𝑚𝑝𝑙𝑒𝑚𝑒𝑛𝑡𝑎𝑡𝑖𝑜𝑛

Domestic Energy Efficient Lighting Program
Monitoring and Verification Report - Street Lighting and DELP projects
PwC 31
The baseline consumption is calculated as the energy consumption by the system before project
implementation. While calculating the baseline savings, the consumption of the lighting fixtures where LED has
been kept for future use has not been considered.
𝐵𝑎𝑠𝑒𝑙𝑖𝑛𝑒 𝐶𝑜𝑛𝑠𝑢𝑚𝑝𝑡𝑖𝑜𝑛
= 𝐿𝐸𝐷𝑠 𝑑𝑖𝑠𝑡𝑟𝑖𝑏𝑢𝑡𝑒𝑑 − 𝐿𝐸𝐷𝑠 𝑘𝑒𝑝𝑡 𝑓𝑜𝑟 𝑓𝑢𝑡𝑢𝑟𝑒 𝑝𝑢𝑟𝑝𝑜𝑠𝑒
× 𝑊𝑎𝑡𝑡𝑎𝑔𝑒 𝑜𝑓 𝑡𝑒 𝑜𝑙𝑑 𝑙𝑢𝑚𝑖𝑛𝑎𝑖𝑟𝑒 𝑟𝑒𝑝𝑙𝑎𝑐𝑒𝑑 × 𝐻𝑜𝑢𝑟𝑠 𝑜𝑓 𝑜𝑝𝑒𝑟𝑎𝑡𝑖𝑜𝑛
Consumption post implementation has been computed for the LEDs found operational. Additionally, for the
LEDs found defective, it is assumed that the consumers have moved back to using incandescent bulbs.
𝐶𝑜𝑛𝑠𝑢𝑚𝑡𝑝𝑖𝑜𝑛 𝑝𝑜𝑠𝑡 𝑃𝑟𝑜𝑗𝑒𝑐𝑡 𝐼𝑚𝑝𝑙𝑒𝑚𝑒𝑛𝑡𝑎𝑡𝑖𝑜𝑛
= 𝐿𝐸𝐷𝑠 𝑜𝑝𝑒𝑟𝑎𝑡𝑖𝑜𝑛𝑎𝑙 × 𝑤𝑎𝑡𝑡𝑎𝑔𝑒 𝑜𝑓 𝐿𝐸𝐷 + 𝐿𝐸𝐷𝑠 𝑓𝑜𝑢𝑛𝑑 𝑑𝑒𝑓𝑒𝑐𝑡𝑖𝑣𝑒 𝑖 × 𝑤𝑎𝑡𝑡𝑎𝑔𝑒 𝑜𝑓 𝐼𝐶𝐿
× 𝑜𝑢𝑟𝑠 𝑜𝑓 𝑜𝑝𝑒𝑟𝑎𝑡𝑖𝑜𝑛
The assumptions used for calculations are as follow:
Table 24: Assumption for calculations of savings for DELP
Parameter Source
Wattage of ICL 60 W
Wattage of LED 7 W
Operating hours / days 8 hrs as per load research studies
Days of operation 320 hrs as per load research studies
The results of the survey were further extrapolated to the division / city.
Table 25: Energy Saved for 5 regions
Sr. No. Region
Units saved annually for sample size (kWh)
Units saved per LED bulb distributed (kWh)
Units saved for the overall project (million kWh)
1 Puducherry 44910.08 132.87 80.95
2 Anantapur 32102.40 133.76 150.06
3 Guntur 32156.16 133.98 249.33
4 Srikakulam 32002.56 133.34 142.04
5 W. Godavari 32291.84 134.55 214.10
Total India Level (77 crore LEDs)
133.64 102901.80
Based on the results achieved, on an average 133.64 kWh were saved for each of the bulbs distributed in DELP,
therefore the total saving at national level for 77 crores bulb is approximately102.9 billion kWh. Assuming an
average domestic tariff of INR 3.5 / kWh, the total savings are INR36015 crore annually.
EESL plans to replace the defective bulbs with technical problems with new bulbs, this would result in
approximately annual savings at a national level to around104 billion units.

Domestic Energy Efficient Lighting Program
Monitoring and Verification Report - Street Lighting and DELP projects
PwC 32
4.8.2. Reduction of peak installed load
Reduction of peak installed loadhas been calculated using the formula:
𝑅𝑒𝑑𝑢𝑐𝑡𝑖𝑜𝑛 𝑜𝑓 𝑝𝑒𝑎𝑘 𝑖𝑛𝑠𝑡𝑎𝑙𝑙𝑒𝑑 𝑙𝑜𝑎𝑑
= 𝑁𝑢𝑚𝑏𝑒𝑟 𝑜𝑓 𝐿𝐸𝐷𝑠 𝑜𝑝𝑒𝑟𝑎𝑡𝑖𝑜𝑛𝑎𝑙 𝑤𝑎𝑡𝑡𝑎𝑔𝑒 𝑜𝑓 𝐼𝐶𝐿 − 𝑤𝑎𝑡𝑡𝑎𝑔𝑒 𝑜𝑓 𝐿𝐸𝐷𝑠
× 𝑃𝑒𝑎𝑘 𝐶𝑜𝑖𝑛𝑐𝑖𝑑𝑒𝑛𝑐𝑒 𝐹𝑎𝑐𝑡𝑜𝑟
The peak coincidence factor has been conservatively assumed as 0.5. It should be noted that even though the
reduction of peak installed load has been computed based on operational LEDs, the extrapolation would be
done on total number of LEDs distributed.
Table 26: Reduction of peak installed load for 5 cities
Sr. No. Cities Peak load reduction as per sample size (kW)
Peak load reduction per LED distributed (kW)
Peak load reduction for the entire project (kW)
1 Puducherry 8.77 0.026 15810.78
2 Anantapur 6.28 0.026 29357.28
3 Guntur 6.28 0.026 48697.35
4 Srikakulam 6.28 0.026 27874.98
5 W. Godavari 6.31 0.026 41816.20
Total 0.026 20122033.90
Based on the results achieved, on an average 0.026 kW of peak reduction was achieved for each of the bulbs
distributed in DELP, therefore the peak reduction at national level for 77 crores bulb is approximately 20100
MW.
4.8.3. Emission Reduction
The reduction in GHG emission would be computed based on the Baseline Carbon Dioxide Emission Database
published by Central Electricity Authority, Government of India.
𝑅𝑒𝑑𝑢𝑐𝑡𝑖𝑜𝑛 𝑖𝑛 𝐺𝐻𝐺 𝑒𝑚𝑖𝑠𝑠𝑖𝑜𝑛𝑠 = 𝐸𝑛𝑒𝑟𝑔𝑦 𝑢𝑛𝑖𝑡𝑠 𝑠𝑎𝑣𝑒𝑑 × 𝐸𝑚𝑖𝑠𝑠𝑖𝑜𝑛 𝐹𝑎𝑐𝑡𝑜𝑟
The most recent emission factors published by CEA are:
Table 27: Assumptions for Emission Reduction
Grid Emission factor in tCO2/MWh3
NEWNE 0.82
South 0.82
India 0.82
Based on the above mentioned emission factors, the emission reductions for all the projects are:
3 Weighted average emission factor based on “User Guide (Version 10.0) of CO2 baseline database for the Indian Power Sector prepared by Central Electricity Authority, Ministry of Power, GoI.

Domestic Energy Efficient Lighting Program
Monitoring and Verification Report - Street Lighting and DELP projects
PwC 33
Table 28: Emission Reduction for DELP
Sr. No. Region Units Saved (million kWh)
Emission Factor Emission Reduction (thousand tCO2)
1 Puducherry 80.95 0.82 65.570
2 Anantapur 150.06 0.82 121.546
3 Guntur 249.33 0.82 201.957
4 Srikakulam 142.04 0.82 115.050
5 W. Godavari 214.10 0.82 173.420
6 India 102901.80 0.82 84379.478
The DELP would result in an overall reduction of 84.37 million tCO2 emissions.

Conclusion
Monitoring and Verification Report - Street Lighting and DELP projects
PwC 34
5. Conclusion
5.1. Street Lights
Based on the monitoring & verification survey conducted, the key results of the installation of LED street
lighting projects in 5 cities are tabulated below:
Name of cities Number of LEDs installed
Annual energy savings (million kWh)
Avoided GHG emission (thousand tCO2)
Peak load reduction (MW)
Varanasi 947 1.56 1.278 0.39
Jhalawar 2449 0.37 0.303 0.09
Mount Abu 1807 0.65 0.530 0.16
Vizag 91775 23.54 19.302 5.05
Agartala 34200 3.90 3.200 0.97
Total (for 5 cities) 131178 30.02 24.613 6.66
Total (at national level) 35000000 8008.59 6567.040 1777
It can be seen from the table that the installation of 131,178 LED street lights in the 5 cities has led to an annual
energy savings of 30.02 million kWh, an avoided annual GHG emissions of 24,613 tCO2 and peak load
reduction of 6.66 MW.
Similarly, the installation of 35 million LED street lights will lead to an annual energy savings of
8008.59million kWh, an avoided annual GHG emissions of 6.57 million tCO2 and peak load reduction of 1,777
MW at the national level.
5.2. DELP
The energy savings, reduction of peak installed load and emission reduction for the five projects surveyed under
this assignment are:
Sr. No.
Region Units saved for the overall project (million kWh)
Peak load reduction (MW)
Emission Reduction (thousand tCO2)
1 Puducherry 80.95 15.81 65.570
2 Anantapur 150.06 29.36 121.546
3 Guntur 249.33 48.70 201.957
4 Srikakulam 142.04 27.87 115.050
5 W. Godavari 214.10 41.82 173.420
These results were further extrapolated to the entire national program (replacement of 77 crore domestic
lights). At a national level 102.9 billion kWh would be saved annually resulting in reduction of 20,100 MW peak
load and 84.37 million tCO2 reductions.

Appendices
Monitoring and Verification Report - Street Lighting and DELP projects
PwC 35
6. Appendices
6.1. Questionnaire for DELP
Survey Questionnaire
Section 1: Profiling of the household and respondent 1. Address (To be copied from database)
__________________________________________________________________________________________________________________________________________
2. DISCOM Service Number (To be copied from database): _______________________________
3. Nameof respondent ________________________________________________________
4. Age of respondent _________________________________________________________
(Thank and terminate if age is less than 18 years. Ask for another older member in the house for the interview)
5. Gender of Respondent
Gender
Female
Male
6. Ownership status
Oownership
Owner
Tenant
Other
7. Phone Number ____________________________________________________________
8. Is the DISCOM Service Number registered under your name?
Single Code
Yes
No
9. If No,
Relationship with the DISCOM Service Number holder
Spouse i.e. Wife/Husband
Daughter in law
Daughter/Son
Sibling i.e. Sister/Brother
Grandfather/Grandmother
Relative
Tenants i.e. rented accommodation
Any other, please specify

Appendices
Monitoring and Verification Report - Street Lighting and DELP projects
PwC 36
Section 2:
(A) Identification of the Project LEDs
1. Total number of LEDdistributed (as per databasese)
2. Total number of project LEDsfound installed
LED #1 LED#2 LED#3
Yes No Yes No Yes No
3. DELP logo
4. Where project LED found operating
(B) The reason of failure of the project LEDs
Reason for failure of Project LEDs
LED #1 LED#2
Defective i.e. are not in theworking condition
Broken after it was provided
In reserve i.e. will be usingsometime in the future
Sold/given away to someoneelse
(C) Whether defective project LEDs were got replaced by the household (end user)
Whether defective or brokenLEDs were got replaced by you orother household member?
If LEDs were not replaced, why?
No of ICLs Collected

Appendices
Monitoring and Verification Report - Street Lighting and DELP projects
PwC 37
6.2. Questionnaire for Street Lighting
6.2.1. Switch point wise measurements for all the cities
S. No.
Switching Point/Locality/Zone
Pole type (tubular/concrete/
octahedron etc.) Type of fitting
Total number
of fittings
Voltage (Volts)
Current (Amperes) PF
Power (W)
THDv (%)
THDi (%)
Time of measurement Remark
1
2
3
4
5
6
6.2.2. Individual lighting point wise measurements for all the cities
S. No. Switching Point/Locality/Zone
Pole type (tubular/concrete/
octahedron etc.) Type of fitting
Voltage (Volts)
Current (Amperes) PF
Power (W)
Time of measurement Remarks
1
2
3
4
5
Appendices
Monitoring and Verification Report - Street Lighting and DELP projects
PwC 38
6
7
8
9
10
11
12
13
14
15
16
17
18
19
20
21
22
23
24
25
26
27
28
29
30
31
32
Appendices
Monitoring and Verification Report - Street Lighting and DELP projects
PwC 39
33
34
35
36
37
38
39
40
41
42
43
44
45
46
47
48
49
50

Insert Header Field
Monitoring and Verification Report - Street Lighting and DELP projects
PwC 40
DISCLAIMER:
This publication has been prepared for general guidance on matters of interest only, and does not constitute
professional advice. You should not act upon the information contained in this publication without obtaining
specific professional advice. No representation or warranty (express or implied) is given as to the accuracy or
completeness of the information contained in this publication, and, to the extent permitted by law,
PricewaterhouseCoopers India Private Ltd., its members, employees and agents do not accept or assume any
liability, responsibility or duty of care for any consequences of you or anyone else acting, or refraining to act,
in reliance on the information contained in this publication or for any decision based on it.
© 2015 PricewaterhouseCoopers India Private Ltd. All rights reserved. In this document, “PwC” refers to
PricewaterhouseCoopers India Private Ltd., which is a member firm of PricewaterhouseCoopers International
Limited, each member firm of which is a separate legal entity.