Monitoring and Evaluating Scotlands Alcohol Strategy ...€¦ · Scotland, rates of...
31
Monitoring Report 2020 Monitoring and Evaluating Scotland’s Alcohol Strategy (MESAS)
Transcript of Monitoring and Evaluating Scotlands Alcohol Strategy ...€¦ · Scotland, rates of...

Monitoring Report 2020
Monitoring and Evaluating Scotland’s Alcohol Strategy (MESAS)

2
Authors Lucie Giles, Public Health Intelligence Principal (Acting), Public Health Observatory, Public Health Scotland
Dr Elizabeth Richardson, Public Health Intelligence Adviser, Public Health Observatory, Public Health Scotland
This report should be cited as: Giles L, Richardson E. Monitoring and Evaluating Scotland’s Alcohol Strategy: Monitoring Report 2020. Edinburgh: Public Health Scotland; 2020.
For further information about this publication please contact:
Lucie Giles Public Health Intelligence Principal (Acting) Public Health Observatory Public Health Scotland Email: [email protected]
AcknowledgementsWe are grateful to: Ilona Lukkonen (Nielsen) and Mark Newton (CGA Strategy) for providing data and advice on alcohol sales; Úna O’Rourke (Kantar Worldpanel) for data and advice on the market share of discount retailers.
We would also like to thank Dr Diane Stockton, Acting Co-lead, Place and Wellbeing Directorate, Public Health Scotland, for signing off the final version of the report.
All alcohol sales and price data presented in this report and in accompanying datasets are copyrighted to Nielsen and/or CGA Strategy.

ContentsKey points 2
Introduction 3
Alcohol retail sales 4
Alcohol price and affordability 6
Self-reported alcohol consumption 8
Alcohol health harms 12
Alcohol social harms 21
Appendix 1 22 Data sources and methods

Monitoring and Evaluating Scotland’s Alcohol Strategy: Monitoring Report 2020
2
Key points• In 2019, 9.9 litres (L) of pure alcohol were sold per adult in Scotland, equivalent to 19.1
units per adult per week. This is the same as in 2018 and maintains the lowest level seen in Scotland over the available time series.
• As in 2018, the volume of pure alcohol sold per adult in Scotland in 2019 was 9% higher than in England & Wales, one of the smallest differences seen in the available time series.
• In 2019, the average price of alcohol sold in the off-trade in Scotland was 62 pence per unit (ppu), an increase from 59ppu in 2018; in England & Wales the average off-trade price was 57ppu (56ppu in 2018). The average on-trade price in Scotland was £1.96 per unit, an increase from £1.89 in 2018; in England & Wales the average on-trade price was £1.92 per unit (£1.85 in 2018).
• In 2019, alcohol sold in the UK was 75% more affordable than it was in 1987. In recent years the increase in the affordability of alcohol has been driven by increases in disposable income and a slight fall in the real price of alcohol in the UK.
• Self-reported alcohol consumption data show that 24% of adults in Scotland in 2018 exceeded the revised low-risk weekly drinking guideline for both men and women, a decline from 34% in 2003. Of those exceeding the guideline, mean weekly consumption was highest among those in the lowest income groups.
• In 2018, 1,136 people died in Scotland due to a cause wholly attributable to alcohol (alcohol-specific), an average of 22 people per week. After reaching a peak in 2003, alcohol-specific deaths declined to 2012. Since 2012 the rate of death from alcohol-specific causes has risen overall for both men and women.
• Alcohol-specific death rates are consistently higher in Scotland than in England & Wales. In 2018, rates were nearly twice as high for men and 87% higher for women.
• 23,751 people in Scotland were admitted to a general acute hospital with an alcohol-related diagnosis in 2018/19, with a total of 35,685 alcohol-related inpatient stays. Despite a downward trend since 2007/08, rates of alcohol-related hospital stays remain four times higher than in the early 1980s.
• The most recent data show that rates of alcohol-specific death and alcohol-related hospital stays were more than twice as high for men as women and were highest in the 55–64 year age group.
• Inequalities by area deprivation were stark: in the 10% most deprived areas of Scotland, rates of alcohol-specific death were more than 4.5 times higher and alcohol-related hospital stays around seven times higher when compared with the 10% least deprived areas.
• While rates of driving under the influence of alcohol have fallen over time, the trend has been relatively flat in recent years. Rates of ‘drunkenness and other disorderly conduct’ offences have not shown a consistent trend but have fallen since 2013/14. In 2017, 39% of prisoners reported being under the influence of alcohol at the time of their arrest.
Monitoring and Evaluating Scotland’s Alcohol Strategy: Monitoring Report 2020
3
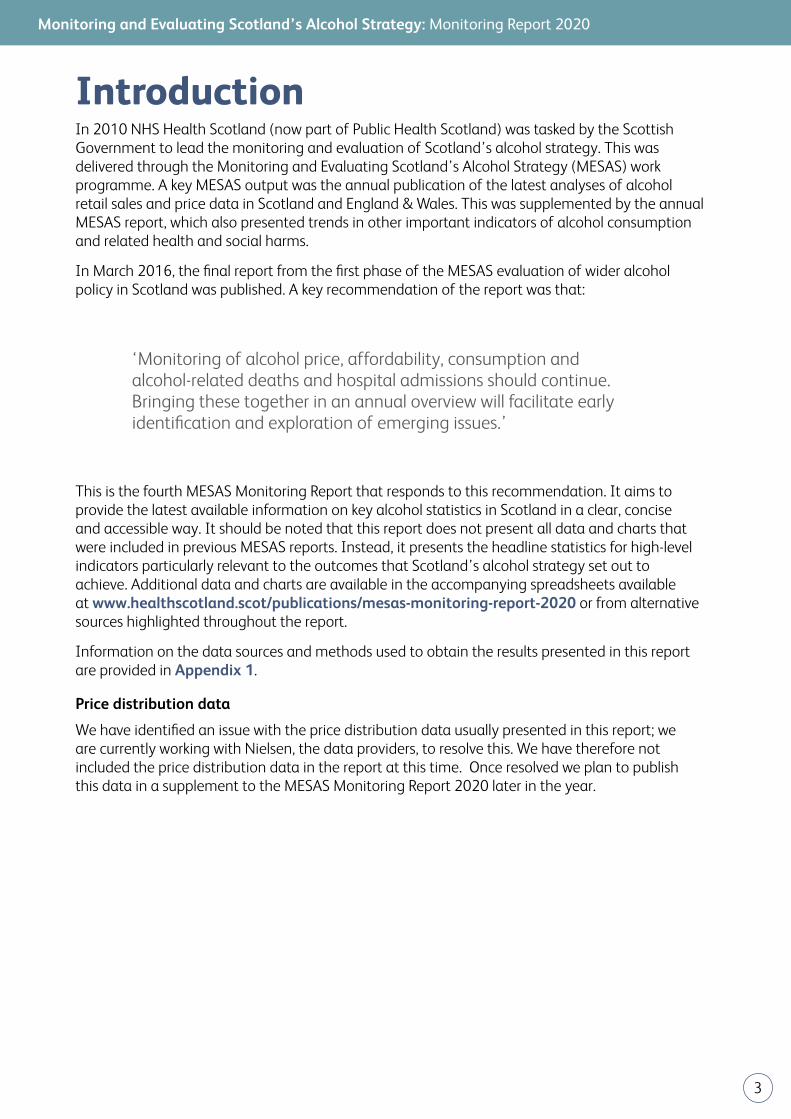
IntroductionIn 2010 NHS Health Scotland (now part of Public Health Scotland) was tasked by the Scottish Government to lead the monitoring and evaluation of Scotland’s alcohol strategy. This was delivered through the Monitoring and Evaluating Scotland’s Alcohol Strategy (MESAS) work programme. A key MESAS output was the annual publication of the latest analyses of alcohol retail sales and price data in Scotland and England & Wales. This was supplemented by the annual MESAS report, which also presented trends in other important indicators of alcohol consumption and related health and social harms.
In March 2016, the final report from the first phase of the MESAS evaluation of wider alcohol policy in Scotland was published. A key recommendation of the report was that:
‘Monitoring of alcohol price, affordability, consumption and alcohol-related deaths and hospital admissions should continue. Bringing these together in an annual overview will facilitate early identification and exploration of emerging issues.’
This is the fourth MESAS Monitoring Report that responds to this recommendation. It aims to provide the latest available information on key alcohol statistics in Scotland in a clear, concise and accessible way. It should be noted that this report does not present all data and charts that were included in previous MESAS reports. Instead, it presents the headline statistics for high-level indicators particularly relevant to the outcomes that Scotland’s alcohol strategy set out to achieve. Additional data and charts are available in the accompanying spreadsheets available at www.healthscotland.scot/publications/mesas-monitoring-report-2020 or from alternative sources highlighted throughout the report.
Information on the data sources and methods used to obtain the results presented in this report are provided in Appendix 1.
Price distribution data
We have identified an issue with the price distribution data usually presented in this report; we are currently working with Nielsen, the data providers, to resolve this. We have therefore not included the price distribution data in the report at this time. Once resolved we plan to publish this data in a supplement to the MESAS Monitoring Report 2020 later in the year.
Monitoring and Evaluating Scotland’s Alcohol Strategy: Monitoring Report 2020
4
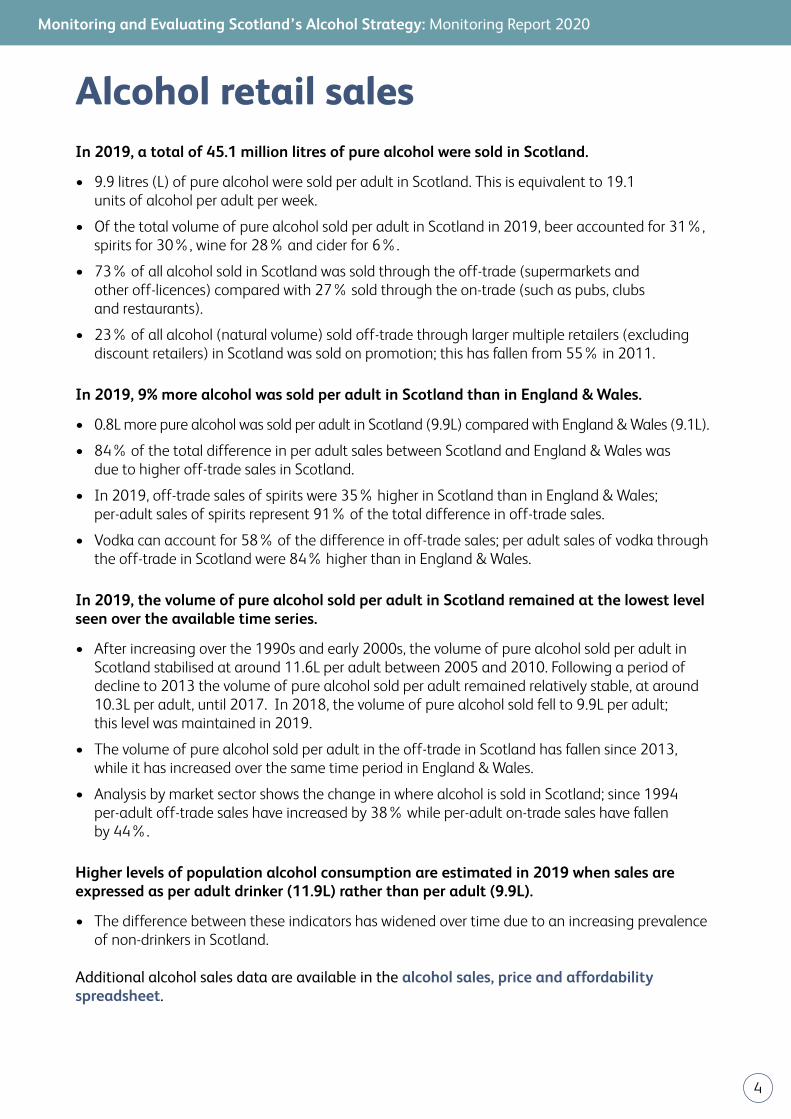
Alcohol retail salesIn 2019, a total of 45.1 million litres of pure alcohol were sold in Scotland.
• 9.9 litres (L) of pure alcohol were sold per adult in Scotland. This is equivalent to 19.1 units of alcohol per adult per week.
• Of the total volume of pure alcohol sold per adult in Scotland in 2019, beer accounted for 31%, spirits for 30%, wine for 28% and cider for 6%.
• 73% of all alcohol sold in Scotland was sold through the off-trade (supermarkets and other off-licences) compared with 27% sold through the on-trade (such as pubs, clubs and restaurants).
• 23% of all alcohol (natural volume) sold off-trade through larger multiple retailers (excluding discount retailers) in Scotland was sold on promotion; this has fallen from 55% in 2011.
In 2019, 9% more alcohol was sold per adult in Scotland than in England & Wales.
• 0.8L more pure alcohol was sold per adult in Scotland (9.9L) compared with England & Wales (9.1L).
• 84% of the total difference in per adult sales between Scotland and England & Wales was due to higher off-trade sales in Scotland.
• In 2019, off-trade sales of spirits were 35% higher in Scotland than in England & Wales; per-adult sales of spirits represent 91% of the total difference in off-trade sales.
• Vodka can account for 58% of the difference in off-trade sales; per adult sales of vodka through the off-trade in Scotland were 84% higher than in England & Wales.
In 2019, the volume of pure alcohol sold per adult in Scotland remained at the lowest level seen over the available time series.
• After increasing over the 1990s and early 2000s, the volume of pure alcohol sold per adult in Scotland stabilised at around 11.6L per adult between 2005 and 2010. Following a period of decline to 2013 the volume of pure alcohol sold per adult remained relatively stable, at around 10.3L per adult, until 2017. In 2018, the volume of pure alcohol sold fell to 9.9L per adult; this level was maintained in 2019.
• The volume of pure alcohol sold per adult in the off-trade in Scotland has fallen since 2013, while it has increased over the same time period in England & Wales.
• Analysis by market sector shows the change in where alcohol is sold in Scotland; since 1994 per-adult off-trade sales have increased by 38% while per-adult on-trade sales have fallen by 44%.
Higher levels of population alcohol consumption are estimated in 2019 when sales are expressed as per adult drinker (11.9L) rather than per adult (9.9L).
• The difference between these indicators has widened over time due to an increasing prevalence of non-drinkers in Scotland.
Additional alcohol sales data are available in the alcohol sales, price and affordability spreadsheet.

Monitoring and Evaluating Scotland’s Alcohol Strategy: Monitoring Report 2020
5
Volume of pure alcohol sold per adult in Scotland and England & Wales, 1994–2019
Source: Nielsen/CGA sales dataset (off-trade sales from 2011 onwards adjusted to account for the lack of data from discount retailers; see Appendix 1 for more details).
Volume of pure alcohol sold per adult in Scotland and England & Wales, by trade sector, 1994–2019
Source: Nielsen/CGA sales dataset (off-trade sales from 2011 onwards adjusted to account for the lack of data from discount retailers; see Appendix 1 for more details).
0
2
4
6
8
10
12
14
1619
94
1995
1996
1997
1998
1999
2000
2001
2002
2003
2004
2005
2006
2007
2008
2009
2010
2011
2012
2013
2014
2015
2016
2017
2018
2019
Litr
es p
er a
du
lt
Year
Scotland
England &Wales
0
1
2
3
4
5
6
7
8
9
10
199
4
199
5
199
6
199
7
199
8
199
9
200
0
200
1
200
2
200
3
200
4
200
5
200
6
200
7
2008
200
9
201
0
201
1
201
2
201
3
201
4
201
5
201
6
201
7
201
8
201
9
Litr
es p
er a
du
lt
Year
ScotlandOff-trade
England &WalesOff-trade
ScotlandOn-trade
England &WalesOn-trade

Monitoring and Evaluating Scotland’s Alcohol Strategy: Monitoring Report 2020
6
Alcohol price and affordabilityIn 2019, the average price per unit of alcohol in Scotland was 62 pence in the off-trade and £1.96 in the on-trade.
• The average price of off-trade alcohol in Scotland increased by 4%, from 59ppu in 2018 to 62ppu in 2019. In England & Wales it increased from 56 to 57ppu.
• The average on-trade price in Scotland has increased steadily over time, more than doubling between 2000 and 2019; the trend in average on-trade price has been similar in England & Wales.
Alcohol sold in the UK was 75% more affordable in 2019 than it was in 1987.
• The affordability of alcohol rose steadily between 1987 and 2007. Between 2007 and 2011 it reduced slightly, predominantly as a result of a fall in disposable incomes. Since 2011 alcohol has become steadily more affordable as household disposable income has increased and the price of alcohol has fallen, relative to other retail prices.
• Alcohol affordability is calculated using the retail price index, the alcohol price index and household disposable income. The alcohol affordability index is produced using UK-wide data. The alcohol affordability index is therefore weighted towards England and may not fully reflect any difference in these data between the constituent UK countries.
Additional price and affordability data are available in the alcohol sales, price and affordability spreadsheet.
Average price per unit of alcohol sold in Scotland and England & Wales, by trade sector, 2000–2019
Source: Nielsen/CGA sales dataset (off-trade sales from 2011 onwards adjusted to account for the lack of data from discount retailers; see Appendix 1 for more details).
0.00
0.50
1.00
1.50
2.00
2000
2001
2002
2003
2004
2005
2006
2007
2008
2009
2010
2011
2012
2013
2014
2015
2016
2017
2018
2019
Pric
e p
er u
nit
(£)
Year
ScotlandOn-trade
England &WalesOn-trade
ScotlandCombined
England &WalesCombined
ScotlandOff-trade
Off-trade
England &Wales

Monitoring and Evaluating Scotland’s Alcohol Strategy: Monitoring Report 2020
7
0
25
50
75
100
125
150
175
200
2019
2017
2015
2013
2011
2009
2007
2005
2003
2001
1999
1997
1995
1993
1991
1989
1987
Ind
ex (
1987
=10
0)
Year
RHDI peradult 18+
AAI
RAPI
Trends in affordability of alcohol, disposable incomes and alcohol retail prices, UK, 1987–2019
Source: Statistics on Alcohol, England 2020. RHDI = Real household disposable income. AAI = Alcohol Affordability Index. RAPI = Relative Alcohol Price Index. See Appendix 1 for more details on methods.

Monitoring and Evaluating Scotland’s Alcohol Strategy: Monitoring Report 2020
8
Self-reported alcohol consumptionAdults
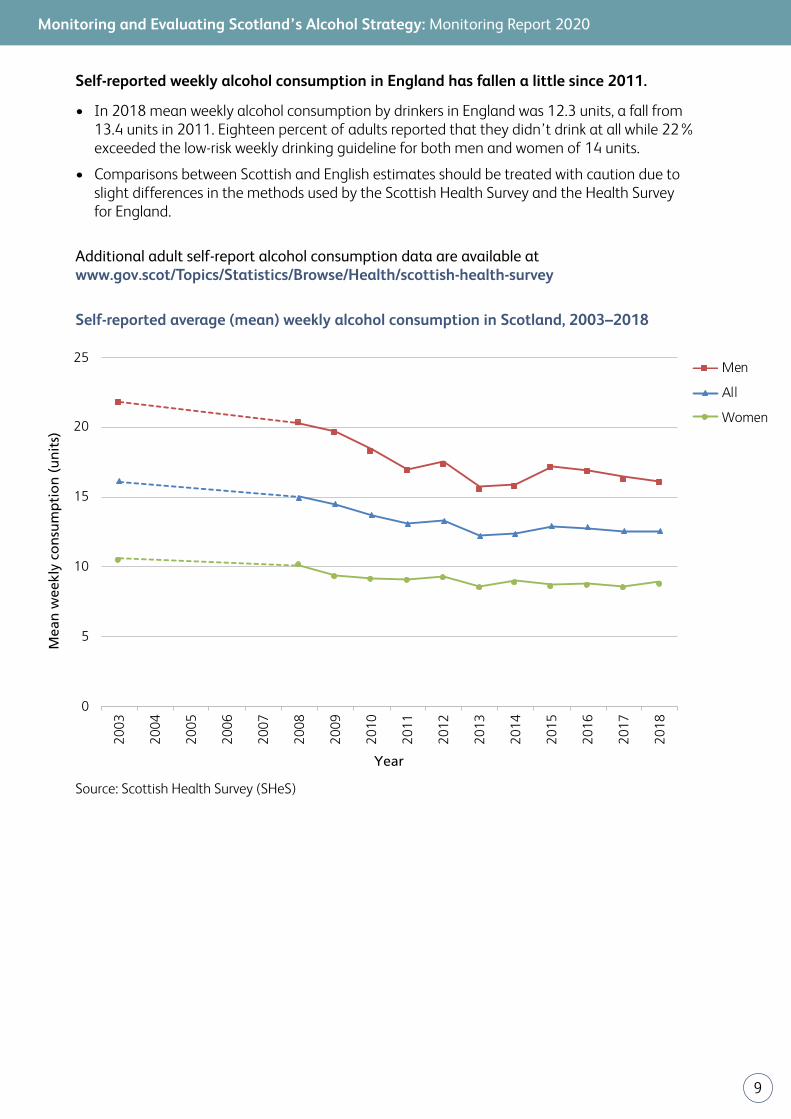
Mean self-reported weekly alcohol consumption by drinkers in Scotland fell from 16.1 units in 2003 to 12.2 units in 2013. It has since remained at a similar level (12.5 units in 2018).
• The mean number of units consumed per week by men fell from 21.8 in 2003 to 15.7 in 2013, its lowest level before rising to 17.2 in 2015; since then mean consumption for men has fallen each year to 16.1 units in 2018. For women, mean weekly alcohol consumption fell from 10.6 units in 2003 to 8.6 units in 2013; since then it has remained at a similar level (8.9 units in 2018).
• There has been a corresponding fall in the proportion of adults drinking more than 14 units a week (the low-risk weekly drinking guideline for both men and women), from 34% in 2003 to 24% in 2018; the proportion drinking more than 14 units per week has changed very little since 2013.
• The proportion of adults in Scotland who reported being non-drinkers increased from 11% in 2003 to 16% in 2013; it has remained at a similar level since (16% in 2018).
• In 2018, alcohol consumption estimates based on self-reported data accounted for 54% of those based on retail sales data.
The proportion of adults drinking above three units (women) or four units (men) on their heaviest drinking day in the past week declined from 41% in 2003 to 32% in 2018.
• A similar trend was observed for ‘binge drinking’ (defined as drinking above eight units (men) or six units (women) on the heaviest drinking day in the past week); the proportion of all adults who reported binge drinking decreased from 24% in 2003 to 17% in 2017, remaining at a similar level in 2018 (18%).
Self-reported alcohol consumption varies across different population subgroups.
• In 2018, 32% of men drank more than the revised low-risk weekly drinking guideline for both men and women, compared with 16% of women.
• In 2018, adult drinkers aged 16–24 years and 45–54 years reported the highest mean weekly consumption (13.5 and 14.0 units respectively), while those aged 75 and over reported the lowest (8.4 units).
• As household income increases so does the proportion of adults who exceed the revised low-risk weekly drinking guideline. However, mean weekly consumption for those who exceed the guideline is highest in the lowest income group; in 2017/18 (combined), mean weekly consumption was 44.3 units per week in the lowest income group, compared with 27.8 units per week in the highest income group.
• In 2017/18 (combined), the heaviest 10% of drinkers consumed 49% of all self-reported consumption in Scotland.
• In 2016/17 (combined), 17% of adults in Scotland reported problem drinking as measured by a score of eight or more on the Alcohol Use Disorders Identification Test (AUDIT). According to the AUDIT, 83% of adults in Scotland reported drinking at low risk levels or were non-drinkers, 16% reported drinking at hazardous levels, 1% at harmful levels and 1% had possible alcohol dependency (percentages do not add up to 100% due to rounding).
Monitoring and Evaluating Scotland’s Alcohol Strategy: Monitoring Report 2020
9
Self-reported weekly alcohol consumption in England has fallen a little since 2011.
• In 2018 mean weekly alcohol consumption by drinkers in England was 12.3 units, a fall from 13.4 units in 2011. Eighteen percent of adults reported that they didn’t drink at all while 22% exceeded the low-risk weekly drinking guideline for both men and women of 14 units.
• Comparisons between Scottish and English estimates should be treated with caution due to slight differences in the methods used by the Scottish Health Survey and the Health Survey for England.
Additional adult self-report alcohol consumption data are available at www.gov.scot/Topics/Statistics/Browse/Health/scottish-health-survey
Self-reported average (mean) weekly alcohol consumption in Scotland, 2003–2018
Source: Scottish Health Survey (SHeS)
0
5
10
15
20
25
2003
2004
2005
2006
2007
2008
2009
2010
2011
2012
2013
2014
2015
2016
2017
2018
Mea
n w
eekl
y co
nsu
mp
tio
n (
un
its)
Year
Men
All
Women

Monitoring and Evaluating Scotland’s Alcohol Strategy: Monitoring Report 2020
10
0
5
10
15
20
25
30
35
40
45
50
0
5
10
15
20
25
30
35
40
45
1st(highest income)
2nd 3rd 4th 5th(lowestincome)
Mea
n w
eekl
y co
nsu
mp
tio
n (
un
its)
Pro
po
rtio
n e
xcee
din
g t
he
gu
idel
ine
(%)
Household income quintile
Proportionwho exceedthe weeklyguideline
Mean weeklyconsumptionin thoseexceedingthe weeklyguideline(units)
Proportion of drinkers in Scotland exceeding the revised weekly drinking guideline and their estimated average (mean) weekly consumption, by household income quintile, 2017/18 (combined)
Source: Scottish Health Survey (SHeS)

Monitoring and Evaluating Scotland’s Alcohol Strategy: Monitoring Report 2020
11
0
10
20
30
40
50
60
70
80
90
100
1990 1992 1994 1996 1998 2000 2002 2004 2006 2008 2010 2013 2015 2018
Perc
enta
ge
Year
Ever had analcoholicdrink – 15years
Ever had analcoholicdrink – 13years
Drank in thelast week –15 years
Drank in thelast week –13 years
Young peopleThe Scottish Schools Adolescent Lifestyle and Substance Use Survey (SALSUS) shows that overall, alcohol consumption among young people has declined; however latest figures show a rise.
• Prior to 2018, the proportion of 13-year-olds reporting ever having a drink fell from 49% in 1990 to 28% in 2015, and for 15-year-olds from 84% in 1990 to 66% in 2015. In 2018 these figures rose to 36% and 71%, respectively.
• The proportion of children reporting drinking in the last week has also declined over time, falling from 23% in 2002 to 4% in 2015 for 13-year-olds and from 46% in 2002 to 17% in 2015 for 15-year-olds. The most recent data suggest that this decline has stalled (6% for 13-year-olds and 20% for 15-year-olds in 2018).
Additional data on consumption of alcohol by young people are available at www.gov.scot/collections/scottish-schools-adolescent-lifestyle-and-substance-use-survey-salsus/
Alcohol consumption by young people aged 13 and 15 years in Scotland, 1990–2018
Source: Scottish Schools Adolescent Lifestyle and Substance Use Survey (SALSUS)
Monitoring and Evaluating Scotland’s Alcohol Strategy: Monitoring Report 2020
12
Alcohol health harmsThe definitions used for reporting alcohol-specific deaths, alcohol-related hospital admissions and the wider impact of alcohol are different. Please see Appendix 1 and the original sources for more information on the clinical codes included in each measure.
Alcohol-specific deaths
In 2018, 1,136 people in Scotland died from a cause wholly attributable to alcohol (alcohol-specific); that is an average of 22 people every week.
• This equates to an age-standardised alcohol-specific death rate of 21.2 deaths per 100,000 population.
• In 2018, the alcohol-specific death rate was 2.2 times higher for men than women (29.4 deaths per 100,000 population for men compared with 13.1 deaths per 100,000 population for women).
• Rates vary with age; in 2018 the highest rate was for the 55–64 year age group (50.7 deaths per 100,000 population). The rate in this group was more than 30% higher than any other age group.
• In 2018, rates of alcohol-specific death were more than 4.5 times higher in the 10% most deprived areas in Scotland than in the 10% least deprived areas.
In 2018, rates of alcohol-specific death in Scotland were more than 2.5 times higher than in 1981.
• From 1992 sharp increases in rates of alcohol-specific death were seen in both men and women. Rates peaked in 2003 for men (at 42.6 deaths per 100,000 population) and 2006 for women (at 16.9 deaths per 100,000 population). Following this peak a relatively prolonged downward trend was seen.
• Since 2012, the downward trend in alcohol-specific death rates in Scotland has stalled and started to rise again. The rise in alcohol-specific deaths has been seen for both men and women and has been driven by those in the older age groups, particularly those aged 65 years and above.
Rates of alcohol-specific death in Scotland have consistently been higher in areas of greater deprivation, but the inequality has narrowed over time.
• In 2018, alcohol-specific death rates were more than 4.5 times higher in the 10% most deprived areas in Scotland than in the 10% least deprived areas, compared with 13 times higher in 2002 (when rates in the most deprived areas peaked). The change is mostly down to a fall in rates in the 10% most deprived areas.
• Since 2013 the narrowing of the inequality between the most and least deprived groups has stalled, as shown by the relative stability in absolute (Slope Index of Inequality (SII)) and relative (Relative Index of Inequality (RII)) measures of inequality. However, in 2018 the SII and RII were at the lowest level seen in the available time series. (See Appendix 1 for a definition of SII and RII).

Monitoring and Evaluating Scotland’s Alcohol Strategy: Monitoring Report 2020
13
0
5
10
15
20
25
30
35
40
45
50
1981
1983
1985
1987
1989
1991
1993
1995
1997
1999
2001
2003
2005
2007
2009
2011
2013
2015
2017
EASR
per
100
,000
po
pu
lati
on
Year
Males
Scotland
Females
Alcohol-specific death rates are consistently higher in Scotland than in England & Wales.
• In 2018, alcohol-specific death rates were nearly twice as high for men and 87% higher for women in Scotland compared with England & Wales.
• The difference between alcohol-specific death rates in Scotland and England & Wales has reduced over time. The greatest differences were in 2002 when rates were 3.3 times higher for men in Scotland and 2.8 times higher for women.
Additional alcohol-specific death data are available in the alcohol-specific deaths spreadsheet and at www.nrscotland.gov.uk/statistics-and-data/statistics/statistics-by-theme/vital-events/deaths/alcohol-deaths.
Alcohol-specific deaths in Scotland, by sex, 1981–2018
Source: National Records of Scotland. EASR = European Age Standardised Rate.

Monitoring and Evaluating Scotland’s Alcohol Strategy: Monitoring Report 2020
14
0
10
20
30
40
50
60
70
8019
81
1983
1985
1987
1989
1991
1993
1995
1997
1999
2001
2003
2005
2007
2009
2011
2013
2015
2017
EASR
per
100
,000
po
pu
lati
on
Year
0–14
15–24
25–34
35–44
45–54
55–64
65+
0
5
10
15
20
25
30
35
40
45
2001
2002
2003
2004
2005
2006
2007
2008
2009
2010
2011
2012
2013
2014
2015
2016
2017
2018
EASR
per
100
,000
po
pu
lati
on
Year
Scotland –males
England &Wales –males
Scotland –females
England &Wales –females
Alcohol-specific deaths in Scotland, by age group (in years), 1981–2018
Source: National Records of Scotland. EASR = European Age Standardised Rate.
Alcohol-specific deaths in Scotland and England & Wales, by sex, 2001–2018
Source: National Records of Scotland; Office for National Statistics. EASR = European Age Standardised Rate.

Monitoring and Evaluating Scotland’s Alcohol Strategy: Monitoring Report 2020
15
0.0
0.5
1.0
1.5
2.0
2.5
3.0
0
10
20
30
40
50
60
70
80
Rel
ativ
e In
dex
of
Ineq
ual
ity
(RII)
Slo
pe
Ind
ex o
f In
equ
alit
y (S
II)
SII
RII
0
10
20
30
40
50
60
70
80
90
100
2001
2002
2003
2004
2005
2006
2007
2008
2009
2010
2011
2012
2013
2014
2015
2016
2017
2018
EASR
per
100
,000
po
pu
lati
on
Year
1 – most deprived
2
3
4
5
6
7
8
9
10 – least deprived
Inequalities in alcohol-specific death rates in Scotland, 2001–2018
Source: National Records of Scotland. EASR = European Age Standardised Rate. RII = Relative Index of Inequality. SII = Slope Index of Inequality. SIMD = Scottish Index of Multiple Deprivation. SIMD1 = 10% most deprived areas of Scotland, SIMD10 =10% least deprived areas of Scotland). See Appendix 1 for a definition of SII and RII.

Monitoring and Evaluating Scotland’s Alcohol Strategy: Monitoring Report 2020
16
Alcohol-related hospital admissions
In 2018/19 there were 35,685 general acute inpatient stays with an alcohol-related diagnosis. This is equivalent to an age-standardised rate of 669 inpatient stays per 100,000 population.
• In total 23,751 people were admitted to a general acute hospital with an alcohol-related diagnosis in 2018/19 meaning that some people had more than one admission throughout the year.
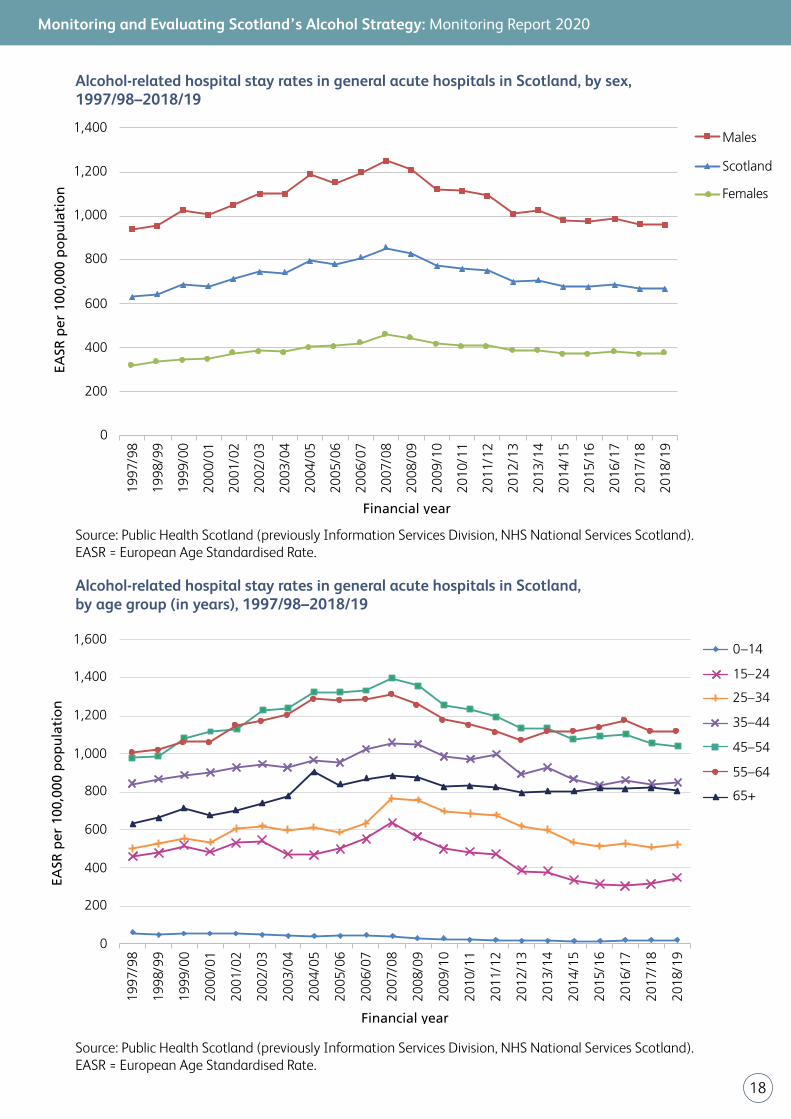
• In 2018/19, rates of alcohol-related hospital stays in Scotland were 2.5 times higher among men (961 per 100,000 population) than women (377 per 100,000 population).
• Rates also differ by age: in 2018/19, the 55–64 year age group had the highest rate of alcohol-related hospital admissions at 1,117 per 100,000 population.
• In 2018/19, rates of alcohol-related stays were more than seven times higher in the 10% most deprived areas in Scotland than in the 10% least deprived areas.
Rates of alcohol-related hospital stays in general acute hospitals in Scotland were 4.3 times higher in 2018/19 than they were in 1981/82.
• Rates of alcohol-related hospital stays rose slowly and steadily during the 1980s and early 1990s. This was followed by a steep increase through the 1990s and 2000s, reaching a peak of 855 per 100,000 population in 2007/08. Since 2007/08 the general trend in alcohol-related hospital stays in Scotland has been downward, although the rate of decline has decreased since 2012/13.
• The rate of patients being admitted to hospital with an alcohol-related diagnosis follows a broadly similar pattern to the rate of alcohol-related stays. However, since the mid 1990s the rate of individual patients being admitted has been notably lower than the rate of stays, indicating that some patients are being admitted more than once in a given time period.
• The rate of admission of new patients (defined as patients who have not been admitted to hospital with an alcohol diagnosis within the last 10 years) remained fairly stable from the late 1990s to 2007/08 while the rate of stays and total patients increased. This indicates that the same people were being admitted multiple times in a 10-year period. Since the peak in 2007/08, the rate of new patients has fallen in line with rates of hospital stays and total patients.
Relative inequalities in alcohol-related hospital admissions in Scotland have been persistent over time.
• In 2018/19, the rate of alcohol-related hospital stays was more than seven times higher in the 10% most deprived areas of Scotland compared with the 10% least deprived areas, a similar difference as in 1997/98.
• Nonetheless, since 2007/08, the largest absolute reductions in alcohol-related hospital stays have been seen in the more deprived areas, though these reductions have slowed in recent years.
• These observed differences in alcohol-related hospital stay rates are reflected in measures of absolute (SII) and relative (RII) inequality (see Appendix 1 for a definition of SII and RII).

Monitoring and Evaluating Scotland’s Alcohol Strategy: Monitoring Report 2020
17
Rates of alcohol-related admission to psychiatric hospitals are much lower than to general acute hospitals.
• Around 93% of the alcohol-related stays in Scotland are to general acute hospitals and around 7% to psychiatric hospitals. The rate of alcohol-related psychiatric hospital stays in 2018/19 was 50 per 100,000 population.
• In 2018/19, men were twice as likely as women to have an alcohol-related psychiatric admission. The rate of alcohol-related psychiatric hospital stays was 68 per 100,000 population for men compared with 33 per 100,000 population for women.
• The inequality by area deprivation is more marked in alcohol-related psychiatric admissions than in general admissions: in 2018/19, rates were more than 13 times higher in the 10% most deprived areas compared with the 10% least deprived.
• Rates of alcohol-related admissions to psychiatric hospitals have fallen steadily since 1997/98. In 2018/19, the stay rate (50 stays per 100,000 population) was half that in 1997/98 (103 stays per 100,000 population).
All the data presented in this chapter are available at www.isdscotland.org/Health-Topics/Drugs-and-Alcohol-Misuse/Publications
Alcohol-related hospital admission rates in general acute hospitals in Scotland, 1981/82–2018/19
Source: Public Health Scotland (previously Information Services Division, NHS National Services Scotland). EASR = European Age Standardised Rate.
0
100
200
300
400
500
600
700
800
900
1981
/82
1983
/84
1985
/86
1987
/88
1989
/90
1991
/92
1993
/94
1995
/96
1997
/98
1999
/00
2001
/02
2003
/04
2005
/06
2007
/08
2009
/10
2011
/12
2013
/14
2015
/16
2017
/18
EASR
per
100
,000
po
pu
lati
on
Financial year
Hospitalstays
Patients
Newpatients
Monitoring and Evaluating Scotland’s Alcohol Strategy: Monitoring Report 2020
18
Alcohol-related hospital stay rates in general acute hospitals in Scotland, by sex, 1997/98–2018/19
Source: Public Health Scotland (previously Information Services Division, NHS National Services Scotland). EASR = European Age Standardised Rate.
Alcohol-related hospital stay rates in general acute hospitals in Scotland, by age group (in years), 1997/98–2018/19
Source: Public Health Scotland (previously Information Services Division, NHS National Services Scotland). EASR = European Age Standardised Rate.
0
200
400
600
800
1,000
1,200
1,400
1,600
1997
/98
1998
/99
1999
/00
2000
/01
2001
/02
2002
/03
2003
/04
2004
/05
2005
/06
2006
/07
2007
/08
2008
/09
2009
/10
2010
/11
2011
/12
2012
/13
2013
/14
2014
/15
2015
/16
2016
/17
2017
/18
2018
/19
EASR
per
100
,000
po
pu
lati
on
Financial year
0–14
15–24
25–34
35–44
45–54
55–64
65+
0
200
400
600
800
1,000
1,200
1,40019
97/9
8
1998
/99
1999
/00
2000
/01
2001
/02
2002
/03
2003
/04
2004
/05
2005
/06
2006
/07
2007
/08
2008
/09
2009
/10
2010
/11
2011
/12
2012
/13
2013
/14
2014
/15
2015
/16
2016
/17
2017
/18
2018
/19
EASR
per
100
,000
po
pu
lati
on
Financial year
Males
Scotland
Females

Monitoring and Evaluating Scotland’s Alcohol Strategy: Monitoring Report 2020
19
0.0
0.5
1.0
1.5
2.0
2.5
0
500
1,000
1,500
2,000
2,500
Rel
ativ
e In
dex
of
Ineq
ual
ity
(RII)
Slo
pe
Ind
ex o
f In
equ
alit
y (S
II)
SII
RII
0
500
1,000
1,500
2,000
2,500
1997
/98
1998
/99
1999
/00
2000
/01
2001
/02
2002
/03
2003
/04
2004
/05
2005
/06
2006
/07
2007
/08
2008
/09
2009
/10
2010
/11
2011
/12
2012
/13
2013
/14
2014
/15
2015
/16
2016
/17
2017
/18
2018
/19
EASR
per
100
,000
po
pu
lati
on
Financial year
1 - mostdeprived2
3
4
5
6
7
8
9
10 - leastdeprived
Inequalities in alcohol-related hospital stay rates in general acute hospitals in Scotland, 1997/98–2018/19
Source: Public Health Scotland (previously Information Services Division, NHS National Services Scotland) EASR = European Age Standardised Rate. RII = Relative Index of Inequality. SII = Slope Index of Inequality. SIMD = Scottish Index of Multiple Deprivation. SIMD1 = 10% most deprived areas of Scotland, SIMD10 =10% least deprived areas of Scotland. See Appendix 1 for a definition of SII and RII.

Monitoring and Evaluating Scotland’s Alcohol Strategy: Monitoring Report 2020
20
The wider impact of alcohol on healthThe definitions of alcohol deaths and hospital admissions used in this report include only those conditions that are directly attributable to alcohol. However there are a wider range of conditions in which alcohol may be partially attributable, such as cardiovascular disease and a range of cancers. Work published by the Scottish Public Health Observatory (ScotPHO)1 in 2018 used this broader definition of alcohol-related harm to report on the overall burden of disease caused by alcohol.
Deaths caused by alcohol:
• There were an estimated 3,705 deaths attributable to alcohol consumption in 2015 among adults aged 16 years and over in Scotland. This equates to 6.5% of the total number of deaths (57,327).
• Men were almost twice as likely to die from an alcohol-attributable condition in 2015 compared with women (8.4% and 4.7% respectively).
• More than one in four (28%) alcohol-attributable deaths were due to cancer.
Hospital admissions caused by alcohol:
• In 2015, a total of 41,161 adults aged 16 years and over were admitted to hospital at least once with a wholly or partially attributable condition (6.4% of 644,574 total individuals admitted at least once in 2015).
• Men were twice as likely to be hospitalised with an alcohol-attributable condition in 2015 compared with women (8.8% and 4.3% respectively).
• Of the adult patients hospitalised due to alcohol in 2015, more than one in four (27%) were admitted for an unintentional injury.
Total impact of alcohol on health:
• Alcohol consumption accounted for 8% of the overall burden of disease in Scotland in 2015 [104,573 out of a total of 1,315,087 disease-adjusted life years (DALYs)].
1 Hospital admissions, deaths and overall burden of disease attributable to alcohol consumption in Scotland. Tod E et al. Edinburgh: NHS Health Scotland; 2018. Data reproduced with permission of the author.
www.scotpho.org.uk/publications/reports-and-papers/hospital-admissions-deaths-and-overall-burden-of-disease-attributable-to-alcohol-consumption-in-scotland
Monitoring and Evaluating Scotland’s Alcohol Strategy: Monitoring Report 2020
21
Alcohol social harmsAlcohol-related crimeTwo Scottish crime indicators are 100% attributable to alcohol.
• Rates of driving under the influence have fallen over time, from 21.8 per 10,000 population in 2004/05 to 10.8 per 10,000 population in 2018/19. However, the fall in rates has stalled since 2013/14 having remained at a very similar level since then.
• Rates of ‘drunkenness and other disorderly conduct’ offences have not shown a consistent trend. In general an upward trend was observed between 2008/09 and 2013/14, rising from 60.2 to 80.8 per 10,000 population. Between 2013/14 and 2018/19 the rate has fallen to 12.4 per 10,000 population, the lowest at any point in the observed period.
Alcohol use is a likely contributory factor in many crimes.
• Of the cases of homicide where the drug or alcohol status of the offender is known, alcohol is a factor in approximately two thirds of all cases. While the number of homicides in Scotland has fallen considerably since 2000/01, the proportion where alcohol is a factor has not fallen over time; in 2018/19, 83% of offenders were recorded as being under the influence of alcohol at the time of the offence. It should be noted that alcohol or drug status was not known in more than half of cases; these data should therefore be interpreted with caution.
• In 2017/18, of those respondents to the Scottish Crime and Justice Survey who report being the victim of crime, around 2 in 5 (39%) felt that the offender was under the influence of alcohol. For violent crime this rises to nearly half (46%) of offenders.
• In 2017, 39% of prisoners reported being under the influence of alcohol at the time of their arrest; this has fluctuated between 39% and 50% since 2005. Eighteen percent (18%) of prisoners also reported that drinking affected their ability to hold down a job and 32% reported that it affected their relationship with their family.
Additional data on crime and justice in Scotland are available at www.gov.scot/Topics/Statistics/Browse/Crime-Justice
Adverse effects of alcohol for young peopleThe Scottish Schools Adolescent Lifestyle and Substance Use Survey (SALSUS) collects information on the adverse effects of alcohol experienced by young people in Scotland.
• Between 2002 and 2010, the proportion of both 13-year-olds and 15-year-olds reporting experiencing negative effects from drinking alcohol (e.g. doing something later regretted, had an argument or fight, was in trouble with police or stayed off school) was relatively stable. Since 2010 the proportion reporting negative effects from alcohol has risen for both age groups.
Alcohol-related hospital admissions for children aged under 15 have increased after a sustained period of decrease.• Rates of alcohol-related hospitalisations for children aged under 15 in Scotland have fallen from
a peak of 59.7 per 100,000 population in 1997/98 to a low of 14.9 per 100,000 in 2014/15; by 2018/19 this had risen to 19.0 per 100,000 population.
Additional data on consumption of alcohol by young people are available at www.gov.scot/collections/scottish-schools-adolescent-lifestyle-and-substance-use-survey-salsus/
Additional data on alcohol-related hospital admissions are available at www.isdscotland.org/Health-Topics/Drugs-and-Alcohol-Misuse/Publications

Monitoring and Evaluating Scotland’s Alcohol Strategy: Monitoring Report 2020
22
Appendix 1Data sources and methodsAlcohol retail salesData on alcohol retail sales in Scotland and England & Wales were obtained from market research specialists, Nielsen and CGA Strategy (CGA) (hereafter ‘Nielsen/CGA’), for 1994, 1995 and 2000–2019. The volume of alcohol sold (litres) was provided for the on-trade by CGA and for the off-trade by Nielsen across eight alcoholic drink categories: spirits, wine, beer, cider, ready-to-drink beverages (RTDs), perry, fortified wine and ‘other’. The volume of each drink category sold was converted into pure alcohol volume using a category-specific percentage alcohol by volume (ABV). The ABV used was based on the typical strength of drinks sold in that category (except for wine where the same standard ABV was applied across all years due to the complexity of the wine market) and was provided by the data suppliers. Nielsen also provided data on the volume of alcohol sold on promotion by large, multiple retailers for each drink category.
Per adult alcohol sales were calculated by dividing pure alcohol volumes (litres of pure alcohol) by the total population aged ≥16 years. Mid-year population estimates and projections for Scotland were obtained from National Records of Scotland and for England & Wales from the Office for National Statistics. To calculate alcohol sales per adult drinker, the denominator was adjusted to account for the proportion of the population reporting non-drinking in the Scottish Health Survey (the prevalence of non-drinking in 2019 was assumed to be the same as in 2018 as 2019 SHeS data are not yet available). These data are presented in an accompanying dataset at www.healthscotland.scot/publications/mesas-monitoring-report-2020. A detailed description of the methods used by Nielsen/CGA to produce alcohol retail sales estimates is provided in an earlier MESAS report available at www.healthscotland.com/documents/5761.aspx
Retail sales estimates may differ slightly to those previously published as they continue to be improved retrospectively after being supplied. Consequently, the most recent data provided by Nielsen/CGA is considered the best available because it provides the most robust review of the alcohol market.
Since 2011, off-trade sales data were provided by week (Sunday to Saturday), and were aggregated to produce annual volumes and values. In cases where the week started in one year and finished in another the volumes and values were split in direct proportion to the portion of the week in each year. This is a change to the method previously used and has been applied from 2011 onwards, the years for which weekly data is available. Prior to 2011 each year is an aggregated 52-week period as defined by Nielsen.
Adjustment for discount retailersFrom September 2011, Nielsen was no longer able to estimate off-trade sales by discount retailers Aldi and Lidl. As such, all off-trade sales data provided since September 2011 (including estimates for the full 2011 calendar year) have been defined as ‘Off-trade excluding discount retailers’. To enable continuation of the time series presented in earlier reports, adjustment factors have been applied to off-trade sales estimates from 2011 onwards.
Adjustment factors have been based on the market share of Aldi and Lidl drawn from Kantar Worldpanel consumer panel data. Kantar Worldpanel data are collected by a panel of households (participants aged ≥18 years) who record their grocery purchases, including alcohol, using a barcode reader. Data are only collected on purchases brought into the home and include details such as

Monitoring and Evaluating Scotland’s Alcohol Strategy: Monitoring Report 2020
23
quantity, price and the store of purchase. Kantar analysts use these data to estimate the market share of discounters in Scotland and England & Wales, by drink category. Market share estimates based on both sales volumes and values are provided on an annual basis. These volume market share estimates are then applied to the drink category pure volumes (described above) resulting in adjusted pure volumes. The adjusted pure volumes are used to calculate per adult sales as described above.
Alcohol price and affordabilityAverage (mean) sales price was calculated using Nielsen/CGA data by dividing retail sales value (£) by pure alcohol volumes for the period 2000 to 2019. Prices are expressed as price per unit of alcohol.
Affordability of alcohol gives a measure of the relative affordability of alcohol, by comparing the relative changes in the price of alcohol, with changes in households’ disposable income per capita over the same period (with both allowing for inflation). Trends in affordability are measured using the Alcohol Affordability Index (AAI) series published in ‘Statistics on Alcohol: England, 2020’ (https://digital.nhs.uk/data-and-information/publications/statistical/statistics-on-alcohol/2020).
To calculate the alcohol affordability index, the alcohol price index (API) is divided by the retail price index (RPI) to create a relative alcohol price index (RAPI). The RAPI is an index of change in alcohol prices relative to trends in prices in general:
RAPI = (Alcohol price index/Retail price index) * 100
The alcohol affordability index (AAI) is then calculated by dividing an index of households’ real disposable income (RHDI) by the relative alcohol price index:
AAI = (RHDI/RAPI) * 100
If the affordability index is above 100, then alcohol is relatively more affordable than in the base year, 1987.
The main limitation of the index is that it covers the whole of the UK and does not account for differences between countries in the variables from which the index is calculated (i.e. retail prices, alcohol prices and disposable incomes).

Monitoring and Evaluating Scotland’s Alcohol Strategy: Monitoring Report 2020
24
Self-reported alcohol consumptionAdultsAdult self-reported alcohol consumption data were obtained from the Scottish Health Survey; data for the relevant survey years from 2003 to 2018 are presented. Data on mean weekly consumption, consumption on the heaviest drinking day in the past week, adherence to recommended drinking guidelines and score on the Alcohol Use Disorders Identification Test (AUDIT) questionnaire are presented. It should be noted that weekly drinking guidelines for men were reduced from 21 units per week to 14 units per week in 2016, in line with the recommendation for women; all affected analyses have been adjusted for this change. Analysis is presented by age, sex and socioeconomic deprivation. Where possible, results are compared with England using the Health Survey for England (HSE).
More information on the Scottish Health Survey can be found at: www.gov.scot/Topics/Statistics/Browse/Health/scottish-health-survey
Young peopleData collected through the Scottish Schools Adolescent Lifestyle and Substance Use Survey (SALSUS) were used to monitor self-reported alcohol consumption in young people. SALSUS includes second year (S2) and fourth year (S4) secondary school pupils. These are reported as 13-year-olds and 15-year-olds, although may include a small proportion of 14-year-olds and 16-year-olds. Data analysed include children reporting ever having consumed alcohol, alcohol consumption in the last week and adverse consequences of alcohol consumption.
More information on the SALSUS can be found at: www.gov.scot/collections/scottish-schools-adolescent-lifestyle-and-substance-use-survey-salsus/

Monitoring and Evaluating Scotland’s Alcohol Strategy: Monitoring Report 2020
25
Alcohol-specific deaths
The National Statistics definition of alcohol-specific deaths includes only those cases that are a direct consequence of alcohol misuse, otherwise known as wholly attributable (Tables 1 and 2). Most of the conditions included in the definition are chronic (longer-term) conditions associated with prolonged misuse of alcohol. The definition of alcohol-specific deaths does not include diseases that are partially attributable to alcohol, such as certain cancers, where the evidence shows that only a proportion of the deaths are caused by alcohol. The definition for alcohol-specific deaths is therefore a more conservative measure than the total harm to health caused by alcohol. For more information on the total burden of disease caused by alcohol in Scotland please see the ScotPHO report Hospital admissions, deaths and overall burden of disease attributable to alcohol consumption in Scotland.
From 2000 onwards the conditions are defined using the International Classification of Diseases (Tenth Revision; ICD-10) (Table 1). Prior to 2000 an approximately equivalent set of conditions identified in the International Statistical Classification of Diseases and Related Health Problems, Ninth Revision (ICD-9) are used (Table 2). The National Statistics definition was developed to include ICD-10 codes only. In 2016 NHS Health Scotland carried out a mapping exercise to identify the equivalent ICD-9 codes, thus allowing the time series to be extended back to 1979. National Records of Scotland (NRS) have since adopted this definition and provide alcohol-specific deaths data as far back as 1979. More detail on how the mapping exercise was conducted and the impact this has on the figures can be found in the MESAS Monitoring Report 2018.
Table 1: Causes of death wholly specific to alcohol consumption, 2000 onwards
ICD-10 code Description
E24.4 Alcohol-induced pseudo-Cushing’s syndrome
F10 Mental and behavioural disorders due to use of alcohol
G31.2 Degeneration of nervous system due to alcohol
G62.1 Alcoholic polyneuropathy
G72.1 Alcoholic myopathy
I42.6 Alcoholic cardiomyopathy
K29.2 Alcoholic gastritis
K70 Alcoholic liver disease
K85.2 Alcohol-induced acute pancreatitis
K86.0 Alcohol-induced chronic pancreatitis
Q86.0 Fetal induced alcohol syndrome (dysmorphic)
R78.0 Excess alcohol blood levels
X45 Accidental poisoning by and exposure to alcohol
X65 Intentional self-poisoning by and exposure to alcohol
Y15 Poisoning by and exposure to alcohol, undetermined intent

Monitoring and Evaluating Scotland’s Alcohol Strategy: Monitoring Report 2020
26
Table 2: Causes of death wholly specific to alcohol consumption, prior to 2000
ICD-9 code Description
291 Alcoholic psychoses
303 Alcohol dependence syndrome
305.0 Nondependent abuse of alcohol
357.5 Alcoholic polyneuropathy
425.5 Alcoholic cardiomyopathy
535.3 Alcoholic gastritis
571.0 Alcoholic fatty liver
571.1 Acute alcoholic hepatitis
571.2 Alcoholic cirrhosis of liver
571.3 Alcoholic liver damage, unspecified
790.3 Excessive blood level of alcohol
E860 Accidental poisoning by alcohol
Data for deaths analysis are provided by NRS. In this publication only the underlying (primary) cause of death has been used for reporting. The number of deaths are analysed and presented as a directly European age-sex standardised rate (EASR) per 100,000 population; the EASR is calculated using the 2013 European Standard Population. Mid-year population estimates are published by NRS and have been used in the calculation of rates.
Data are presented by age, sex and socioeconomic deprivation. Where available, comparable data are presented for alcohol-related deaths for England & Wales, published by the Office for National Statistics (ONS).
More information on alcohol deaths in Scotland can be found at: www.nrscotland.gov.uk/statistics-and-data/statistics/statistics-by-theme/vital-events/deaths/alcohol-deaths
More information on Scottish mid-year population estimates can be found at: www.nrscotland.gov.uk/statistics-and-data/statistics/statistics-by-theme/population/population-estimates/mid-year-population-estimates
More information on the 2013 European Standard Population can be found at: www.isdscotland.org/Products-and-Services/GPD-Support/Population/Standard-Populations/
More information on alcohol-specific deaths in England & Wales can be found at: www.ons.gov.uk/peoplepopulationandcommunity/healthandsocialcare/causesofdeath/bulletins/alcoholrelateddeathsintheunitedkingdom/2018

Monitoring and Evaluating Scotland’s Alcohol Strategy: Monitoring Report 2020
27
Alcohol-related hospital admissionsData relating to alcohol-related hospital admissions are taken from ‘Alcohol-related hospital statistics, Scotland 2018/19’ published by Information Services Division (ISD) (Nov 2019). Scottish hospital statistics are derived from data collected on day-case and inpatient episodes in non-obstetric and non-psychiatric hospitals in Scotland submitted to ISD as part of the Scottish Morbidity Record 01 (SMR01) data set. Additionally data are presented for hospitalisations to psychiatric hospitals from the Scottish Morbidity Record 04 (SMR04). Only records from Scottish residents are included in these analyses, determined by their postcode within the Scottish NHS Board boundaries. The number of hospitalisations are presented as European age-sex standardised rates (EASR) per 100,000 population; the EASR is calculated using the 2013 European Standard Population. Data are presented by age, sex and socioeconomic deprivation.
ISD reports three types of hospital activity measures: ‘continuous inpatient stays (referred to as ‘stays’), patient counts and new patient counts. Stays are distinct alcohol-related hospital admissions which occur within a year. Counts of patients are the number of people who have had at least one alcohol-related hospital admission during a particular year. New patient counts describe how many people each year have an alcohol-related admission that have not had an alcohol-related admission in the past 10 years.’ The full list of ICD codes used in the analysis of alcohol-related hospital admissions can be found at the link below.
More information on alcohol-related hospital statistics can be found at: www.isdscotland.org/Health-Topics/Drugs-and-Alcohol-Misuse/Publications
Alcohol-related social harmsData on crimes wholly attributable to alcohol were extracted from ‘Recorded Crime in Scotland’ statistical series, published by the Scottish Government. More information on the Recorded Crime in Scotland statistics can be found at:www.gov.scot/publications/recorded-crime-scotland-2018-19/
Data on homicide, attempted murder and serious assault were extracted from ‘Homicide in Scotland’ statistical series, also published by the Scottish Government. More information on the Homicides in Scotland statistics can be found at:www.gov.scot/publications/homicide-scotland-2018-19/
Data on the proportion of offenders being under the influence of alcohol were extracted from the Victim Form tables of the Scottish Crime and Justice Survey. More information on the Scottish Crime and Justice Survey can be found at: www.gov.scot/publications/scottish-crime-justice-survey-2017-18-main-findings/
Data on the prison population are from the Scottish Prisoner Survey. More information on the latest Scottish Prisoner Survey can be found at:www.sps.gov.uk/Corporate/Publications/Publication-6399.aspx
Adverse effects of alcohol consumption in young people is taken from the Scottish Schools Adolescent Lifestyle and Substance Use Survey (SALSUS) as described above. Hospital admissions for young people are taken from ‘Alcohol-related hospital statistics, Scotland 2018/19’, published by ISD, as described above.

Monitoring and Evaluating Scotland’s Alcohol Strategy: Monitoring Report 2020
28
Measures of health inequalityThe Slope Index of Inequality (SII) is a measure of absolute inequality of a health outcome (e.g. alcohol-related death rates) in a population. It gives a measure of the difference in rates between the most and least deprived in the population while also taking into account the distribution of the whole population across the deprivation deciles.
The Relative Index of Inequality (RII) is a measure of relative inequality of a health outcome. Like SII, it is based on the rates across all levels of area deprivation, however RII compares ratios rather than absolute differences – a measure of the relative difference across the whole population.
SII and RII are considered better than measuring the absolute difference or ratio between the most and least deprived groups because they take into account the whole population not just the extremes.

0051
6/2
020
Other formats of this publication may be available on request at:
0131 314 5300
www.publichealthscotland.scot
Published by Public Health Scotland 1 South Gyle Crescent Edinburgh EH12 9EB © Public Health Scotland 2020 All rights reserved.
Established on 1 April 2020, Public Health Scotland is Scotland’s national public agency for improving and protecting the health and wellbeing of Scotland’s people.