Monitoring and Evaluating Scotlands Alcohol Strategy (MESAS) · Monitoring Report 2017 Monitoring...
38
Monitoring Report 2017 Monitoring and Evaluating Scotland’s Alcohol Strategy (MESAS)
Transcript of Monitoring and Evaluating Scotlands Alcohol Strategy (MESAS) · Monitoring Report 2017 Monitoring...

Monitoring Report 2017
Monitoring and Evaluating Scotland’s Alcohol Strategy (MESAS)

2
All rights reserved. Material contained in this publication may not be reproduced in whole or part without prior permission of NHS Health Scotland (or other copyright owners). While every effort is made to ensure that the information given here is accurate, no legal responsibility is accepted for any errors, omissions or misleading statements.
NHS Health Scotland is a WHO Collaborating Centre for Health Promotion and Public Health Development.
Authors Lucie Giles, Public Health Intelligence Adviser, Public Health Observatory, NHS Health Scotland
Dr Mark Robinson, Public Health Intelligence Principal, Public Health Observatory, NHS Health Scotland
This report should be cited as: Giles L, Robinson M. Monitoring and Evaluating Scotland’s Alcohol Strategy: Monitoring Report 2017. Edinburgh: NHS Health Scotland; 2017.
For further information about this publication please contact:
Lucie Giles Public Health Intelligence Adviser Public Health Observatory NHS Health Scotland Email: [email protected]
AcknowledgementsWe are grateful to: Sarah Brett (Nielsen) and Mark Newton (CGA Strategy) for providing data and advice on alcohol sales; Rebecca Puntar (Kantar Worldpanel) for data and advice on the market share of discount retailers; Ruth Gordon (Information Services Division) for advice on analysing data on alcohol-related deaths and providing comments on an earlier draft of the report; and Dr Lesley Graham (Information Services Division) for providing comments on an earlier draft of the report.
We would also like to thank Dr Andrew Fraser, Director of Public Health Science, NHS Health Scotland for signing off the final version of the report.
All alcohol sales and price data presented in this report and in accompanying datasets are copyrighted to Nielsen and/or CGA Strategy.

ContentsKey points 4
Introduction 5
Alcohol retail sales 6
Alcohol price and affordability 8
Self-reported alcohol consumption 12
Alcohol-related deaths 16
Alcohol-related hospital admissions 20
Alcohol-related social harms 24
Appendix 1 25Data sources and methods
Appendix 2 35 Litres and units of pure alcohol sold per adult, and average price per unit, Scotland and England & Wales, 2000–2016
Appendix 3 36 Alcohol-related deaths in Scotland: European age-sex standardised rates (EASR) per 100,000 population, by sex, age and deprivation, 1996–2015
Appendix 4 37 Alcohol-related hospital stays in Scotland: European age-sex standardised rates (EASR) per 100,000 population, by sex, age and deprivation, 1997/98–2015/16

Monitoring and Evaluating Scotland’s Alcohol Strategy: Monitoring Report 2017
4
Key points• In 2016, 10.5 litres (L) of pure alcohol were sold per adult in Scotland, equivalent to 20.2
units per adult per week. Per adult sales in Scotland were 17% higher than in England & Wales; this was largely due to more alcohol being sold at lower prices in the off-trade in Scotland.
• The increase in population consumption in Scotland between 2013 and 2015 did not continue, with per adult sales returning to a similar level as in 2013. This was due to a fall in the volume of alcohol sold through the off-trade.
• In 2016, the average price of alcohol sold through the off-trade in Scotland was 53 pence per unit with more than half of all off-trade alcohol (51%) being sold at below 50 pence per unit. These values have changed little since 2013. In contrast, the average price of on-trade alcohol continues to increase, reaching £1.79 per unit in 2016.
• In 2015, alcohol sold in the UK was 60% more affordable than it was in 1980 and was at its most affordable level since 2007.
• Self-reported consumption data show that 26% of adults in Scotland in 2015 exceeded the revised low-risk weekly drinking guideline for both men and women, a decline from 34% in 2003. Of those exceeding the guideline, mean weekly consumption was highest among those in the lowest income group.
• The proportion of children reporting drinking in the past week has declined considerably since the early 2000s. In 2015, 4% of 13 year olds and 17% of 15 year olds in Scotland reported drinking alcohol in the past week.
• In 2015, 1,150 people died in Scotland due to an alcohol-related cause, an average of 22 people per week. The downward trend in alcohol-related deaths (from its peak in 2003) has stalled and flattened since 2012. Alcohol-related death rates are currently 47% higher than in 1981 and 54% higher than in England & Wales.
• More than 23,400 people in Scotland were admitted to a general acute hospital with an alcohol-related diagnosis in 2015/16, with a total of 35,000 alcohol-related inpatient stays. Despite a downward trend since 2007/08, rates of alcohol-related hospital stays remain 4.2 times higher than in the early 1980s.
• Rates of alcohol-related death and alcohol-related hospital stays are more than twice as high in men as in women and are highest in the 55–64 year age group. Inequalities by area deprivation are stark: the most recent data show that in the most deprived areas of Scotland rates of alcohol-related death were six times higher than in the least deprived areas, while rates of alcohol-related hospital stays were nearly nine times higher.
• Rates of driving under the influence of alcohol have fallen over time, while rates of ‘drunkenness and other disorderly conduct’ offences have not shown a consistent trend. In 2015, 41% of prisoners reported being under the influence of alcohol at the time of their arrest, and more than half of victims of assault in 2014/15 felt that their assailant was under the influence of alcohol.

Monitoring and Evaluating Scotland’s Alcohol Strategy: Monitoring Report 2017
5
IntroductionIn 2010 NHS Health Scotland was tasked by the Scottish Government to lead the monitoring and evaluation of Scotland’s alcohol strategy. This was delivered through the Monitoring and Evaluating Scotland’s Alcohol Strategy (MESAS) work programme. A key MESAS output was the annual publication of the latest analyses of alcohol retail sales and price data in Scotland and England & Wales. This was supplemented by the annual MESAS report, which also presented trends in other important alcohol-related indicators: self-reported alcohol consumption, alcohol affordability, alcohol-related deaths, alcohol-related hospitalisations, and alcohol-related social harms.
In March 2016, the final report from the first phase of the MESAS evaluation of wider alcohol policy in Scotland was published. A key recommendation of the report was that:
‘Monitoring of alcohol price, affordability, consumption and alcohol-related deaths and hospital admissions should continue. Bringing these together in an annual overview will facilitate early identification and exploration of emerging issues.’
This brief report responds to this recommendation and aims to provide the latest available information on key alcohol statistics in Scotland in a clear, concise and accessible way. It should be noted that this report does not present all data and charts that were included in previous MESAS reports. Instead, it presents the headline statistics for high-level indicators particularly relevant to the outcomes that Scotland’s alcohol strategy set out to achieve. Additional data and charts are available in the Appendices, from alternative sources highlighted throughout the report, or from accompanying spreadsheets at www.healthscotland.scot/MESAS
Information on the data sources and methods used to obtain the results presented in this report are provided in Appendix 1.

Monitoring and Evaluating Scotland’s Alcohol Strategy: Monitoring Report 2017
6
Alcohol retail salesIn 2016, a total of 46.9 million litres of pure alcohol were sold in Scotland.
• 10.5 litres (L) of pure alcohol were sold per adult in Scotland. This is equivalent to 20.2 units of alcohol per adult per week.
• Of the total volume of pure alcohol sold per adult in Scotland, beer accounted for 30%, spirits for 29%, wine for 30% and cider for 7%.
• 73% of all alcohol sold in Scotland was sold through the off-trade (supermarkets and other off-licences) compared with 27% sold through the on-trade (such as pubs, clubs and restaurants).
• 42% of all alcohol sold off-trade through larger multiple retailers (excluding discount retailers)was sold on promotion.
In 2016, 17% more alcohol was sold per adult in Scotland than in England & Wales.
• 1.5L more pure alcohol were sold per adult in Scotland (10.5L) compared with England & Wales (9.0L).
• 93% of the total difference in per adult sales between Scotland and England & Wales was due to higher off-trade sales in Scotland.
• 63% of the off-trade difference was due to higher per adult sales of spirits in Scotland.
• Vodka explained 36% of the difference in off-trade sales; per adult sales of vodka through the off-trade in Scotland were 2.1 times higher than in England & Wales.
In 2016, alcohol sales in Scotland were 4% higher than in 1994.
• After increasing over the 1990s and early 2000s, the volume of pure alcohol sold per adult in Scotland stabilised between 2005 and 2009, and then declined until 2013. This was followed by a two-year increase which has not continued in 2016, with per-adult sales returning to a similar level as in 2013.
• Analysis by market sector shows that the overall trend in alcohol sales is driven by off-trade sales, which are 47% higher than in 1994. The increase in off-trade sales in Scotland between 2014 and 2015 did not continue in 2016.
• Recent changes in the volume of pure alcohol sold per adult in the off-trade in Scotland have been driven by sales through the discount retailers (Aldi and Lidl); the volume of pure alcohol sold through the rest of the off-trade market has been stable. (Estimates of the alcohol market share of discount retailers depend on the data source used. See Appendix 1 for more details.)
Higher levels of population consumption are estimated in 2016 when sales are expressed as per adult drinker (12.5L) rather than per adult (10.5L).
• The difference between these indicators has widened over time due to an increasing prevalence of non-drinkers in Scotland.
A reference data table is available in Appendix 2. Additional alcohol sales data are available in the alcohol sales spreadsheet.

Monitoring and Evaluating Scotland’s Alcohol Strategy: Monitoring Report 2017
7
Volume of pure alcohol sold per adult in Scotland and England & Wales, 1994–2016
Source: Nielsen/CGA sales dataset (off-trade sales from 2011 onwards adjusted to account for the loss of discount retailers; see Appendix 1 for more details).
Volume of pure alcohol sold per adult in Scotland and England & Wales, by trade sector, 1994–2016
Source: Nielsen/CGA sales dataset (off-trade sales from 2011 onwards adjusted to account for the loss of discount retailers; see Appendix 1 for more details).
0
2
4
6
8
10
12
14
16
1994
1995
1996
1997
1998
1999
2000
2001
2002
2003
2004
2005
2006
2007
2008
2009
2010
2011
2012
2013
2014
2015
2016
L pe
r ad
ult
Year
Scotland
England& Wales
ScotlandOff-trade
England & WalesOff-trade
0
1
2
3
4
5
6
7
8
9
1994
1995
1996
1997
1998
1999
2000
2001
2002
2003
2004
2005
2006
2007
2008
2009
2010
2011
2012
2013
2014
2015
2016
L pe
r ad
ult
Year
ScotlandOn-trade
England & WalesOn-trade

Monitoring and Evaluating Scotland’s Alcohol Strategy: Monitoring Report 2017
8
Alcohol price and affordabilityIn 2016, the average price per unit of alcohol in Scotland was 53 pence in the off-trade and £1.79 in the on-trade.
• On-trade prices have increased steadily over time, increasing by 88% between 2000 and 2016.
• Off-trade prices were flat between 2000 and 2007, increased between 2007 and 2013, and have since remained stable.
In 2016, 51% of alcohol sold through the off-trade in Scotland was sold at below 50 pence per unit (ppu).
• Although this has declined from 81% in 2008, it has changed little since 2013.
• 62% of spirits, 29% of wine, 64% of beer and 71% of cider was sold at below 50ppu.
62% of the higher off-trade sales in Scotland compared with England & Wales was due to alcohol sold at below 50ppu.
• This was driven by spirits, particularly vodka: 2.3 times more vodka was sold off-trade at below 50ppu in Scotland than in England & Wales.
Alcohol sold in the UK was 60% more affordable in 2015 than it was in 1980.
• The affordability of alcohol is a product of alcohol price and consumer spending power (disposable income).
• The affordability of alcohol rose steadily between 1980 and 2007. Between 2007 and 2011 it reduced slightly as disposable incomes fell and alcohol prices rose slightly relative to retail prices. Alcohol affordability then remained broadly stable up to 2014.
• In 2015, disposable income increased by 6.3 percentage points, the biggest annual increase since before the economic downturn. This contributed to alcohol being at its most affordable level since 2007, when alcohol affordability peaked.
A reference data table is available in Appendix 2. Additional price and affordability data are available in the alcohol price and affordability spreadsheet.

Monitoring and Evaluating Scotland’s Alcohol Strategy: Monitoring Report 2017
9
Average price per unit of alcohol sold in Scotland and England & Wales (E&W), by trade sector, 2000–2016
Source: Nielsen/CGA sales dataset (off-trade sales from 2011 onwards adjusted to account for the loss of discount retailers; see Appendix 1 for more details).
Price distribution (%) of alcohol sold in the off-trade in Scotland, 2016
Source: Nielsen off-trade price band dataset (excluding discount retailers; see Appendix 1 for more details on methods). Individual values may not add up to 100%; this is due to rounding.
0.00
0.20
0.40
0.60
0.80
1.00
1.20
1.40
1.60
1.80
2.00
2000 2001 2002 2003 2004 2005 2006 2007 2008 2009 2010 2011 2012 2013 2014 2015 2016
Pric
e pe
r un
it (£
)
Year
ScotlandCombined
E&WCombined
ScotlandOn-trade
E&WOn-trade
ScotlandOff-trade
E&WOff-trade
5 6
11
18
13
16
7 7
4 4
2 1
7
5 10
21
39
51
68
75 82
86 90
92 93
100
0
2
4
6
8
10
12
14
16
18
20
<30 30- 34.9
35- 39.9
40- 44.9
45- 49.9
50- 54.9
55- 59.9
60- 64.9
65- 69.9
70- 74.9
75- 79.9
80- 84.9
≥85
% o
f all
off-
trad
e al
coho
l
Price band (ppu)
Numbers above the bars indicate cumulative percentages.

Monitoring and Evaluating Scotland’s Alcohol Strategy: Monitoring Report 2017
10
Proportion of off-trade alcohol sold at below 50 pence per unit in Scotland, 2008–2016
Source: Nielsen off-trade price band dataset (excluding discount retailers; see Appendix 1 for more details on methods).
Price distribution (L per adult) of pure alcohol sold in the off-trade in Scotland and England & Wales, 2016
Source: Nielsen off-trade price band dataset (excluding discount retailers; see Appendix 1 for more details on methods).
0.0
0.2
0.4
0.6
0.8
1.0
1.2
1.4
<30 30- 34.9
35-39.9
40- 44.9
45- 49.9
50- 54.9
55- 59.9
60- 64.9
65- 69.9
70- 74.9
75- 79.9
80- 84.9
≥85
L p
er a
dult
(off
-tra
de)
Price per unit (ppu)
Scotland England& Wales
Numbers above the bars indicate cumulative percentages.
81 77
72
66
60
53 52 51 51
0
10
20
30
40
50
60
70
80
90
100
2008 2009 2010 2011 2012 2013 2014 2015 2016
% o
f all
off-
trad
e al
coho
l (L
pure
alc
ohol
)
Year

Monitoring and Evaluating Scotland’s Alcohol Strategy: Monitoring Report 2017
11
Trends in affordability of alcohol, disposable incomes and alcohol retail prices, UK, 1980–2015
Source: Statistics on Alcohol, England 2016. RHDI = Real Household disposable income. RAPI = Relative Alcohol Price Index. AAI = Alcohol Affordability Index.
0
50
100
150
200
250
1980
19
81
1982
19
83
1984
19
85
1986
19
87
1988
19
89
1990
19
91
1992
19
93
1994
19
95
1996
19
97
1998
19
99
2000
20
01
2002
20
03
2004
20
05
2006
20
07
2008
20
09
2010
20
11
2012
20
13
2014
20
15
Inde
x (1
980
= 1
00)
Year
RAPI
RHDI per adult (18+)
AAI
Affordability – NEW version
Affordability of alcohol, disposal incomes and retail prices, 1980-2014

Monitoring and Evaluating Scotland’s Alcohol Strategy: Monitoring Report 2017
12
Self-reported alcohol consumptionAdults
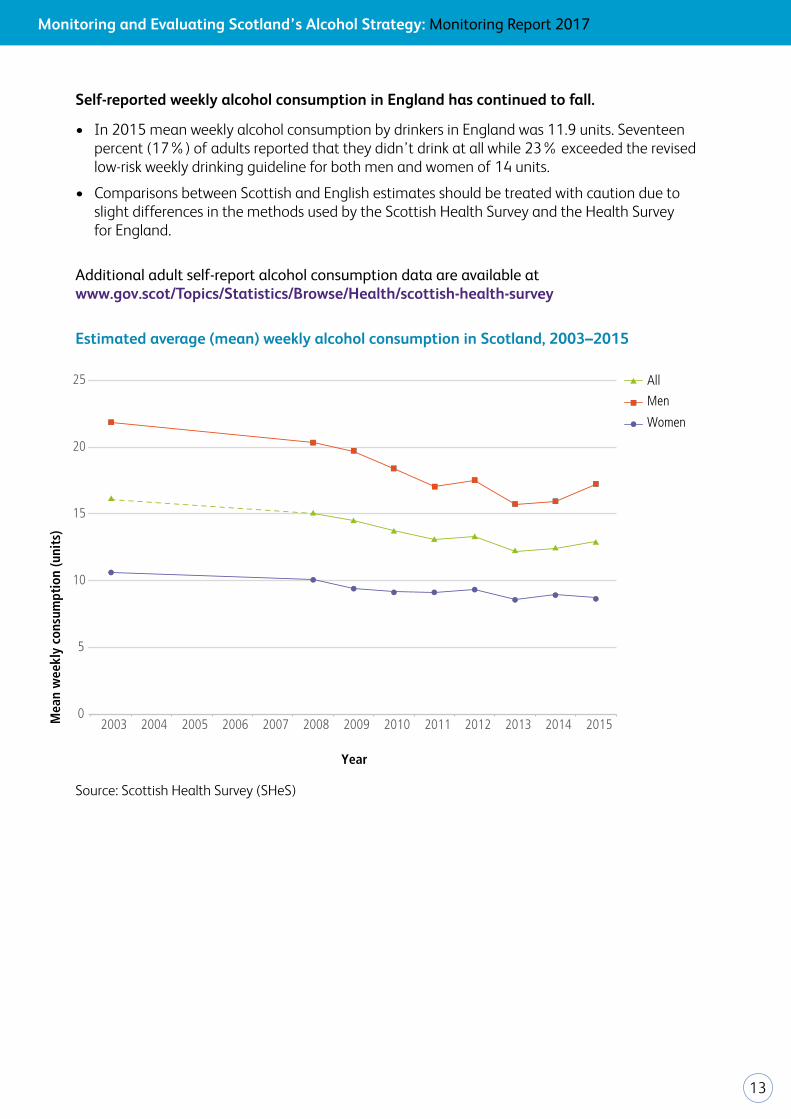
Mean weekly alcohol consumption of drinkers in Scotland fell from 16.1 units in 2003 to 12.2 units in 2013. It has since remained at a similar level (12.9 units in 2015).
• The mean number of units consumed per week by men fell from 21.8 in 2003 to 15.7 in 2013, rising to 17.2 in 2015. In women, mean weekly alcohol consumption fell from 10.6 units in 2003 to 8.6 units in 2013; there has been little change between 2013 and 2015 (8.7 units).
• There has been a corresponding fall in the proportion of adults drinking more than 14 units a week (the revised low-risk weekly drinking guideline for both men and women), from 34% in 2003 to 26% in 2015.
• The proportion of adults in Scotland who reported being non-drinkers increased from 11% in 2003 to 16% in 2013 but has since remained stable (16% in 2015).
• In 2015, alcohol consumption estimates based on self-report data accounted for 52% of those based on retail sales data.
The proportion of adults drinking above three units (women) and four units (men) on their heaviest drinking day in the past week declined from 41% in 2003 to 36% in 2015.
• A similar trend was observed for ‘binge drinking’ (defined as drinking above eight units (men) or six units (women) on the heaviest drinking day in the past week); the proportion of all adults who reported binge drinking decreased from 24% in 2003 to 20% in 2015.
Self-reported alcohol consumption varies across different population subgroups.
• In 2015, 36% of men drank more than the revised low-risk weekly drinking guideline for both men and women, compared with 17% of women.
• In 2015, adult drinkers aged 16–24 years and 55–64 years reported the highest mean weekly consumption (14.7 and 14.9 units respectively), while those aged 75 and over reported the lowest (8.3 units).
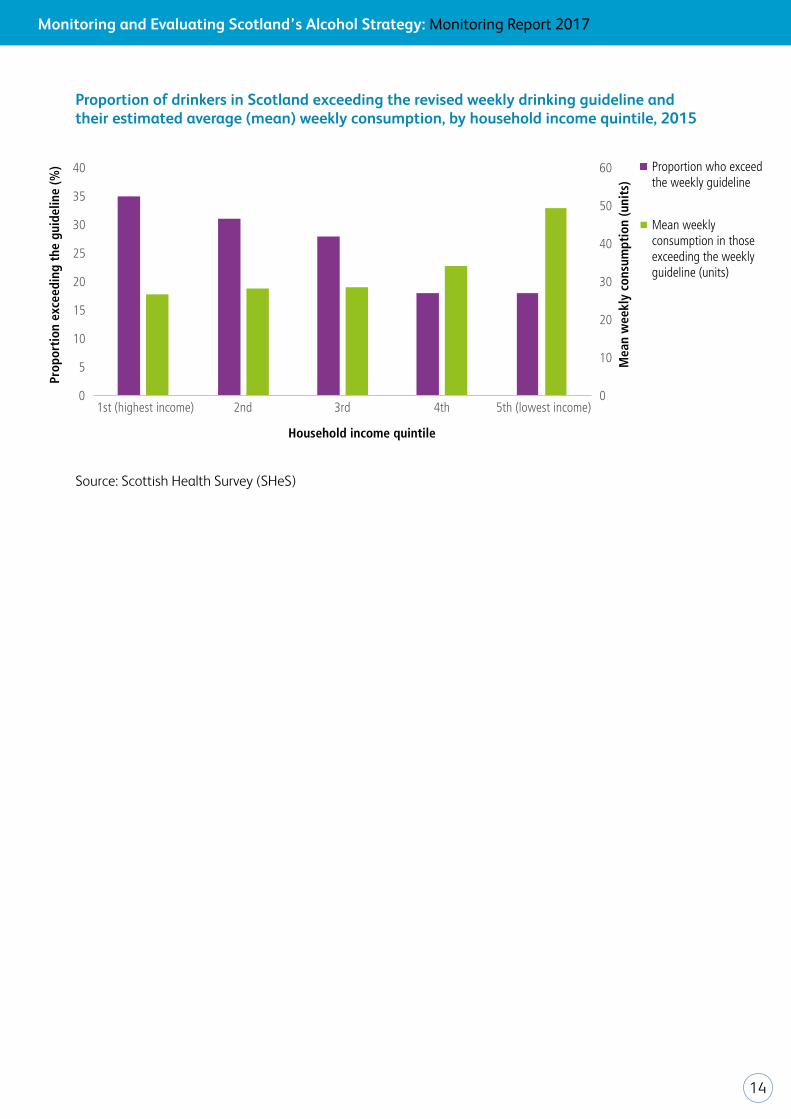
• As household income increases so does the proportion of adults who exceed the revised low-risk weekly drinking guideline. However, mean weekly consumption for those who exceed the guideline is highest in the lowest income group; mean weekly consumption is 49.3 units per week compared with 26.6 to 34.2 units per week in the other income groups.
• In 2014/15 (combined), the heaviest 10% of drinkers consumed 46% of all self-reported consumption in Scotland.
• In 2014/15 (combined), 18% of adults in Scotland reported problem drinking as measured by a score of eight or more on the Alcohol Use Disorders Identification Test (AUDIT). According to the AUDIT, 82% of adults in Scotland reported drinking at low risk levels or were non-drinkers, 15% reported drinking at hazardous levels, 2% at harmful levels and 1% had possible alcohol dependency.
Monitoring and Evaluating Scotland’s Alcohol Strategy: Monitoring Report 2017
13
Self-reported weekly alcohol consumption in England has continued to fall.
• In 2015 mean weekly alcohol consumption by drinkers in England was 11.9 units. Seventeen percent (17%) of adults reported that they didn’t drink at all while 23% exceeded the revised low-risk weekly drinking guideline for both men and women of 14 units.
• Comparisons between Scottish and English estimates should be treated with caution due to slight differences in the methods used by the Scottish Health Survey and the Health Survey for England.
Additional adult self-report alcohol consumption data are available at www.gov.scot/Topics/Statistics/Browse/Health/scottish-health-survey
Estimated average (mean) weekly alcohol consumption in Scotland, 2003–2015
Source: Scottish Health Survey (SHeS)
Men
Women
0
5
10
15
20
25
2003 2004 2005 2006 2007 2008 2009 2010 2011 2012 2013 2014 2015 Mea
n w
eekl
y co
nsum
ptio
n (u
nits
)
Year
All
Monitoring and Evaluating Scotland’s Alcohol Strategy: Monitoring Report 2017
14
Proportion of drinkers in Scotland exceeding the revised weekly drinking guideline and their estimated average (mean) weekly consumption, by household income quintile, 2015
Source: Scottish Health Survey (SHeS)
0
10
20
30
40
50
60
0
5
10
15
20
25
30
35
40
1st (highest income) 2nd 3rd 4th 5th (lowest income)
Mea
n w
eekl
y co
nsum
ptio
n (u
nits
)
Prop
orti
on e
xcee
ding
the
gui
delin
e (%
)
Household income quintile
Proportion who exceed the weekly guideline
Mean weekly consumption in those exceeding the weekly guideline (units)

Monitoring and Evaluating Scotland’s Alcohol Strategy: Monitoring Report 2017
15
Young people
The Scottish Schools Adolescent Lifestyle and Substance Use Survey (SALSUS) shows that alcohol consumption among young people has been declining since the early 2000s.
• Overall, the proportion of 13 year olds reporting ever having a drink has fallen from 49% in 1990 to 28% in 2015, and for 15 year olds from 84% in 1990 to 66% in 2015.
• Large decreases in the proportion of children reporting drinking in the last week have also been seen over time. For 13 year olds this has fallen from 23% in 2002 to 4% in 2015 and for 15 year olds from 46% in 2002 to 17% in 2015.
Additional data on consumption of alcohol by young people are available at www.gov.scot/Topics/Research/by-topic/health-community-care/social-research/SALSUS
Alcohol consumption by young people aged 13 and 15 years in Scotland, 1990–2015
Source: Scottish Schools Adolescent Lifestyle and Substance Use Survey (SALSUS)
0
10
20
30
40
50
60
70
80
90
100
1990 1992 1994 1996 1998 2000 2002 2004 2006 2008 2010 2013 2015
Perc
enta
ge
Year
Ever had analcoholic drink –13 years
Drank in thelast week –13 years
Ever had analcoholic drink –15 years
Drank in thelast week –15 years
Young people consumption

Monitoring and Evaluating Scotland’s Alcohol Strategy: Monitoring Report 2017
16
Alcohol-related deathsIn 2015, 1,150 people in Scotland died with alcohol recorded as the underlying cause; an average of 22 people every week.
• This equates to an age-standardised alcohol-related death rate of 21.9 deaths per 100,000 population (an alcohol-related death is a death where the cause is wholly attributable to alcohol; please see Appendix 1 for the detailed definition).
• In 2015, the alcohol-related death rate was more than twice as high in men as in women (30.0 deaths per 100,000 population in men compared with 13.8 deaths per 100,000 population in women).
• Rates of alcohol-related death vary with age; in 2015 the highest rate was in the 55–64 year age group (51.0 deaths per 100,000 population).
• In 2015, rates of alcohol-related death were six times higher in the 10% most deprived areas in Scotland than in the 10% least deprived areas.
In 2015, rates of alcohol-related death in Scotland were 47% higher than in 1981.
• From 1992 sharp increases in rates of alcohol-related death were seen in both men and women. Rates peaked in 2003 for men (at 47.7 deaths per 100,000 population) and 2006 for women (at 19.6 deaths per 100,000 population). Following this peak a relatively prolonged downward trend was seen.
• Since 2012, the downward trend in alcohol-related death rates in Scotland has stalled and flattened. However this is not true of all groups; notably rates have increased for women in each of the last 3 years. Fluctuations have also been seen in some of the older age groups (45 years and older).
• Over the last decade rates of alcohol-related death have decreased in the younger age groups (25–44 years); the changes are more apparent among men than women.
Rates of alcohol-related death in Scotland have consistently been higher in areas of greater deprivation, but the inequality is narrowing.
• In 2015, alcohol-related death rates were six times higher in the 10% most deprived areas in Scotland than in the 10% least deprived areas, compared with 12 times higher in 2002 (when rates in the most deprived areas peaked). The change is mostly down to a fall in rates in the 10% most deprived areas.
• The narrowing of inequalities in alcohol-related death rates in Scotland is supported by other absolute (Slope Index of Inequality (SII)) and relative (Relative Index of Inequality (RII)) measures of inequality. (See Appendix 1 for a definition of SII and RII).
In 2015, alcohol-related death rates were 54% higher in Scotland than in England & Wales.
• In Scotland, alcohol-related death rates were 67% higher in men and 50% higher in women compared with England & Wales.
• The difference between alcohol-related death rates in Scotland and England & Wales has reduced over time. The greatest differences were in 2002 when rates were 2.7 times higher in men in Scotland and 2.2 times higher in women.

Monitoring and Evaluating Scotland’s Alcohol Strategy: Monitoring Report 2017
17
• Rates of alcohol-related death have followed different patterns in Scotland and England & Wales. Rates in Scotland rose sharply through the 1990s, particularly for men, to a peak in the early to mid-2000s and have since followed a relatively sharp downward trend. Rates in England & Wales rose steadily through the 1990s to a peak in 2008 (both men and women); rates have since flattened and fallen slightly (in men).
A reference table is available in Appendix 3. Additional alcohol-related death data are available in the alcohol-related deaths spreadsheet and at www.nrscotland.gov.uk/statistics-and-data/statistics/statistics-by-theme/vital-events/deaths/alcohol-related-deaths.
Alcohol-related deaths in Scotland, by sex, 1981–2015
Source: National Records of Scotland. EASR = European Age Standardised Rate.
0
10
20
30
40
50
60
1981
19
82
1983
19
84
1985
19
86
1987
19
88
1989
19
90
1991
19
92
1993
19
94
1995
19
96
1997
19
98
1999
20
00
2001
20
02
2003
20
04
2005
20
06
2007
20
08
2009
20
10
2011
20
12
2013
20
14
2015
EASR
per
100
,000
pop
ulat
ion
Year
Males
Females
Scotland

Monitoring and Evaluating Scotland’s Alcohol Strategy: Monitoring Report 2017
18
Alcohol-related deaths in Scotland, by age group, 1981–2015
Source: National Records of Scotland. EASR = European Age Standardised Rate.
Alcohol-related deaths in Scotland and England & Wales, by sex, 1991–2015
Source: National Records of Scotland; Office for National Statistics. EASR = European Age Standardised Rate.
0
10
20
30
40
50
60
1991
1992
1993
1994
1995
1996
1997
1998
1999
2000
2001
2002
2003
2004
2005
2006
2007
2008
2009
2010
2011
2012
2013
2014
2015
EASR
per
100
,000
pop
ulat
ion
Scotland –males
Scotland –females
England &Wales –males
England &Wales –females
Year
Scotland v’s England and Wales
0
10
20
30
40
50
60
70
80
90
1981
19
82
1983
19
84
1985
19
86
1987
19
88
1989
19
90
1991
19
92
1993
19
94
1995
19
96
1997
19
98
1999
20
00
2001
20
02
2003
20
04
2005
20
06
2007
20
08
2009
20
10
2011
20
12
2013
20
14
2015
EASR
per
100
,000
pop
ulat
ion
Year
0–14 years
15–24 years
25–34 years
35–44 years
55–64 years
45–54 years
65 + years

Monitoring and Evaluating Scotland’s Alcohol Strategy: Monitoring Report 2017
19
Inequalities in alcohol-related death rates in Scotland, 1996–2015
Source: National Records of Scotland. EASR = European Age Standardised Rate. RII = Relative Index of Inequality. SII = Slope Index of Inequality. SIMD = Scottish Index of Multiple Deprivation. SIMD1 = 10% most deprived areas of Scotland, SIMD10 =10% least deprived areas of Scotland). See Appendix 1 for a definition of SII and RII.
0.0
0.5
1.0
1.5
2.0
2.5
3.0
0
10
20
30
40
50
60
70
80
90
Rela
tive
Inde
x of
Ineq
ualit
y (R
II)
Slop
e In
dex
of In
equa
lity
(SII)
SII RII
0
20
40
60
80
100
120
1996
1997
1998
1999
2000
2001
2002
2003
2004
2005
2006
2007
2008
2009
2010
2011
2012
2013
2014
2015
EASR
per
100
,000
pop
ulat
ion
Year
Deprivation
1
3
2
7
6
4
5
10
8
9
SIMD1 - most deprived
SIMD10 -least deprived

Monitoring and Evaluating Scotland’s Alcohol Strategy: Monitoring Report 2017
20
Alcohol-related hospital admissionsIn 2015/16 there were nearly 35,000 general acute inpatient stays with an alcohol-related diagnosis. This is equivalent to an age-standardised rate of 665 inpatient says per 100,000 population.
• In total over 23,400 people were admitted to a general acute hospital with an alcohol-related diagnosis, meaning that some people had more than one admission throughout the year.
• In 2015/16, rates of alcohol-related hospital stays in Scotland were over 2.5 times higher among men (961 per 100,000 population) than women (368 per 100,000 population).
• Rates also differ by age: in 2015/16, the 55–64 year age group had the highest rate of alcohol-related hospital admissions at 1,120 per 100,000 population.
• In 2015/16, rates of alcohol-related stays were nearly nine times higher in the 10% most deprived areas in Scotland than in the 10% least deprived areas.
Rates of alcohol-related hospital stays in general acute hospitals in Scotland were 4.2 times higher in 2015/16 than they were in 1981/82.
• Rates of alcohol-related hospital stays rose slowly and steadily during the 1980s and early 1990s. This was followed by a steep increase through the 1990s and 2000s, reaching a peak of 856 per 100,000 population in 2007/08. Since 2007/08 the trend in alcohol-related hospital stays in Scotland has been downward.
• The rate of patients being admitted to hospital with an alcohol-related diagnosis follows a broadly similar pattern to the rate of alcohol-related stays. However, since the mid 1990s the rate of individual patients being admitted has been notably lower than the rate of stays.
• The rate of new patients (defined as patients who have not been admitted to hospital with an alcohol diagnosis within the last 10 years) remained fairly stable from the late 1990s to 2007/08 while the rate of stays and total patients increased. This indicates that the same people were being admitted multiple times in a ten-year period. Since the peak in 2007/08, the rate of new patients has fallen in line with rates of hospital stays and total patients.
Relative inequalities in alcohol-related hospital admissions in Scotland have been persistent over time.
• In 1997/98, the rate of alcohol-related hospital stays was nearly nine times higher in the 10% most deprived areas of Scotland compared with the 10% least deprived areas; the same difference as in 2015/16.
• Nonetheless, since 2007/08, the largest absolute reductions in alcohol-related stays, patients and new patient admissions have been seen in the more deprived areas, though these reductions have levelled off in recent years.
• These observed differences in alcohol-related hospital stay rates are reflected in measures of absolute (SII) and relative (RII) inequality (see Appendix 1 for a definition of SII and RII).

Monitoring and Evaluating Scotland’s Alcohol Strategy: Monitoring Report 2017
21
Rates of alcohol-related admission to psychiatric hospitals are much lower than to general acute hospitals.
• Around 90% of the alcohol-related stays in Scotland are to general acute hospitals and around 10% to psychiatric hospitals. The rate of alcohol-related psychiatric hospital stays in 2014/15 was 53 per 100,000 population.
• In 2014/15 men were more than twice as likely as women to have an alcohol-related psychiatric admission. The rate of alcohol-related psychiatric hospital stays was 75 per 100,000 population for men compared with 32 per 100,000 population for women.
• The inequality by area deprivation is more marked in alcohol-related psychiatric admissions than in general admissions: in 2014/15, rates were around 14 times higher in the most deprived decile compared with the least deprived decile.
• Rates of alcohol-related admissions to psychiatric hospitals have fallen steadily since 1997/98. In 2014/15, the stay rate (53 stays per 100,000 population) was nearly half that in 1997/98 (103 stays per 100,000 population).
A reference table is available in Appendix 4. All the data presented in this chapter are available at www.isdscotland.org/Health-Topics/Drugs-and-Alcohol-Misuse/Publications Alcohol-related hospital admission rates in general acute hospitals in Scotland, 1981/82 – 2015/16
Source: Information Services Division, NHS National Services Scotland. EASR = European Age Standardised Rate.
0
100
200
300
400
500
600
700
800
900
1981
/82
1982
/83
1983
/84
1984
/85
1985
/86
1986
/87
1987
/88
1988
/89
1989
/90
1990
/91
1991
/92
1992
/93
1993
/94
1994
/95
1995
/96
1996
/97
1997
/98
1998
/99
1999
/00
2000
/01
2001
/02
2002
/03
2003
/04
2004
/05
2005
/06
2006
/07
2007
/08
2008
/09
2009
/10
2010
/11
2011
/12
2012
/13
2013
/14
2014
/15
2015
/16
EASR
per
100
,000
pop
ulat
ion
Financial Year
Hospital stays
New patients Patients
Overall

Monitoring and Evaluating Scotland’s Alcohol Strategy: Monitoring Report 2017
22
Alcohol-related hospital stay rates in general acute hospitals in Scotland, by sex, 1997/98 – 2015/16
Source: Information Services Division, NHS National Services Scotland. EASR = European Age Standardised Rate.
Alcohol-related hospital stay rates in general acute hospitals in Scotland, by age group, 1997/98 – 2015/16
Source: Information Services Division, NHS National Services Scotland. EASR = European Age Standardised Rate.
0
200
400
600
800
1,000
1,200
1,400
EASR
per
100
,000
pop
ulat
ion
Scotland
Males
Females
1997
/98
1998
/99
1999
/00
2000
/01
2001
/02
2002
/03
2003
/04
2004
/05
2005
/06
2006
/07
2007
/08
2008
/09
2009
/10
2010
/11
2011
/12
2012
/13
2013
/14
2014
/15
2015
/16
Financial Year
Gender
0
200
400
600
800
1,000
1,200
1,400
1,600
EASR
per
100
,000
pop
ulat
ion
1997
/98
1998
/99
1999
/00
2000
/01
2001
/02
2002
/03
2003
/04
2004
/05
2005
/06
2006
/07
2007
/08
2008
/09
2009
/10
2010
/11
2011
/12
2012
/13
2013
/14
2014
/15
2015
/16
Year
0–14 years
15–24 years
25–34 years
35–44 years
55–64 years
45–54 years
65 + years
Age

Monitoring and Evaluating Scotland’s Alcohol Strategy: Monitoring Report 2017
23
Inequalities in alcohol-related hospital stay rates in general acute hospitals in Scotland, 1997/98 – 2015/16
Source: Source: Information Services Division, NHS National Services Scotland. EASR = European Age Standardised Rate. RII = Relative Index of Inequality. SII = Stroke Index of Inequality. SIMD = Scottish Index of Multiple Deprivation. SIMD1 = 10% most deprived areas of Scotland, SIMD10 =10% least deprived areas of Scotland. See Appendix 1 for a definition of SII and RII.
Rela
tive
Inde
x of
Ineq
ualit
y (R
II)
Slop
e In
dex
of In
equa
lity
(SII)
0
500
1,000
1,500
2,000
2,500
EASR
per
100
,000
pop
ulat
ion
SII
RII
1997
/98
1998
/99
1999
/00
2000
/01
2001
/02
2002
/03
2003
/04
2004
/05
2005
/06
2006
/07
2007
/08
2008
/09
2009
/10
2010
/11
2011
/12
2012
/13
2013
/14
2014
/15
2015
/16
Year
1
3
2
7
6
4
5
10
8
9
SIMD1 - most deprived
SIMD10 -least deprived
0.0
0.5
1.0
1.5
2.0
2.5
0
500
1000
1500
2000
2500

Monitoring and Evaluating Scotland’s Alcohol Strategy: Monitoring Report 2017
24
Alcohol-related social harmsAlcohol-related crime
Two Scottish crime indicators are 100% attributable to alcohol.
• Rates of driving under the influence have fallen consistently over time, from 21.8 per 10,000 population in 2004/05 to 10.2 per 10,000 population in 2015/16.
• Rates of ‘drunkenness and other disorderly conduct’ offences have not shown a consistent trend. In general an upward trend was observed between 2008/09 and 2013/14, rising from 60.2 to 80.8 per 10,000 population. Between 2013/14 and 2015/16 the rate nearly halved to 45.9 per 10,000 population, the lowest at any point in the observed period.
Alcohol use is a likely contributory factor in many crimes.
• Of the cases of homicide where the drug or alcohol status of the offender is known, alcohol is a factor in approximately two thirds of all cases. While the number of homicides in Scotland has fallen considerably since 2000/01, the proportion where alcohol is a factor has remained fairly stable over time; 2015/16 is an exception to this as 91% of offenders reported being under the influence of alcohol at the time of the offence. (It should be noted that alcohol or drug status was not known in approximately two thirds of cases; these data should be interpreted with caution.)
• In 2015, 41% of prisoners reported being under the influence of alcohol at the time of their arrest; this has fluctuated between 40% and 50% since 2005.
• Of those respondents to the Scottish Crime and Justice Survey who report being the victim of assault, more than half (57% in 2014/15) felt that the offender was under the influence of alcohol at the time of the assault. This has changed little over time.
Additional data on crime and justice in Scotland are available at www.gov.scot/Topics/Statistics/Browse/Crime-Justice
Adverse effects of alcohol for young people
The Scottish Adolescent Lifestyle and Substance Use Survey (SALSUS) collects information on the adverse effects of alcohol experienced by young people in Scotland.
• Between 2004 and 2015, the proportion of both 13 and 15 years olds reporting experiencing adverse consequences from drinking alcohol (had an argument, had a fight, was in trouble with police or stayed off school) has generally fallen.
In 2015/16, alcohol-related hospital admissions for children aged under 15 years old were at their lowest level since peaking in 1995/96.
• Rates of alcohol-related hospitalisations for children aged under 15 years old in Scotland have decreased by approximately 74% between 1997/98 and 2015/16.
Additional data on consumption of alcohol by young people are available at www.gov.scot/Topics/Research/by-topic/health-community-care/social-research/SALSUS Additional data on alcohol-related hospitalisation are available at www.isdscotland.org/Health-Topics/Drugs-and-Alcohol-Misuse/Publications

Monitoring and Evaluating Scotland’s Alcohol Strategy: Monitoring Report 2017
25
Appendix 1Data sources and methodsAlcohol retail salesData on alcohol retail sales in Scotland and England & Wales were obtained from market research specialists, Nielsen and CGA Strategy (CGA) (hereafter ‘Nielsen/CGA’), for 1994, 1995 and 2000–2016. The volume of alcohol sold (litres) was provided for the on-trade by CGA and for the off-trade by Nielsen across eight alcoholic drink categories: spirits, wine, beer, cider, ready to drink beverages (RTDs), perry, fortified wine and ‘other’. The volume of each drink category sold was converted into pure alcohol volume using a category-specific percentage alcohol by volume (ABV). The ABV used was based on the typical strength of drinks sold in that category (except for wine where the same standard ABV was applied across all years due to the complexity of the wine market) and was provided by the data suppliers. Nielsen also provided data on the volume of alcohol sold on promotion by large, multiple retailers for each drink category.
Per adult alcohol sales were calculated by dividing pure alcohol volumes (litres of pure alcohol) by the total population aged ≥16 years. Mid-year population estimates for Scotland were obtained from National Records of Scotland and for England & Wales from the Office for National Statistics. To calculate alcohol sales per adult drinker, the denominator was adjusted to account for the proportion of the population reporting non-drinking in the Scottish Health Survey (the prevalence of non-drinking in 2016 was assumed to be the same as in 2015 as 2016 SHeS data are not yet available). These data are presented in an accompanying dataset at www.healthscotland.scot/MESAS. A detailed description of the methods used by Nielsen/CGA to produce alcohol retail sales estimates is provided in an earlier MESAS report available at www.healthscotland.com/documents/5761.aspx
Weekly data on the proportion of alcohol sold on promotion were also provided by Nielsen. Data were available for large, multiple grocers (excluding discount retailers) only.
Retail sales estimates may differ slightly to those previously published as they continue to be improved retrospectively after being supplied. Consequently, the most recent data provided by Nielsen/CGA is considered the best available because it provides the most robust review of the alcohol market.
Adjustment for discount retailersFrom September 2011, Nielsen was no longer able to estimate off-trade sales by discount retailers Aldi and Lidl. As such, all off-trade sales data provided since September 2011 (including estimates for the full 2011 calendar year) have been defined as ‘Off-trade excluding discount retailers’. To enable continuation of the time series presented in earlier reports, adjustment factors have been applied to off-trade sales estimates from 2011 onwards.

Monitoring and Evaluating Scotland’s Alcohol Strategy: Monitoring Report 2017
26
Method of adjustmentTo date, adjustment factors have been based on the market share of Aldi and Lidl drawn from Nielsen’s ‘HomeScan’ consumer panel data. Nielsen’s ‘HomeScan’ data are collected by a panel of households (participants aged ≥18 years) who record their grocery purchases, including alcohol, using a barcode reader. Data are only collected on alcohol brought into the home and include details on the products purchased (including quantity and price) and the store of purchase. Nielsen analysts used these data to estimate the market share of discounters in Scotland and England & Wales, by drink category. Estimates based on both sales volumes and values are provided on an annual basis.
Figure A1 shows trends in the volume of pure alcohol sold per adult in Scotland and England & Wales with and without adjustment for discount retailers using HomeScan data.
Figure A1: Volume of pure alcohol sold per adult (total and off-trade) in Scotland and England & Wales (EW) with and without adjustment for discount retailers, 2011-2016
Source: Nielsen/CGA sales dataset. Note: Adjustment based on Nielsen HomeScan data.
0
2
4
6
8
10
12
2011 2012 2013 2014 2015 2016
L pe
r ad
ult
Year
Scotland total
Scotland total(exc discounters)
EW total
EW total(exc discounters)
Scotland off-trade
Scotland off-trade(exc discounters)
EW off-trade
EW off-trade(exc discounters)
Monitoring and Evaluating Scotland’s Alcohol Strategy: Monitoring Report 2017
27
Investigating trends in market share estimates The overall grocery market share of Aldi and Lidl has been increasing for several years. This was reflected in the alcohol data from HomeScan, with the alcohol market share of these retailers increasing in Scotland and England & Wales between 2011 and 2015. However, in 2016 HomeScan data suggest that the market share of discount retailers declined in Scotland, contradictory to the continuation of growth in the retailers overall. A similar decline in the alcohol market share was not seen in England & Wales although the rate of growth slowed. The data providers investigated this apparent inconsistency and after a process of additional validation and robustness checking were confident that there were no anomalies with the data provided. Instead, they proposed that aggressive promotional activity in 2015 by other large multiple retailers, particularly those with a strong Northern UK bias, was the most likely explanation of the smaller discounter alcohol market share in Scotland.
Comparing HomeScan data with Kantar dataAs stated in a previous MESAS report ‘consumer panel data are subject to biases inherent in other self-report surveys including underreporting and sampling bias. Thus, alternative options for monitoring alcohol sales by discounters will continue to be explored as part of the MESAS workstream.’ In an attempt to validate the HomeScan data, summary level alcohol volume market share estimates for 2011–2016 (for all alcohol only, not by drink type) were obtained from Kantar Worldpanel, another source of consumer panel data. Some differences between the data sources can be observed:
• HomeScan produces higher estimates of the alcohol market share held by discounters across the UK, but particularly in Scotland.
• HomeScan data suggest that discounters have a higher alcohol market share in Scotland than the rest of the UK; Kantar data suggest that discounters accounted for a similar proportion of the market across the UK until 2014, but accounted for a higher proportion in England & Wales in 2015 and 2016.
• HomeScan data suggest that the market share increased steadily in both Scotland and England & Wales between 2011 and 2015. In 2016, the data suggest that there was a notable decline in discounter market share in Scotland and a slowing of the rate of increase in England & Wales; Kantar data suggest that the market share of discounters in England & Wales increased steadily between 2011 and 2016, but in Scotland decreased between 2014 and 2016.
A comparison of the off-trade per adult sales estimates, adjusted using the different data sources, is presented in Figure A2.
Work will be undertaken in 2017 to further explore the difference in market share estimates produced by these different data sources and the implications this has on how per adult sales data are presented in future MESAS reports.

Monitoring and Evaluating Scotland’s Alcohol Strategy: Monitoring Report 2017
28
Figure A2: Volume of pure alcohol sold per adult (total and off-trade) in Scotland and England & Wales (EW) with adjustment for discount retailers based on either HomeScan or Kantar data, 2011–2016
Source: Nielsen/CGA sales dataset; Nielsen Homescan; Kantar Worldpanel
0
2
4
6
8
10
12
2011 2012 2013 2014 2015 2016
L pe
r ad
ult
Year
Scotland total(HomeScan)
Scotland total(Kantar)
EW total(HomeScan)
EW total(Kantar) Scotland off-trade(HomeScan)
Scotland off-trade(Kantar)
EW off-trade(HomeScan)
EW off-trade(Kantar)

Monitoring and Evaluating Scotland’s Alcohol Strategy: Monitoring Report 2017
29
Alcohol price and affordabilityAverage (mean) sales price was calculated using Nielsen/CGA data by dividing retail sales value (£) by pure alcohol volumes for the period 2000 to 2016. Prices are expressed as price per unit of alcohol (ppu).
Annual estimates of the volume of alcohol sold off-trade in different price bands were provided by Nielsen for 2009–2016. The natural volume of each item sold was converted into units of alcohol using its percentage ABV, enabling the ppu of alcohol to be calculated. The item was then coded into one of seventeen price bands. Estimates were provided for all alcohol and by drink type. The ‘price band’ dataset excludes discount retailers. Affordability of alcohol gives a measure of the relative affordability of alcohol, by comparing the relative changes in the price of alcohol, with changes in households’ disposable income per capita over the same period (with both allowing for inflation).
Trends in affordability are measured using the Alcohol Affordability Index (AAI) series published in ‘Statistics on Alcohol: England, 2016’ (http://content.digital.nhs.uk/catalogue/PUB20999).
To calculate the alcohol affordability index, the alcohol price index (API) is divided by the retail price index (RPI) to create a relative alcohol price index (RAPI). The RAPI is an index of change in alcohol prices relative to trends in prices in general:
RAPI = (Alcohol price index/Retail price index) * 100
The alcohol affordability index (AAI) is then calculated by dividing an index of households’ real disposable income (RHDI) by the relative alcohol price index:
AAI = (RHDI/RAPI) * 100
If the affordability index is above 100, then alcohol is relatively more affordable than in the base year, 1980.
The main limitation of the index is that it covers the whole of the UK and does not account for differences between countries in the variables from which the index is calculated i.e. retail prices, alcohol prices and disposable incomes.
Self-report alcohol consumptionAdultsAdult self-report alcohol consumption data are obtained from the Scottish Health Survey; data for the relevant survey years from 2003 to 2015 are presented. Data on mean weekly consumption, consumption on the heaviest drinking day in the past week, adherence to recommended drinking guidelines and score on the Alcohol Use Disorders Identification Test (AUDIT) questionnaire are presented. It should be noted that weekly drinking guidelines for men were reduced from 21 units per week to 14 units per week, in line with the recommendation for women; all affected analyses have been adjusted for this change. Analysis is presented by age, sex and socioeconomic deprivation. Where possible results are compared with England using the Health Survey for England (HSE).
More information on the Scottish Health Survey can be found at: www.gov.scot/Topics/Statistics/Browse/Health/scottish-health-survey

Monitoring and Evaluating Scotland’s Alcohol Strategy: Monitoring Report 2017
30
Young peopleData collected through the Scottish Adolescent Lifestyle and Substance Use Survey (SALSUS) were used to monitor self-reported alcohol consumption in young people. SALSUS includes second year (S2) and fourth year (S4) pupils. These are reported as 13 year olds and 15 year olds, although may include a small proportion of 14 and 16 year olds. Data analysed include children reporting ever having consumed alcohol, alcohol consumption in the last week and adverse consequences of alcohol consumption.
More information on the SALSUS can be found at: www.gov.scot/Topics/Research/by-topic/health-community-care/social-research/SALSUS

Monitoring and Evaluating Scotland’s Alcohol Strategy: Monitoring Report 2017
31
Alcohol-related deathsThe National Records of Scotland (NRS) routinely reports national statistics on all deaths for Scotland. ICD codes are used to categorise cause(s) of death. The National Statistics definition of an alcohol-related death includes causes of death regarded as those being most directly attributable to alcohol consumption. The definition is primarily based on chronic conditions associated with long-term abuse of alcohol and, to a lesser extent, acute conditions. Apart from poisoning with alcohol, the definition excludes other external causes of death, such as road traffic and other accidents. The definition also does not include diseases that may be partially attributable to alcohol, such as cancers of the mouth, oesophagus and liver. However, all deaths from chronic liver disease and cirrhosis (excluding biliary cirrhosis) are included, even when alcohol is not specifically mentioned on the death certificate.
The full list of ICD codes included in the definition can be found in tables A1 and A2. This definition was agreed nationally by the Office for National Statistics in 2006 allowing comparisons to be made between the 4 constituent UK countries.
The term ‘alcohol-related death’ is used throughout this report; however the terms ‘alcohol-specific death’ and ‘wholly alcohol attributable deaths’ are also used elsewhere.
Table A1: ICD codes used to define an alcohol-related death, 2000–2016
ICD-10 Code Description
F10 Mental and behavioural disorders due to use of alcohol
G31.2 Degeneration of nervous system due to alcohol
G62.1 Alcoholic polyneuropathy
I42.6 Alcoholic cardiomyopathy
K29.2 Alcoholic gastritis
K70 Alcoholic liver disease
K73 Chronic hepatitis, not elsewhere classified
K74.0 Hepatic fibrosis
K74.1 Hepatic sclerosis
K74.2 Hepatic fibrosis with hepatic sclerosis
K74.6 Other and unspecified cirrhosis of liver
K86.0 Alcohol induced chronic pancreatitis
X45 Accidental poisoning by and exposure to alcohol
X65 Intentional self-poisoning by and exposure to alcohol
Y15 Poisoning by and exposure to alcohol, undetermined intent
Monitoring and Evaluating Scotland’s Alcohol Strategy: Monitoring Report 2017
32
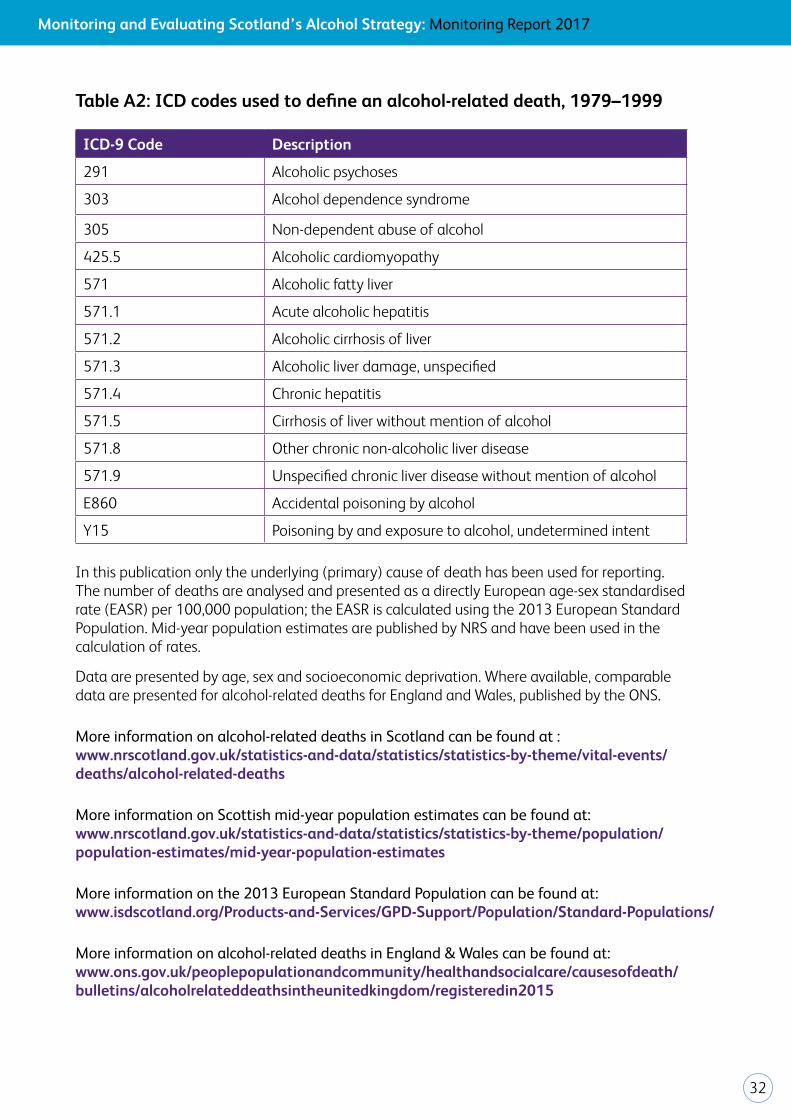
Table A2: ICD codes used to define an alcohol-related death, 1979–1999
ICD-9 Code Description
291 Alcoholic psychoses
303 Alcohol dependence syndrome
305 Non-dependent abuse of alcohol
425.5 Alcoholic cardiomyopathy
571 Alcoholic fatty liver
571.1 Acute alcoholic hepatitis
571.2 Alcoholic cirrhosis of liver
571.3 Alcoholic liver damage, unspecified
571.4 Chronic hepatitis
571.5 Cirrhosis of liver without mention of alcohol
571.8 Other chronic non-alcoholic liver disease
571.9 Unspecified chronic liver disease without mention of alcohol
E860 Accidental poisoning by alcohol
Y15 Poisoning by and exposure to alcohol, undetermined intent
In this publication only the underlying (primary) cause of death has been used for reporting. The number of deaths are analysed and presented as a directly European age-sex standardised rate (EASR) per 100,000 population; the EASR is calculated using the 2013 European Standard Population. Mid-year population estimates are published by NRS and have been used in the calculation of rates.
Data are presented by age, sex and socioeconomic deprivation. Where available, comparable data are presented for alcohol-related deaths for England and Wales, published by the ONS.
More information on alcohol-related deaths in Scotland can be found at : www.nrscotland.gov.uk/statistics-and-data/statistics/statistics-by-theme/vital-events/deaths/alcohol-related-deaths
More information on Scottish mid-year population estimates can be found at: www.nrscotland.gov.uk/statistics-and-data/statistics/statistics-by-theme/population/population-estimates/mid-year-population-estimates
More information on the 2013 European Standard Population can be found at: www.isdscotland.org/Products-and-Services/GPD-Support/Population/Standard-Populations/
More information on alcohol-related deaths in England & Wales can be found at: www.ons.gov.uk/peoplepopulationandcommunity/healthandsocialcare/causesofdeath/bulletins/alcoholrelateddeathsintheunitedkingdom/registeredin2015
Monitoring and Evaluating Scotland’s Alcohol Strategy: Monitoring Report 2017
33
Alcohol-related hospital admissionsData relating to alcohol-related admissions are taken from ‘Alcohol-related hospital statistics, Scotland 2015/16’ published by Information Services Division (ISD) (Oct 2016). Scottish hospital statistics are derived from data collected on day-case and inpatient episodes in non-obstetric and non-psychiatric hospitals in Scotland submitted to ISD as part of the Scottish Morbidity Record 01 (SMR01) data set. Additionally data is presented for hospitalisations to psychiatric hospitals from the Scottish Morbidity Record 04 (SMR04). Only records from Scottish residents are included in these analyses, determined by their postcode within the Scottish NHS Board boundaries. The number of hospitalisations are presented as European age-sex standardised rate (EASR) per 100,000 population; the EASR is calculated using the 2013 European Standard Population. Data are presented by age, sex and socioeconomic deprivation.
ISD report three types of hospital activity measures: ‘continuous inpatient stays (referred to as ‘stays’), patient counts and new patient counts. Stays are distinct alcohol-related hospital admissions which occur within a year. Counts of patients are the number of people who have had at least one alcohol-related hospital admission during a particular year. New patient counts describe how many people each year have an alcohol-related admission that have not had an alcohol-related admission in the past 10 years.’
More information on alcohol-related hospital statistics can be found at: www.isdscotland.org/Health-Topics/Drugs-and-Alcohol-Misuse/Publications
Alcohol-related social harmsData on crimes wholly attributable to alcohol were extracted from ‘Recorded Crime in Scotland’ statistical series, published by the Scottish Government. More information on the Recorded Crime in Scotland statistics can be found at:www.gov.scot/Publications/2016/09/2960
Data on homicide, attempted murder and serious assault were extracted from ‘Homicides in Scotland’ statistical series, also published by the Scottish Government. More information on the Homicides in Scotland statistics can be found at:www.gov.scot/Topics/Statistics/Browse/Crime-Justice/PubHomicide
Descriptive analysis of data from the Scottish Crime and Justice Survey was undertaken to obtain data on prevalence of violent crime and the likelihood of alcohol involvement. More information on the Scottish Crime and Justice Survey can be found at:www.gov.scot/Topics/Statistics/Browse/Crime-Justice/crime-and-justice-survey
Data on the prison population is from the Scottish Prisoner Survey. More information on the latest Scottish Prisoner Survey can be found at:www.sps.gov.uk/Corporate/Publications/Publication-4565.aspx
Adverse effects of alcohol consumption in young people is taken from the Scottish Adolescent Lifestyle and Substance Use Survey (SALSUS) as described above. Hospital admissions for young people are taken from ‘Alcohol-related hospital statistics, Scotland 2015/16’ published by ISD, as described above.

Monitoring and Evaluating Scotland’s Alcohol Strategy: Monitoring Report 2017
34
Measures of health inequality
The Slope Index of Inequality (SII) is a measure of absolute inequality of a health outcome (e.g. alcohol-related death rates) in a population. It gives a measure of the difference in rates between the most and least deprived in the population whilst also taking into account the distribution of the whole population across the deprivation deciles.
The Relative Index of Inequality (RII) is a measure of relative inequality of a health outcome. Like SII, it is based on the rates across all levels of area deprivation, however RII compares ratios rather than absolute differences – a measure of the relative difference across the whole population.
SII and RII are considered better than measuring the absolute difference or ratio between the most and least deprived groups because they take into account the whole population not just the extremes.

Appendix 2
35
Appendix 2Litres and units of pure alcohol sold per adult, and average price per unit, Scotland and England & Wales, 2000–2016
Scotland 2000 2001 2002 2003 2004 2005 2006 2007 2008 2009 2010 2011 2012 2013 2014 2015 2016
Total salesLitres per adult (annually) 10.9 11.1 11.0 11.3 11.5 11.7 11.6 11.7 11.6 11.6 11.4 11.1 10.8 10.6 10.7 10.8 10.5Units per adult (weekly) 21.0 21.3 21.1 21.7 22.1 22.4 22.4 22.5 22.3 22.3 21.9 21.3 20.7 20.3 20.5 20.8 20.2Average price per unit (£) 0.61 0.63 0.61 0.62 0.62 0.64 0.66 0.67 0.68 0.70 0.73 0.77 0.80 0.82 0.84 0.84 0.87Off-trade
Litres per adult (annually) 6.5 6.6 6.8 7.0 7.2 7.3 7.4 7.6 7.7 7.9 7.9 7.8 7.6 7.6 7.7 8.0 7.7Units per adult (weekly) 12.5 12.8 13.0 13.5 13.8 14.1 14.2 14.5 14.7 15.1 15.2 15.1 14.6 14.6 14.8 15.4 14.7Average price per unit (£) 0.39 0.39 0.39 0.39 0.39 0.39 0.40 0.40 0.41 0.43 0.45 0.48 0.50 0.52 0.52 0.52 0.53On-tradeLitres per adult (annually) 4.4 4.4 4.2 4.3 4.3 4.3 4.2 4.1 4.0 3.7 3.6 3.3 3.2 3.0 2.9 2.8 2.8Units per adult (weekly) 8.5 8.5 8.1 8.2 8.4 8.3 8.2 7.9 7.6 7.2 6.9 6.3 6.1 5.8 5.7 5.5 5.4Average price per unit (£) 0.95 0.99 0.97 0.99 1.02 1.06 1.11 1.17 1.21 1.27 1.35 1.47 1.53 1.57 1.66 1.74 1.79England & Wales 2000 2001 2002 2003 2004 2005 2006 2007 2008 2009 2010 2011 2012 2013 2014 2015 2016Total salesLitres per adult (annually) 9.9 10.1 10.3 10.4 10.4 10.5 10.4 10.3 9.9 9.8 9.6 9.4 9.2 9.0 9.0 9.1 9.0Units per adult (weekly) 19.0 19.5 19.8 20.0 20.0 20.2 20.0 19.8 19.0 18.8 18.4 18.0 17.7 17.3 17.4 17.4 17.3Average price per unit (£) 0.63 0.64 0.65 0.66 0.67 0.68 0.69 0.70 0.72 0.73 0.75 0.80 0.84 0.86 0.87 0.88 0.89Off-tradeLitres per adult (annually) 5.1 5.4 5.6 5.8 5.9 6.1 6.1 6.3 6.3 6.3 6.3 6.2 6.2 6.1 6.2 6.3 6.3Units per adult (weekly) 9.9 10.4 10.8 11.1 11.3 11.7 11.8 12.1 12.0 12.2 12.1 12.0 11.8 11.7 11.9 12.1 12.0Average price per unit (£) 0.39 0.39 0.39 0.39 0.39 0.40 0.40 0.40 0.42 0.44 0.45 0.48 0.50 0.53 0.53 0.53 0.53On-tradeLitres per adult (annually) 4.7 4.7 4.7 4.6 4.5 4.4 4.3 4.0 3.6 3.4 3.3 3.1 3.0 2.9 2.9 2.8 2.7Units per adult (weekly) 9.1 9.1 9.0 8.9 8.7 8.4 8.2 7.7 7.0 6.6 6.3 6.0 5.8 5.6 5.5 5.3 5.2Average price per unit (£) 0.89 0.93 0.96 1.00 1.03 1.07 1.12 1.16 1.23 1.27 1.32 1.42 1.51 1.55 1.61 1.67 1.72
For the full dataset please see www.healthscotland.scot/MESAS
35For the full dataset please see www.healthscotland.scot/MESAS

Appendix 3Alcohol-related deaths in Scotland: European age-sex standardised rates (EASR) per 100,000 population, by sex, age and deprivation, 1996–2015
Calendar year of registration 1996 1997 1998 1999 2000 2001 2002 2003 2004 2005 2006 2007 2008 2009 2010 2011 2012 2013 2014 2015Scotland 22.6 24.2 25.5 27.7 28.7 30.8 32.3 33.2 31.4 31.9 31.9 28.6 28.5 25.7 26.1 24.6 21.2 21.4 22.2 21.9Males 31.2 34.2 35.6 39.0 41.3 44.0 45.9 47.7 45.5 44.6 44.2 40.2 40.3 34.6 37.1 33.1 29.9 29.8 31.2 30.0Females 14.0 14.2 15.5 16.5 16.1 17.6 18.6 18.7 17.3 19.2 19.6 16.9 16.7 16.7 15.2 16.0 12.5 13.0 13.3 13.8Age (years)0–14 0.0 0.1 0.0 0.0 0.0 0.1 0.0 0.0 0.0 0.0 0.1 0.0 0.0 0.0 0.0 0.0 0.0 0.0 0.0 0.015–24 0.5 0.8 0.7 1.6 0.6 0.3 0.5 0.2 0.8 0.6 0.6 0.5 0.6 0.6 0.6 0.4 0.1 0.4 0.1 0.025–34 2.7 4.1 4.0 7.0 7.4 6.5 7.4 4.9 7.5 7.4 6.8 7.7 6.4 7.0 6.1 5.3 5.9 5.4 3.9 4.535–44 20.8 23.5 24.4 25.5 23.7 24.5 24.1 26.8 26.8 24.3 29.0 24.7 26.5 23.7 22.9 23.9 16.7 19.3 19.0 16.045–54 43.8 46.3 52.2 52.9 53.9 58.5 64.3 61.3 58.3 63.0 60.5 57.2 53.0 46.9 48.4 39.7 33.5 38.6 38.1 38.755–64 56.4 51.4 58.9 65.9 73.2 73.1 80.1 83.2 76.7 75.8 80.6 69.7 68.3 59.6 62.2 59.2 51.4 48.8 50.3 51.065+ 31.4 37.9 35.2 38.3 39.3 47.1 45.6 50.5 45.5 47.3 42.8 37.8 40.9 37.9 38.7 38.7 35.8 33.3 38.2 37.3Deprivation (SIMD deciles)1 - most deprived
60.1 61.1 69.5 79.9 79.6 89.2 102.4 96.6 88.6 80.3 95.9 77.4 77.0 62.0 67.0 57.6 54.2 46.3 54.9 49.6
2 36.4 40.1 36.4 41.9 50.8 49.4 52.9 59.2 52.5 60.0 56.4 55.5 53.1 44.6 45.7 41.4 36.2 36.7 39.3 39.83 29.0 32.5 32.1 32.0 33.8 41.7 43.7 44.8 42.4 47.4 42.9 33.7 35.8 39.5 33.5 34.9 32.0 31.5 30.8 29.64 22.4 20.9 26.4 26.8 29.3 29.8 33.1 33.4 40.7 32.5 31.9 30.2 36.1 26.3 30.7 26.6 20.8 26.1 23.6 25.55 20.1 19.7 21.7 25.3 26.1 26.8 27.9 26.7 24.5 27.3 26.9 26.7 29.9 21.7 24.7 23.3 19.4 18.1 24.0 18.66 17.4 18.7 21.9 18.7 21.6 19.2 21.5 25.3 20.6 24.5 24.6 17.6 21.8 16.6 17.0 15.3 14.6 16.3 14.9 17.47 13.0 16.3 15.0 21.5 14.9 16.6 18.6 21.1 16.6 18.4 15.7 17.8 12.0 17.1 15.2 17.5 12.2 13.5 13.5 13.78 11.3 13.5 13.6 13.0 14.5 16.3 15.4 12.8 15.6 13.4 17.3 13.5 10.7 14.2 12.2 12.6 9.5 10.3 12.3 11.39 6.8 11.9 10.3 11.5 12.7 13.5 12.9 14.3 12.3 13.6 12.7 12.9 11.5 12.2 12.1 10.6 9.4 10.9 6.3 10.210 - least deprived
10.4 9.3 9.1 11.4 10.7 12.9 8.3 10.9 10.3 10.8 9.0 7.9 7.5 7.4 9.0 9.3 7.6 7.2 8.0 8.3
For the full dataset please see www.healthscotland.scot/MESAS
36
Appendix 3
36For the full dataset please see www.healthscotland.scot/MESAS

Appendix 4Alcohol-related hospital stays in Scotland: European age-sex standardised rates (EASR) per 100,000 population, by sex, age and deprivation, 1997/98–2015/16
Financial year 1997/
19981998/ 1999
1999/2000
2000/2001
2001/ 2002
2002/ 2003
2003/ 2004
2004/ 2005
2005/ 2006
2006/ 2007
2007/ 2008
2008/ 2009
2009/ 2010
2010/ 2011
2011/ 2012
2012/ 2013
2013/ 2014
2014/ 2015
2015/ 2016
Scotland 629 645 686 678 714 743 741 796 780 809 856 828 771 760 750 699 707 674 665Males 939 954 1,026 1,006 1,050 1,102 1,101 1,190 1,151 1,196 1,250 1,211 1,123 1,113 1,091 1,011 1,026 976 961Females 320 336 347 350 378 385 380 401 408 423 462 445 420 407 409 387 387 372 368Age (years)0–14 60 49 56 57 55 49 42 41 42 46 41 32 28 24 21 19 18 15 1515–24 462 480 518 486 532 542 472 469 501 551 639 563 500 484 470 386 380 333 31125–34 504 528 556 534 606 622 599 615 588 629 760 756 698 684 681 621 599 535 51135–44 842 866 888 897 923 946 924 964 951 1,027 1,056 1,047 988 970 1,000 896 928 866 82245–54 977 986 1,084 1,113 1,127 1,230 1,237 1,326 1,324 1,328 1,397 1,360 1,253 1,231 1,196 1,138 1,135 1,076 1,07555–64 1,008 1,022 1,063 1,063 1,151 1,174 1,204 1,289 1,281 1,288 1,314 1,256 1,179 1,153 1,116 1,073 1,117 1,111 1,12065+ 631 662 714 676 704 739 779 905 836 868 886 871 827 833 824 796 805 799 804Deprivation (SIMD deciles)1 - most deprived
1744 1807 1911 1911 1999 2053 2015 2228 2159 2187 2340 2276 2107 2088 1997 1820 1918 1786 1800
2 979 985 1157 1147 1154 1224 1219 1398 1360 1391 1471 1434 1332 1275 1274 1216 1176 1146 11313 836 899 912 943 997 1058 1065 1094 1085 1162 1189 1143 1044 1041 1065 949 964 979 9444 638 683 747 717 775 832 845 886 869 919 944 922 877 832 771 801 783 740 7475 552 566 602 627 683 713 699 724 691 711 767 714 662 643 657 599 629 576 5606 450 481 504 508 522 548 541 549 534 564 557 551 538 540 529 515 501 443 4487 375 374 401 370 430 437 454 444 437 453 484 456 432 415 419 391 399 415 3858 310 286 319 296 317 328 344 330 363 379 388 390 381 348 356 333 333 310 3109 256 243 240 239 248 258 254 287 296 308 337 309 259 272 268 247 254 261 255
10 - least deprived
202 203 192 189 200 221 239 236 230 238 256 257 240 236 248 215 223 216 206
For the full dataset please see www.isdscotland.org/Health-Topics/Drugs-and-Alcohol-Misuse/Publications
37
Appendix 4
For the full dataset please see www.isdscotland.org/Health-Topics/Drugs-and-Alcohol-Misuse/Publications37

Published by NHS Health Scotland
1 South Gyle Crescent Edinburgh EH12 9EB
© NHS Health Scotland 2017
This resource may also be made available on request in the following formats:
0131 314 5300
5995
6/2
017 www.healthscotland.scot