Monitoring and assessment of ambient benzene ... and assessment of ambient benzene concentration and...
37
Monitoring and assessment of ambient benzene concentration and its health impact in urban area in Tehran Farideh Atabi, Ph.D. Assistant Prof., Graduate School of Environment and Energy, Science and Research Branch, Islamic Azad University, Tehran, Iran & S. A. H. Mirzahosseini, Ph.D. U.S. – Iran Symposium on “Urban Air Pollution in Megacities” Beckman Center of National Academies of Sciences & Engineering Irvine, California September 3-5, 2013 1
Transcript of Monitoring and assessment of ambient benzene ... and assessment of ambient benzene concentration and...

Monitoring and assessment of ambient benzene concentration and its health impact in urban area in Tehran
Farideh Atabi, Ph.D.
Assistant Prof., Graduate School of Environment and Energy,
Science and Research Branch, Islamic Azad University, Tehran, Iran
&
S. A. H. Mirzahosseini, Ph.D.
U.S. – Iran Symposium on “Urban Air Pollution in Megacities”
Beckman Center of National Academies of Sciences & Engineering
Irvine, California
September 3-5, 2013
1

Outline
• Background
• Methodology
• Field Measurement
• Interpolation Using IDW Model
• Cancer Risk Assessment
• Conclusions
2
Background
3
Background
Main sources of ambient Benzene [ATSDR, 2007]:
1. The vehicles’ exhaust
2. Gasoline evaporation
3. Leakage from natural gas
4. Emissions from the use of solvents and paints,
5. Using as an additive to unleaded gasoline,…
Benzene is an aromatic volatile organic compound characterized by US EPA as a “known” human carcinogen for all routes of exposure and is clasified by the International Association on the Risks of Cancer [IARC, 1987] as class 1 carcinogen.
4
Background
Annual averages of Benzene concentration have been measured in
various European regions (Cocheo et al. 2000; Skov et al. 2001). The
annual average concentrations of benzene in metropolitans have ranged
from a almost zero to more than 6.25 ppb (Anabtawi et al. 1996).
In Japan, the ambient standard for benzene concentration has been set
to be 0.69 ppb (Laowagul and Yoshizumi, 2009).
Iran Department of the Environment (DoE) and US EPA have set the
standard for the ambient Benzene concentration levels to be 1.56 ppb
[Iran DOE, 2010].
5

Background
Despite the regulations established, benzene
concentrations and cancer risk assessment have
not been investigated in Tehran due to the lack of
data for ambient benzene concentration levels.
This is the first time that such an extensive study
about benzene has been carried out in Tehran city.
6
Methodology
7

The Studied Area
Tehran is divided into 22 municipality districts, and District 1 with the area of 46 km2 is located at the northern part of the city and heavy traffic flows along with densely populated areas are the main characteristics of this area with population of around 445000.
In this study, ambient benzene concentration levels in 33 sampling locations including 4 gas stations, 9 roadsides, 5 busy roads, 8 residential areas and 7 traffic intersections in District 1 were monitored, during 4.00–8.00 pm, once a week, during 5th April 2010 to 25th March 2011.
8

Identification codes and situations of the sampling locations in District 1 in Tehran
Identification code Sampling Station name Geographic location Situation
x y
1 6 sharghi-shadavar 536831 3961140 Residential area
2 Aghdasiyeh-golestan 543076 3962312 Roadside
3 Aghdaseyeh-park 542925 3962515 Roadside
4 Alef Sq. 537239 3961537 Busy road
5 Andarzgoo-Vatanpoor 541312 3962062 Roadside
6 Anjoman koshnevesan 540267 3962288 Residential area
7 Artesh-Ozgol 544945 3961872 Roadside
8 Baghe ferdos 538028 3962261 Busy road
9 Bolvar saba -pol roomi 539358 3961183 Traffic intersection
10 Darmangah Farmanieh 542765 3961758 Traffic intersection
11 Eskan Kareghari 535763 3960900 Roadside
12 Ghalandari-park Shadi 539858 3960349 Residential area
13 Ghods Sq. 539140 3962404 Traffic intersection
14 Gheitarieh 540801 3961133 Busy road
15 Hashemi alley 541058 3961971 Residential area
16 Hosseini alley 541028 3961960 Residential area
17 Jim-4shargi 536879 3961074 Residential area
18 Langari-havashenasi 543771 3961748 Roadside
19 Langari-Nobonyad 543342 3960920 Roadside
20 Movahed danesh-masjed 543724 3961961 Busy road
21 Park way 537576 3960854 Traffic intersection
22 Pashazahri-Kamranieh 541662 3962007 Traffic intersection
23 Pesian-Valiasr 537805 3961997 Traffic intersection
24 Sadr-Dastor 539864 3960218 Roadside
25 Salimi alley 541057 3961735 Residential area
26 Shariati-metro Sadr 539391 3960321 Roadside
27 Gas Station 134 - Aghdaseyeh 542780 3962124 Vicinity of gas station
28 Gas Station 139 -Baagh ferdos 538210 3962496 Vicinity of gas station
29 Gas Station 148 - Velenjak 536717 3961050 Vicinity of gas station
30 Gas Station 27 - Pastdaran 543017 3961455 Vicinity of gas station
31 Tajrish Sq. 538648 3962592 Traffic intersection
32 Chamran-Velenjak 536664 3960981 Busy road
33 Tapeh-Gheitarieh 539829 3961074 Residential area
9
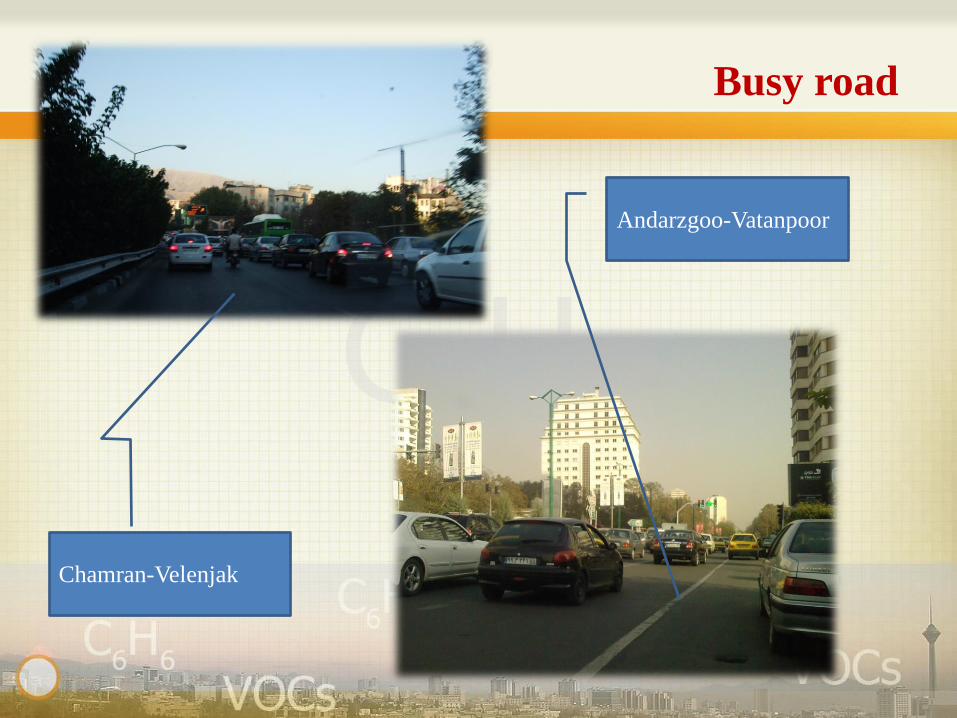
Busy road
Andarzgoo-Vatanpoor
Chamran-Velenjak

Residential area
Ghalandari-Parke Shadi
Hashemi Alley
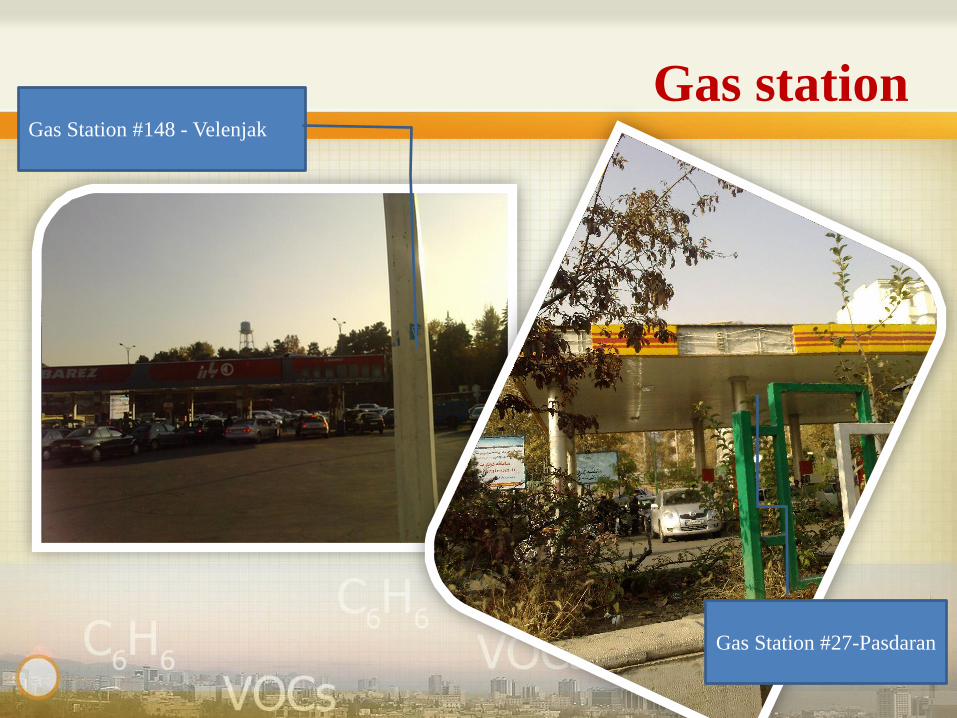
Gas station
Gas Station #27-Pasdaran
Gas Station #148 - Velenjak
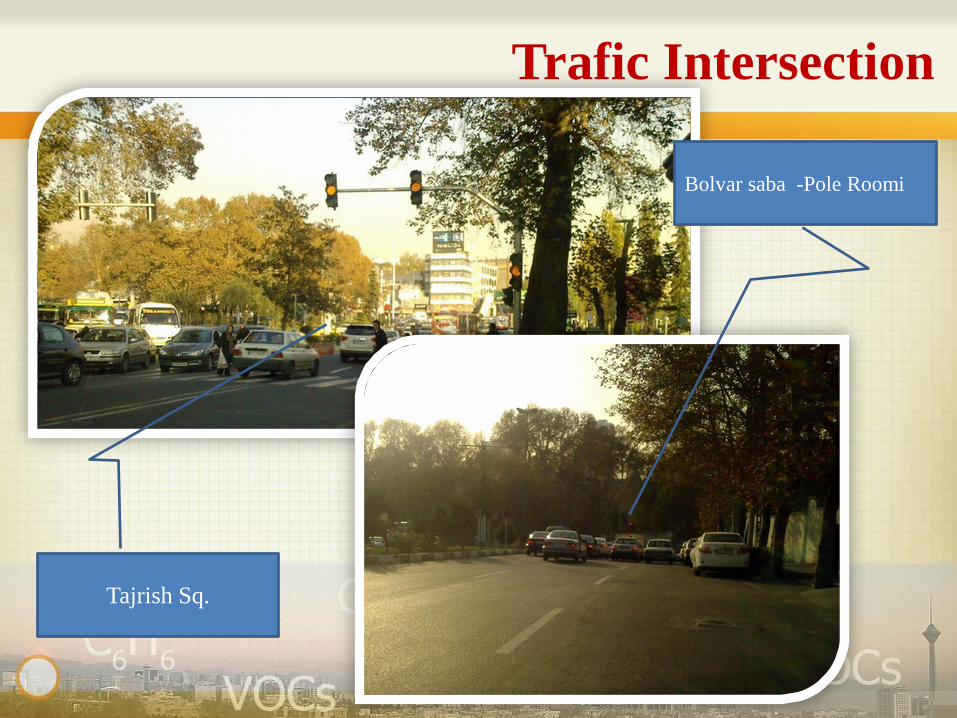
Tajrish Sq.
Bolvar saba -Pole Roomi
Trafic Intersection
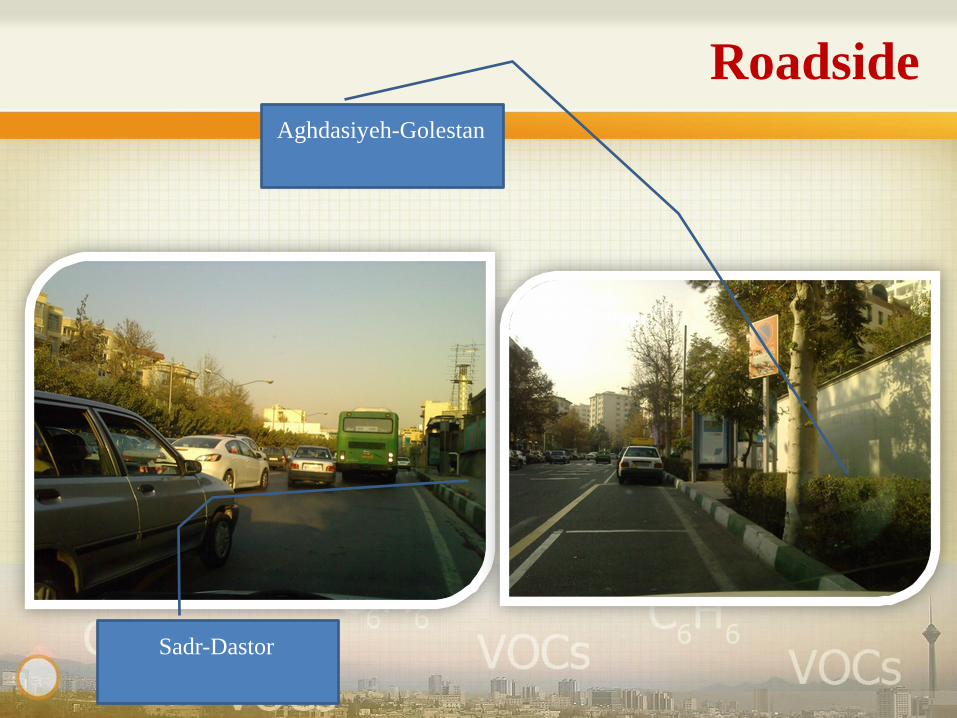
Sadr-Dastor
Aghdasiyeh-Golestan
Roadside

Locations of the 33 sampling stations in District 1 in Tehran, Iran. The sampling
stations in the studied area are assigned as: RS= Roadside; GS= Gas Station;
RA= Residential Area; TI=Traffic Intersection and BR= Busy Road
15
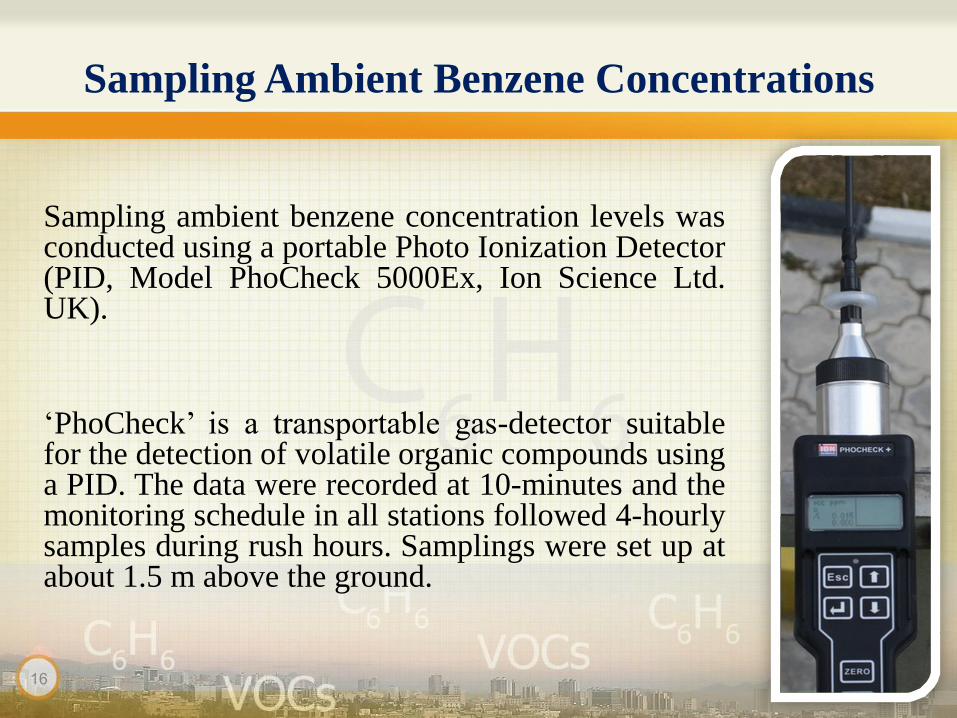
Sampling Ambient Benzene Concentrations
Sampling ambient benzene concentration levels was conducted using a portable Photo Ionization Detector (PID, Model PhoCheck 5000Ex, Ion Science Ltd. UK).
‘PhoCheck’ is a transportable gas-detector suitable for the detection of volatile organic compounds using a PID. The data were recorded at 10-minutes and the monitoring schedule in all stations followed 4-hourly samples during rush hours. Samplings were set up at about 1.5 m above the ground.
16
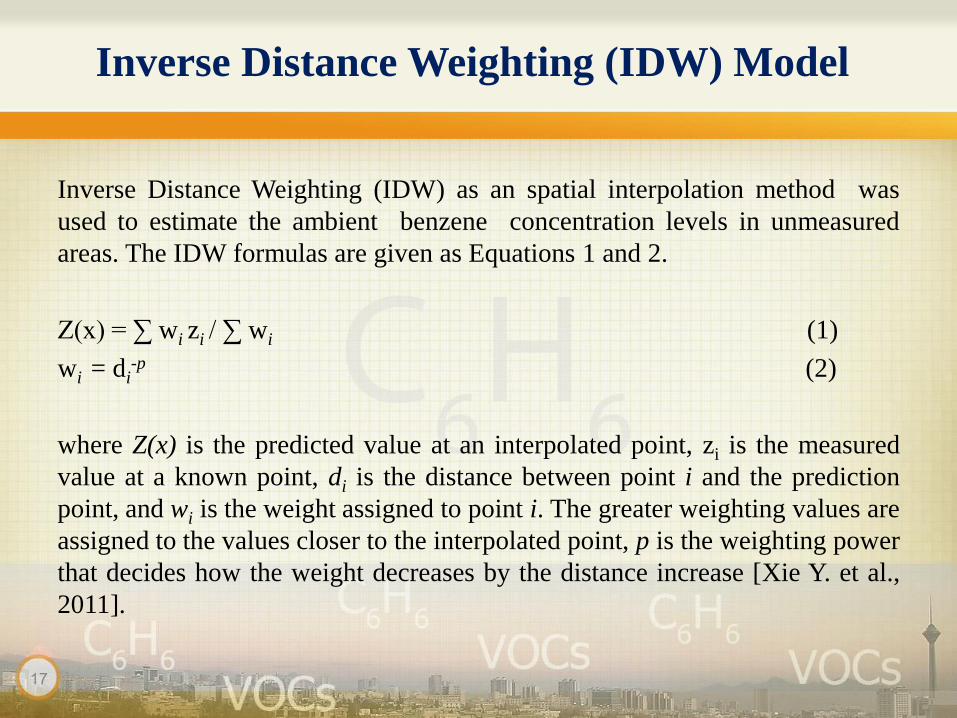
Inverse Distance Weighting (IDW) Model
Inverse Distance Weighting (IDW) as an spatial interpolation method was
used to estimate the ambient benzene concentration levels in unmeasured
areas. The IDW formulas are given as Equations 1 and 2.
Z(x) = ∑ wi zi / ∑ wi (1)
wi = di-p (2)
where Z(x) is the predicted value at an interpolated point, zi is the measured
value at a known point, di is the distance between point i and the prediction
point, and wi is the weight assigned to point i. The greater weighting values are
assigned to the values closer to the interpolated point, p is the weighting power
that decides how the weight decreases by the distance increase [Xie Y. et al.,
2011].
17
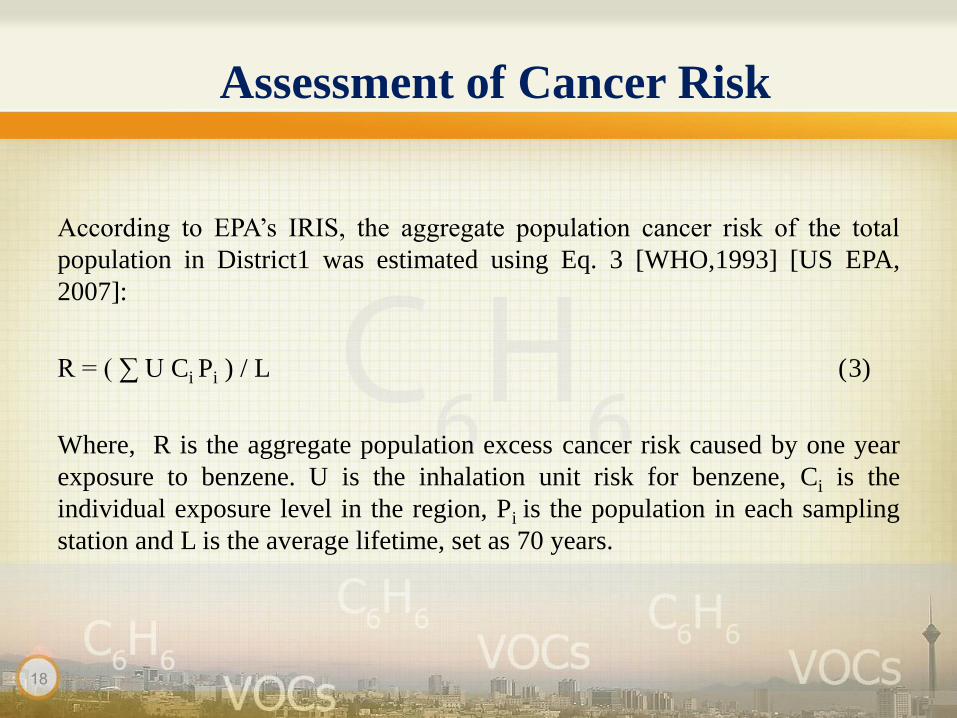
Assessment of Cancer Risk
According to EPA’s IRIS, the aggregate population cancer risk of the total
population in District1 was estimated using Eq. 3 [WHO,1993] [US EPA,
2007]:
R = ( ∑ U Ci Pi ) / L (3)
Where, R is the aggregate population excess cancer risk caused by one year
exposure to benzene. U is the inhalation unit risk for benzene, Ci is the
individual exposure level in the region, Pi is the population in each sampling
station and L is the average lifetime, set as 70 years.
18
Results and Discussion
19

20
Monthly variation of ambient benzene concentration levels in District 1 in Tehran
based on the field measurements
0
5
10
15
20
25
30
35
40
Busy road Traffic Intersection Vicinity of the gas stations Residential area Roadside
Co
nce
ntr
atio
ns
of
ben
zen
e (p
pb
)
Months
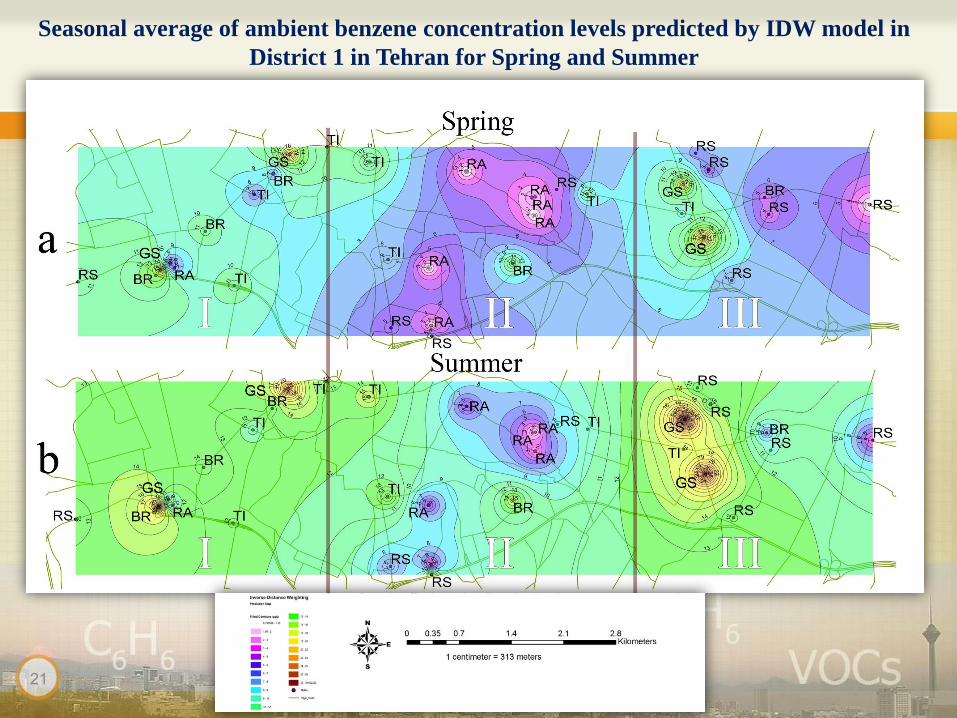
Seasonal average of ambient benzene concentration levels predicted by IDW model in
District 1 in Tehran for Spring and Summer
21
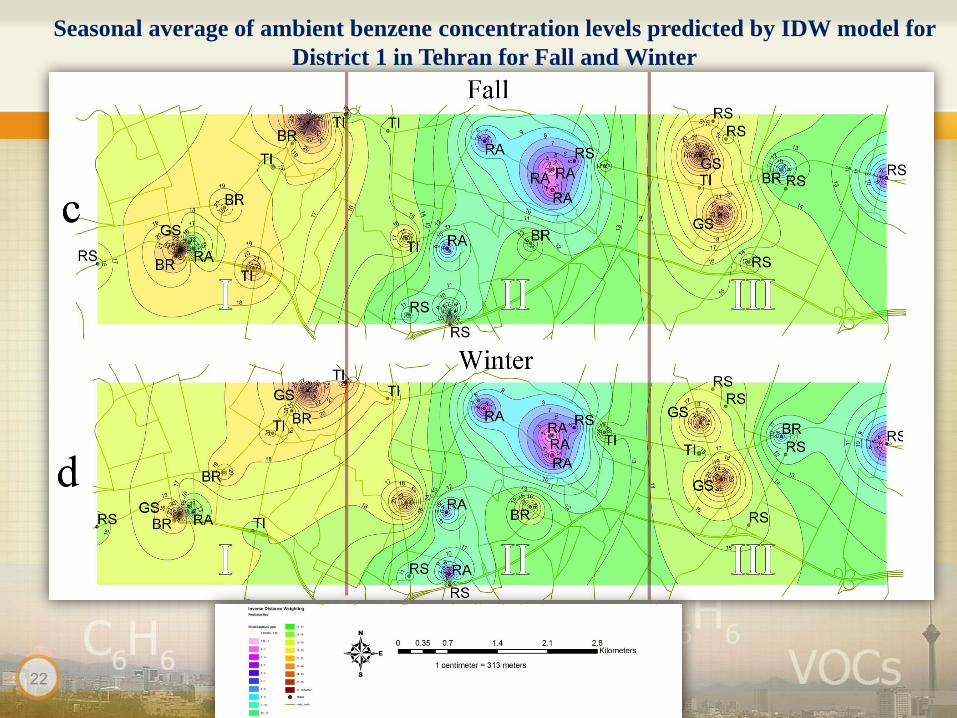
Seasonal average of ambient benzene concentration levels predicted by IDW model for
District 1 in Tehran for Fall and Winter
22

Annual average of ambient benzene concentration levels predicted by IDW model
in District 1 in Tehran
23

Measured and predicted seasonal and annual ambient benzene concentration
levels (ppb) in District 1 in Tehran
Identification
Code
Spring Summer Fall Winter Annual
Measured Predicted Measured Predicted Measured Predicted Measured Predicted Measured Predicted
1 2.53 3.73 7.04 8.99 8.98 9.68 11.29 12.11 7.46 8.63
2 4.27 5.37 11.46 12.17 16.11 17.34 15.64 16.35 11.87 12.81
3 6.07 7.41 12.14 15.26 20.13 19.24 16.40 15.82 13.69 14.43
4 11.67 9.18 14.84 12.94 21.87 20.43 20.56 18.67 17.23 15.31
5 4.33 4.88 9.87 6.56 4.61 5.32 4.82 6.38 5.91 5.79
6 0.40 1.86 3.54 5.98 4.75 6.91 2.74 3.28 2.86 4.51
7 0.73 7.58 2.96 3.53 4.14 7.01 1.67 2.09 2.38 5.05
8 6.43 7.47 12.10 13.25 17.99 18.94 16.81 19.68 13.33 14.84
9 9.80 6.27 15.88 14.49 20.26 19.35 26.39 25.15 18.08 16.32
10 8.34 11.13 15.98 14.86 18.81 19.35 14.65 12.67 14.45 14.50
11 11.90 9.96 11.86 13.93 15.57 17.17 15.18 16.94 13.63 14.50
12 0.00 7.26 1.23 2.52 1.92 2.75 1.99 3.37 1.28 3.98
13 14.67 13.26 16.36 15.72 14.52 15.54 18.65 16.5 16.05 15.26
14 13.27 12.35 16.00 15.56 15.98 13.45 19.50 16.18 16.18 14.39
15 0.47 1.53 0.43 1.61 1.28 2.53 1.18 2.73 0.84 2.10
16 0.50 1.47 0.96 1.14 0.89 1.81 1.19 2.7 0.88 1.78
17 5.30 8.96 8.64 9.67 9.86 10.58 11.25 13.67 8.76 10.72
18 3.10 7.06 9.36 11.09 13.59 12.81 11.00 12.07 9.26 10.76
19 5.53 9.34 11.54 12.58 12.45 14.69 15.76 15.28 11.32 12.97
20 4.17 6.58 5.63 11.67 6.86 8.71 6.84 8.84 5.87 8.95
21 11.74 9.13 11.71 13.04 23.08 21.94 15.44 16.67 15.49 15.20
22 11.40 5.62 9.37 9.76 14.33 11.05 16.45 13.53 12.89 9.99
23 5.93 9.77 10.06 11.77 16.73 19.03 20.41 18.11 13.28 14.67
24 7.63 6.09 14.74 13.181 20.12 18.88 15.12 13.11 14.40 12.82
25 0.00 0.49 1.10 2.74 0.98 1.49 0.86 1.59 0.74 1.58
26 4.30 6.43 5.01 6.33 9.44 10.36 10.54 12.81 7.32 8.98
27 19.17 17.18 34.64 33.51 32.44 33.86 25.79 24.47 28.01 27.26
28 21.10 19.13 26.10 25.79 40.85 37.58 34.48 33.06 30.63 28.89
29 21.30 19.58 29.53 27.19 37.53 35.15 29.85 27.59 29.55 27.38
30 22.63 20.25 29.97 28.08 30.18 31.32 28.62 26.87 27.85 26.63
31 10.21 10.84 11.62 12.65 13.63 15.6 23.16 24.84 14.65 15.98
32 13.88 14.29 16.06 20.32 19.67 20.9 16.93 18.22 16.63 18.43
33 0.20 1.39 3.32 6.02 5.23 8.88 5.57 7.59 3.53 5.97
24
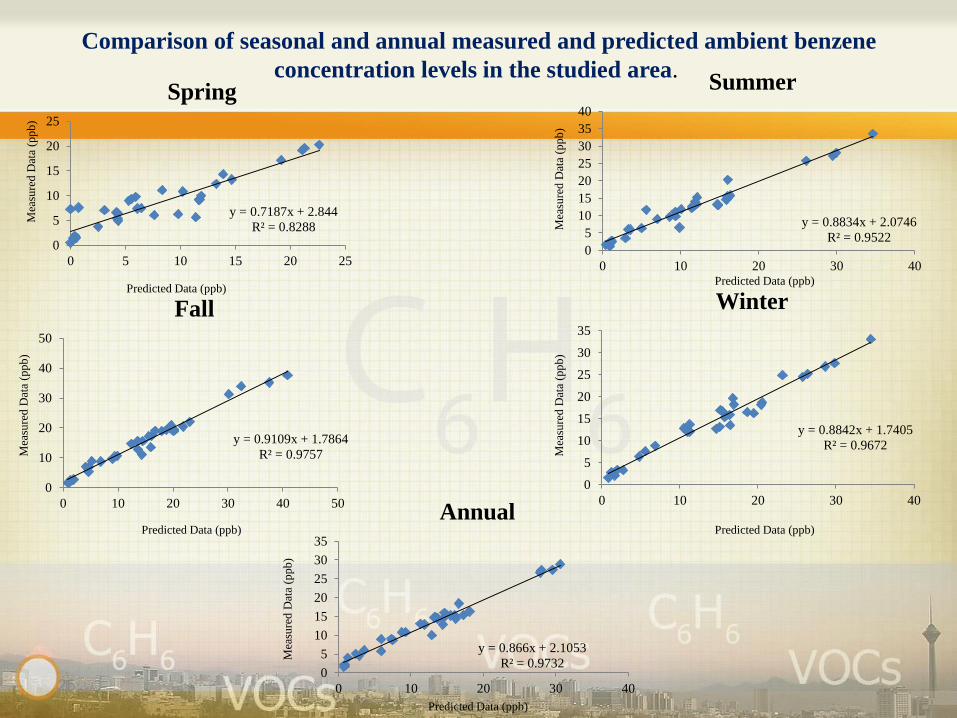
Comparison of seasonal and annual measured and predicted ambient benzene
concentration levels in the studied area.
y = 0.7187x + 2.844
R² = 0.8288
0
5
10
15
20
25
0 5 10 15 20 25
Spring
y = 0.8834x + 2.0746
R² = 0.9522 0
5
10
15
20
25
30
35
40
0 10 20 30 40
Summer
y = 0.9109x + 1.7864
R² = 0.9757
0
10
20
30
40
50
0 10 20 30 40 50
Fall
y = 0.8842x + 1.7405
R² = 0.9672
0
5
10
15
20
25
30
35
0 10 20 30 40
Winter
y = 0.866x + 2.1053
R² = 0.9732 0
5
10
15
20
25
30
35
0 10 20 30 40
Annual
25
Predicted Data (ppb) Predicted Data (ppb)
Predicted Data (ppb) Predicted Data (ppb)
Predicted Data (ppb)
Mea
sure
d D
ata
(pp
b)
Mea
sure
d D
ata
(pp
b)
Mea
sure
d D
ata
(pp
b)
Mea
sure
d D
ata
(pp
b)
Mea
sure
d D
ata
(pp
b)
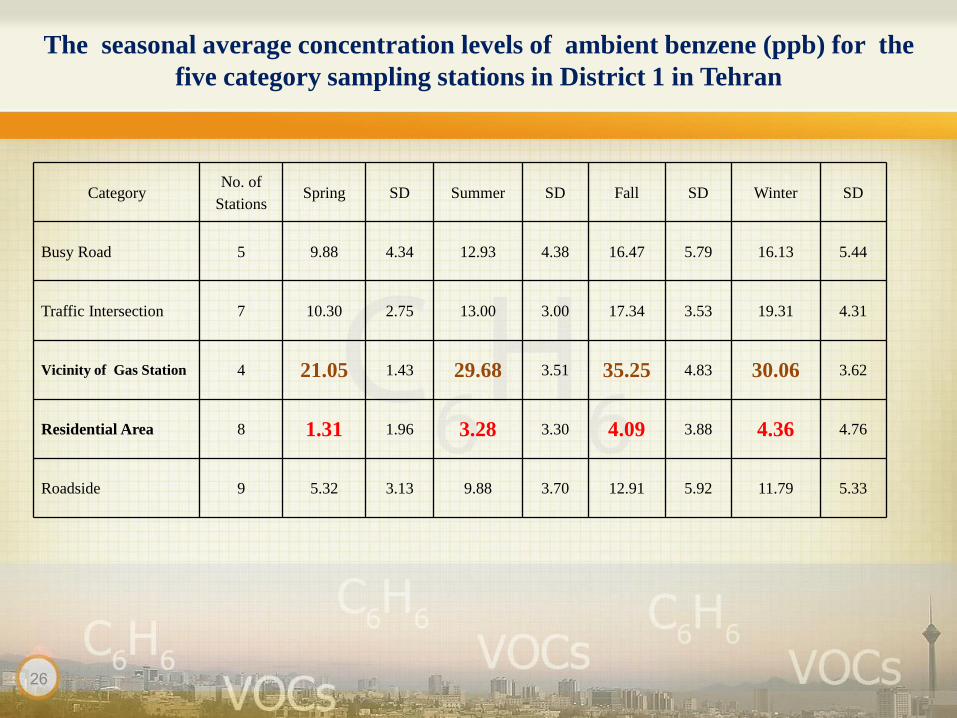
The seasonal average concentration levels of ambient benzene (ppb) for the
five category sampling stations in District 1 in Tehran
Category No. of
Stations Spring SD Summer SD Fall SD Winter SD
Busy Road 5 9.88 4.34 12.93 4.38 16.47 5.79 16.13 5.44
Traffic Intersection 7 10.30 2.75 13.00 3.00 17.34 3.53 19.31 4.31
Vicinity of Gas Station 4 21.05 1.43 29.68 3.51 35.25 4.83 30.06 3.62
Residential Area 8 1.31 1.96 3.28 3.30 4.09 3.88 4.36 4.76
Roadside 9 5.32 3.13 9.88 3.70 12.91 5.92 11.79 5.33
26

Lifetime Cancer Risk Probability
According to the EPA’s IRIS, health risk factor is a function of unit risk, target population and the pollutant concentration.
Theses three parameters were classified in 3 layers in GIS and the aggregate population cancer risk were estimated for population in District 1.
27

Distribution of population in District 1
28

Assessment of lifetime cancer risk probability for District 1 in Tehran
Identification Code Name of Sampling Station Measured Data (ppb) Cancer Risk Risk per 10-6
1 6 sharghi-shadavar 7.46 0.000316 316
2 Aghdaseyeh-golestan 11.87 0.000368 368
3 Aghdaseyeh-park 13.69 0.000448 448
4 Alef Sq. 17.23 0.000501 501
5 Andarzgoo-vatanpoor 5.91 0.000188 188
6 Anjoman koshnevesan 2.86 0.000095 95
7 Artesh-ozgol 2.38 0.000081 81
8 Bagh ferdos 13.33 0.000434 434
9 Bolvarsaba-Pole roomi 18.08 0.000555 555
10 Darmangah Farmaneyeh 14.45 0.000486 486
11 Eskan kareghari 13.63 0.000391 391
12 Ghalandari-Parke shadi 1.28 0.000054 54
13 Ghods Sq. 16.05 0.000452 452
14 Gheytareyeh 16.18 0.000473 473
15 Hashemi Alley 0.84 0.000066 66
16 Hosseini Alley 0.88 0.000049 49
17 Jim-4shargi 8.76 0.000318 318
18 Langari-havashenasi 9.26 0.000334 334
19 Langari-Nobonyad 11.32 0.000799 799
20 Movahed danesh-masjed 5.87 0.000221 221
21 Park way 15.49 0.000404 404
22 Pashazahri-Kamraniyeh 12.89 0.000391 391
23 Pesyan-Valieasr 13.28 0.000366 366
24 Sadr-Dastor 14.4 0.000401 401
25 Salimi- no3 0.74 0.000047 47 26 Shariyati-metro sadr 7.32 0.000221 221
27 Station #134 :Aghdasiyeh 28.01 0.000801 801
28 Station #139: Baghe ferdos 30.63 0.000902 902
29 Station #148: Velenjak 29.55 0.000886 886
30 Station #27: Pasdaran 27.85 0.003384 3384 31 Tajrish 14.65 0.000463 463
32 Chamran-Velenjak 16.63 0.000617 617
33 Tapeh-Gheytariyeh 3.53 0.000141 141
29
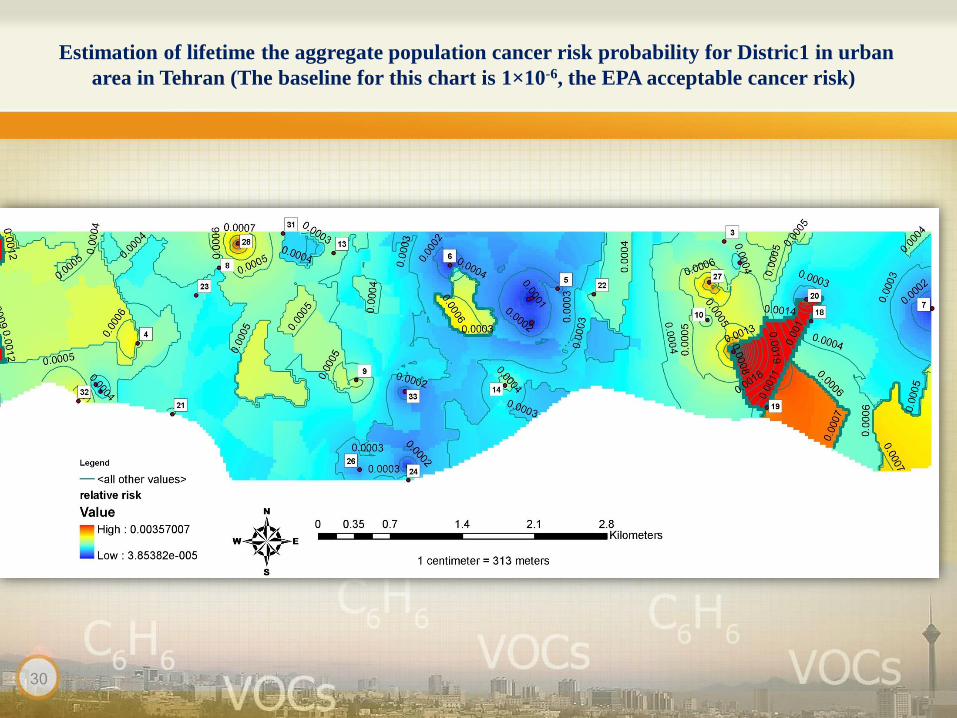
Estimation of lifetime the aggregate population cancer risk probability for Distric1 in urban
area in Tehran (The baseline for this chart is 1×10⁻⁶, the EPA acceptable cancer risk)
30

Conclusions
31
Conclusions
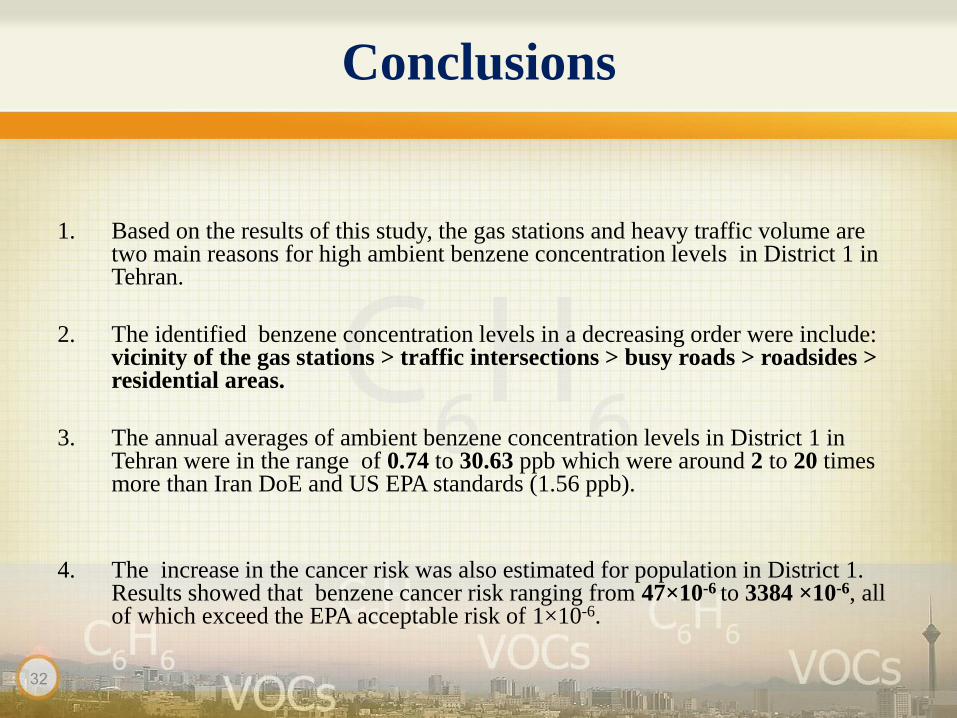
1. Based on the results of this study, the gas stations and heavy traffic volume are two main reasons for high ambient benzene concentration levels in District 1 in Tehran.
2. The identified benzene concentration levels in a decreasing order were include: vicinity of the gas stations > traffic intersections > busy roads > roadsides > residential areas.
3. The annual averages of ambient benzene concentration levels in District 1 in Tehran were in the range of 0.74 to 30.63 ppb which were around 2 to 20 times more than Iran DoE and US EPA standards (1.56 ppb).
4. The increase in the cancer risk was also estimated for population in District 1. Results showed that benzene cancer risk ranging from 47×10-6 to 3384 ×10-6, all of which exceed the EPA acceptable risk of 1×10⁻⁶.
32

Average ambient Benzene concentration levels (ppb) reported from several
worldwide sites
City Benzene concentration
(ppb)
Location Reference
London, UK 6.25 Busy Road Derwent et al. 1995
Tehran ,Iran 13.85 Busy Road Present study
Tehran ,Iran 29.01 vicinity of the gas stations Present study
Tehran ,Iran 3.26 Residential Area Present study
Alberta, Canada 0.94 Roadside Heeb et al. 1999
Athens, Greece 5.00 Roadside Moschonas 1996
Port Alegre, Brazil 7.81 Roadside Grosjean et al. 1998
Tehran ,Iran 9.97 Roadside Present study
Shirogane, Japan 0.25 Roadside Laowagul 2009
Tehran ,Iran 14.98 Traffic Intersection Present study
El Qualaly, Cairo 13.44 Traffic Intersection Abu-Allaban 2002
Delhi, India 27.1 Traffic Intersection Khillare et al. 2008
Pamplona, Spain 0.89 Residential Area Parra et al. 2009
Germany 0.385- 0.507 Residential Area Schneider et al. 2001
33

Conclusions
The main reasons for high ambient benzene concentration levels in Tehran (2010-2011):
1. High Benzene content of gasoline (5% volume)
2. Inappropriate fueling methods (lack of system to collect gasoline vapors)
3. Transportation of gasoline by non-standard containers
4. Improper locations of gas stations (which are usually located next to the roads with heavy traffic flow)
34

Acknowledgement
• American Association for Advancement of Science (AAAS)
• The National Academy of Sciences
• National Research Council
• World Learning
• International Visitor Leadership Program
• University of Southern California (USC)
• Sharif University of Technology

Thank You for Your Attention!
36

37