Monhegan LiDAR Study 2014 Summary - Home - … · · 2014-05-02LiDAR (Light Detection and Ranging...
3
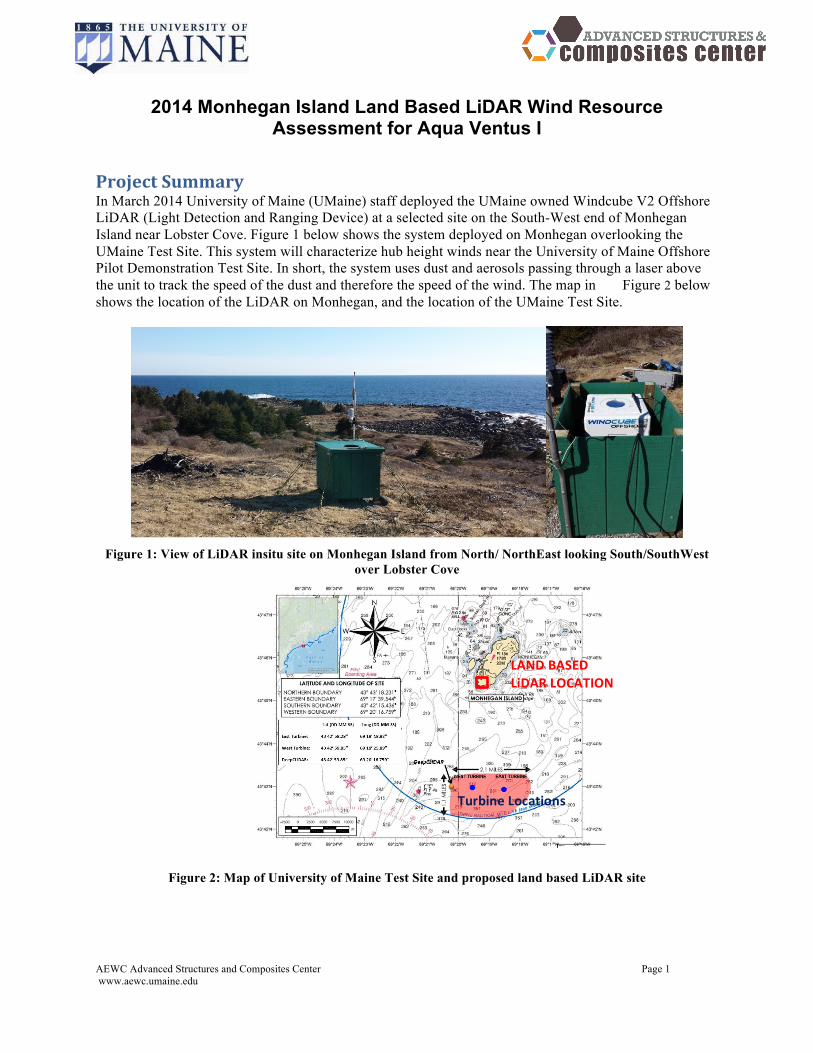
AEWC Advanced Structures and Composites Center Page 1 www.aewc.umaine.edu 2014 Monhegan Island Land Based LiDAR Wind Resource Assessment for Aqua Ventus I Project Summary In March 2014 University of Maine (UMaine) staff deployed the UMaine owned Windcube V2 Offshore LiDAR (Light Detection and Ranging Device) at a selected site on the South-West end of Monhegan Island near Lobster Cove. Figure 1 below shows the system deployed on Monhegan overlooking the UMaine Test Site. This system will characterize hub height winds near the University of Maine Offshore Pilot Demonstration Test Site. In short, the system uses dust and aerosols passing through a laser above the unit to track the speed of the dust and therefore the speed of the wind. The map in Figure 2 below shows the location of the LiDAR on Monhegan, and the location of the UMaine Test Site. Figure 1: View of LiDAR insitu site on Monhegan Island from North/ NorthEast looking South/SouthWest over Lobster Cove Figure 2: Map of University of Maine Test Site and proposed land based LiDAR site LAND BASED LiDAR LOCATION Turbine Locations
Transcript of Monhegan LiDAR Study 2014 Summary - Home - … · · 2014-05-02LiDAR (Light Detection and Ranging...
AEWC Advanced Structures and Composites Center Page 1 www.aewc.umaine.edu
2014 Monhegan Island Land Based LiDAR Wind Resource Assessment for Aqua Ventus I
Project Summary In March 2014 University of Maine (UMaine) staff deployed the UMaine owned Windcube V2 Offshore LiDAR (Light Detection and Ranging Device) at a selected site on the South-West end of Monhegan Island near Lobster Cove. Figure 1 below shows the system deployed on Monhegan overlooking the UMaine Test Site. This system will characterize hub height winds near the University of Maine Offshore Pilot Demonstration Test Site. In short, the system uses dust and aerosols passing through a laser above the unit to track the speed of the dust and therefore the speed of the wind. The map in Figure 2 below shows the location of the LiDAR on Monhegan, and the location of the UMaine Test Site.
Figure 1: View of LiDAR insitu site on Monhegan Island from North/ NorthEast looking South/SouthWest
over Lobster Cove
Figure 2: Map of University of Maine Test Site and proposed land based LiDAR site
LAND BASED LiDAR LOCATION
Turbine Locations

AEWC Advanced Structures and Composites Center Page 2 www.aewc.umaine.edu
UMaine is collaborating with industry partner AWS Truepower who will use the LiDAR data to verify their atmospheric models, particularly wind shear estimates that have been used thus far for the design of the VoturnUS Aqua Ventus I pilot demonstration floating turbines to be deployed in 2017. This data is critical to helping UMaine Researchers better understanding the hub-height wind resource (approximately 100 meters above the water surface) at the UMaine Monhegan Test Site. To verify that the wind on Monhegan measured by the LiDAR is representative of the wind at the nearby test site, the land based LiDAR data from Monhegan will be compared to data from the Neracoos E0130 Metocean Buoy located near the UMaine Monhegan Test Site. The E0130 Neracoos Buoy is operated by UMaine’s Physical Oceanography Group. This Buoy data is available to the public and is accessible via web browser as shown below in Figure 3.
Figure 3 PhOG Buoy Data Web Interface (http://gyre.umeoce.maine.edu/buoyhome.php)
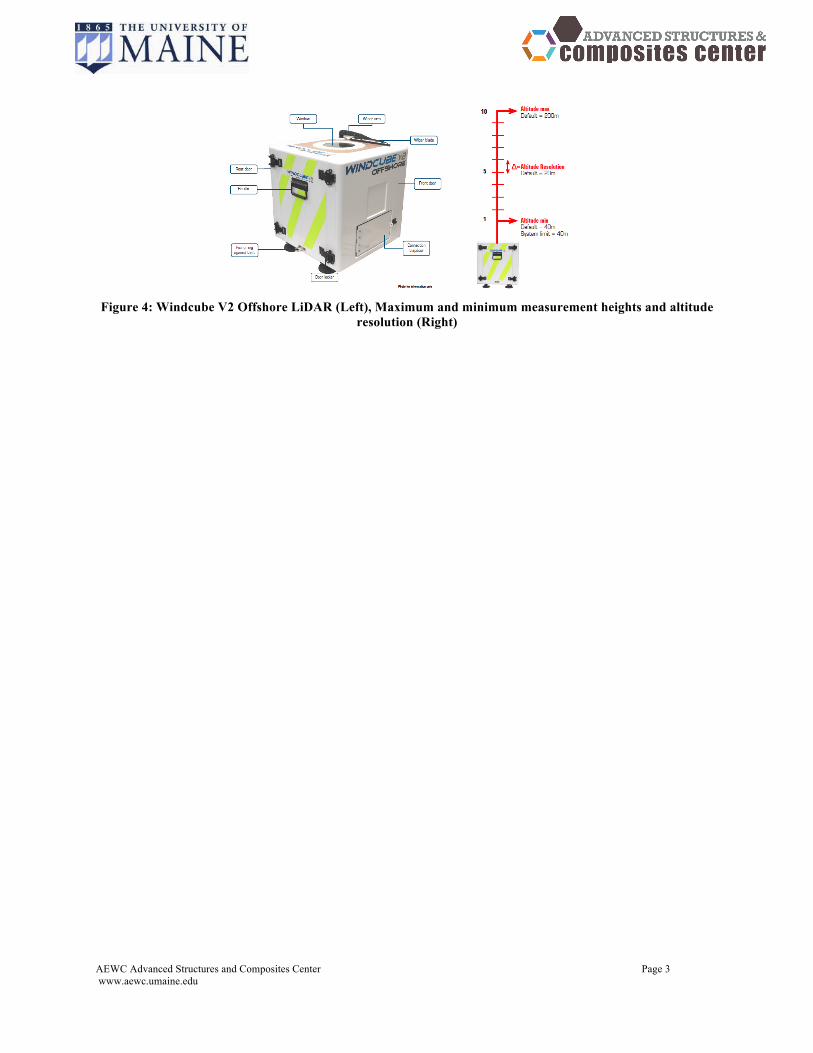
LiDAR System Characteristics The WINDCUBE® v2 Offshore LIDAR (Light Detection And Ranging) shown below in Figure 4 is used for wind profile measurement from 40m to 200m. The LIDAR sends infrared laser pulses into the atmosphere. Four beams are sent successively in four cardinal directions along a 28°scanning cone angle, followed by a fifth, vertical beam. Laser pulses are backscattered by aerosol particles in the air (dust, water droplets, aerosol, etc.), that move at wind speed. The collected backscattered light allows for the calculation of wind speed and direction using Doppler induced laser wavelength shift. Up to 12 different altitudes can be measured simultaneously. The backscattered light is converted into an electronic signal and digitized. Internal software processes the data which is the communicated via cellular communication. The user interacts with the WINDCUBE®v2 Offshore LiDAR through a web-based graphical user interface, Windweb, which is easily accessible through a web-browser. Real time and statistical wind data are stored on the WINDCUBE®v2 Offshore solid-state hard disk drive. The user downloads accumulated data files via the Windweb.
AEWC Advanced Structures and Composites Center Page 3 www.aewc.umaine.edu
Figure 4: Windcube V2 Offshore LiDAR (Left), Maximum and minimum measurement heights and altitude
resolution (Right)