Mongolia Economic Brief September 2016 - World...
6
This Economic Brief was prepared by MFM Mongolia Team, composed of Taehyun Lee (Senior Country Economist), Altantsetseg Shiilegmaa (Economist), Davaadalai Batsuuri (Economist), under the guidance of Mathew A. Verghis (Practice Manager). The budget deficit sharply rose in the first seven months of 2016 amid spending increases and revenue shortfalls. The deficit reached MNT 1,974 billion in Jan-July, a threefold increase from MNT 638 billion in the same period last year. The budget deficit over the first seven months is estimated to have reached over 8 percent of annual GDP, far exceeding the budgeted annual deficit target (MNT 940 billion or 4 percent of GDP). Budget revenues fell by 3.3 percent (yoy) in the same period, reflecting weaker commodity prices and import contraction. Mining revenues sharply dropped, with royalties almost halving from one year ago. Customs duties declined by over 10 percent due to weaker imports. Non-tax revenues also declined by 4.3 percent, reflecting a 33 percent drop in oil revenues, and minimal collection of dividends and privatization revenues. Budget expenditures jumped by 33 percent (yoy) in Jan-July, largely due to unbudgeted spending programs and loose spending controls. New government programs were launched in the first half. These programs included three policy loan programs (Good Herder/Student/Fence Programs) and a buyback program of the ETT shares owned by Mongolian citizens (Good Share Program). In Mar-July, over MNT 500 billion was spent for the four Good Programs. These programs were not recorded in the budget execution report until July, and have been funded by the BoM. Many of the on-budget expenditures also exceeded the original budget plan, including the Child Money Program, interest payments, and public investment spending. In addition, the government spent over MNT 400 billion in Mar-July for the Housing Mortgage Program that was previously undertaken by the BoM. The mortgage program spending, however, is yet to be recorded in the budget execution report. Mongolia Economic Brief September 2016 http://www.worldbank.org/mongolia
-
Upload
duongduong -
Category
Documents
-
view
222 -
download
2
Transcript of Mongolia Economic Brief September 2016 - World...
This Economic Brief was prepared by MFM Mongolia Team, composed of Taehyun Lee (Senior Country Economist), Altantsetseg Shiilegmaa (Economist), Davaadalai Batsuuri (Economist), under the guidance of Mathew A. Verghis (Practice Manager).
The budget deficit sharply rose in the first seven months of 2016 amid spending increases and revenue shortfalls. The deficit reached MNT 1,974 billion in Jan-July, a threefold increase from MNT 638 billion in the same period last year. The budget deficit over the first seven months is estimated to have reached over 8 percent of annual GDP, far exceeding the budgeted annual deficit target (MNT 940 billion or 4 percent of GDP).
Budget revenues fell by 3.3 percent (yoy) in the same period, reflecting weaker commodity prices and import contraction. Mining revenues sharply dropped, with royalties almost halving from one year ago. Customs duties declined by over 10 percent due to weaker imports. Non-tax revenues also declined by 4.3 percent, reflecting a 33 percent drop in oil revenues, and minimal collection of dividends and privatization revenues.
Budget expenditures jumped by 33 percent (yoy) in Jan-July, largely due to unbudgeted spending programs and loose spending controls. New government programs were launched in the first half. These programs included three policy loan programs (Good Herder/Student/Fence Programs) and a buyback program of the ETT shares owned by Mongolian citizens (Good Share Program). In Mar-July, over MNT 500 billion was spent for the four Good Programs. These programs were not recorded in the budget execution report until July, and have been funded by the BoM. Many of the on-budget expenditures also exceeded the original budget plan, including the Child Money Program, interest payments, and public investment spending. In addition, the government spent over MNT 400 billion in Mar-July for the Housing Mortgage Program that was previously undertaken by the BoM. The mortgage program spending, however, is yet to be recorded in the budget execution report.
Mongolia Economic Brief September 2016
http://www.worldbank.org/mongolia
2
Corrective measures have been taken by the government. The new government announced on August 9, that the consolidated budget deficit would reach 21 percent of GDP under the current trend, including all unbudgeted programs such as Good Programs and Housing Mortgage Program. The government terminated Good Programs, and submitted a supplementary budget for 2016 to include unbudgeted expenditures, aiming to contain the budget deficit at 18.2 percent of GDP. The proposed budget, however, excluded the Housing Mortgage Program that was transferred to the government in March. The commercial portfolio of the DBM still remains off the budget. A revised Medium Term Fiscal Framework for 2016-18 was also submitted to the parliament. The revised MTFF was proposed to aim to reduce the budget deficit to 15 percent of GDP by 2018, and 9 percent of GDP by 2020.
Fiscal consolidation measures were proposed to adjust spending and mobilize revenues. The government proposed to mobilize revenues by raising tax rates on personal income tax, alcohol and tobacco tax, and vehicle tax in 2017. The Child Money Program was also proposed to target the lower income households. Salaries for high ranking officials were proposed to be cut by 30 percent and the royalty rate for gold sales to the BoM was raised back to 5 percent.
The World Bank expects the budget deficit to reach 18 percent of GDP, close to the projections of the supplementary budget. The primary budget deficit, which excludes interest payments, is projected to reach 14 percent of GDP due to interest expenses reaching over 4 percent of GDP. The consolidated overall budget deficit—which adds DBM’s off-budget commercial portfolio
to the government’s definition—is expected to reach over 19 percent of GDP by end-2016. Nominal value of general government debt, including the sovereign-guaranteed TDB debt and the outstanding debt of the Build-Transfer (BT) projects, is projected to reach over 90 percent of GDP due to the high deficit and exchange rate depreciation, a sharp rise from 66 percent of GDP in 2015.
The recent measures taken by the new government are welcome, but further actions are urgently needed. The immediate challenge facing the new government was to contain the sharp rise in budget deficit and consolidate unbudgeted expenditures. The recent announcement of the accurate fiscal situation was a significant step toward a credible fiscal consolidation. The revised revenue projections of the government seem largely realistic, based on conservative assumptions. Projected high budget deficit and rapidly rising government debt, however, urgently call for a comprehensive and strong fiscal consolidation plan, including spending adjustment based on priorities and revenue mobilization measures. The fiscal consolidation plan should also include all of the remaining off-budget programs such as Housing Mortgage Program and DBM’s off-budget corporate lending programs that would likely increase fiscal burden.
There is a strong need for prioritizing expenditures to protect the vulnerable and improving public expenditure efficiency. Weakening growth and declining household consumption, despite the large increase in government spending this year, suggests that public expenditures may not be productive enough to support growth and jobs, underscoring the need for proper assessment of public expenditure efficiency and effectiveness. Particularly, the most
3
recent poverty analysis showed that poverty closely tracks growth and consumption. The recent high unemployment rate and a sharp drop in household consumption indicate that many households near the poverty line may be sliding back to poverty, putting a drag on
growth. Strengthening the social safety net, particularly targeting the vulnerable groups near or below the poverty line, would help mitigate the social costs of fiscal adjustment and support growth.
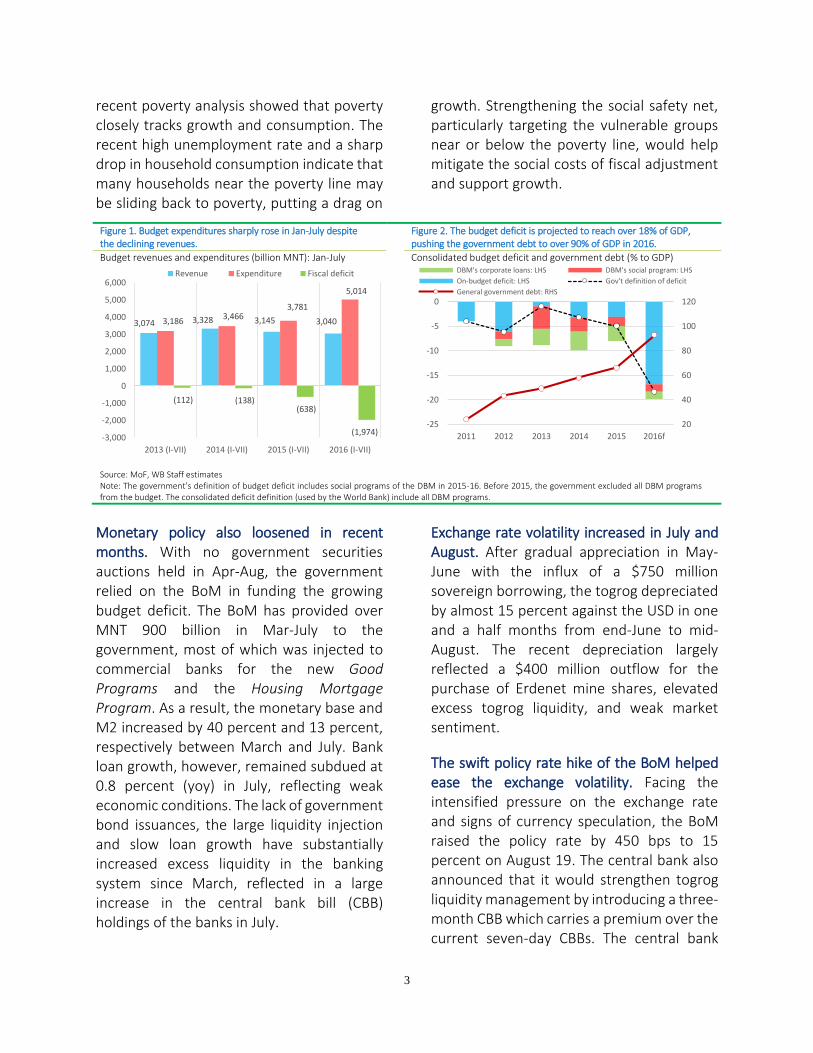
Figure 1. Budget expenditures sharply rose in Jan-July despite the declining revenues.
Figure 2. The budget deficit is projected to reach over 18% of GDP, pushing the government debt to over 90% of GDP in 2016.
Budget revenues and expenditures (billion MNT): Jan-July
Consolidated budget deficit and government debt (% to GDP)
Source: MoF, WB Staff estimates Note: The government’s definition of budget deficit includes social programs of the DBM in 2015-16. Before 2015, the government excluded all DBM programs from the budget. The consolidated deficit definition (used by the World Bank) include all DBM programs.
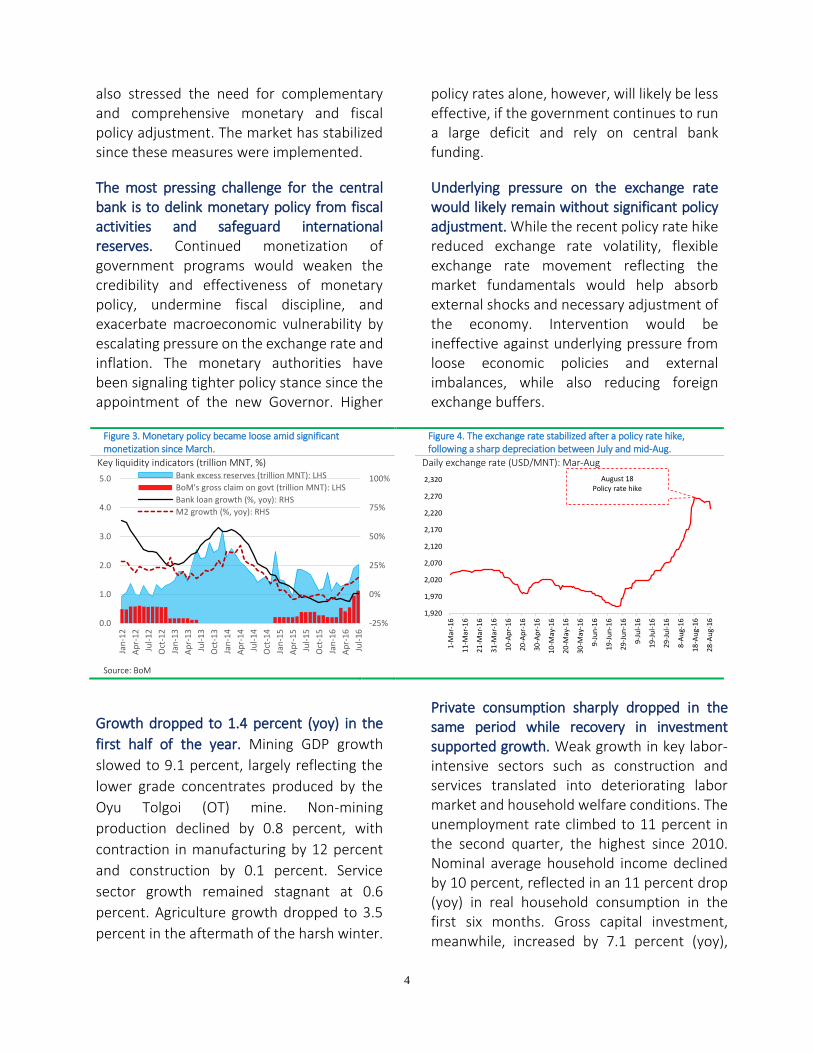
Monetary policy also loosened in recent months. With no government securities auctions held in Apr-Aug, the government relied on the BoM in funding the growing budget deficit. The BoM has provided over MNT 900 billion in Mar-July to the government, most of which was injected to commercial banks for the new Good Programs and the Housing Mortgage Program. As a result, the monetary base and M2 increased by 40 percent and 13 percent, respectively between March and July. Bank loan growth, however, remained subdued at 0.8 percent (yoy) in July, reflecting weak economic conditions. The lack of government bond issuances, the large liquidity injection and slow loan growth have substantially increased excess liquidity in the banking system since March, reflected in a large increase in the central bank bill (CBB) holdings of the banks in July.
Exchange rate volatility increased in July and August. After gradual appreciation in May-June with the influx of a $750 million sovereign borrowing, the togrog depreciated by almost 15 percent against the USD in one and a half months from end-June to mid-August. The recent depreciation largely reflected a $400 million outflow for the purchase of Erdenet mine shares, elevated excess togrog liquidity, and weak market sentiment.
The swift policy rate hike of the BoM helped ease the exchange volatility. Facing the intensified pressure on the exchange rate and signs of currency speculation, the BoM raised the policy rate by 450 bps to 15 percent on August 19. The central bank also announced that it would strengthen togrog liquidity management by introducing a three-month CBB which carries a premium over the current seven-day CBBs. The central bank
3,074 3,328 3,145 3,040 3,186 3,466
3,781
5,014
(112) (138)(638)
(1,974)-3,000
-2,000
-1,000
0
1,000
2,000
3,000
4,000
5,000
6,000
2013 (I-VII) 2014 (I-VII) 2015 (I-VII) 2016 (I-VII)
Revenue Expenditure Fiscal deficit
20
40
60
80
100
120
-25
-20
-15
-10
-5
0
2011 2012 2013 2014 2015 2016f
DBM's corporate loans: LHS DBM's social program: LHS
On-budget deficit: LHS Gov't definition of deficit
General government debt: RHS
4
also stressed the need for complementary and comprehensive monetary and fiscal policy adjustment. The market has stabilized since these measures were implemented.
The most pressing challenge for the central bank is to delink monetary policy from fiscal activities and safeguard international reserves. Continued monetization of government programs would weaken the credibility and effectiveness of monetary policy, undermine fiscal discipline, and exacerbate macroeconomic vulnerability by escalating pressure on the exchange rate and inflation. The monetary authorities have been signaling tighter policy stance since the appointment of the new Governor. Higher
policy rates alone, however, will likely be less effective, if the government continues to run a large deficit and rely on central bank funding.
Underlying pressure on the exchange rate would likely remain without significant policy adjustment. While the recent policy rate hike reduced exchange rate volatility, flexible exchange rate movement reflecting the market fundamentals would help absorb external shocks and necessary adjustment of the economy. Intervention would be ineffective against underlying pressure from loose economic policies and external imbalances, while also reducing foreign exchange buffers.
Figure 3. Monetary policy became loose amid significant monetization since March.
Figure 4. The exchange rate stabilized after a policy rate hike, following a sharp depreciation between July and mid-Aug.
Key liquidity indicators (trillion MNT, %)
Daily exchange rate (USD/MNT): Mar-Aug
Source: BoM
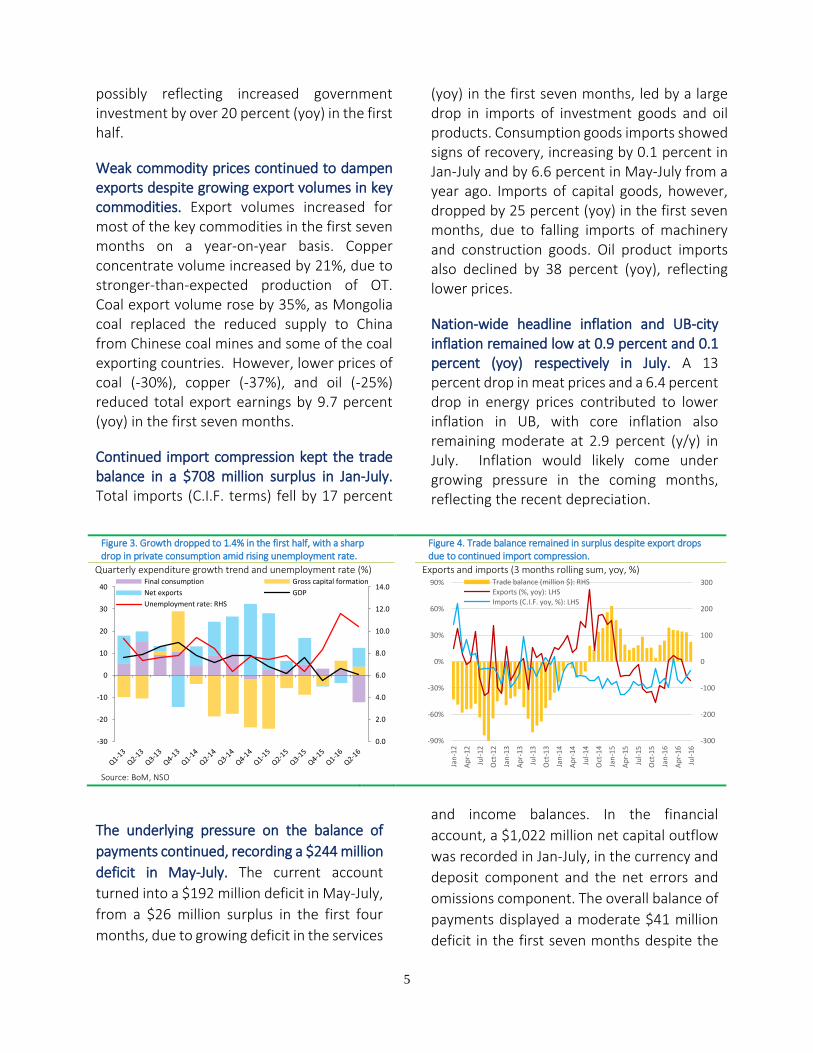
Growth dropped to 1.4 percent (yoy) in the
first half of the year. Mining GDP growth
slowed to 9.1 percent, largely reflecting the
lower grade concentrates produced by the
Oyu Tolgoi (OT) mine. Non-mining
production declined by 0.8 percent, with
contraction in manufacturing by 12 percent
and construction by 0.1 percent. Service
sector growth remained stagnant at 0.6
percent. Agriculture growth dropped to 3.5
percent in the aftermath of the harsh winter.
Private consumption sharply dropped in the same period while recovery in investment supported growth. Weak growth in key labor-intensive sectors such as construction and services translated into deteriorating labor market and household welfare conditions. The unemployment rate climbed to 11 percent in the second quarter, the highest since 2010. Nominal average household income declined by 10 percent, reflected in an 11 percent drop (yoy) in real household consumption in the first six months. Gross capital investment, meanwhile, increased by 7.1 percent (yoy),
-25%
0%
25%
50%
75%
100%
0.0
1.0
2.0
3.0
4.0
5.0
Jan
-12
Ap
r-12
Jul-
12
Oct
-12
Jan
-13
Ap
r-13
Jul-
13
Oct
-13
Jan
-14
Ap
r-14
Jul-
14
Oct
-14
Jan
-15
Ap
r-15
Jul-
15
Oct
-15
Jan
-16
Ap
r-16
Jul-
16
Bank excess reserves (trillion MNT): LHS
BoM's gross claim on govt (trillion MNT): LHS
Bank loan growth (%, yoy): RHS
M2 growth (%, yoy): RHS
1,920
1,970
2,020
2,070
2,120
2,170
2,220
2,270
2,320
1-M
ar-1
6
11-M
ar-1
6
21-M
ar-1
6
31-M
ar-1
6
10-A
pr-
16
20-A
pr-
16
30-A
pr-
16
10-M
ay-1
6
20-M
ay-1
6
30-M
ay-1
6
9-Ju
n-1
6
19-J
un
-16
29-J
un
-16
9-Ju
l-16
19-J
ul-
16
29-J
ul-
16
8-A
ug-
16
18
-Au
g-1
6
28
-Au
g-1
6
August 18Policy rate hike
5
possibly reflecting increased government investment by over 20 percent (yoy) in the first half.
Weak commodity prices continued to dampen exports despite growing export volumes in key commodities. Export volumes increased for most of the key commodities in the first seven months on a year-on-year basis. Copper concentrate volume increased by 21%, due to stronger-than-expected production of OT. Coal export volume rose by 35%, as Mongolia coal replaced the reduced supply to China from Chinese coal mines and some of the coal exporting countries. However, lower prices of coal (-30%), copper (-37%), and oil (-25%) reduced total export earnings by 9.7 percent (yoy) in the first seven months.
Continued import compression kept the trade balance in a $708 million surplus in Jan-July. Total imports (C.I.F. terms) fell by 17 percent
(yoy) in the first seven months, led by a large drop in imports of investment goods and oil products. Consumption goods imports showed signs of recovery, increasing by 0.1 percent in Jan-July and by 6.6 percent in May-July from a year ago. Imports of capital goods, however, dropped by 25 percent (yoy) in the first seven months, due to falling imports of machinery and construction goods. Oil product imports also declined by 38 percent (yoy), reflecting lower prices.
Nation-wide headline inflation and UB-city inflation remained low at 0.9 percent and 0.1 percent (yoy) respectively in July. A 13 percent drop in meat prices and a 6.4 percent drop in energy prices contributed to lower inflation in UB, with core inflation also remaining moderate at 2.9 percent (y/y) in July. Inflation would likely come under growing pressure in the coming months, reflecting the recent depreciation.
Figure 3. Growth dropped to 1.4% in the first half, with a sharp drop in private consumption amid rising unemployment rate.
Figure 4. Trade balance remained in surplus despite export drops due to continued import compression.
Quarterly expenditure growth trend and unemployment rate (%)
Exports and imports (3 months rolling sum, yoy, %)
Source: BoM, NSO
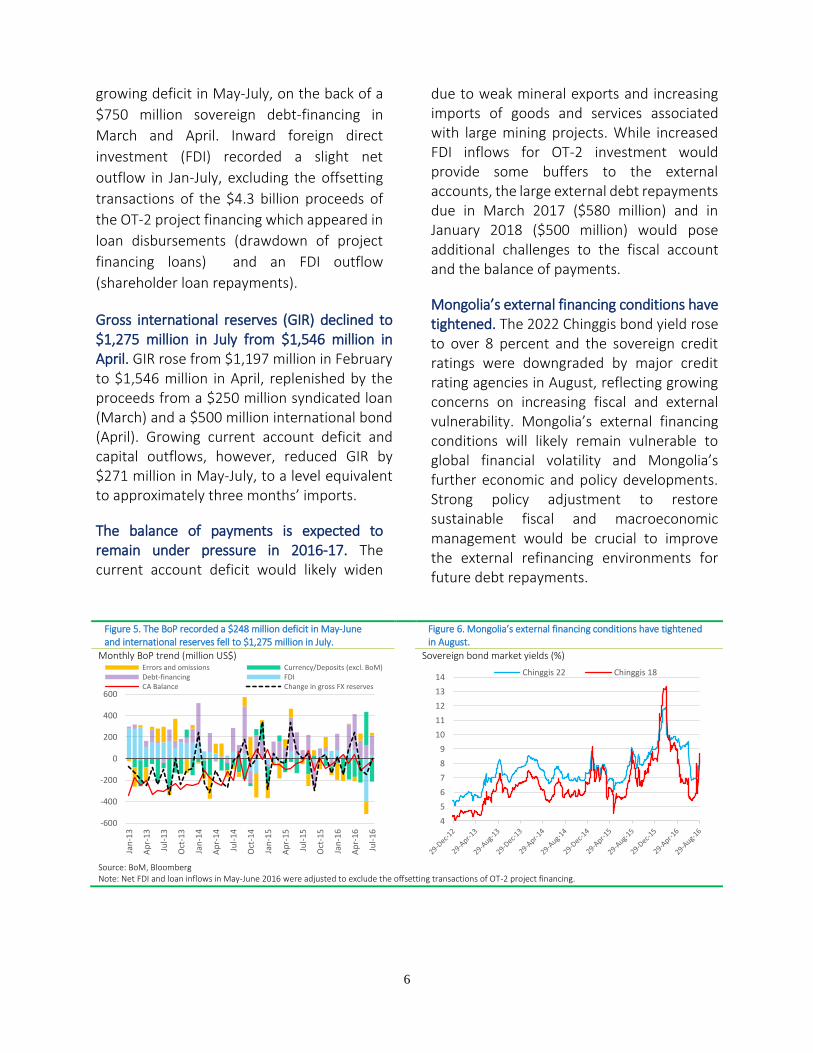
The underlying pressure on the balance of
payments continued, recording a $244 million
deficit in May-July. The current account
turned into a $192 million deficit in May-July,
from a $26 million surplus in the first four
months, due to growing deficit in the services
and income balances. In the financial
account, a $1,022 million net capital outflow
was recorded in Jan-July, in the currency and
deposit component and the net errors and
omissions component. The overall balance of
payments displayed a moderate $41 million
deficit in the first seven months despite the
0.0
2.0
4.0
6.0
8.0
10.0
12.0
14.0
-30
-20
-10
0
10
20
30
40Final consumption Gross capital formation
Net exports GDP
Unemployment rate: RHS
-300
-200
-100
0
100
200
300
-90%
-60%
-30%
0%
30%
60%
90%
Jan
-12
Ap
r-12
Jul-
12
Oct
-12
Jan
-13
Ap
r-13
Jul-
13
Oct
-13
Jan
-14
Ap
r-14
Jul-
14
Oct
-14
Jan
-15
Ap
r-15
Jul-
15
Oct
-15
Jan
-16
Ap
r-16
Jul-
16
Trade balance (million $): RHS
Exports (%, yoy): LHS
Imports (C.I.F. yoy, %): LHS
6
growing deficit in May-July, on the back of a
$750 million sovereign debt-financing in
March and April. Inward foreign direct
investment (FDI) recorded a slight net
outflow in Jan-July, excluding the offsetting
transactions of the $4.3 billion proceeds of
the OT-2 project financing which appeared in
loan disbursements (drawdown of project
financing loans) and an FDI outflow
(shareholder loan repayments).
Gross international reserves (GIR) declined to $1,275 million in July from $1,546 million in April. GIR rose from $1,197 million in February to $1,546 million in April, replenished by the proceeds from a $250 million syndicated loan (March) and a $500 million international bond (April). Growing current account deficit and capital outflows, however, reduced GIR by $271 million in May-July, to a level equivalent to approximately three months’ imports.
The balance of payments is expected to remain under pressure in 2016-17. The current account deficit would likely widen
due to weak mineral exports and increasing imports of goods and services associated with large mining projects. While increased FDI inflows for OT-2 investment would provide some buffers to the external accounts, the large external debt repayments due in March 2017 ($580 million) and in January 2018 ($500 million) would pose additional challenges to the fiscal account and the balance of payments.
Mongolia’s external financing conditions have tightened. The 2022 Chinggis bond yield rose to over 8 percent and the sovereign credit ratings were downgraded by major credit rating agencies in August, reflecting growing concerns on increasing fiscal and external vulnerability. Mongolia’s external financing conditions will likely remain vulnerable to global financial volatility and Mongolia’s further economic and policy developments. Strong policy adjustment to restore sustainable fiscal and macroeconomic management would be crucial to improve the external refinancing environments for future debt repayments.
Figure 5. The BoP recorded a $248 million deficit in May-June and international reserves fell to $1,275 million in July.
Figure 6. Mongolia’s external financing conditions have tightened in August.
Monthly BoP trend (million US$)
Sovereign bond market yields (%)
Source: BoM, Bloomberg Note: Net FDI and loan inflows in May-June 2016 were adjusted to exclude the offsetting transactions of OT-2 project financing.
-600
-400
-200
0
200
400
600
Jan
-13
Ap
r-13
Jul-
13
Oct
-13
Jan
-14
Ap
r-14
Jul-
14
Oct
-14
Jan
-15
Ap
r-15
Jul-
15
Oct
-15
Jan
-16
Ap
r-16
Jul-
16
Errors and omissions Currency/Deposits (excl. BoM)Debt-financing FDICA Balance Change in gross FX reserves
4
5
6
7
8
9
10
11
12
13
14Chinggis 22 Chinggis 18