Mongo db and ruby monitoring 0327
13
© 2013 IBM Corporation Monitoring your cloud based applications running on Ruby and MongoDB IBM Smart Cloud Application Performance Monitoring
-
Upload
sun-kim -
Category
Technology
-
view
84 -
download
4
Transcript of Mongo db and ruby monitoring 0327

© 2013 IBM Corporation
Monitoring your cloud based applications running on Ruby and MongoDB
IBM Smart Cloud Application Performance Monitoring
© 2013 IBM Corporation
Important Notice & Disclaimer
� THE INFORMATION CONTAINED IN THIS PRESENTATION IS PROVIDED FOR INFORMATIONAL PURPOSES ONLY.
� WHILE EFFORTS WERE MADE TO VERIFY THE COMPLETENESS AND ACCURACY OF THE INFORMATION CONTAINED IN THIS
PRESENTATION, IT IS PROVIDED “AS IS”, WITHOUT WARRANTY OF ANY KIND, EXPRESS OR IMPLIED.
� IN ADDITION, THIS INFORMATION IS BASED ON IBM’S CURRENT PRODUCT PLANS AND STRATEGY, WHICH ARE SUBJECT TO CHANGE
BY IBM WITHOUT NOTICE.
� IBM SHALL NOT BE RESPONSIBLE FOR ANY DAMAGES ARISING OUT OF THE USE OF, OR OTHERWISE RELATED TO, THIS
PRESENTATION OR ANY OTHER DOCUMENTATION.
� NOTHING CONTAINED IN THIS PRESENTATION IS INTENDED TO, OR SHALL HAVE THE EFFECT OF:
– CREATING ANY WARRANTY OR REPRESENTATION FROM IBM (OR ITS AFFILIATES OR ITS OR THEIR SUPPLIERS AND/OR
LICENSORS); OR
– ALTERING THE TERMS AND CONDITIONS OF THE APPLICABLE LICENSE AGREEMENT GOVERNING THE USE OF IBM SOFTWARE.
© 2013 IBM Corporation
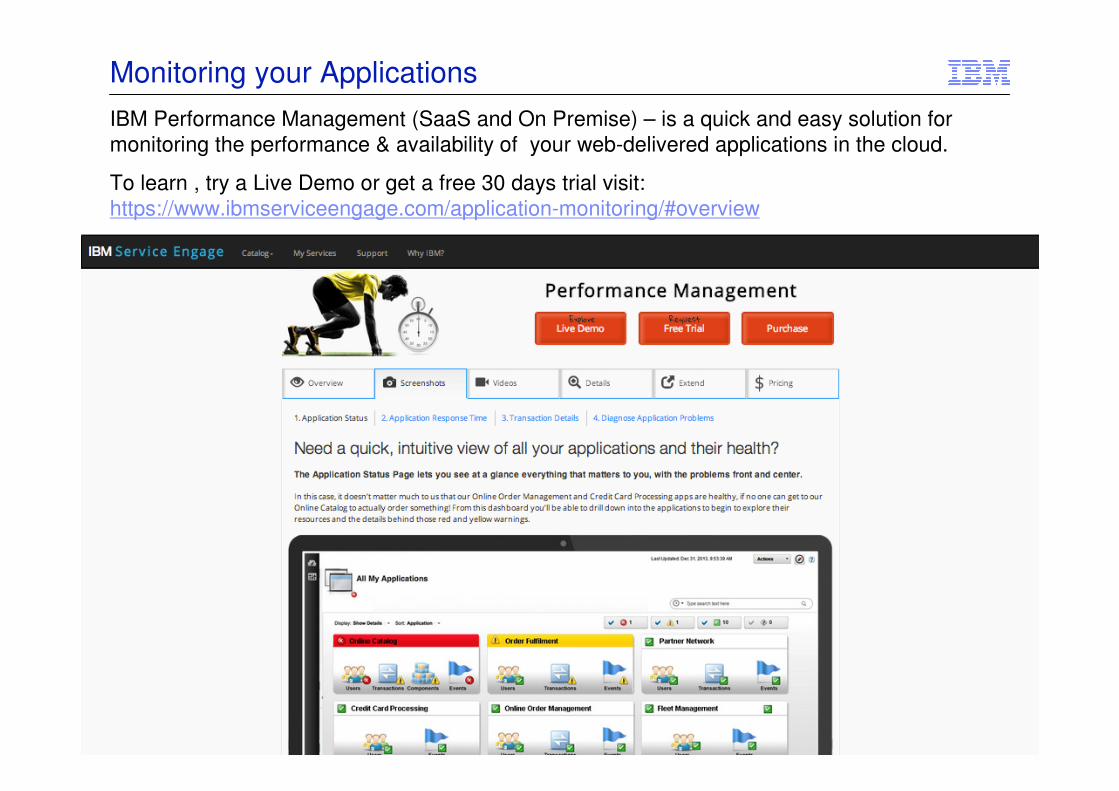
Monitoring your Applications
IBM Performance Management (SaaS and On Premise) – is a quick and easy solution for
monitoring the performance & availability of your web-delivered applications in the cloud.
To learn , try a Live Demo or get a free 30 days trial visit:
https://www.ibmserviceengage.com/application-monitoring/#overview
© 2013 IBM Corporation
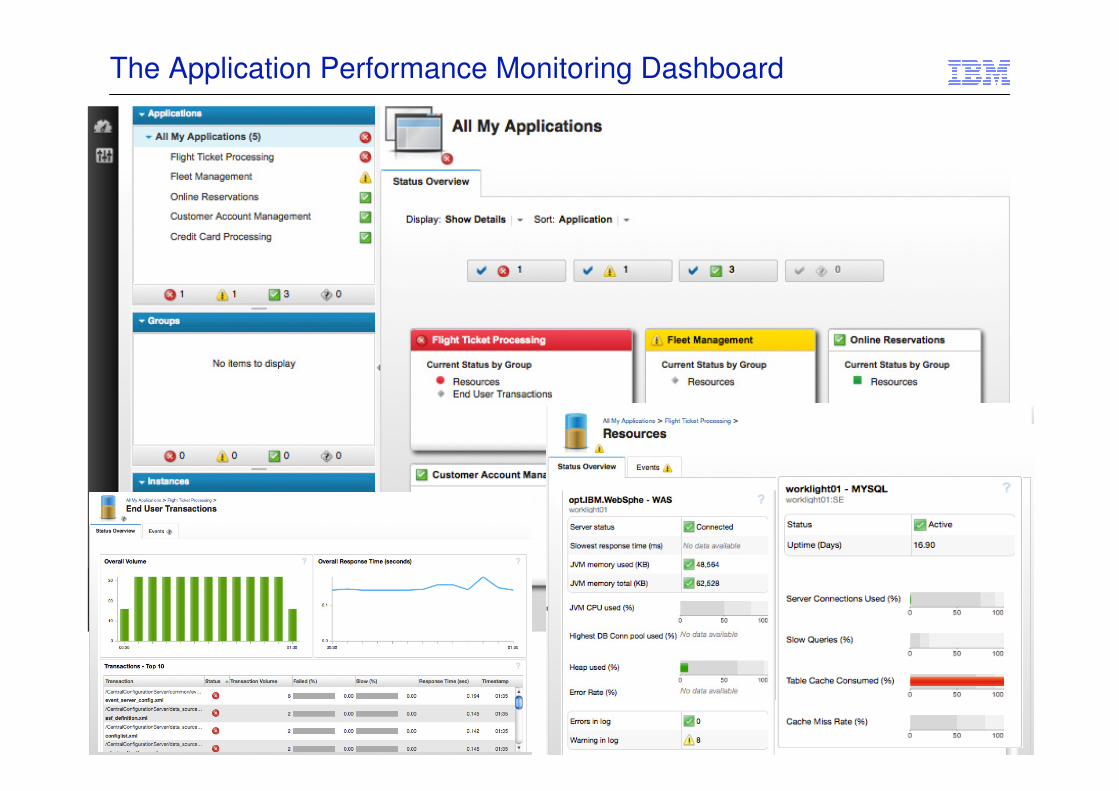
The Application Performance Monitoring Dashboard
© 2013 IBM Corporation
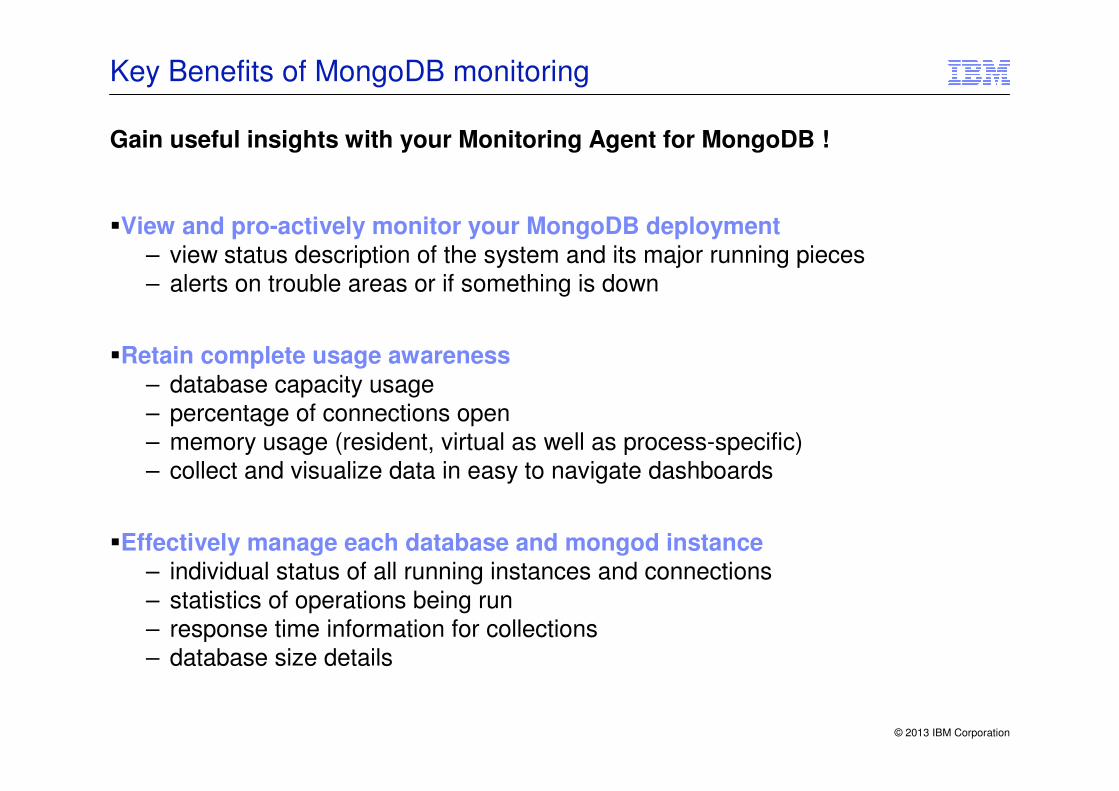
Key Benefits of MongoDB monitoring
Gain useful insights with your Monitoring Agent for MongoDB !
�View and pro-actively monitor your MongoDB deployment
– view status description of the system and its major running pieces
– alerts on trouble areas or if something is down
�Retain complete usage awareness
– database capacity usage
– percentage of connections open – memory usage (resident, virtual as well as process-specific)
– collect and visualize data in easy to navigate dashboards
�Effectively manage each database and mongod instance
– individual status of all running instances and connections
– statistics of operations being run– response time information for collections
– database size details
© 2013 IBM Corporation
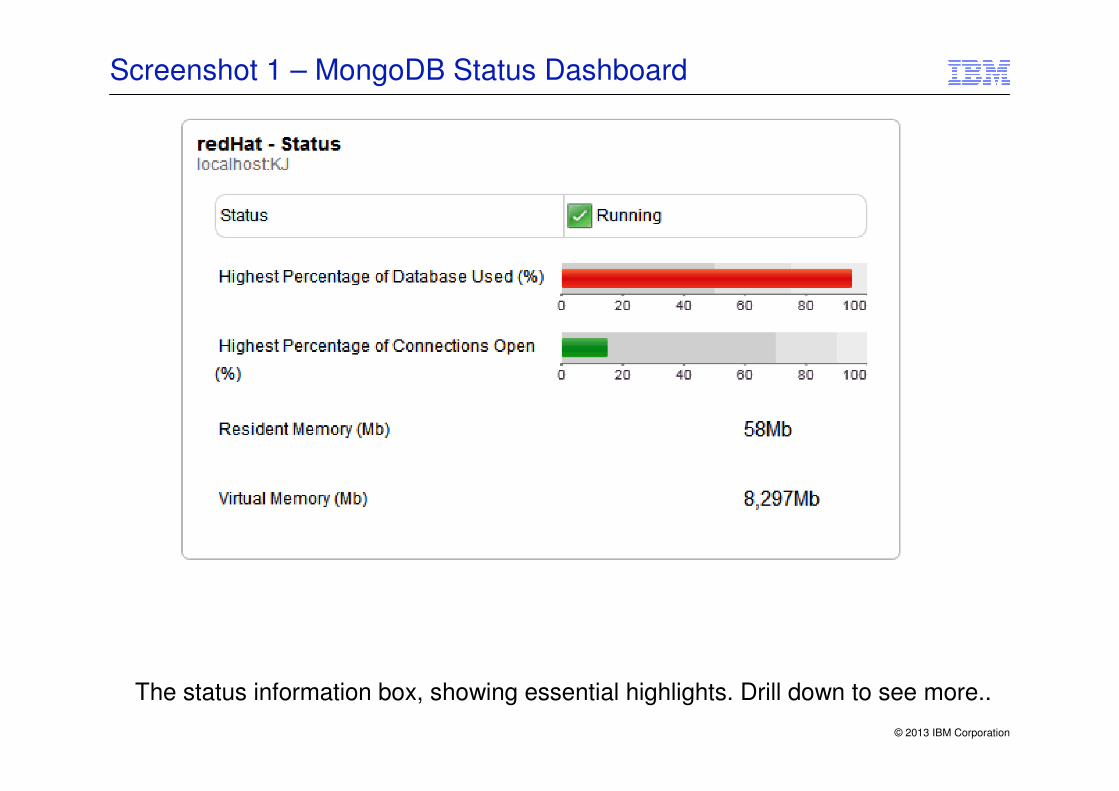
Screenshot 1 – MongoDB Status Dashboard
The status information box, showing essential highlights. Drill down to see more..
© 2013 IBM Corporation
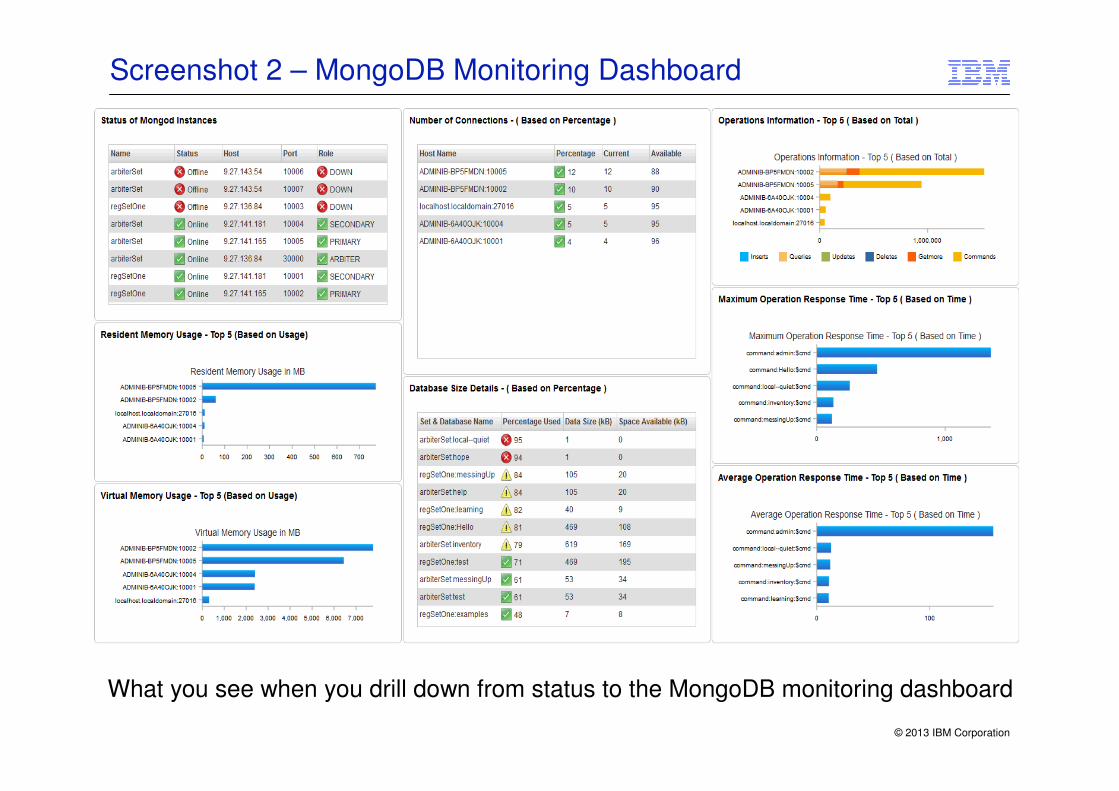
Screenshot 2 – MongoDB Monitoring Dashboard
What you see when you drill down from status to the MongoDB monitoring dashboard
© 2013 IBM Corporation
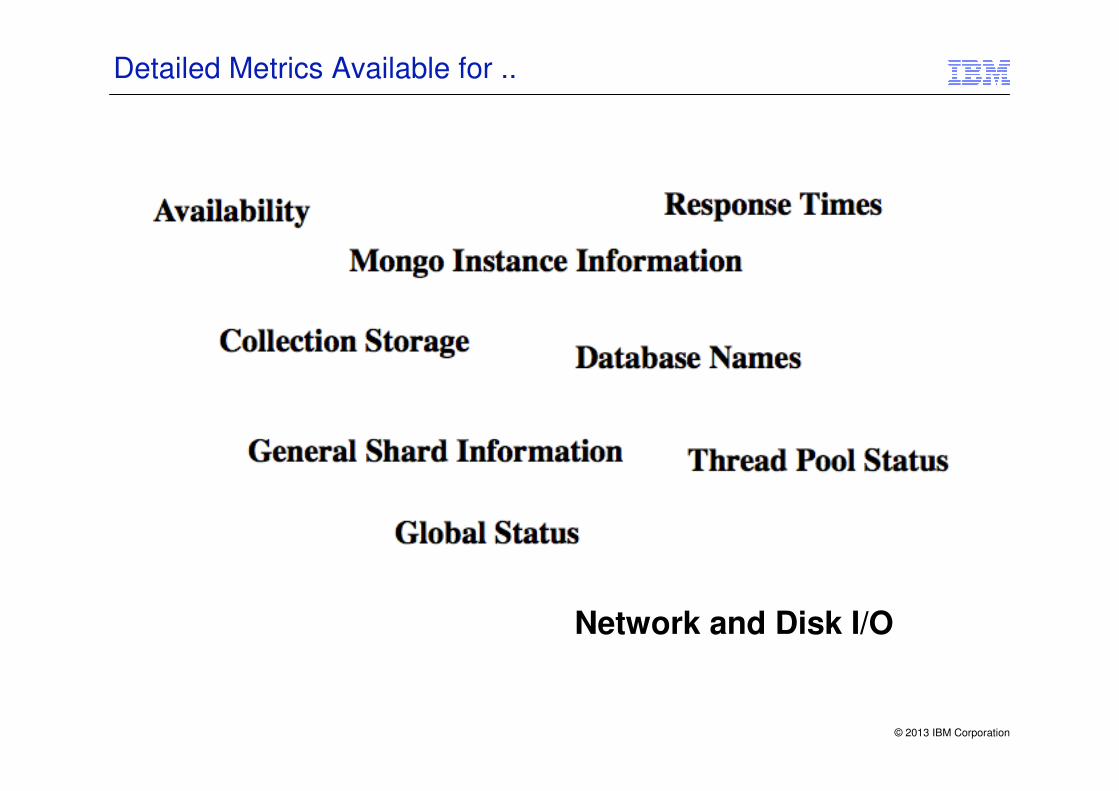
Detailed Metrics Available for ..
Network and Disk I/O
© 2013 IBM Corporation
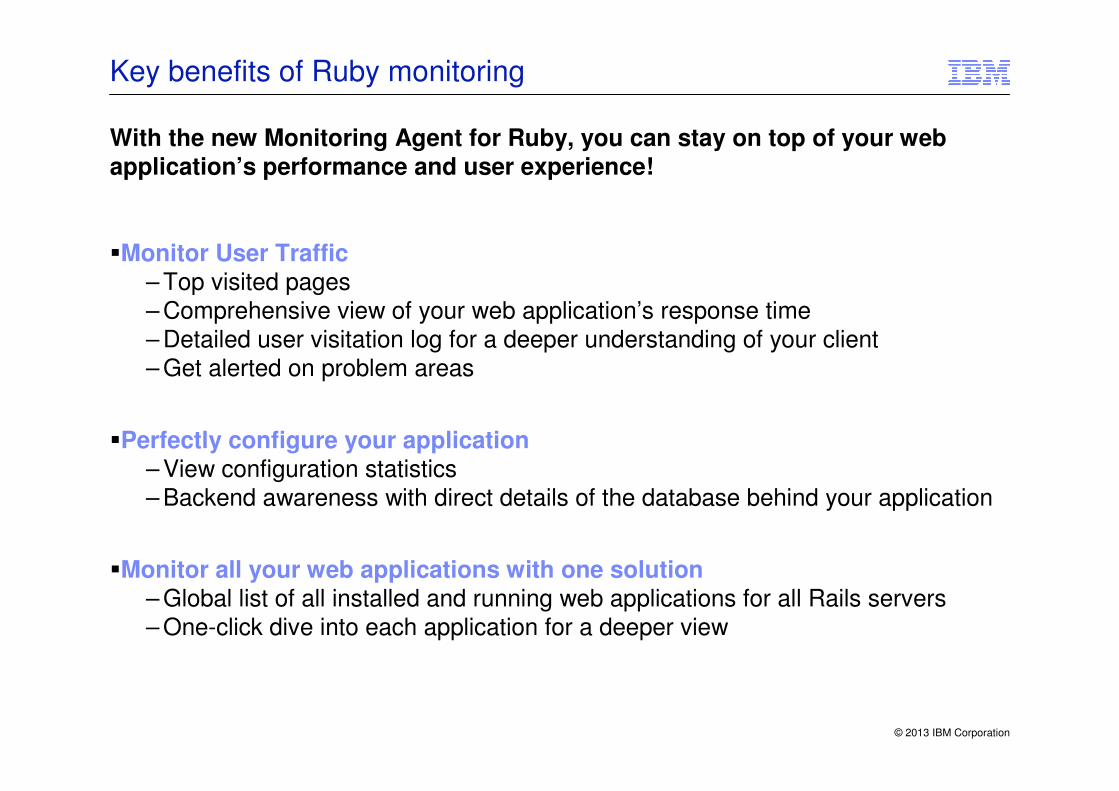
Key benefits of Ruby monitoring
With the new Monitoring Agent for Ruby, you can stay on top of your web application’s performance and user experience!
�Monitor User Traffic– Top visited pages– Comprehensive view of your web application’s response time – Detailed user visitation log for a deeper understanding of your client
– Get alerted on problem areas
�Perfectly configure your application
– View configuration statistics
– Backend awareness with direct details of the database behind your application
�Monitor all your web applications with one solution
– Global list of all installed and running web applications for all Rails servers– One-click dive into each application for a deeper view
© 2013 IBM Corporation
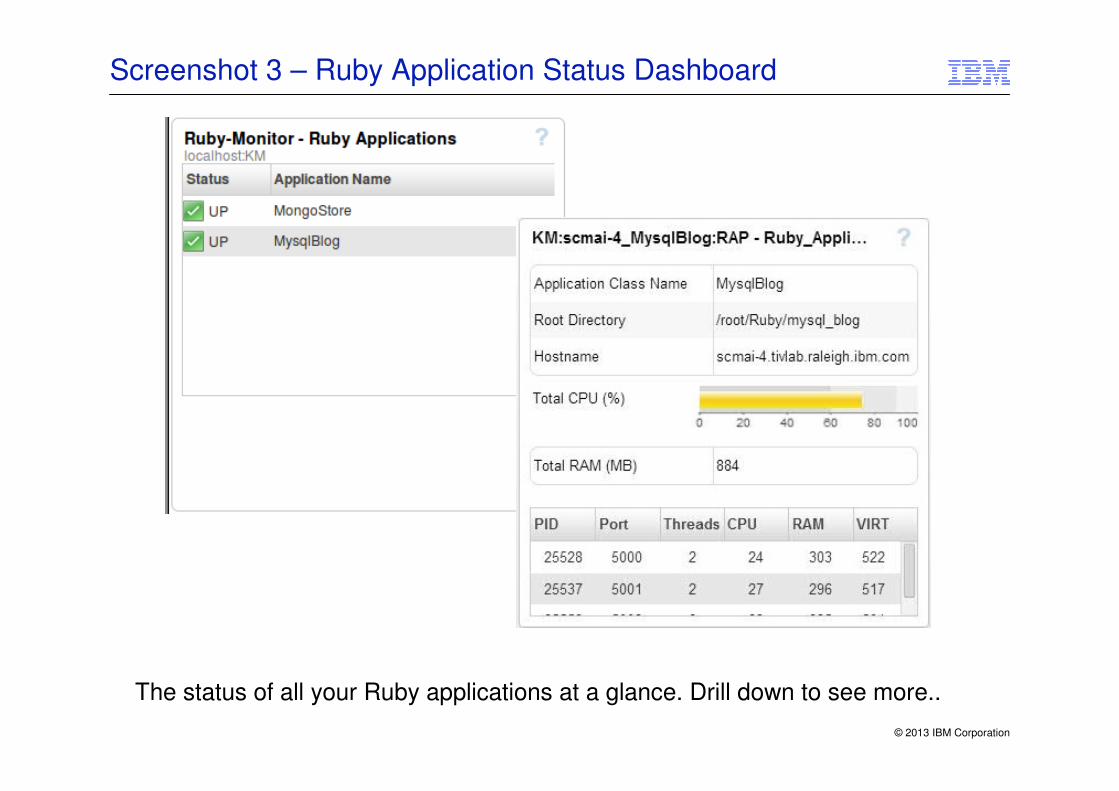
Screenshot 3 – Ruby Application Status Dashboard
The status of all your Ruby applications at a glance. Drill down to see more..
© 2013 IBM Corporation
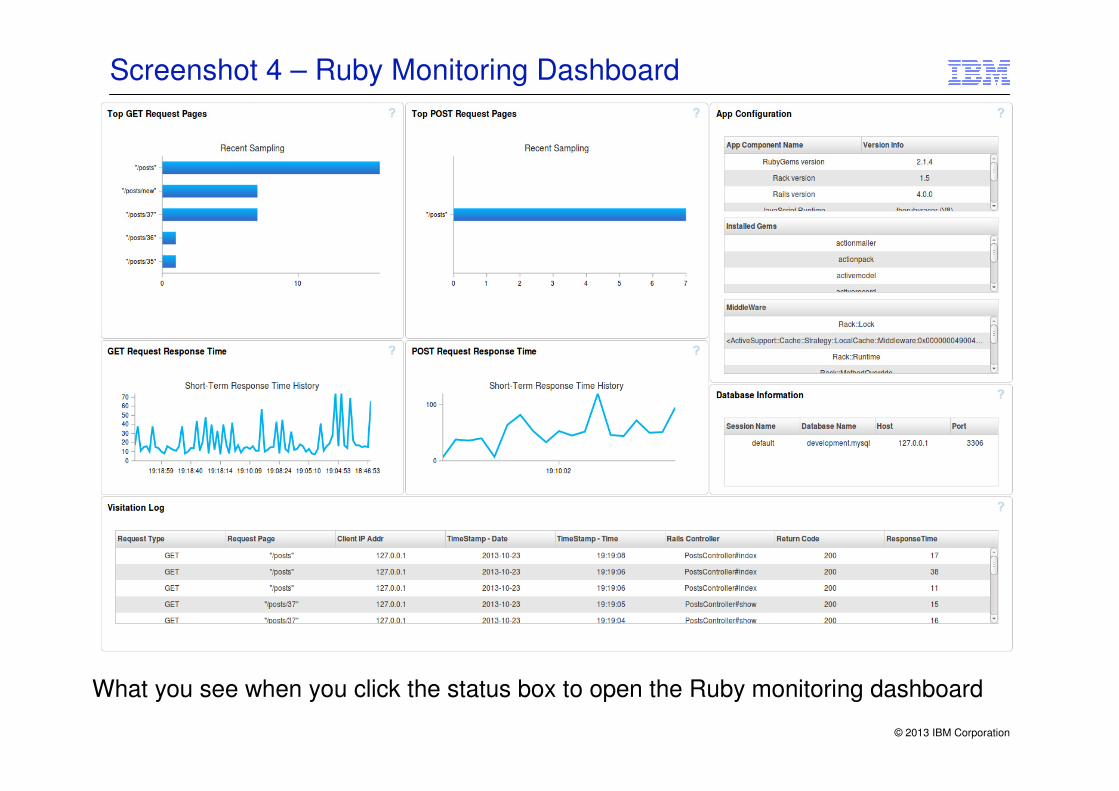
Screenshot 4 – Ruby Monitoring Dashboard
What you see when you click the status box to open the Ruby monitoring dashboard
© 2013 IBM Corporation
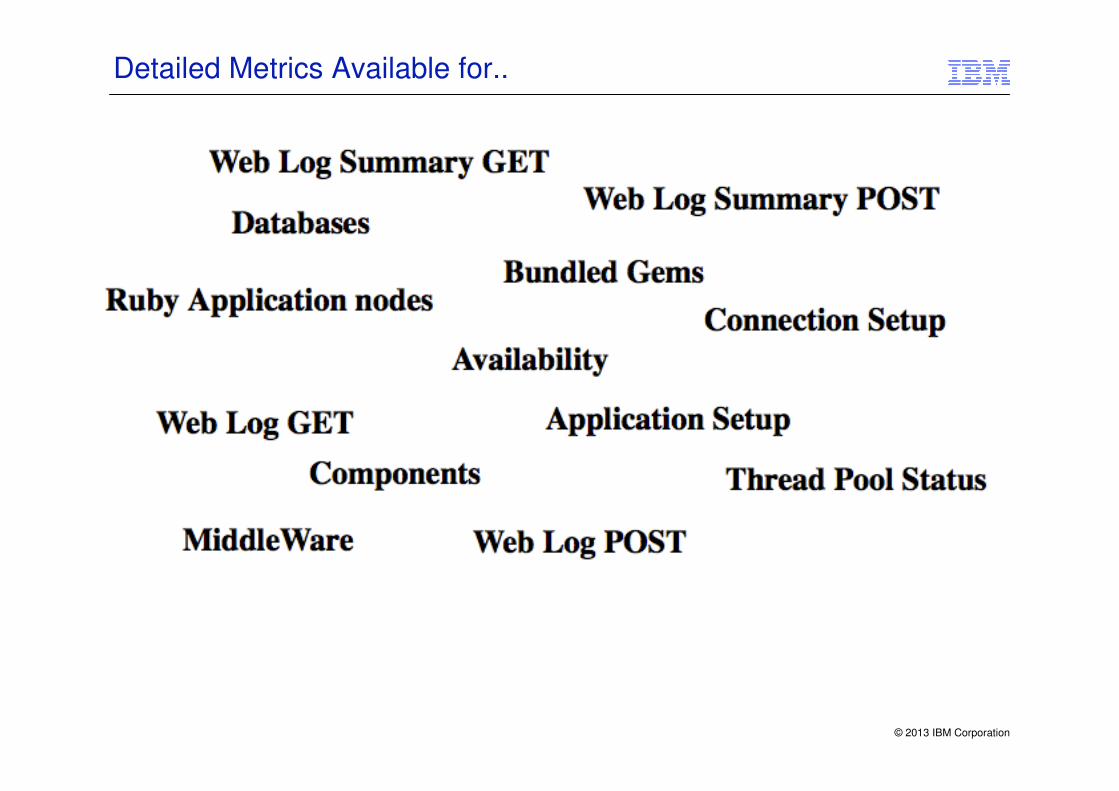
Detailed Metrics Available for..

© 2013 IBM Corporation
Coming Soon.. Updated views, metrics and deep dive diagnostics on Ruby