MONEY MATTERS: AN INVESTIGATOIN OF THE EFFECTS OF PAY …
80
MONEY MATTERS: AN INVESTIGATOIN OF THE EFFECTS OF PAY-TO-PLAY SYSTEMS ON YOUTH SOCCER DIVERSITY by Brandon Hartman A Thesis Submitted to the Graduate Faculty of George Mason University in Partial Fulfillment of The Requirements for the Degree of Master of Science Sport and Recreation Studies Committee: ___________________________________________ Chair ___________________________________________ ___________________________________________ ___________________________________________ Academic Program Coordinator ___________________________________________ Academic Program Coordinator ___________________________________________ Dean, College of Education and Human Development Date: _____________________________________ Fall Semester 2017 George Mason University Fairfax, Virginia
Transcript of MONEY MATTERS: AN INVESTIGATOIN OF THE EFFECTS OF PAY …

MONEY MATTERS: AN INVESTIGATOIN OF THE EFFECTS OF PAY-TO-PLAY
SYSTEMS ON YOUTH SOCCER DIVERSITY
by
Brandon Hartman
A Thesis
Submitted to the
Graduate Faculty
of
George Mason University
in Partial Fulfillment of
The Requirements for the Degree
of
Master of Science
Sport and Recreation Studies
Committee:
___________________________________________ Chair
___________________________________________
___________________________________________
___________________________________________ Academic Program Coordinator
___________________________________________ Academic Program Coordinator
___________________________________________ Dean, College of Education
and Human Development
Date: _____________________________________ Fall Semester 2017
George Mason University
Fairfax, Virginia
Money Matters: An Investigation of the Effects of Pay-To-Play Systems on Youth Soccer
Diversity
A Thesis submitted in partial fulfillment of the requirements for the degree of Masters of
Science at George Mason University
by
Brandon Hartman
Bachelor of Arts
Virginia Military Institute, 2015
Director: Jacqueline McDowell, Assistant Professor
School of Recreation, Health, and Tourism
College of Education and Human Development
Fall Semester 2017
George Mason University
Fairfax, VA

ii
Copyright 2017 Brandon Hartman
All Rights Reserved
iii
ACKNOWLEDGEMENTS
I would like to thank the many friends, relatives, and supporters who have made this
happen. I talked with a number of coaches as I was doing my research and could see just
how passionate each one was about soccer and helping the kids they coach. Thanks have
to be given to the club I worked with, and particularly their Director of Soccer, for
providing data and being the focus of this project. He was very interested in finding out
more about the racial makeup of his club and how fees affected participation. I also
would like to thank my girlfriend Heather for her great ideas and help. I would also like
to thank my committee members Dr. Wiggins and Dr. Lee for pushing me and providing
thoughtful feedback and advice. Most importantly, thanks to the head of my committee,
Dr. McDowell, for helping guide my research and all the invaluable help she provided.
iii
TABLE OF CONTENTS
Page
LIST OF TABLES……………………………………......................................................iv
ABSTRACT………………………………………………………………………………. v
CHAPTER ONE: INTRODUCTION 1
Purpose of the Study ......................................................................................................... 4
Research Questions ........................................................................................................... 5
Significance of the Study .................................................................................................. 6
CHAPTER TWO: LITERATURE REVIEW 9
The benefits and importance of youth sports .................................................................... 9
What is Pay-to-Play ......................................................................................................... 12
Social Stratification ......................................................................................................... 15
Impact of SES on Youth Sport Participation .................................................................. 17
The effects of costs and fees on racial demographics in Soccer Participation ................ 21
CHAPTER THREE: METHODS 27
Research Design .............................................................................................................. 27
Population and Sample .................................................................................................... 28
Data collection................................................................................................................. 29
Data Analysis .................................................................................................................. 31
CHAPTER FOUR: RESULTS 33
Qualitative study ............................................................................................................. 37
Income’s impact on participation ................................................................................ 37
Pay-to-play and racial diversity ................................................................................... 40
Experiences in pay-to-play .......................................................................................... 42
The scholarship system ................................................................................................ 43
Potential strategies/solutions ....................................................................................... 44
CHAPTER FIVE: DISCUSSION AND CONCLUSION 48
Potential solutions ........................................................................................................... 53
Strengths, limitations, and future research ...................................................................... 56
Conclusion ....................................................................................................................... 57
APPENDIX A…………………………………………………………………………… 59
REFERENCES………………………………………………………………………….. 60
iv
LIST OF TABLES
Table Page
1. Coaches Demographics……………………………………………….. 27
2. The gender and racial makeup of NCSL travel soccer players at a soccer club in
Fairfax…………………………………………………………………………...33
3. The total number of travel soccer players of each gender and race per zip code at
the Fairfax……………………………………………………………….34

v
ABSTRACT
MONEY MATTERS: AN INVESTIGATION OF THE EFFECTS OF PAY-TO-PAY
SYSTEMS ON YOUTH SOCCER DIVERSITY
Brandon Hartman, MS
George Mason University, 2017
Project Director: Dr. Jacqueline McDowell
The fees of U.S Youth Soccer’s pay-to-play system impact the racial and socio-economic
diversity of its travel soccer participants. Many deserving players are unable to afford the
cost of competitive travel soccer and thus miss out on playing at the highest level of the
sport and receiving benefits such as physical fitness, motor skills, etc. This study uses
demographic data from a club in Fairfax County, Virginia and the interviews of six
professional soccer coaches from Northern Virginia in a concurrent mixed method
approach to determine the impact that costly fees have on diversity. It is found that
money does indeed matter, as there is a low level of diversity at the club and there is a
large amount of players come from higher income areas. Potential solutions are also
discussed by the coaches, as well as their experiences and thoughts on the pay-to-play
system, as the conversation on fixing the diversity problem in youth soccer is begun.

1
CHAPTER ONE: INTRODUCTION
Many fans of U.S. Soccer do not realize how close the US Men’s National team
was to never having Clint Dempsey, the country’s all-time leading goal scorer with 57
goals and counting, wear the red, white, and blue of the national team or even kick a
soccer ball as a professional player. Growing up in Nacogdoches, Texas, Dempsey lived
with his parents and four siblings in a small trailer park, often playing soccer on dirt
fields with the local Hispanic population while using T-shirts and rolled up socks as the
outline for goals (Drehs, 2006). At ten years old he was scouted by a local travel team
and selected to play and train in Dallas three hours away, but by the age of 12 the
Dempsey family found that the costs, fees, and constant traveling of travel soccer were
too much to bare by a family struggling to get by financially. They made the heart
breaking decision to abandon young Dempsey’s dream of playing professional soccer so
that they could put the time and resources into Clint’s older sister Jennifer, an up and
coming star tennis player (Drehs, 2006). Because of the high costs and fees of
competitive travel soccer in the United States, Clint Dempsey almost vanished from the
system like so many players from low income families often do. However, it took the
horrible tragedy of his sister’s death in order for his parents to be able to commit the time
2
and resources once again into Clint’s soccer career and restart the struggle of finding the
money for travel and expenses (Drehs, 2006).
In numerous countries around the world, outstanding professional soccer players
often come from poverty stricken backgrounds. Portuguese star Cristiano Ronaldo grew
up in a low income household in Madeira, Portugal before signing with a professional
Portuguese club who paid for his training and development (Oldfield, 2008, p. 41). The
Arsenal Football Club’s star midfielder Alexis Sanchez grew up in a poor mining town in
Chile and performed acrobatics with his brothers in the street to make extra money
(Waugh, 2014). Uruguayan star Luis Suarez played many years without shoes in the
streets of Salto, Uruguay before his soccer playing abilities gave a club in Montevideo
reason to invest in the player at a young age (Kay, 2012). There are numerous other
examples of soccer players from around the world with low income backgrounds that
have been able to transcend their poverty stricken backgrounds after being given
opportunities to play with youth teams sponsored by professional clubs. Often local,
many professional clubs in Europe and, sometimes South America, have the money to
invest in their youth soccer clubs so that young players do not have to pay to play soccer
(Sokalove, 2010).
Clint Dempsey’s rise to prominence as a professional player is not the norm in
soccer in the United States, or in any high cost sport for that matter. A study by Bennett
and Kaplan (2013) that collected socio-economic data from the hometown zip codes of
every US men’s national team player between 1993 to 2013, as well as data from every

3
NBA all-star and NFL Pro Bowler from the same time period, found that soccer players
tend to come from higher income, education, and employment backgrounds then
basketball and football players, who tend to come from places that ranked lower than the
averages in those same categories (p. 15). There were also found to be more White
Soccer players than the average number of Whites in the US, which is not surprising
when you consider the lack of diversity on the United States men’s team roster. In the
past 10 years, the U.S. Men’s team has had just 15 Black and 12 Hispanic players (who
were produced in the United States and by US Soccer) out of a total of 120 players on its
roster. It should also be noted that there are a number of non-White players (11 Black, 4
Hispanic) on the US National Team who grew up overseas and participated in other
countries’ youth soccer programs. Why is it that a sport that requires nothing but a ball to
play is leaving players of lower socio economic statuses behind, and a country full of so
many different types of people and cultures is lacking that diversity on the National
team?
The answers to these questions potentially stem from the current pay-to-play
system in US Youth soccer. According to Oxford Dictionaries (2016), pay-to-play is
defined as “relating to or denoting an arrangement in which a charge must be paid to play
a game or sport.” In other words, opposite of the way clubs in Europe handle their youth
teams, parents in the US pay a club or organization for their kids to be able to train and
play games on an organized soccer team. This is generally the rule of thumb for most
sports in the US, but with very different costs associated with each one. Depending on the
4
costs and fees of specific sporting leagues and teams, children from families with higher
incomes have more opportunities to engage in activities that are not free or community
sponsored, while children from families with lower incomes typically rely on free or low-
cost programs offered through the community or to only participate in sports in public
schools (Ross, 2000).
Purpose of the Study
The purpose of this study is to take an in depth look at a soccer club in Fairfax
County, Virginia to determine the total costs required for a player to participate at the
travel club level of soccer and ascertain the effect that the total cost has on racial and
socio economic diversity. Organized sports are especially useful to minority youths due
to the role they play in “fitting in” to American culture and feeling more socially
accepted (Chan, 1999, Research on Minorities). Youth soccer in the United States is
offered in the form of recreation (lowest and cheapest form), travel (higher team fees and
paid coaching), academies (for select players), and middle and high school. Only
competitive travel teams, academies, and ODP (Olympic Development Program)
programs have high costs associated with them, and for this research, I will focus on
travel teams since they are much less selective then Academies and ODP (as only the best
of the best and a select few play for them).
There are a number of different travel teams in each state for kids to play on, with
parents generally choosing a club based on location, talent level, or price. The total cost
takes to play on travel teams is determined by a lot of factors, including league and

5
coaching fees, training and facility costs, tournaments, jersey costs, travel expenses,
indoor training; as well as other costs outside of a team budget such as gas, lodging, and
maybe individual training outside of the team that a player might need as recommended
by their coach. Parents generally pay thousands of dollars a year for their kids to play
travel soccer (Woitalla, 2015). Often times the base registration fees do not include
expenses such as tournaments, uniforms, and coaches’ travel and equipment expenses, as
well as gas and travel.
Few studies have been done that analyze the economic strain of high level soccer,
and even fewer have been had access to club specific data provided from the clubs
themselves. This study documents the costs of travel soccer for a club in Fairfax and
examines the racial and socio economic makeup of participants. The socio economic
status and population of the surrounding area is analyzed as well in order to understand
the community and the type of people playing travel soccer for the club. Soccer coaches
and program directors from Northern Virginia will also be interviewed about the pay-to-
play structure of US Soccer and their experiences working with low income families and
minorities within that structure.
Research Questions
1) Do the costs of competitive travel soccer fees in the U.S. Youth Soccer’s pay-to-
play financial model impact diversity and opportunity?
2) What are the ways U.S. Youth Soccer clubs offer assistance to help children from
lower income families afford the participation costs?
6
3) What are some potential strategies to lower or eliminate US Youth Soccer
participation fees?
Significance of the Study
This study creates a better picture of how many families are near their choke point
(point that paying becomes too much) with travel soccer expenses and whether or not a
lack of racial or socio economic diversity exists in the club according to the information
and data gathered from the Fairfax soccer club and the professional coaches and directors
interviewed. In what should always be a level playing field, the disproportionate
participation rates of minorities in many youth sports has much more of an impact than
just on the demographics of athletes that break into the professional ranks (Leeds, 2003,
pp. 5-7). Sports participation is beneficial for both the physical and social/psychological
development of all young people, as it is an avenue of fostering vigorous physical activity
and energy expenditure, as well as a venue for promoting responsible behaviors and
learning key social skills such as leadership, teamwork, and inter-personal skills (Mertel,
2013, Positive Impact). While missing out on learning and developing gross motor skills
on the playing fields of youth sports due to costs and fees, many youth from low income
backgrounds will also miss out on the positive correlation between high levels of physical
activity and improved academic achievement, decreased risk of heart disease and
diabetes, improved weight control, and less psychological dysfunction, as reported by the
Centers for Disease Control in 2010 (Mertel, 2013, Positive Impact). When the
relationship between participation in sport, extracurricular activities, and social well-

7
being were examined, students who engaged in sport demonstrated more psychosocial
benefits compared with those who were active in after-school programs not related to
sport (Mertel, 2013, Positive Impact).
Due to social class being a factor that moderates the relationship between
race/ethnicity and physical activity, living in low SES neighborhoods often leads to
greater inactivity among minorities, with access to organized sport programs and
facilities often being limited. Children living in low-income neighborhoods are 20 to 60
percent more likely to be obese or overweight than children living in high socioeconomic
status neighborhoods and healthier built environments, and Children living below the
federal household poverty level have an obesity rate 2.7 times higher (27.4 percent) than
children living in households exceeding 400 percent of the federal poverty level (Mertel,
2013, Introduction). This greater likelihood leads to greater chances of obesity and
sedentary lifestyles, which often leads to diminished quality of life, decreased self-
confidence, and social discrimination (Mertel, 2013, Positive Impact). Organized sports
have been shown to assist in breaking the vicious cycle of inactivity and unhealthy
lifestyles by improving caloric expenditure, increasing time spent away from
entertainment media, and minimizing unnecessary snacking.
Many of the world’s greatest soccer players of all time come from the dirt fields
and poverty-like conditions, yet in the United States our professionals come from
families that can afford to spend thousands of dollars a year on soccer clubs to get their
children to higher levels of play. Players of lower economic statuses, often times from
8
African American and Latino communities, often vanish from the sport after not being
able to keep up with soccer’s race for their checkbooks. Doug Andreassen, the chairman
of US Soccer’s diversity task force, once noted in an article titled “It’s Only Working for
White Kids”:
People don’t want to talk about it. The system is not working for the underserved
community. It’s working for the white kids. How come soccer can’t be more like
basketball in America? How have our national soccer teams not found a way to
exploit what should be a huge pool of talent? We used to say to ourselves: ‘How
good would we be if we could just get the kids in the cities (Carpenter, 2016,
para. 4).
9
CHAPTER TWO: LITERATURE REVIEW
This section speaks to the importance of youth sports and shows the significance
of what is lost when opportunity for participation is not equal. Facts about youth sports
participation and the sports industry are discussed, and an over view of the fees of US
Youth Soccer and a lack of access for low income families will then follow. Finally, the
studies and statistics previously done on the relationship between the high costs of US
Youth Soccer and SES will be discussed.
The benefits and importance of youth sports
For much of the twentieth century, participation in leisure was considered more of
a luxury than a necessary expense (Bittman, 2002, pp. 408-415). Some fundamental
changes have occurred over the years however, with the interest in sport evolving
significantly over the past few decades and coming to occupy a more central position in
society (Shilling & Mellor, 2000, p. 25).It is generally accepted that sports and regular
exercise are known to be beneficial for “reducing the risk of development of a number of
diseases, having a beneficial effect on childhood obesity, helping adolescents remain
lighter and have less subcutaneous fat, and helping in regulating well-being and
relaxation” (Matheson, 1997, pp. 265-269). As well as health benefits, sport
10
participation offers a sense of “individual mastery and modernity” (Brinkoff, 1995, pp.
281-287) and tends to allow adolescents to “fare better academically, attain higher
interpersonal skills, and be more team-oriented” (Poinsett, 1996, p. 57). More specifically
in terms of academics, youth sports participation broadly improves a number of
educational outcomes such as “achievement, retention, commitment, engagement, and
academic self-concept, as well as decreases the likelihood of dropping out of school”
(Broh, 2002, p. 69).
Sports lead to fitness and health, social and physical confidence, greater self-
esteem, and moral development (Ewing & Seefeldt, 2002, p. 39). Through growth in
these areas, participation in youth sports allows for potential benefits in physical health,
psycho-social development, and motor skills acquisition; all of which are important
aspects of youth development (Fraser-Thomas & Cote, 2007). A growing body of
literature has documented the benefits of after-school recreational sports programs, with a
number of studies finding that youth involvement in sports can instill confidence,
promote positive values, and improve academic, social, and physical skills (Mahoney,
Lord, & Carryl, 2005, pp. 811-825). Physical activity was shown to activate the brain as
well. After children went on a 20-minute walk in a 2014 study, the amount of neuro-
electric activity in their brains were shown the highest following MRI scans. (Hillman,
2014).
Though sport participation is beneficial no matter the gender, race, or ethnicity of
an adolescent; participation for minority adolescents may play more of a role in

11
comparison to their White counterparts. Adolescence is a stage when the formation of
individuality and self-identity occurs (Phinney, Madden, & Santos, 1998, pp. 937-945).
Sports may be an avenue that allow minority youth to feel more socially accepted and
have an easier time fitting in as they deal with the stigmatizing characteristics for ethnic
minority and immigrant groups; such as “skin color, language differences, distinguishing
physical features, and any other salient traits or cultural behaviors that distinguish that
group from the majority group” (p. 943). These stigmas are all primarily negative,
leaving minorities at a greater risk of depression and anxiety, as well as experiencing
feelings of inadequacy and having lower self-esteem (Verkuyten, 1990 pp. 285-291).
With personal identity and social group identification such a major factor in
adolescence, sports can be important in enhancing self esteem of minority youth and
giving them a chance to feel more accepted and socially integrated (Poinsett, 1996, p.
67). Having these feelings of social acceptance and greater self worth are factors that can
lead to greater success in areas such as academics and the professional job environment
(Weiss and Duncan, 1992, pp. 177-191). Studies have also shown that racial and ethnic
minority students who participate in sports tend to see improvements in their “self-
esteem, grades, test scores, and educational retention” (Marsh & Kleitman, 2003, pp.
205-214). Research has shown that living in poverty (which minorities have a far greater
chance of doing) leads to a lack of education, fitness, and a better chance of violence and
substance abuse (Dryfoos, 1990, p. 42). The category of adolescents ‘at risk’ has come to
be associated with the “implications of social class and the combination of familial,
12
institutional and social influences” (p. 48). The National Center for Children in Poverty
reported in 2010 that 44% of children under the age of 18 live in low-income families
(NCCP, 2010, para. 1).
Sports have often been cited as the medium that provides contact between
wayward youth and influential individuals such as coaches, teammates, and parents.
After-school programs have been found to decrease delinquency and the negative effects
of low socioeconomic status, discrimination, and neighborhood crime (Hartmann, 2001,
pp. 339-371). These after-school sports programs have also been found to be “a means of
fostering positive social, psychological, and physical development in minority children”
(Witt & Crompton, 1997, p. 55). Steiner, McQuivey, Pavelski, Pitts, and Kraemer (2000)
found that adolescents who participated in sports reported fewer mental, general health,
eating, and dietary problems than those not participating in sports. The challenges and
risks associated with low-income settings such as high rates of unemployment, crime,
violence, and lack of access to affordable housing and health services contribute to the
particular need that young people living in these environments have for structured youth
sport programs (Aneshensel & Sucoff, 1996, pp. 293-310 ). The negative influences of
living in low SES environments, as well as discrimination and depression, have been well
documented, but they can all be potentially mitigated by using sports programs as “safe
havens”(Ewing & Seefeldt, 2002, p. 39).
What is Pay-to-Play

13
Organized athletics have seen a large amount of growth since their introduction
into American society. Nearly every community now offers one or more forms of
competitive athletics to its youth (National Federation of State High School Associations,
1990). With sports being so important to the personal growth and the well being of
adolescents, as well as providing potential safe havens for minority youth, Eccles and
Gootman (2002) recommend that programs must be made “available to all youth” (p. 62).
Youth sports, however, is a $7 billion business that relies heavily on public money to
operate (Cook, 2014, para. 1). Due to costs such as facility usage, coaching, and
insurance needing to be covered; the costs and fees associated with participation in youth
sports are higher today than ever before (Finances, 2015). Competitive youth sports,
which are often needed in order to play for schools and universities, has even more fees
attached such as tournament costs, trainer and league fees, outside training, and travel
expenses; all costs and fees which lead to competitive sports costing thousands of dollars
(Thompson and Dougherty, 2016).
More than 25 million kids between the ages of 6-17 participated in an organized
sport in 2015 (Thompson and Dougherty, 2016, Lucrative Industry). With costs so high
in many sports, both at the competitive and non-competitive levels, families can
sometimes spend up to 10.5 percent of their yearly gross income (Sullivan, 2015, para.
5). Not surprisingly, many families do not allow kids to play multiple sports anymore
with prices so high. Even many high school sports and teams have adopted a pay-to-play
fee, which according to a recent national poll of parents of middle and high school age

14
children nationwide by the University of Michigan C.S. Mott Children's Hospital (2012),
led to about 12 percent of parents overall saying that the cost of school sports caused a
drop in participation rates for at least one of their children (para. 5). According to the
study, around 61 percent of children playing middle or high school sports were charged a
pay-to-play fee, and among those families earning less than $60,000 per year, 19 percent
said their children's participation decreased because of costs (para. 3). Among families
earning more than $60,000 per year, only 5 percent reported that costs had caused their
children to participate less (para. 5). Within school sports, contextual factors such as
school size, pupil-teacher ratio, and mean SES of the student body all affect participation
in athletics (McNeal, 1999, pp. 291-309).
Due to the exorbitant fees and costs such as league fees and special facility usage,
sport and physical activity have now become ‘commodified’ (Collins, 2004, p. 232).
Collins compared the sport and leisure industry to those such as furniture making, car
manufacturing, and domestic electricity consumption; finding that activities have become
more “like transactions than services” (p.15). With so much money involved and
changing hands, sport as a consumer product does not “impact equally on individuals in a
society with a wide range of wealth” (p. 234). Roberts (1999) had a similar take on the
impact of money in leisure, arguing that “money is now at the root of the main
differences between the use of leisure in different social strata, and the leisure differences
between them are basically and blatantly inequalities rather than alternative ways of life”
(p. 87).

15
Social Stratification
Like many societies around the world, the United States is stratified. According to
the Oxford Dictionary (2017), to “stratify” is to “formally arrange or classify into strata, a
level or class to which people are assigned according to their social status.” Stratification
is normally done on the basis of a person’s socioeconomic status (SES), taking into
account factors such as income, education, and occupation (Kerbo, 1983, p. 77).
Unfortunately, aspects of life that are out of anyone’s control (e.g. sex, age, race) tend to
be intertwined with SES, with research showing that race and ethnicity, in terms of
stratification, often help determine a person’s socioeconomic status (House & Williams,
2000, pp. 81-124).
Privilege, inequality, and discrimination are often key factors when looking at
social class, as low SES is often tied to unequal access and distribution of resources
(Ethnic, 2009, SES Affects Our Society). Low SES generally means a social group or
population has lower categorical numbers in areas such as education, poverty, and health
(Jessor, Turbin, & Costa, 1998, pp. 194-208). When assessing the statistics for different
groups in the United States, inequity in resources distribution and access is clear to see.
Black children are three times more likely to live in poverty than White children, with
Hispanic families being more likely than White families to live in poverty as well
(Costello, Keeler, & Angold, 2001, pp. 1494-1498). Unemployment rates for Blacks are
typically double those of Whites (Rodgers, 2008, para. 1), while Blacks and Latinos are
also more likely to attend high-poverty schools than Asians and Whites (Ethnic, 2009,

16
Education). Black men working full time earn 72 percent of the average earnings of
comparable White men and 85 percent of the earnings of White women as well (Rodgers,
2008, para. 1).
With communities often being segregated by race and ethnicity, low SES is often
difficult to escape due to discrimination and marginalization (Corcoran & Nichols-
Casebolt, 2004, Discrimination). Racial gaps in education and employment wealth reflect
the disproportionate representation of Black and Hispanic families at the bottom of the
income scale, and with rates of upward mobility being much lower than other races and
ethnicities for Blacks and Hispanics, minority born children are more likely to remain
stuck in poverty as well as be born into it (Reeves, 2013, para. 3). With such
disadvantages starting right from birth due to the relationship between skin color and
wealth, Black and Hispanic children of low SES backgrounds often have to deal with a
lack of access to opportunities that many White children are privileged of having access
to. As a result, physical inactivity has become a major risk factor for racial minority
groups, due to the direct impact that SES can have on physical activity (Eitzen & Sage,
2003, p. 283).
With many activities requiring the purchase of equipment or access to fee based
amenities and facilities, members of low SES groups are often left with limited access to
quality sport opportunities. The opportunity to participate in sport can be stratified along
social class lines, and a lower social class background may serve as a barrier to sport
participation. Hasbrook (1986) found that high SES students, compared to less privileged
17
peers, play organized sports more prior to high school (pp. 15-24). There is evidence that
neighborhood SES is also related to physical activity and sport participation, as higher
SES neighborhoods have been found in some studies to have significantly more physical
activity facilities than lower SES neighborhoods, as well as significantly more free-for-
use facilities as well (Estabrooks, 2003, p. 100).
Many low SES areas or neighborhoods lack basic infrastructure, such as
recreation centers or safe athletic areas due to a lack of public funding (Stadolska, 2014,
pp. 612- 634). The rise of mega sports facilities is not helping solve the problem, as
researchers have concluded that as professional sports venues get bigger, so do the
complexes that host youth sporting events and practices. Complexes and facilities can
often cost anywhere from $5 million to $50 million, and are most often built in suburban
or rural areas (LaFerney, 2016, para. 20). There have also been differences noted in the
participation levels according to different geographical regions, as differences are often
reported between metropolitan and rural areas (Craike, 2011, pp. 15-21). In addition to a
lack of access to facilities, individuals in lower socio-economic classes seldom participate
in physical activities because they spend much of their time and financial resources trying
to make a living. With more important aspects of life such as supporting a family taking
center stage, few resources are left to support sport and physical activity participation
(Eitzen & Sage, 2003, p. 286).
Impact of SES on Youth Sport Participation

18
According to Vandermeerschen and Scheerder (2017), people are considered to
be in poverty when “they lack the resources to obtain the types of diet, participate in the
activities and have the living conditions and amenities which are customary, or are at
least widely encouraged or approved, in the societies to which they belong” (pp.10-16).
The inability to participate due to a lack of resources can be both a social and cultural
problem, and in regards to sports, affects “social integration and inadequate social
participation” (Room, 1999, pp.166-174). An individual is socially excluded if “he or
she cannot participate in the normal activities of citizens in that society or he or she
would like to so participate, but is prevented from doing so by factors beyond his or her
control” (Burchardt, Le Grand & Piachaud, 2002, p.30). Since practicing sport has come
to be considered a ‘normal’ or ‘customary’ activity in contemporary Western societies (or
at least from the perspective of the dominant social groups), and to some extent a
‘normative’ activity not being able to participate, therefore, is a type of social exclusion
(Macdonald, Pang, Knez, Nelson, & McCuaig, 2012, pp. 9-23).
With the price of competitive youth sports often in the thousands due to the pay to
play format, Henry and Gratton (2001) suggest that two tier cities have grown as a result
of a “marketisation of services” (6), which impacts ethnic and class groups in “fuelling
the differences of those who can avail themselves of market provision and those who
cannot.” (p. 6). Researchers have noted that ethnic minority youth, especially those that
live in economically distressed communities, do not participate equally in youth
programs as compared to youth living in middle and upper income communities (Duffett

19
& Johnson, 2004). A national survey of 1,003 parents by Duffet and Johnson (2004)
found that only 39% of minority parents reported being able to afford out-of-school
activities compared to 62% of White parents (p. 11). This survey was consistent with
research that has documented the constraints of participation fees as a major barrier for
ethnic minority youth to participate in youth sport programs.
The Aspen Institute’s State of Play study is an annual examination of how youth
sports are serving young athletes. Several factors listed in the study affect youth sports
participation, but the amount of money families pay for access is the most prominent
(The Aspen Institute, 2017, p.3). The 2016 Aspen State of Play study shows that
participation in most youth sports has steadily declined since 2008, and family income
continues to be a major factor in participation rates. In that time span, nearly 3 million
fewer children have played basketball, soccer, track and field, baseball, football, and
softball, and less than 1 in 3 children between the ages of 6-12 participated in a high-
calorie-burning sport or fitness activity three times a week (p. 6). About 28 percent of 13-
to 17-year-olds from family incomes of less than $25,000 play team sports, and about 46
percent of that age group from households that make more than $100,000 play organized
sports. That gap has grown by four percentage points since 2014, and even former first
lady Michelle Obama noted the disparities in access by community at the 2016 Project
Play Summit and called on the sports industry and its stakeholders to address the gap
(p.14).
20
According to the Sports & Fitness Industry Association, about 25 percent of the
population has a household income under $25,000, but only 15 percent of sports
participants are in that group, and only 11 percent are of soccer participant households
(Holland, 2014, para. 7). In contrast, about 20 percent of households have incomes over
$100,000, but 33 percent of households participating in sports have incomes at that
level, and 37 percent of soccer participants are in that income category (para.7). These
numbers show that the rate of sport participation, and soccer in particular, has a
significant and direct relationship to income. It would seem that children from lower
income families do not participate in sports at the same rate as higher level income
families, which leads to questions of equal access. Ravenscroft (1993) argued that the
‘politics of choice’ have been replaced by the ‘politics of means’ in sports, as low income
families often do not have a choice in whether or not their kid will play organized sports
because they often can’t afford it (p. 42).
A case study on the costs associated with a youth travel soccer club in the
Shenandoah Valley of Virginia found that families pay a minimum of about $2,000 per
season, which can be compared to travel teams for basketball and baseball in the same
region with costs for a yearlong commitment that are anywhere from $600 to $1,500
(Otero, 2016, Players Wanted). A clearer picture of the total cost of youth soccer was
also explored, as the prices of additional costs such as travel ($100 to $130 a night in
Virginia), gas (about $400 a season), and food were calculated and represent the true total
cost of US youth travel soccer (Players Wanted). These extra costs are often required and

21
are the hidden indirect costs associated with the direct costs of programs, which often
prevents children of lower socioeconomic status from participation in athletic
opportunities (Trussell, 2006). Sports sociologist Jay Coakley (1993) has talked of the
difficulties that middle and lower class families may have in the harsh economical
climate of youth sports:
If you're not upper middle class or middle class with three credit cards, you're
going to have a hard time keeping your kids involved in sports at a relatively elite
level. The average household income in this country is about $52,000. The cost of
one kid playing can be $6,000 or $7,000. Where does that leave the average
middle-class family? (p. 92)
The effects of costs and fees on racial demographics in Soccer Participation
Hartmann and Manning (2016) found that there are economic marginalization and
class disadvantages associated in sports in the United States; much like there is
“persistent racial gaps” in areas such as wealth, poverty, education, health care, and
criminal justice (pp. 43-47). They found that white kids and kids from wealthier families
play sports at an earlier age (6 years old) then both Black (7) and Hispanics (8), and there
are obstacles standing in the way of “full and equal access” for young people of color in
sports participation such as lower levels of employment and higher rates of poverty (pp.
52-60). Other studies have also shown Asian American youth have low participation
rates as well (Feldman & Matjasko, 2005, pp. 159-164). Throw in the fact that greater
22
competition in sports leads to higher fees and costs, and it is clear that American kids of
color face “challenges of access and issues of treatment that are unique, uneven, and
unequal when compared to the typical experience of white middle class children and
youth” (Hartman & Manning, 2016, p. 49).
Lusson, the director of NorCal Premier Soccer Foundation (which works with
underserved communities) notes the issues within the pay-to-play system that is leading
to thousands of African American and Latino neighborhoods being priced out of US
Youth Soccer, “I don’t think it’s systematic racism. It’s just a system that has been built
with blinders to equality.” (Carpenter, 2016, para. 24) Ed Foster-Simeon, the CEO of the
Soccer for Success program, notes the problems of the system as well. “Talk about a
family living on $25,000 with four kids in a place like Washington DC or even double
that, $40,000 in Washington DC. Those kids shouldn’t be barred from soccer because
their parents don’t make much money.” (para. 31)
Andrews, Pitter, Zwick, and Ambrose (2003) presented an interesting case study
of youth soccer and race in metropolitan Memphis that highlights the issues of pay to
play in US Youth soccer. Memphis, like numerous other places in the United States, has
“racial and socio economic class lines”, which are drawn in 5 different zones of the city.
South Memphis is predominantly Black (94 percent) and East Memphis is predominantly
White (84 percent) (pp. 197-218). According to their research, Blacks in South Memphis
average around $7,500 in salary per year per capita, while Whites in East Memphis
average $21,000 in salary per year per capita. (pp. 197-218) The authors point out that 79
23
percent of youth soccer players in the metropolitan area live in East Memphis, while just
.05 percent of the soccer player population lives in South Memphis (pp. 197-218). As the
chapter makes clear, soccer in Memphis is “the domain of the White, suburban middle-
class” (p. 217). This is an important study in that it is one of the few that has been done to
prove there is a direct relationship between social class/race and participation in youth
soccer.
The Aspen Institute reviewed data on sport participation rates among American
youth in 2014that is summarized by social class, race, gender, and disability status. The
findings demonstrate several significant participation and activity gaps between the
wealthy and poor and also Whites and racial minorities (Sagas & Cunningham, 2014,
p.5). They found that it takes significant resources, such as “time, access, and money” to
develop as an athlete and play competitive sports (p.3). This correlation between
resources and competitive sports limits access to quality sports opportunities for millions
of American kids in low income families and makes youth who have access to financial
resources much more likely to participate in organized youth sport in American society.
In today’s youth sports landscape, those who have the greatest opportunity to
continue playing into adolescence or at higher levels of sport are those who can afford the
club teams, training, and equipment required to advance through the system. In the Aspen
Institute’s research, it was found that Hispanic children are much less likely to be
physically active than White children, and sport participation rates for White kids exceed
that of African Americans, Hispanics, and Asian kids (Sagas & Cunningham, 2014, p. 6).

24
It was found that facilitating a youth sport career at the elite levels ranges from an
average of a few thousand dollars per year, to more than $20,000 per year in some sports,
which is not feasible for a majority of kids growing up in lower income families (p.3).
In a survey done by the Sporting Goods Manufacturers' Association (2003)
involving 26,000 children and youth between the ages of 10 and 18 years, it was found
that participation rates by race and gender varied widely in the United States. Black and
Hispanic youth participated similarly in baseball and basketball, but were
underrepresented in soccer and volleyball and in individual sports. Black and Hispanic
youth also rated the following reasons for dropping out higher than Caucasian youth:
"could not afford the equipment" (Ewing & Seefeldt, 2003, p. 51). Fifteen percent of all
girls and sixteen percent of all boys who participated in sports were Black. Seventeen
percent of female athletes and fifteen percent of male athletes were Hispanic, and eight
percent of Asian girls and twelve percent of Asian boys play sports. And yet,
proportionally fewer girls of color are involved with sports than white girls. Girls of color
are also much more likely than their male counterparts to be non-athletes and are
affected by both gender and race discrimination (p. 65). Asian girls had the highest
percentage of non-athletes (47%), more than double their male counterparts (22%). More
than one in three Black and Hispanic girls were non-athletes (36% for both), compared to
one in four white girls (24%). Regardless of race, more girls were moderately involved
with sport, whereas more boys were highly involved athletes (p.47).
25
Studies repeatedly linking low-income athletes, and primarily minorities, to low
cost sports such as basketball and football, correspond with the findings of Bourdieu,
who found that social class is inversely related to involvement in certain ‘prole’ sports,
so-called because “they are avoided by the upper classes and have therefore become
associated with the working class” (Bourdieu, 1978, p.819). Bourdieu (1984) concluded
that “indicators of social class are positive predictors of sport involvement in general”
and that members of the upper classes are more likely to be both sports participants and
sports spectators (pp. 188-198). Bourdieu also found that economic capital is a good
predictor of sport involvement, as being a participant or spectator requires both money
and time, which the upper class has more (pp. 188-198). Class-based differences in
economic capital enable upper class involvement in expensive sports, leaving ‘prole’
sports largely relegated to the lower classes.
With income predicting so much in regards to sports participation and choice,
economic capital acts as both a barrier and a vetting agent. In an area that should be an
open sphere of limitless possibilities, Bourdieu (1978) found that sport represents the
struggles between social classes, as people in elite groups have the resources to “organize
and maintain games on their own terms and in spaces inaccessible to others” (p. 819).
From this perspective, then, sports participation is not a matter of personal choice or
individual preference; “it depends upon the financial resources available to the potential
participant and the social status of those prominent in that activity” (Wilson, 2002, p.31).

26
With all of the fees, costs, and hidden costs involved with travel soccer, a sport which
just needs a ball to play, has become one of limited access to the lower class.
.

27
CHAPTER THREE: METHODS
Research Design
This study is an intrinsic case study that uses the research approach of concurrent
mixed methods. This quantitative study is done as an intrinsic case study, which is “the
study of a case (e.g., person, specific group, occupation, department, organization) where
the case itself is of primary interest in the exploration.” (Mills, 2009) An intrinsic study
is driven by a desire to know more about the uniqueness of a case or situation and when
an understanding is desired. This type of a case study provides a rare inside glimpse of a
soccer club that can be used to further the conversation on the impact of pay to play. For
this case, qualitative and quantitative data collection, on a soccer club from Fairfax
County, Virginia, is done at the same time in a concurrent mixed method study. In this
research approach, data is collected simultaneously, with neither quantitative nor
qualitative influencing one another.
A quantitative collection from the club in Fairfax is done to help explore
demographic patterns at the club and explore the relationships between race, income,
cost, and participation. In concurrence with the quantitative analysis, a qualitative study
explored pay-to-play by interviewing six high profile coaches/directors from Northern

28
Virginia to gain their valuable insight and knowledge on the financial system of which
they’ve worked.
Population and Sample
The population of the study are travel soccer teams in Northern Virginia. The sample for
the quantitative analysis is 354 soccer players who currently pay fees to an unidentified
club in Fairfax, VA for travel soccer. The 354 players consist of 183 boys and 171 girls
from the ages of 10 to 18 who play for travel teams that play in the National Capital
Soccer League (NCSL). There are a few other competitive leagues in which players at the
club could play such as ODSL and recreational soccer leagues. NCSL, however, is one of
the more competitive soccer leagues in Virginia and is thus more expensive to participate
in due to its selectiveness. In the qualitative section of the study, six male coaches from
Northern Virginia were interviewed. Pseudonyms were used to protect the identities of all
six coaches. In Table 1, the codenames, age, race, and years of being involved in us
Youth Soccer of each interview subject are listed.
Table 1
Coaches Demographics
Coach Name Race Age Years Coach Position
Brad
Freddy
White
Black
39
30
29
10
8
7
Coach
Youth Dir.
Youth Dir.
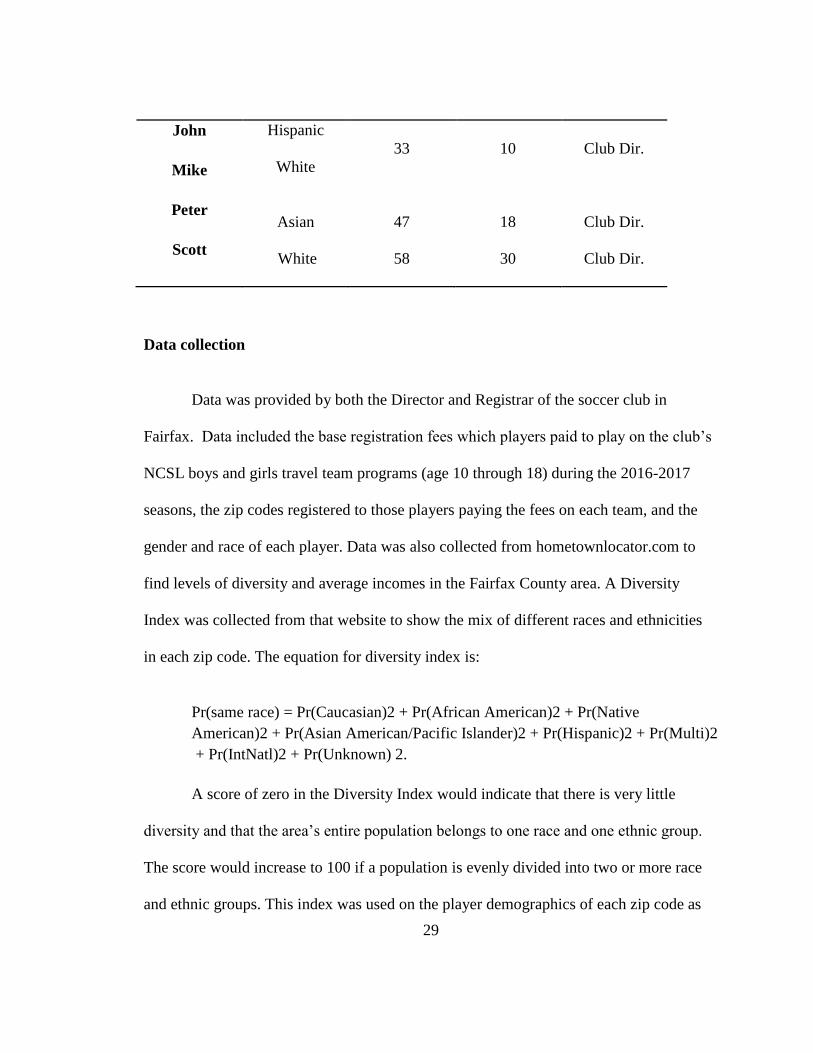
29
John
Mike
Peter
Scott
Hispanic
White
Asian
White
33
47
58
10
18
30
Club Dir.
Club Dir.
Club Dir.
Data collection
Data was provided by both the Director and Registrar of the soccer club in
Fairfax. Data included the base registration fees which players paid to play on the club’s
NCSL boys and girls travel team programs (age 10 through 18) during the 2016-2017
seasons, the zip codes registered to those players paying the fees on each team, and the
gender and race of each player. Data was also collected from hometownlocator.com to
find levels of diversity and average incomes in the Fairfax County area. A Diversity
Index was collected from that website to show the mix of different races and ethnicities
in each zip code. The equation for diversity index is:
Pr(same race) = Pr(Caucasian)2 + Pr(African American)2 + Pr(Native
American)2 + Pr(Asian American/Pacific Islander)2 + Pr(Hispanic)2 + Pr(Multi)2
+ Pr(IntNatl)2 + Pr(Unknown) 2.
A score of zero in the Diversity Index would indicate that there is very little
diversity and that the area’s entire population belongs to one race and one ethnic group.
The score would increase to 100 if a population is evenly divided into two or more race
and ethnic groups. This index was used on the player demographics of each zip code as

30
well in order to be compared with the index of the zip codes’ populations. The average
annual per capita income was collected from each zip code as well to show the socio
economic status of the County. Per capita income is the total personal income of all
residents divided by the population and gives an idea of the type of money that is in an
area.
Data was also collected from six youth coaches and directors from different
soccer clubs in Northern Virginia. Areas from which the coaches came were Prince
William, Haymarket, Fairfax, Burke, and Annadale. The coaches were recruited by
emails sent to seven clubs in Northern Virginia asking if any coaches would volunteer
their time for the study. Fourteen coaches responded but the six coaches chosen met the
criteria for having coaching experience of at least five years and holding director roles.
Having a director role signifies that they have worked with registration fees before and
have a firm grasp of soccer and the player population in Northern Virginia. Each
interview was done face to face for intimacy and openness and approximately lasted from
15 to 25 minutes. Interviews were conducted in each coach’s office at their respective
clubs.
The interview questions were open ended for greater detail and depth so that the
coaches had the freedom to provide great insight into the pay-to-play system and
diversity of U.S. Youth Soccer. An interview guide was developed based on the literature
researched for this study. The questions dealt with each coach’s experiences in the pay to

31
play system and their thoughts on areas such as racial and social class diversity. The full
interview guide can be found in Appendix A. Sample questions included:
1) Do you feel that the Pay-to-Play system has an impact on racial diversity in US
Youth Soccer?
2) Have you had any experience dealing with families or minorities struggling to pay
fees in association with your team or club?
3) Can you think of any potential solutions to make the fees in US Youth Soccer any
less?
Data Analysis
The race and sex of players, average annual per capita income, and diversity
indexes for both the population of each zip code and the player population of each zip
code were analyzed for each zip code to look for trends and correlations. The statistical
categories were put in a data sheet and run through IBM SPSS to analyze for potential
correlations and significance. The relationships between the diversity indexes for players
in zip codes, per capita income, and the diversity index of the zip codes were investigated
using Pearson product-moment correlation coefficient. This was done to better
understand what kind of per capita incomes players were coming from and the diversity
levels of the areas they lived.
The relationship between the diversity index of each zip code and the per capita
incomes were also investigated using Pearson product-moment correlation coefficient to

32
see what effect money has on diversity in Fairfax County. An individual sample t-test
was conducted to compare the diversity indexes and per capita incomes for minorities
(the total sum) and Whites. Descriptive statistics were also done comparing the diversity
indexes of players coming from each zip code compared to the indexes of the zip code
populations. Descriptive statistics were done comparing the racial makeup of each zip
with the diversity indexes and annual per capita incomes as well.
For the qualitative portion of this study, six different professional youth coaches/
club directors in Northern Virginia were interviewed about the Pay-to-Play system and
their experiences working within the system. The qualitative study was done in the form
of a deductive qualitative content analysis, which is useful for testing pay-to-play’s
impact on the diversity in US Youth Soccer, as it is generally used to test a theory and is
useful when dealing with a structure of analysis that is in operation on the basis of
previous knowledge (NCBI, 2008). Following the completion of each interview,
qualitative data was transcribed and a deductive qualitative content analysis was done on
the respective interviews. Five categories developed based on the purpose of the study
and interview questions. Within these categories, a total of 15 themes emerged, with at
least two coaches agreeing on all but three themes.

33
CHAPTER FOUR: RESULTS
Registration data, collected from the Fairfax club, included the total base price for
the year, the demographics of the players, and the zip codes from which each individual
player was registered. Players at the club were charged a sum of $1,150 each season to
play on boys and girls National Capital Soccer League (NCSL) travel soccer teams. For
the two seasons that the NCSL is in session (Spring and Fall), the base price to participate
in the league and on the Fairfax team totaled $2,300. This price does not include
expenses such as tournaments, uniforms, coaches’ travel and equipment expenses, and
personal gas and travel expenses.
Of the 354 players who registered to play on NCSL travel teams with the Fairfax
club, over 77 percent (273 players) of all players were White. In stark contrast, just nine
percent (35) of the players registered were Hispanic, five percent (18) were labeled by the
club as “Other” (American Indian, Muslim, etc.), four percent (15) were Black, and the
final four percent (15) were Asian. A total of 183 boys and 171 girls played on NCSL
travel teams for the club and paid base registration fees.

34
Table 2
The gender and racial makeup of NCSL travel soccer players at a club in Fairfax
Race Boy Girl Total
Asian 5
Black 12
Hispanic 25
Other 14
White 127
Total 183
10
3
10
4
144
171
15
15
35
18
273
As seen in Table 2, a large disparity is shown between the number of girls of
color (non-White) that participated in the club compared to White girls. The total number
of girls of color who were registered for the 2015-2016 season accounted for fewer than
16 percent (n = 27 girls) of the 171 girls at the clubs. Black girls were the demographic
represented the least out of the entire club, with just three girls out of the total 354
players. Girls classified as other were represented by just four girls in total out of the
entire club, and Hispanic girls represented just 28 percent (n = 10) of the players that

35
were registered as Hispanic (n = 35). White girls were the most represented demographic
in this study with 144, followed closely by White boys with 127.
Table 3.
The total number of travel soccer players of each gender and race per zip code at the
Fairfax
Zip Code Boy Girl Asian Black Hisp. Other White Total N. DI Per Cap. Player DI
22030 55 45 4 1 4 0 91 100 66.7 $48,964 18
22124 30 34 2 1 3 4 54 64 49 $81,704 28
22031 21 23 0 1 6 4 33 44 71.1 $54,538 41
22032 22 20 3 2 4 3 30 42 59.6 $55,537 47
22039 15 16 2 5 3 1 20 31 43 $86,820 54
22015 14 9 0 3 3 0 17 23 66.7 $53,435 42
22033 9 5 4 0 0 0 10 14 67.4 $54,069 41
22181 3 3 2 0 1 0 3 6 54 $77,421 61
20124 5 0 0 0 0 2 3 5 50 $72,682 48
22003 2 2 0 0 3 0 1 4 78.4 $44,461 32
20120 2 2 0 1 0 1 2 4 69.6 $47,867 51
20111 2 2 0 0 2 0 2 4 81.2 $32,942 50
20121 1 3 0 1 2 0 1 4 77.5 $41,619 51
20110 1 2 0 0 2 0 1 3 80.7 $31,846 44
20136 2 1 0 0 2 1 0 3 68 $43,434 44
20155 0 2 0 0 0 0 2 2 65 $48,368 0
Note. “N.DI” is abbreviated for Neighborhood Diversity Index. Player DI is the
Diversity Index of the player. Per Cap. Is the annual per capita income of an area.

36
The most frequent zip codes listed as the known residences of players were
located around Fairfax City, Virginia, with 28 percent of players (100) listing 22030
(George Mason area of Fairfax) as their zip code. This made sense due to the club
primarily practicing near Fairfax City and the George Mason area. According to the
registration data, 71 percent of the players on travel teams came from four zip codes:
22030 (George Mason area), 22124 (Oakton), 22031 (Mantua area), and 22032 (Fairfax
Station). Of the 250 players from those four zip codes, 208 (83 percent) of them were
White. The most listed zip code in the club was 22030 (George Mason area), where 91
White players registered out of a total of 100 players. There are 59 zip codes listed for
Fairfax County.
The diversity index scale was found for all sixteen zip codes represented in the
study and was calculated to represent the player population from each zip code and the
entire club as well. The above table represents the diversity indexes of the neighborhoods
and of the players at each zip code, as well as the annual per capita income of each zip
code. The relationships between the diversity indexes for players in zip codes, per capita
income, and the diversity index of neighborhoods were investigated using Pearson
product-moment correlation coefficient. There was a positive correlation between
diversity index of the players and the per capita of the zip codes they came from, with r
=.261, N = 352, P<.05, with higher numbers in per capita income associated with a
higher diversity index of players. There was also a positive correlation between the
diversity index of the neighborhoods and the diversity index of the players coming from

37
those zip codes, with r = .258, N = 352, P<.05, with the higher the diversity of the
population from neighborhoods, the higher the diversity of the players from those
neighborhoods.
The relationship between the diversity indexes of the neighborhoods code and
their annual per capita incomes were investigated using Pearson product-moment
correlation coefficient as well. There was a significant negative correlation between the
diversity index of the neighborhoods and the per capita of the zip codes, with r =.-956, N
= 352, P<.05, with higher diversity associated with lower numbers in per capita income.
Qualitative study
Following a deductive qualitative analysis of interviews with six soccer
coaches/club directors in Northern Virginia, five categories were developed based on the
purpose of the study and interview questions. Those categories were: income’s impact on
participation, pay-to-play and racial diversity, experiences in pay-to-play, the scholarship
system, and potential strategies/solutions. A total of fifteen themes emerged out of these
five categories.
Income’s impact on participation
Four themes emerged from the discussions with the interviewees in this section.
One theme in this category, which four coaches agreed on, was that the pay-to-play
system caters to families with higher incomes. For example, Coach Freddy said, “Yes,
social income and class play a huge role. The pay to play system caters to the people who

38
can afford to play. It’s catering to the upper class because that’s what pays the machine.
That’s what brings the money in.” Similarly, Coach Scott said,
So all of this creates a population of ‘haves and have nots,’ and I think that our
issue here in Northern Virginia is there is a very large population of affluent
people. You can define affluent in many different ways, but I would say the
majority of Northern Virginia and DC Metro is upper middle class. Two parent
income families and very well educated. So all of a sudden you get this nucleus of
a soccer population that can afford about two thousand dollars a year, and a sub
population that can’t.
Coach Peter agreed, saying,
It sucks to see kids drop out of teams and soccer completely because of money
problems, but it’s become commonplace in high income areas. When fees reach
the thousands and a family is struggling to stay afloat financially, a leisure activity
is one of the first things to go. It’s harsh but it is what it is.
Three of the coaches/directors stated that teams with paid coaches will often have
less diversity than teams with volunteer coaches or coaches with small salaries. Brad
said, “At my club we have some professionally head coached teams and some volunteer
coached teams. Obviously their expenses are less when they’re not paying as much for a
coach.” Scott had a similar thought, saying that soccer in the United States is more
39
expensive than most countries around the world due to it being often more organized and
requiring a coach to work multiple times a week. He noted:
I think overseas, coaches know that kids are going to play neighborhood games
and play on their own a whole lot more, so they can afford to just train a few
times a week for an hour or so. Here, that type of free play/unorganized play isn’t
as encouraged. They wouldn’t need to pay for training as much if kids were
playing on their own.
John sees more diversity when coaches are paid less, saying that:
There’s been some teams that don’t make the players pay as much, as coaches are
paid more with camps that are run on the side. On those teams you see kids of
multiple backgrounds all on the field together and have more of a chance to play
high level soccer.
Within the same category, a third theme became apparent after five coaches stated
that potential star players were not getting the opportunity to participate because of the
pay to play system. Mike said, “You see this paradox of people saying that the US can’t
find talent or diversity to make a great national team. The talent and people are there.
They just aren’t being connected with and cannot afford the game.” Scott echoed that
sentiment, saying:

40
Does that mean we’re getting the best kids? No, we’re getting the parents that can
afford it. I think that if a quarter of those kids that should be playing travel soccer
actually went to travel soccer and the community found a way to pay for it, I think
that it would make travel soccer a heck of a lot more competitive and would
relieve a lot of frustration.
Freddy stated his frustration of “kids of color” not getting a fair chance, noting:
Sometimes you see kids of color and different backgrounds working hard and
wonder just how many more are out there that don’t have the opportunity. A lot of
times passion wins out over money, and it’s just sad that you know that kids are
out there that can play but are barred from doing that because of economics.
John said, “Some of those families have the best players in the area, and it’s
unfortunate they can’t interact with their friends in these other programs.” Though not
mentioned by any of the other four coaches, Brad mentioned that smaller soccer clubs
tend to have less social class diversity. He said, “I’ve noticed the impact on social class
more with club size, because the bigger clubs are able to do more scholarships for
players. Some of the smaller clubs don’t have that capability.”
Pay-to-play and racial diversity
Three themes surfaced in this category. The first was that all of the subjects found
that the pay to play system affects kids from minority backgrounds. For example, Freddy
said, “People around the game know that most of the players who are affected by the

41
costs of soccer are people from multi cultural backgrounds and ethnic backgrounds.”
Peter also said that he sees a large number of minority youth at a disadvantage when it
comes to participation. “US Youth soccer has a racial problem on its hands. So many kids
I see in higher income areas are white, and the ethnic and diverse communities are not
being reached.” John had a similar thought, saying, “A number of clubs are mostly
Caucasian, whereas some clubs with less fees you might see more diversity on the field.”
Brad said the SES of an area played a hand in determining participation:
I think you do tend to see kids on teams from a higher economic area being
sometimes predominantly white. The presumption is that the more affluent area
teams are white and that’s the stereotype that comes with it. I think of course the
fees and issues of social class and income play a hand in all that as well.
The theme dealing with race and specific sport participation was also found in this
category, as two subjects stated that kids of color often play low cost sports instead of
travel soccer due to differences in finances. Mike said,
In this country, you have more of a chance of being poor if you are not white. So
all of these ethnic and minority families weigh their options for their kids and
normally find alternative routes outside of soccer for their kids to spend their
time. The sport is just too expensive and you see it with sports such as hockey too.
When the cost is high you are not going to bring in the type of diversity that you
want.

42
Peter had similar ideas, saying, “We see minorities playing basketball and
football, but what if soccer was a feasible option financially and one that was seen as
another route to pro level sports?” Although not mentioned by other subjects, Peter also
asserted that the pay to play system caters to Whites and therefore allows them to be
trained and play more competitively, as well as succeed and reach higher levels. Peter
expounded on this notion by stating:
So many players on college soccer teams come from overseas or are white kids
from these affluent areas. The teams that can afford high level tournaments are the
ones being seen by college coaches and much of the diversity on teams is brought
in from overseas. We aren’t developing kids of different races here and it shows.
Experiences in pay-to-play
One recurrent theme appeared in four of the interviews. Each one of the four said
they had been around soccer clubs in Northern Virginia where players have been forced
to leave the sport due to finances. For example, Brad said, “Many of the teams I’ve
worked with and have been around have had at least one player that needs support and
some assistance.” Peter also had experience dealing with financial struggles in the
system, saying,
Nearly every team I’ve worked with I’ve had parents email or call saying that
they need help with the fees. I can’t help every kid of course, so it’s always a
matter of what financial resources the club I work with has at that time.
John said that he has had similar experiences:

43
I see some of the kids that can’t sign up because they can’t afford it. A lot of
parents really stretch themselves so that their kids can participate in training
sessions and make games and tournaments. I think it is really affecting kids in
places like Northern Virginia and these urban areas.
Similarly, Mike said, “Every now and then you see a talented kid drop out of your
club due to fees.”
The scholarship system
The fourth category that surfaced from the data dealt with thoughts the subjects
had on the scholarship system in US Youth Soccer. Oftentimes, clubs have the money in
a fund to help low SES families afford the fees involved with travel soccer. One theme
that appeared in the words of four of the coaches was that while the scholarship system
has done a lot of good for low income families, it does not exactly solve the problem
altogether. For example, Peter said,
Clubs come up with money and are able to use it to help get rid of some of the
fees for players that need help. The problem is that there are so many other costs
involved that aren’t usually thought about like gas money, jerseys, or
tournaments. A lot of families that are helped by scholarships still have trouble
keeping a kid on a team or getting them to practices and games.
Freddy also listed the pros and cons of the system, saying,

44
Scholarships are the easiest route if you have the capability of doing that. The
clubs I have worked for can do that because of the fees and the socioeconomic
groups that we have. However, there is generally never enough to help every
family, so more options are needed.
Brad had similar thoughts on the matter, while also giving an inside look into
what low income families may feel about scholarships.
Scholarships serve to help those who are willing to seek it. Some families are too
proud to do that or don’t necessarily want to expose how much their family earns
or what their income is. I think it helps some, but I don’t think it solves the
problem. I come from both sides of the problem.
Though not mentioned by other coaches, John stated that scholarships are not a
helpful solution. He specifically said,
I don’t think scholarship systems have developed enough to reach out to these
families. Usually it’s smaller fees that are waived and families are still paying the
majority of fees anyways. It’ll take a lot more money in the scholarship pool to
make a difference.
Potential strategies/solutions
Six different ideas were mentioned by the coaches/directors In this category. One
theme mentioned by two coaches was need for the Major League Soccer professional
league to be more involved in youth soccer. Scott, for example, said,

45
“I think part of our issue here in the US is the disconnect between the pro game
and the youth movement. There’s no equitable distribution of revenue from the pro game
to kind of foster grass roots development of players that aren’t being supported by US
Soccer. Could a club like DC United provide revenue to offset some costs to get more
kids in the sport? Maybe. But the pro game isn’t there yet and after all the expenses clubs
need to pay, there is a finite pile left.”
John also said that MLS could play a larger role, saying,
I think that a lot of these MLS clubs claim players as Homegrown after the
player was trained elsewhere for a long time. I think it can change where youth
clubs get a fee as well from a player signing a professional contract, which can
go straight into the club and to coaches so that parents don’t have to pay as much.
The MLS needs to grow as well however.
A theme discussed by three coaches was that there are too many soccer clubs
around the country and in each state. Similarly to the coaches who thought MLS could do
more for youth soccer, John thought the same but gave the geography of youth soccer as
a reason for the disconnect between the pro game and grass roots levels. “Here it’s more
difficult with 1,500 clubs and clubs forming everyday and every month. With so many
clubs all around each other, there isn’t one professional club that’s able to help out with
costs like they can in Europe or even South America.” Scott had a similar thought about
the high number of clubs in each state and figured that a new system might be beneficial:
46
One issue is that every state has a soccer federation and each state has many
different clubs within them. Many areas of the state are very different socio
economically, so you see how that affects the talent level of clubs and the type of
players that are playing. In order for the inequalities to balance out, I think we
need to go from a club based system to a region based system. We’d have kids
going to one spot to tryout, and they are not going to pay any more to be on a
team then what that allocation is for the region. That’s verses them having to pay
a different number for each club. Maybe then we’ll be more inclusive with kids
being able to afford travel soccer.
Another solution that teams are actually using to bring more social class diversity
into the game is parents coming together to pay for low income kids. Peter and Scott both
talked about how they have seen parents chip in and help pay for a kid whose family
could not afford to do so. For example, Peter said, “Sometimes the parents on the team all
come together to help support a lower income player. Especially if they are good and help
raise the talent level of the team.” Scott said, “Normally a travel team is run on a budget
of collected fees, and if a team wants to have a player join the ranks that can’t afford it,
then it is a matter of paying a bit more in fees to cover them. It happens very few and far
between though.”
Though not mentioned by other coaches, Scott also had the idea of large
fundraisers being able to help deal with costs. For example, he said,
47
I work in a very small town but also a very diverse town, socioeconomically. We
have to, as best we can, keep our registration fees affordable in both
recreational and travel soccer. We do that a couple of different ways. Our largest
fundraiser every year is the All Star tournament that provides every year about 15
or 20 thousand dollars in net profit to the club every year. A good portion of that
goes to the city and pays for our commitment that we make with turf fields and
grass fields. What that allows us to do is not have to increase registration fees in
order to pay for things like that.
Freddy also had a few ideas not mentioned by the other coaches. He said
sponsorships could be key to revamping the system. For example, he said,
In terms of real strategy, it has to come from the top. Somebody or a group has
to think about what they need to prioritize. Is it making money or developing
kids? I think it may come down to a sacrifice, where they are like ‘look, we aren’t
going to make the same money but we are going to develop these kids.’ Those
kids are going to come up and make the national team better, the youth teams
better. Then we compete with the rest of the world, become one of the best soccer
nations, and then start to see how that brings in success and watch it trickle down.
That’s the simplest way I see it. Somebody who actually cares about these kids
and participation has start a movement and make a stand. Maybe they find
sponsorships from businesses. Find people who love the game and want to invest
in a system like that. Then money comes for more scholarships.

48
CHAPTER FIVE: DISCUSSION AND CONCLUSION
Exclusion isn’t meant to be enjoyable. Whether it’s a kid being denied a seat at a
school lunch table or someone not being invited to a party or wedding, the process of
being denied access to something and left on the fringe hurts. Social exclusion, the
inability to participate in relationships and activities available to the majority of people,
due to lacking or being denied resources, affects the cohesion of society as a whole
(Levitas, 2007, p.18). A loss of opportunity can lead to stunted growth, a lack of skills,
and a lower quality of life. Being expelled or shut out of an activity due to job status or
income is a particularly frustrating dilemma, as often times those things are out of an
individual’s control.
Growing up and playing youth soccer in Northern Virginia, it was my experiences
within the system of pay to play that led me to the topic of this study. I was fortunate that
my parents made enough money to pay for three kids to play at a high level of travel
soccer, but I knew plenty of players and teammates that weren’t so fortunate. More than
once I had teammates who were only on the team because the entire team had to cover
their fees, and also more than once I saw some of those same players disappear within a
few seasons. Now as a soccer coach, I see similar patterns of players disappearing or just
not showing up entirely. With fees becoming too much for parents to pay, I’ve lost a

49
number of players, often minorities, due to finance issues. The players I’ve seen slip
through the cracks in my time in U.S. Youth Soccer led me to trying to understand more
about the pay-to-play system through this study and money that is involved in the sport.
The primary purpose of this study was to see if the numbers supplied from a
Northern Virginia club and the voices of coaches from around the area proved what I
knew and had experienced myself in the fifteen years I have been a part of the pay-to-
play system. After seeing former teammates struggle to pay fees and stay on teams and
now seeing a number of the players I currently coach go through the same, I wanted to
use this study to really lay the ground work for more of a conversation to start about the
prices associated with travel soccer. Investigating how the fees for travel soccer impacted
the diversity of a club and asking coaches for their thoughts and experiences within the
system was one way to bring more credibility to the issue. With the findings in both the
case study and the interviews showing that there is a lack of diversity in travel soccer
from the Northern Virginian region, I think that the foundation for a conversation has
been built and that the divisiveness of the pay-to-play system will hopefully soon not be
U.S. Youth Soccer’s best kept secret to people unfamiliar with the system.
The divisiveness of pay-to-play
In U.S. Youth Soccer, the pay-to-play system represents a barrier to low-income
families. The findings of this study indicate that money did indeed matter in youth travel
soccer in Fairfax County, Virginia, as the fee and demographic data provided in the
quantitative case study, as well as the testaments of the interviewed coaches, show that
50
costs of competitive travel soccer do lead to an impact in diversity for the club in Fairfax.
With 77 percent of the players at the club identifying as White, it was no surprise that the
diversity index of the club was calculated to be 39, compared to the 64 index of Fairfax
County and the 55 index of the United States. The diversity index for the players in each
zip code was in fact lower than all but two neighborhood indexes out of the total sixteen
zip codes.
The diversity indexes of the neighborhoods and of the players stood in stark
contrast of each other. According to the registration data, 71 percent of the players on
travel teams came from four zip codes: 22030 (George Mason area), 22124 (Oakton),
22031 (Mantua area), and 22032 (Fairfax Station). All four of the player diversity
indexes from those areas are lower than the index’s of their respective neighborhoods,
with the George Mason area being particularly low and representing 28 percent of the
travel players in the club. However, the fifth most popularly listed zip code, 22039
(Fairfax Station), deviated from the norm. With a diversity index 11 points higher than
that of the respective neighborhood, the players from this zip code were a higher
percentage of minority than any other zip code registered at the club and were coming
from the highest average annual per capita income as well ($86,820). With the highest
amount of minorities coming from the highest average per capita income, money indeed
seems to play a role in who plays travel soccer and who doesn’t for the club.
The positive correlation between the diversity indexes of the players in each zip
code and the per capita incomes from those areas proved that the higher the per capita

51
income meant the higher the diversity of the players that came from those areas. Money
showed that it mattered through this correlation, as a majority of the players of color in
the club were coming from neighborhoods of higher per capita. The other positive
correlation between the diversity indexes neighborhoods and the diversity index of the
players coming from those zip codes meant that the higher the diversity of people in the
neighborhood, the higher the diversity of the players from that zip code. Significantly less
minority players were coming from areas with fewer minorities, indicating that a lack of
diversity existed at the club,
A significant negative correlation was also found between the diversity indexes of
the neighborhoods and the per capita of the zip codes, with higher diversity associated
with lower numbers in per capita income. This means that areas of high income are less
diverse in the sixteen zip codes, which is interesting in that the players of color at the club
were coming from high-income areas. With racial gaps in education and employment
wealth reflecting the disproportionate representation of Black and Hispanic families at
the bottom of the national income scale (Reeves, 2013, para. 3), minorities in Fairfax
County living in lower income areas and not participating in a costly leisure activity such
as travel soccer makes sense, as it was the minorities coming from higher income areas
that were playing travel soccer more. This shows that it takes money to participate in the
club’s travel soccer program and echoed the theme that emerged from four of the coaches
that the pay-to-play system caters to families with higher incomes.

52
Female minority athletes are doubly marginalized by both gender and race. The
lack of parity is obvious in this study, in which non-White girls whom were registered for
the 2015-2016 season accounted for fewer than 16 percent (27 girls total) of the 171 girls
at the club. In the survey done by the Sporting Goods Manufacturers' Association (2003)
it was found that girls of color are much more likely than their male counterparts to be
non-athletes and that more than one in three (36 percent for both) Black and Hispanic
girls were non-athletes (p. 65). Black girls in this study were the demographic
represented the least out of the entire club, with just three girls out of the total of 354
players. White girls were the most represented demographic in this study with 144, while
just 28 percent of Hispanic girls made up the number of Hispanic soccer players at the
club (10 girls out of 35 total players).
In the same Sporting Goods Manufacturers' Association survey (2003) it was
found that Black and Hispanic youth participated similarly in baseball and basketball, but
were underrepresented in soccer and volleyball and in individual sports (p.51). All six
coaches agreed that the pay to play system affects kids from minority backgrounds due to
high fees, with Peter stating that minorities may not see soccer as a route to the pro level
due to it not being a feasible financial option. With all six coaches also agreeing that
potential star players from low income backgrounds are being pushed away from the
sport due to costliness, soccer may have a problem on its hands attracting low SES
minorities to play at its highest, and most expensive, levels. The potential for the sport of
53
soccer in the United States would be much higher if its highest levels were accessible to
more of the population.
Potential solutions
The base price to participate in the Fairfax club was $2,300 and did not include
extra costs. Otero’s (2016) article listed someone of the extra costs associated with
playing soccer, (e.g. travel, gas, equipment, food, tournaments, etc.). If extra costs were
similar for players at the Fairfax club as they were in the Shenandoah Valley, these
additional costs could bring the yearly expense closer to $5,000. In 2016, it was
calculated in the Fairfax County government annual State of the Poor study (2016) that a
family of four with two children in Fairfax County would need $58,000 to meet their
expenses. With the price of living that high in the county, the costs of travel soccer may
be too much for many families to work into a budget plan. As coaches stated, many
families can’t sign up because they can’t afford it, or really stretch themselves so that
their kids can participate in training sessions and make games and tournaments
To assist with the costs of travel soccer, many clubs in the United States have a
scholarship system in place. Scholarship systems are generally worked into the budget or
come specifically from fundraisers. Some clubs have parents on a team coming together
to pay for a lower income player. Scholarships, however, are the main source of financial
aid provided for players in U.S. Youth Soccer. The problem with scholarships is that
clubs tend to need to pay off their own debts and often do not have the money to fund
large scholarship systems. Having to pay their professional coaches, for fields, and other
54
costs; scholarship systems at the club in Fairfax are often on a first come first serve basis
for the first 70 people who can prove their children are on meal plans at their schools.
According to the club director, lines form outside the clubhouse on registration day and
scholarships are gone within an hour.
Five of six coaches stated that the scholarship system does not solve the issue of
social class diversity in U.S. Youth Soccer, as there is never enough money in the system
to help every family. Smaller fees are generally the ones waived off through a
scholarship, and some families are even too proud to accept financial aid and expose their
family’s earnings for such minor help. With prices as high as they are to play travel
soccer in Northern Virginia, many deserving and talented players slip through the cracks.
Five of the coaches stated in some fashion that they were frustrated at the large number of
talented players that are kept from travel soccer due to finances. Many players are forced
into playing recreational soccer, a “play for fun” style league, which generally only has
volunteer coaching and a much smaller fee. Recreational players at the club in Fairfax of
this study paid 55 dollars per season to be registered for the Spring and Fall leagues.
Not surprisingly, most of the coaches were frustrated at a lack of action from U.S.
Youth Soccer. The prevailing message from most was that the sport is treated as a money
making scheme here in the United States and that change will never happen until that
changes. A significant part of this study was bringing together the voices of six coaches
to discuss the pay-to-play system. Addressing the issue of diversity and their experiences
within the system is a first step towards finding a solution. Each coach thought of

55
potential solutions in this study, which leads to a belief that a national discussion on the
topic could lead to changes being made.
The potential solutions of outside sponsorships and more financial aid from the
professional leagues stood out. Convincing outside business to invest or donate their
money to clubs would allow for more money to directly cover player costs, or even fees
such as coaches salaries and field usage that players cover anyways. As Major League
Soccer grows, monetary assistance from them would also be a way of covering costs.
One of the coaches stated that a “parent club” type system could even be created, where
the best players from local clubs are brought into an MLS club’s youth team at a fee.
Fundraisers and sponsorships are strategies that have been used by many different
state soccer associations over the years to varying results. A Washington DC company
called Leveling the Playing Field donated $1.4 million to 250 sports programs in the
region to help cover costs so more low income children can be engaged. (State of Play,
2017, p. 23) According to the State of Play report (2017), a number of other strategies
have been used all over the country in a number of sports to grow momentum and
increase sport participation for lower SES youth. Helping with equipment costs is one
way organizations have helped to lower costs for participants, as a number of non-profits
collect and redistribute used equipment. In Lancaster, PA, the parks and recreation
department teamed up with the school district, Police Athletic League and other local
sport providers to leverage the assets of each (facilities, high school athletes as coaches,
curricula, scholarships) and create joint programming (p.23).

56
The most relatable strategy mentioned in the report, however, was one done in
Sylvania, OH, where the town analyzed its participation numbers with economic data
from seven neighborhoods and found disparities by income. With these results, new
programs were created to engage underserved children more effectively (p.22). The study
done with economic data sounds similar to the quantitative case study performed within
this study. With the findings of the case study indicating a lack of diversity existing
within the club, perhaps the results could be used to build a strategy that increases
diversity and lowers costs.
Strengths, limitations, and future research
In terms of the limitations of this study, not having race specific incomes for
Fairfax County made it difficult to analyze the data provided. The average income in
Fairfax is generally higher than usual and most income related studies would be skewed
due to the data collected from White participants. Another limitation was the dominance
of Whites in terms of the population. Another club, such as Annandale or Arlington, in a
more diverse area could have led to more significant results. Only including data from
NCSL teams may be considered another limitation, as there is only one team per age
group and only select players at the club. Many players play recreational soccer or in
other leagues, so this study is really only geared toward competitive soccer.
This study, however, is an important starting point for a conversation about the
pay to play system that needs to take place. A key strength of this study is having access
to demographic data from a soccer club. Not many other similar studies have been done,

57
as clubs tend to keep information private. Bringing together six expert voices to talk
about soccer in Northern Virginia was key as well, as hearing their experiences and ideas
after working in the pay-to-play system is a great way to start the conversation that needs
to take place. In this study alone there were several ideas brought forth by coaches on
how to get rid of the pay-to-play high cost barrier for low income families. However, the
importance of knowing more and continuing the conversation cannot be understated, and
more round table discussions and case studies will be needed to provide more solutions
for the problem of racial and economic disparity in youth soccer and other organized
sports. Future studies should be able to build on this case study model and investigate not
just other soccer clubs but also all sports around the country. Many sports in the United
States are costly and consist of the pay to play system, so understanding the negative
implications of high fees keeping youth from participating in sports is important.
Conclusion
This study, through a case study of a club within Northern Virginia, determined
that there racial and social class diversity inequities are highly present within U.S. Youth
Soccer. With the data from the quantitative study showing a lack of minority players at
the club in Fairfax County, as well as a majority of players coming from areas of higher
incomes, a lack of social class and racial diversity proved to exist within the club. Six
experienced professional coaches from Northern Virginia also voiced their invaluable
views on the pay-to-play system and discussed some of the issues they have had to deal
with while working within the system. There is much to be built on from the results of

58
this study, as more thoughts will need to be voiced and more case studies done around the
country in order to address the issue of diversity in youth soccer. Sports should be an area
in which inclusion is stressed and opportunities to participate are available more often
than not. To have access to competitive levels of the world’s beautiful game, youth in the
United States have a considerable financial barrier to cross.

59
APPENDIX A
Interview Questions:
Do you feel that the Pay-to-Play system has a negative effect on racial diversity in US
Youth Soccer?
Have you had any experience dealing with low income families or minorities struggling
to pay fees in association with your team or club?
Does the club you work for have an effective scholarship program in place to help some
of the lower income families?
Can you think of any potential solutions to make the fees in US Youth Soccer any less?
*Due to the interviews being done sequentially to the data analysis, more interview
questions will stem from the findings.
60
REFERENCES
Andrews, D., Pitter, R., Zwick, D., & Ambrose, D. (2003). Soccer, race, and suburban
space. In Sporting Dystopias: The Making and Meanings of Urban Sport
Cultures (pp. 197-219). Albany, NY: Suny Press.
Aneshensel, C. S., & Sucoff, C. A. (1996). The neighborhood context of adolescent
mental health. Journal of Health and Social Behavior, 37, 293-310.
Bennett, R., & Kaplan, G. (2013). Effects of the pay-to-play system on American soccer.
University of Chicago.
Bittman, M. (2002). Social participation and family welfare: the money and time costs of
leisure. Social Policy & Administration, 36, 408–425
Bourdieu, P. (1978). Sport and social class. Social Science Information, 17: 819–40.
Bourdieu, P. (1984). Distinction: a social critique of the judgment of Tast. Cambridge,
MA: Harvard University Press.
Brinkhoff, K. (1995). Sport and social integration during adolescence. In G. Neubauer &
K. Hurrelmann, Individualization in Childhood and Adolescence (pp. 281-304).
Berlin: Walter de Gruyter.

61
Broh, Beckett. (2002). Linking extra-curricular programming to academic achievement:
who benefits and why? Sociology of Education, 75(1), 69-95.
Burchardt, T., Le Grand, J. and Piachaud, D. (2002) Degrees of exclusion: developing a
dynamic, multi-dimensional measure In: Hills, J., Le Grand, J & Piachaud, D,
Understanding Social Exclusion (pp. 30-43). Oxford, UK: Oxford University
Press
Carpenter, L. (2016). It’s only working for the white kids: American soccer's diversity
problem. The Guardian. Retrieved from
https://www.theguardian.com/football/blog/2016/jun/01/us-soccer-diversity-
problem-world-football
Clabaugh, J. (2017). DC per capita income 25 percent higher than national average.
WTOP. Retrieved from http://wtop.com/business-finance/2017/03/dc-per-capita-
income-25-percent-higher-national-average/
Coakley, J. J. (1993). Socialization and sport. In R. N. Singer, M. Murphey, & L. K.
Tennant, Handbook of research on psychology. Basingstoke, UK: Macmillan
Pub Co
Collins, M. (2004). Sport, physical activity, and social exclusion. Journal of Sports
Sciences,8, 727-40
Cook, B. (2014). Private developer's struggles: A lesson in why youth sports complexes
are built with public money. Forbes. Retrieved from
62
https://www.forbes.com/forbes/welcome/?toURL=https://www.forbes.com/sites/b
obcook
Corcoran, J., & Nichols-Casebolt, A. (2004). Risk and resilience ecological framework
for assessment and goal formulation. Child and Adolescent Social Work Journal,
21 (3)
Costello, E. J., Keeler, G. P., & Angold, A. (2001). Poverty, Race/Ethnicity, and
Psychiatric Disorder: A Study of Rural Children. American Journal of Public
Health, 91(9), 1494– 1498.
Chan, S. (1999). The role of sports on minority adolescents. Poverty & Prejudice: Our
Schools Our Children. Spring Quarter. Retrieved from
https://web.stanford.edu/class/e297c/poverty_prejudice/school_child/hrole.htm
Craike M, Symons C, Eime R, Payne W, Harvey J. A (2011). Comparative study of
factors influencing participation in sport and physical activity for metropolitan
and rural female adolescents. Annals of Leisure Research, 14 (4)
Cummings, J. (2004). Does our sport reflect our nation? workshop shows how embracing
diversity is vital to future growth. Soccer Journal, 49 (4)
Demographic Reports 2016 County of Fairfax, Virginia. (2016) Retrieved from
http://www.fairfaxcounty.gov/demogrph/demrpts/report/fullrpt.pdf

63
Drehs, W. (2006). No ordinary background. ESPN. Retrieved from
http://www.espnfc.com/story/370300/no-ordinary-background
Dryfoos, J. (1990). Adolescents at risk. Oxford, UK: Oxford University Press.
Duffett, A., & Johnson, J. (2004). All work and no play? Washington, DC: Public
Agenda
Eccles, J. S., & Gootman, J. A. (2002). Community programs to promote youth
development. Washington, DC: National Academy Press
Eitzen, S., & Sage, G. (2003). Racial-ethnic Minorities and Sport. In Sociology of North
American Sport (p. 286). Oxford, UK: Oxford University Press
Ekono, M., Jiang, Yang., Skiner, C. (2010). Basic facts about low-income children.
NCCP. Retrieved from http://www.nccp.org/publications/pub_1145.html
Estabrooks P, Lee R, Gyurcsik N. (2003). Resources for physical activity participation:
Does availability and accessibility differ by neighborhood socioeconomic status?
Annals of Behavioral Medicine, 25(2), 100-4.
Ethnic and Racial Minorities & Socioeconomic Status. (2009). American Psychological
Association. Retrieved from
http://www.apa.org/pi/ses/resources/publications/minorities.aspx
Ewing, M. E., & Seefeldt, V. (2002). Patterns of participation in American agency-
sponsored youth sports. In F. L. Smoll & R. E. Smith, Children and youth in

64
sport: A biopsychosocial perspective (p. 39). Dubuque, IA: Kendall/Hunt
Publishing Company
Fairfaxcounty.gov. (n.d.). Community Profiles. Retrieved from
http://www.fairfaxcounty.gov/demogrph/community-profiles.htm
Feldman, A. F. and Matjasko, J.L. (2005). The role of school-based extracurricular
activities in adolescent development: A comprehensive review and future
directions. Review of Educational Research, 75, 159-210.
Fraser-Thomas, J., & Cote, J. (2007). Youth sport: talent, socialization, and development.
Hartmann, D., & Manning, A. (2016). Kids of color in the American sporting landscape.
In Child's Play: Sport in Kids' Worlds (43-60). New Brunswick, NJ: Rutgers
University Press
Hartmann, Douglas. (2001). Notes on midnight basketball and the cultural politics of
recreation, race, and at-risk urban youth. Journal of Sport and Social Issues, 25
(4), 339-371
Hasbrook, C. (1986). The sport participation–social class relationship: some recent youth
sport participation data. Sociology of Sport Journal , 3 (2), 15-24
Henry, I., & Gratton, C. (2001). Sport in the city: The role of sport in economic and
social regeneration. (p.6) Abingdon, UK: Routledge

65
Hillman, C. (2014). Effects of the FITKids randomized controlled trial on executive
control and brain function. PubMed. Retrieved from
http://pediatrics.aappublications.org/content/early/2014/09/24/peds.2013-3219
Holland, K. (2014). Shut out: Young athletes sidelined by money. CNBC. Retrieved from
https://www.cnbc.com/2014/07/25/shut-out-young-athletes-sidelined-by-
money.html
Hometownlocator.com. (n.d.). ZIP Code Profile. Retrieved from
http://virginia.hometownlocator.com/zip-codes/data,zipcode,22030.cfm
House, J., & Williams, D. (2000). Understanding and reducing socioeconomic and
racial/ethnic disparities in health. In B. D. Smedley & S. L. Syme, Promoting
Health: Intervention Strategies from Social and Behavioral Research (pp. 81-
124). Washington, DC: National Academy Press.
Jessor, R., Turbin, M. S., & Costa, F. M. (1998). Risk and protection in successful
outcomes among disadvantaged adolescents. Applied Developmental Science, 2
(4), 194-208.
Kay, A. (2012). Suarez - the mixed up kid who became a hero to millions Daily Mail.
Retrieved from http://www.dailymail.co.uk/sport/football/article-2099525/The-
Luis-Suarez-story-The-making-hero.html
Kerbo, H.R. (2006). Social stratification and inequality. New York: McGraw-Hill.

66
Killion, A. (2013). Paying to play is new normal for youth athletes. SFGate. Retrieved
from http://www.sfgate.com/sports/article/Paying-to-play-is-new-normal-for-
youth-athletes-4902034.php
LaFerney, D. (2016). Most youth sports have seen decline in participation since 2008,
and cost plays a part. Dallas News. Retrieved from
https://www.dallasnews.com/news/news/2016/06/21/family-income-a-major-
factor-in-falling-youth-sports-participation
Leeds, M. (2003). Race, incentives, and opportunities: The importance of timing. The
Review of Black Political Economy, 30 (3), 55–69.
Levitas. R, , Pantazi. C,. Fahmy. E., Gordon. D., & Patsios. D., (2007) The Multi-
Dimensional Analysis of Social Exclusion. Department of Sociology and School
for Social Policy (p. 18)
Macdonald D, Pang B, Knez K, Nelson A, and McCuaig. (2012). The will for inclusion:
Bothering the inclusion/exclusion discourses of sport In Dagkas, S., and
Armour, K., Inclusion and exclusion through youth sport (pp. 9-23)
Abingdon,U.K.: Routledge.
Mahoney, J. L., Lord, H., & Carryl, E. (2005). An ecological analysis of after-school
program participation and the development of academic performance and
motivational attributes for disadvantaged children. Child Development, 76, 811–
825

67
Marsh H.W., & Kleitman S. (2003). School athletic participation: Mostly gain with little
pain. Journal of Sport and Exercise Psychology, 25, 205-228.
Matheson, G. 0. (1997). Principles of sports medicine. In W. N. Kelley, Internal
Medicine (pp.265-269). Philadelphia, PA: Lippincott-Raven Publishers.
McNeal, Ralph B. (1999). Participation in high school extracurricular activities:
Investigating school effects. Social Science Quarterly, 80, 291-309.
Merkel, D. L. (2013). Youth sport: positive and negative impact on young athletes.
Journal of Sports Medicine, 4, 151–160.
Mills, A., Durepos, G., & Wiebe, E. (2009). Encyclopedia of Case Study Research.
Retrieved from http://sk.sagepub.com/reference/casestudy
NCBI. (2008). Deductive Qualitative Content Analysis. PubMed. Retrieved from
https://www.ncbi.nlm.nih.gov/pubmed/18352969
Neighmond, P. (2015). Playing youth sports takes a lot more green than it used to. Npr.
Retrieved from http://www.npr.org/sections/health-
shots/2015/09/07/437000903/playing-youth-sports-takes-a-lot-more-green-than-
it-used-to
Oldfield, T. (2009). Cristiano Ronaldo: the true story of the greatest footballer on Earth.
London, UK: John Blake Publishing
68
Otero, E. (2016). Travel soccer tests tenacity of players, families. News Leader. Retrieved
from http://www.newsleader.com/story/news/local/2015/08/21/soca-travel-
soccer-benefits-expense-youth/32127583/
Phinney, J. S., Madden, T., & Santos, L. J. (1998). Psychological variables as predictors
of perceived ethnic discrimination among minority and immigrant adolescents.
Journal of Applied Social Psychology, 28, 937–953.
Poinsett, A. (1996). The role of sports in youth development. New York, NY: Diane
Publishing Company
Poverty in Fairfax County. (2016). Retrieved from
http://www.fairfaxcounty.gov/demogrph/datavis/interactive-datavis/poverty.htm
Ravenscroft, N. 1993. Public leisure provision and the good citizen. Leisure
Studies,12, 33–44.
Reeves, R. (2013). The other American dream: Social mobility, race and opportunity.
Brookings.com. Retrieved from https://www.brookings.edu/blog/social-mobility-
memos/2013/08/28/the-other-american-dream-social-mobility-race-and-
opportunity/
Roberts, K. (2006). Leisure in contemporary society. Oxford, UK: CABI

69
Rogers, W. (2009). Understanding the Black-White earnings gap. The American
Prospect. Retrieved from http://prospect.org/article/understanding-black-white-
earnings-gap
Room G (1999). Social exclusion: Solidarity and the challenge of globalization.
International Journal of Social Welfare, 8, 166–174
Sagas, M., & Cunningham, G. (2014). Sport participation rates among underserved
American youth. Aspen Institute. Retrieved from
https://www.aspeninstitute.org/publications/sport-participation-rates-among-
underserved-american-youth/
Shilling, C., & Mellor, P. (2000). The sociological ambition. (p. 25) Thousand Oaks, CA:
SAGE Publications
Sokalove, Michael. (2010). How a soccer star is made. New York Times. Retrieved from
http://www.nytimes.com/2010/06/06/magazine/06Soccer-t.html
State of the Poor. (2016). Retrieved from
http://www.fairfaxcounty.gov/dfs/caab/pdf/state-of-the-poor.pdf
Stodolska, M., Sharaievska, I., Tainsky, S., & Ryan, A. (2014). Minority youth
participation in an organized sport program. Journal of Leisure Research. 46(5),
612–634

70
Steiner, H., McQuivey, R. W., Pavelski, R., Pitts, T., & Kraemer, H. (2000). Adolescents
and sports: Risk or benefit? Clinical Pediatrics, 39(3), 161–166.
Sullivan, P. (2015). The rising costs of youth sports, in money and emotion. New York
Times Retrieved from https://www.nytimes.com/2015/01/17/your-money/rising-
costs-of-youth-sports.html
The Aspen Institute State of Play 2016. (2017). The Aspen Institute. Retrieved from
https://www.aspeninstitute.org/publications/state-play-2016-trends-developments/
The Finances of Youth Sports in the United States. (2015). Ohio University. Retrieved
from http://mastersincoachingonline.ohio.edu/resources/articles/the-finances-of-
youth-sports- in-the-united-states/
Thompson, J., & Dougherty, M. (2016). Pay to play: The high cost of youth sports.
Lohud: The Journal News. Retrieved from
http://www.lohud.com/story/sports/2016/09/21/pay-play- youth-sports/90311238/
Trussell, D. E. (2006). The influence of socioeconomic status, gender, age, and regional
differences on children’s participation in competitive and recreational sport.
Graduate Student Leisure Research Symposium.
University of Michigan Health System. (2012). Pay-to-play sports keeping lower-income
kids out of the game. Retrieved from http://www.uofmhealth.org/news/mott-poll-
school- sports-pay-to-play

71
Vandermeerschen, H., & Scheerder, J. (2017). Sport managers’ perspectives on poverty
and sport: The role of local sport authorities. Sport Management Review, 10, 10-
16
Verkuyten, M. (1990). Self-esteem and the evaluation of ethnic identity among Turkish
and Dutch adolescents in the Netherlands. The Journal of Social Psychology,
130(3), 285-97.
Waugh, C. (2014). Alexis Sanchez has risen from playing barefoot to Premier League
Star. Dailymail. Retrieved from http://www.dailymail.co.uk/sport/football/article-
2707297/Alexis-Sanchez-risen-playing-barefoot-poverty-stricken-Chilean-
mining-town- Arsenal-s-30m-signing-light-Premier-League.html
Weiss, M. R., & Duncan, S. C. (1992). The relation between physical competence and
peer acceptance in the context of children's sport participation. Journal of Sport
and Exercise Psychology, 14(2), 177-191
Wilson, T. (2002). The paradox of social class and sports involvement: The roles of
cultural and economic capital. International Review for the Sociology of Sport,
37(1).
Witt, P & Crompton, J. (1997). The at-risk youth recreation project. Parks and
Recreation, 32(1), 54-61

72
Woitalla, M. (2015). Youth soccer insider: USA needs a club culture. SoccerAmerica.
Retrieved from https://www.socceramerica.com/article/62313/paul-breitner-usa-
needs-a-club-culture.html

73
BIOGRAPHY
Brandon Hartman grew up in Virginia. He attended the Virginia Military Institute, where
he received his Bachelor of Arts in English in 2015. He went on to receive his Master of
Science in Sports and Recreation from George Mason University in 2017. He coaches
youth soccer and currently holds a position as a communications representative.