Money Laundering: A Review Essay and Policy Implication€¦ · Money Laundering: A Review Essay...
37
1 Money Laundering: A Review Essay and Policy Implication by Raffaella Barone 1) and Friedrich Schneider 2) Abstract: This paper has three goals: First, some theoretical remarks about money laundering (the demand and supply side) are made. Second, a quantitative analysis of money laundering and a preliminary review of the empirical findings of the proceeds of transnational crime organizations worldwide as well as a breakdown of the different types of crime proceeds are provided. Third, literature of anti-money laundering is offered and policy conclusions are drawn. The conclusion of the contribution is that we have some knowledge about money laundering which could be the basis of an more effective fight against transnational crime organizations. Keywords Money laundering, organized crime, criminal economy, drug traffic JEL Classification E26 G28, F33, H26, K14, K42 1 ) email: [email protected] 2) Prof. Dr. Dr.h.c.mult. Friedrich Schneider, Department of Economics, Johannes Kepler University, Altenbergerstr. 69, A-4040 Linz, Austria, Phone: +43 (0)732 2468-7340, Fax: +43 (0)732 2468-7341, E- mail: [email protected], http://www.econ.jku.at/schneider
Transcript of Money Laundering: A Review Essay and Policy Implication€¦ · Money Laundering: A Review Essay...

1
Money Laundering: A Review Essay and Policy Implication
by
Raffaella Barone 1)
and
Friedrich Schneider 2)
Abstract:
This paper has three goals: First, some theoretical remarks about money laundering (the demand and supply
side) are made. Second, a quantitative analysis of money laundering and a preliminary review of the
empirical findings of the proceeds of transnational crime organizations worldwide as well as a breakdown of
the different types of crime proceeds are provided. Third, literature of anti-money laundering is offered and
policy conclusions are drawn. The conclusion of the contribution is that we have some knowledge about
money laundering which could be the basis of an more effective fight against transnational crime
organizations.
Keywords Money laundering, organized crime, criminal economy, drug traffic
JEL Classification E26 G28, F33, H26, K14, K42
1) email: [email protected]
2) Prof. Dr. Dr.h.c.mult. Friedrich Schneider, Department of Economics, Johannes Kepler University, Altenbergerstr. 69, A-4040 Linz, Austria, Phone: +43 (0)732 2468-7340, Fax: +43 (0)732 2468-7341, E-mail: [email protected], http://www.econ.jku.at/schneider

2
1. Introduction
Over the years, money laundering (ML) is a phenomenon that amounts to a considerable value. Just in
Europe, ML of the proceeds from drug traffiking produces a legal capital that ranges between US$ 71,5 bn
(0,44% of 2009 EU GDP), if the criminal sector launders money in South Eastern Europe, and US$bn 108.72
(0.67% of EU GDP in 2009), if the cleaning operation is undertaken in Eastern Europe. Even thought it
represents a standalone crime, ML is closely related to the corresponding upstream offences. Such originary
crimes produce a huge amount of illegal profits that needs to be laundered to minimize the transaction costs.
Indeed, the use of these illegal revenues could increase the probability of crime discovery and therefore of
incrimination.
There are several techniques used by organized crime or others money laundering experts, but all of them
share some common charateristics such as cash’s intensive use. Thus, the main legal business used as
laundering channel are gambling house, fuel stations, restaurants, real estate sector and so on.
In order to realize these laundering activities a key role is played by banking and financial intermediaries. All
the money laundered passes through the financial system and therefore, by definition, through banks. Thus,
the banking sector is often the focal point for anti-money laundering initiatives.
In this paper, we define the money laundering phenomenon, pointing out the demand side characteristics.
Then, it is proposed a survey of some money laundering techinques and it is provided a quantitative analysis
of the phenomenon. Finally, we suggest some policy implications.
2. Money laundering: a definition
What is money laundering? As Schneider and Windischbauer (2008) pointed out “the term ‘Money
Laundering’ originates from the US describing the Mafia's attempt to ‘launder’ illegal money via cash-
intensive washing salons, which where controlled by company acquisitions or business formations”.

3
Currently, there are several ML definitions, both from the juridicial and economic perspectives.
From the legal point of view, some differences exist depending on the country considered. For instance,
according to the italian penal code (art. 648-bis) “… whoever replaces or transfers money, assets, or other
utilities that originate from intentional offence, or he/she carries out other operations connected to them, in
order to prevent the detection of their illegal origin, shall be imprisoned for a period that ranges between four
and twelve years and sentenced to a fine of € 5000 or more, up to € 25000. The punishment will be increased
when the crime has been committed in the practice. …”.1 Moreover, with the law 15 december 2004 n. 186
the Senate introduced the self-laundring’s crime adding the art. 648-ter 1 that reports: “whoever having
committed or having contributed to commit an intentional offence, uses, replaces or transfers in economic,
financial, business or speculative activities, money, asstes or other utilities that originate from the fulfillment
of this crime, in order to prevent the detection of their illegal origin shall be imprisoned for a period that
ranges between two and eight years and sentenced to a fine between € 5000 and € 25000. …” 2.
Other legal definitions of money laundering are those of Dutch, German, Austrian, Swiss penal code and so
on (see Unger, 2007). Anyway, all of this have a common element: the camouflage of the illicit origin.
The US Department of Justice defines money laundering as “the process by which criminals conceal or
disguise the proceeds of their crimes or convert those proceeds into goods and services. It allows criminals
to infuse their illegal money into the stream of commerce, thus corrupting financial institutions and the
money supply, thereby giving criminals unwarranted economic power.” (FBI 2011). Further definitions of
ML are provided by acreditated institutions. According to International Monetary Fund, ML is a process that
1 The original text: “…chiunque sostituisce o trasferisce denaro, beni o altre utilità proveniente da delitto non colposo,
ovvero compie in relazione ad essi altre operazioni, in modo da ostacolare l’identificazione della loro provenienza
delittuosa, è punito con la reclusione da quattro a dodici anni e con la multa da 5000 a 25000 euro. ...”
2 The original text: “…Si applica la pena della reclusione da due a otto anni e della multa da euro 5.000 a euro 25.000
a chiunque, avendo commesso o concorso a commettere un delitto non colposo, impiega, sostituisce, trasferisce, in
attivita' economiche, finanziarie, imprenditoriali o speculative, il denaro, i beni o le altre utilita' provenienti dalla
commissione di tale delitto, in modo da ostacolare concretamente l'identificazione della loro provenienza delittuosa.
…”

4
allows to conceal the illicit source of assets obtained or produced by the criminal activity in order to hide the
link between funds and the original criminal activity.
The Financial Action Task Force (FATF) describes ML as the process that let to disguise the illicit origin of
the criminal profits. The cleaning-up allows to legalize and to freely employ the illegal proceed earned from
various crimes, e.g.: the sale of weapons, drug trafficking, smuggling, prostitution, corruption, insider
trading, cybercrime.
From the economic analisys prespective, ML takes the form of an activity which aim is to transform a
potential purchasing power flow into an effective one (Masciandaro, 1993). The proceed of an illegal activity
should be cleaned before being used, in order to decrease the probability to be discovered and convicted for
the commited crime.
Later, Masciandaro (1999) improved the ML definition pointing out two key features: lawlessness and
concealing. The first one identifies a peculiarity of all goods aim of laundering; the second one characterizes
the main objective of money laundering.
According to this definition, just the criminal economy’s revenues are subject to ML. Indeed, the so called
“underground economy”, that includes all kind of criminal counterlaw activity, is the ML object. Something
else is the whole legal activities, i.e. “shadow economy”, that avoid and are hidden both to revenue agencies
and justice. Such conduct produces the well known “grey money”, i.e. tax evasion (Schneider and
Windischbaurer, 2008).
Earlier, Lyssiotou et al. (2004) provided a broad definition of “black economy” generically involving all the
activities avoided to the revenue’s agencies. Actually, criminal proceed unavoidably will be hided to the
treasury. Nevertheless, contrary to tle legal revenues, the first one doesn’t positively add to the GDP of
countries.
5
3. Money Laundering: the players
In the illegal money laundering market, as in any other, it is possible to pinpoint both a demand and supply
side. Below we try to outline the persons concerned to the illegal activity in question.
Later, we will hilhight the main ML techniques used and the peculiarities of the people that consciously or
unwittingly, could be willing to offer this cleaning service and the related costs.
4.1. The demand side
According to the economic definition of ML, introduced in the previous section, a person that get an income
that is the result of unlawful businesses, is not able to freely use this one. Indeed, he/she has to reduce the
probability to be discovered and incriminated for the early offences. Therefore, he/she has to decide if and
how much of those proceeds must be cleaned. In the analysis of the decision making process followed by the
potential criminal, it is possible to take two approaches: the first one is the traditional criminologic view; the
second one is the rational approach. According to the first one, an individual could be influenced by the
social and cultural context that characterizes the living, working and social environment, when he has to
decide if committing or not an offence (Gilmour, 2016).
However, based on the economic analysis of crime, the rational approach à la Becker (Becker, 1968) is de
facto prevalent. According to it, a criminal rationally chooses to commit or not a crime based on a cost-
benefit analysis. The costs are the probability to be discovered and convicted for the crime committed, the
benfits are the expected illegal proceed.
This approach is well suited to be applied to several financial crimes, such as specifically money laundering
and usury credit. A model of rational choice is well disclosed in Masciandaro (1998). It assumes that an
individual represented by organized crime, has gotten an illegal revenue equals to W, and he/she has to
decide if and how much of such proceed should be cleaned.
6
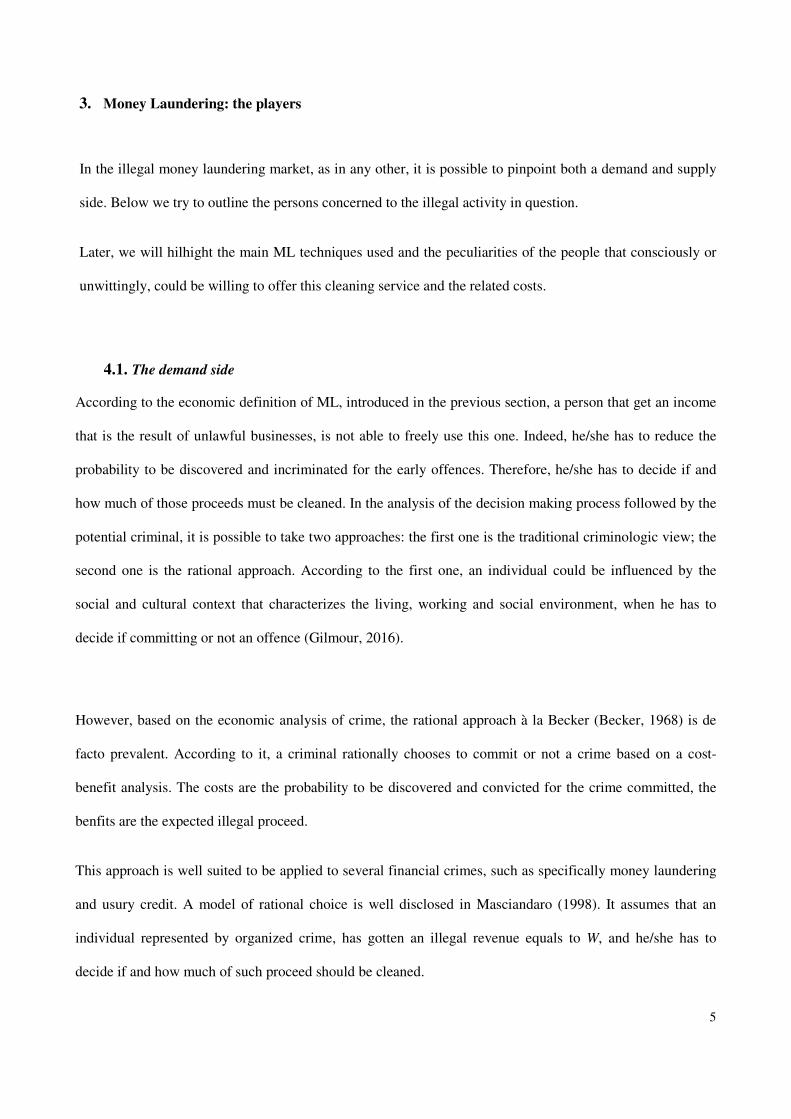
The criminal asses the cleaned money more than dirty money because he can freely use it. In particular, it is
hypothesized that dirty money ensures the hoodlum no-one utility. Since ML is not “a free lunch”, the
organized crime has to fix the maximum level of illegal money to be cleaned in order to maximize its
expected utility. To do it, first of all the benefit “B” and the cost “C” of the cleaning operation should be
evaluated.
The first one consists of the return originated from the reinvestment in the legal sector of the washed money
“Y” at the rate “r”. In formulas:
� = �1 + ��� = � (1)
where m is equal to (1+r).
However, if the cleaning-up activity should not be succesfull, because for example the crime was discovered,
then organized crime should both give back the cleaned amount and to pay a fee that is a multiplier of the
illegal capital to be cleaned. The organized crime’s expected utility will be:
��� = �1 − ��� − �� + �−� − �� (2)
Where C is the cost of money laundering, related to the amount of money that will be cleaned; T is the fine
that is a multiple of washed money; p is the probability to discover the crime.
Organized crime will choice the ML level “Y*” for wich the expected utility is maximum.
�����
��=
����������������������������
(3)
� = � − ���1 − � + �−� − 2!�� (4)
with

7
�∗ = ��������#��
(5)
The organized crime utility increases with the rise of the return resulting from the reinvestment in the legal
sector and decreases when the probability to be convicted and punished increases.
Fixed the optimum level of money to be laundered, i.e. to wich the expected utility is maximum, it is
possible to identify the boundary �′ beyond wich the utility will be negative. This value will be equal to:
�1 − �%�1 + ��� − ��& − ��� + !�#� = 0 (6)
So it results:
− � − + � − � − !� = 0 (7)
and
�� = ����������
(8)
Comparing the amount (of dirty money owned by the criminal with the boundary �′ it is possible to
estabilish that if > �′ , the amount ( − �′ will be not laundered. Otherwise if it results that ( < �′, all
black money should be cleaned.
8
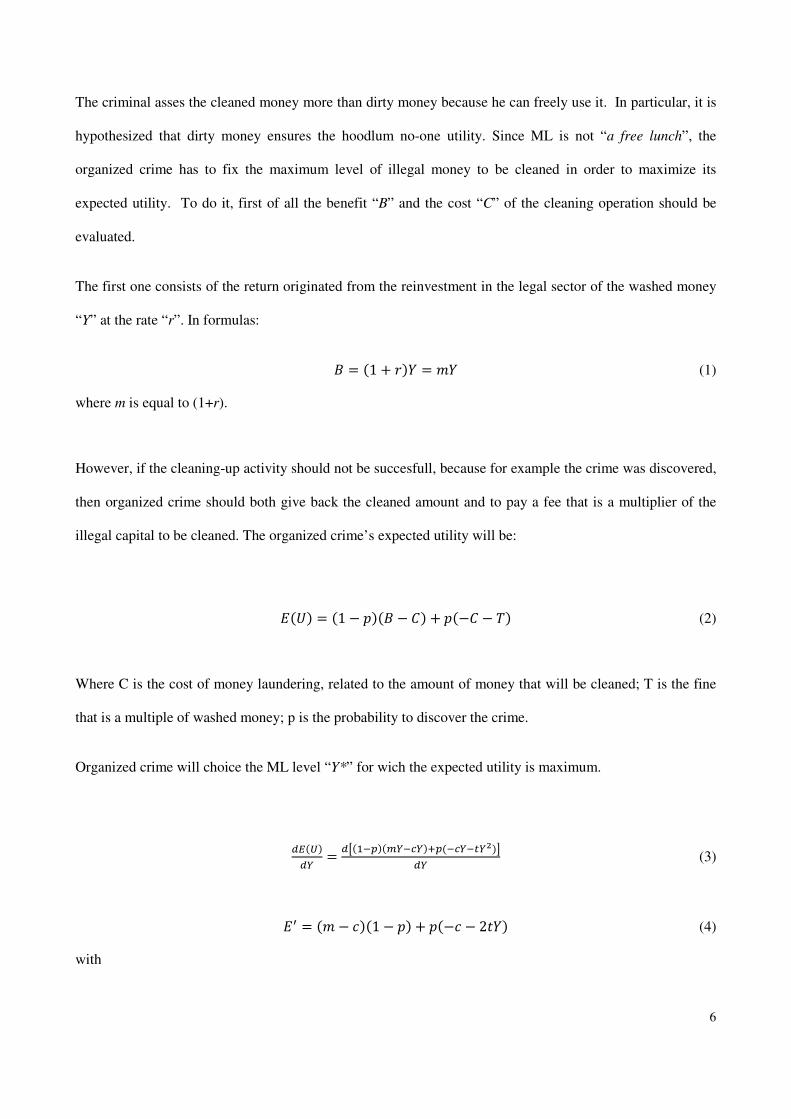
Fig.1 The expected utility of laundered money Once it is fixed the amount of dirty money that is suitable to launder, organized crime argues how to use this
value in consumptions, savings and investments. Speaking of wich Masciandaro (1999) suggested a
macroeconomic model in wich it is assumed that a share of cleaned money will be used again in the
illegalmarket. Nevertheless, the ML activity is not a free lunch, therefore we believe more plausible that such
step will be avoided. In Barone (2004), it is proposed the following model.
Let be: + = Illegal capital , = cleaned illegal capital - = legal capital Share of capital: . = capital to be laundered � = The cost of ML / = the share to be reinvested in the legal market. Rates of interest: �0: illegal rate �1: legal rate Furthermore, we will assume that, for reasons of caution, consumer goods can only be purchased with
laundered money.
At the beginning, we suppose to have an illegal capital +2. Part of it, .+2,will be cleaned up in order to be
used in the legal market; The other side, �1 − .�+2, will be re-invested in the illegal market. The laundering
operation of .+2costs, therefore the cleaned capital will be:
,2 = �1 − ��.+2 (9)

9
The share of its that will be invested in the legal market is /,2, whereas the remainder �1 − /�,2, will be
spent in consumption goods.
Therefore, after the first period, as a result of the investment, the legal capital, will be equals to:
-� = /�1 + �1�,2 (10) While the share of illegal capital �1 − .�+2, which has been reinvestited in the illegal market, will yeld an
overall return equals to:
+� = �1 − .�+2�1 + �0� (11) In the second period the legal capital originate from two sources: both from the capital-� and from the
capital +�, after the laundering operation.
-# = /�1 + �1��-� + ,�� (12) with ,� = �1 − ��.+�. This procedure could be iterated and the following formula will be achieved
-5 = /�1 + �1��-5�� + ,5��� (13) where ,5 = �1 − ��.+5 and analogously to equation (11):
+5 = �1 − .�+5���1 + �0� (14) This procedure could be depicted with the chart showed in the following page.
Formulas (13) and (14) make up a system of recurrence equations. The expression (14) could be easily
solved beginning by the starting condition +2 . Indeed, it will be:
+# = �1 − .�+��1 + �0� = +2�1 − .�#�1 + �0�# (15) In general, it results:
+5 = +2�1 − .�5�1 + �0�5 (16)
To solve equation (13), it proceeds with an iterative method, remembering that -2 = 0, and after a simple
algebra, it will achieve:
-5 = 6���78����9����7:��6���78�
.�1 − ��+2%�1 − .��1 + �0�&5 (17)

10
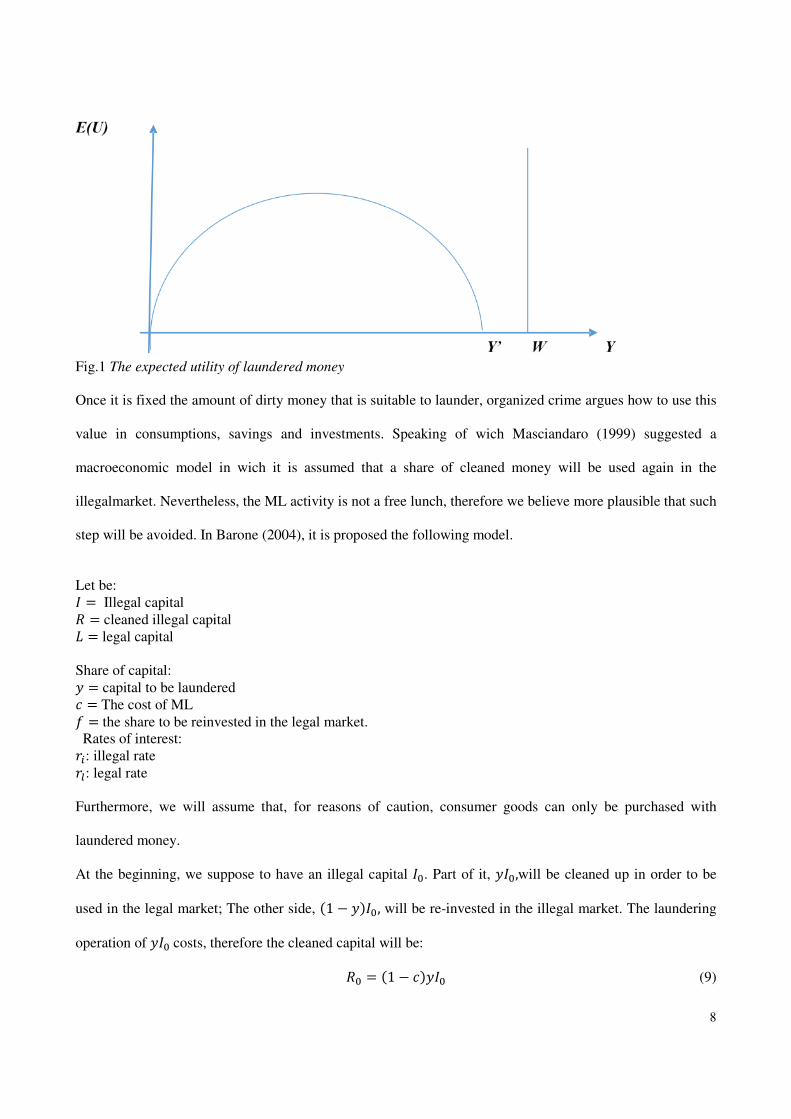
The amount of capital attributable to organized crime will be the result of the features of their ML process.
This model analyzed the effects of laundered capital’s reinvestment in the legal market, at the same time
taking account of dirty money’s reinvestment in the illegal sector. The overall flow of legalized capital will
be the result both of the initial illegal capital share that was laundered in order to be invested in the legal
sector and of the other side of illegal capital that was reinvested in the illegal sector before to be laundered.
An interesting result of this analysis is that legalized capital increases much more in consequence of an
increase in the illegal rate, than in the legal rate. Therefore, when the expected illegal activity return increase,
the produced amount of legalized capital will be greater. At the same time, the legal capital will be higher the
greater is the starting illegal capital and the smaller are the money laundering activity costs and the share of
initial illegal capital that should be cleaned.
As highlited in section 4, later this model has been revised and widen.

11
Fig. 2 The legal capital produced by the money laundering process
+0 Starting illegal capital
.+0 �1 − .�+0
,0= �1 − ��.+0 Starting laundered capital
+1 = �1 − .�+0�1 + �;�
�1 − /�,0 /,0 .+1 �1 − .�+1 Consumption goods ,1 = �1 − ��.+1
-1 = /,0�1 + �<� �1 − /�,1
Consumption goods
�1 − /�-1 /-1 /,1
-2 = /�1 + �<��-1 + ,1� +2 = �1 − .�+1�1 + �;�
12
4.2. The supply side
First of all, it is necessary to identify the phases that charatcterize the money laundering procedure
• The placement on the market of the criminal activities proceed, in order to be spent in consumption
goods and/or investment. Frequently the criminals resort to the use of financial intermediaries to hide
dirty money. However, since this stage is the riskiest, because of the large amount of dirty cash,
which is difficult to conceal, often criminals resort to shell companies or nominees, to convert the
cash in negotiable instruments such as traveler's checks, bank drafts, payment mandates (Buchanan,
2004). These indirect infiltration methods came up besides the direct methods that consist in
resorting to “smurfing”, in other words the splitting of the overall amount of illegal capital in smaller
parts, in order to avoid identification operations, reporting and data registration. To further reduce
the risk of discovery of the offense, sometimes persons concerned of money laundering, try to
establish a good trust relationship with financial intermediaries to don’t arose suspicion and possibly
to avoid any report to the authorities. If the relationship of trust should be hard to achieve, they try to
“corrupt” (Schneider and Windischbaurer, 2008, p. 395).
• The layering: this is the stage of dirty money laundering through finacial operations in order to
prevent the investigative reconstruction of financial flows.
• The integration: it consists in the reemployment of capitals in the legal economy thanks to the
services supplyed by experts. The recourse to expertees is aimed to prevent the opportunities for
investigators to carry out incisive inquirues that allow to prove the true ownership of assets. Some of
these skilled people are notaryes, layers, accountants, to financial intermediaries, banking and or
other financial intermediaries, often placed in countryes characterized by a legislation careful to the
safety of bank secrecy (so called tax haven), as well as nomineesThe fullfilment of these phases
needs that the producers of illegal money resort to several persons, making use of a varietyes of
available techinques. In the following we report some of these that are more frequently used (See
Unger, 2007a and Buchanan, 2004).

13
- The “smuggler”: whoever moves amounts of cash over the borders splitting them in several packs of
banknotes, concealing through a variety of thecniques. Emblematic is the case of Humberto Cuellar
illustrated by Bradley (2007). Cuellar was stopped a few miles from the border with Mexico. He was
driving a Wolswagen Beatle showing a suspicious seesawing course. Following inspection of his car
with the backing of canine units, the officers found a compartment hidden under the floorboard
containing $83.000 wrapped in thight packages that smell of marijuana. The cash was the result of
drug traffic operations and Cuellar was appointed to move money from United States toward Mexico
in order to leave no traces.
- The “front companies” utilized to implement counterfeit trade exchanges in order to conceal the
illegal proceed. When the activity relates to those activities free from billing and enrollment
requirements, these societies are easily used for money laundering purposes. Moreover, all those
activities that require huge amounts of cash, such as restaurants, travel agencies, liqueurs and
distillates sales, could be smoothly employed as front companies. The import/export companies too
could be used as front companies by means of double billing, under- or over-values of assets, and so
on.
- The “shell companies”, that is the societyes that don’t practice an actual business activity, don’t meet
the entrepreneurial needs, but they pursue other purposes. These companies could be used to open
banking accounts (Sharman 2010). A lot of the shell companies are located in off shore centres that,
as it is well known, are characterized by a tight bank secrecy legislation and lax anti money
laundering policies (Hines 2010). Therefore, several tax even countries are involved in the non
cooperative countries list (i.e. black list) drawed up by the Financial Action Task Force (FATF).
- Gambling House and gamble: the use of them for money laundering purposes could take place
according two manners. First of all, changing cash with fiches at the cashier. Later, fiches will be
reconverted receiving checks in return for them. These cheques will be deposited at financial
intermediaries. The other channel consists of a gambling house purchase. Being a high cash turnover
activity, a criminal could easily justify the origin of illegal profits by means of the legal activities
results. Just for example, as Centorrino (2009) pointed out, in september 2006, an inquiry of District

14
anti-mafia directorate (DDA) led to the arrest of thirteen gangsters, such people laundered at the
gambling house of Saint Vincen money coming from racket and other illicit traffikst.
- Usury credit: A peculiariy of Italy is that frequently organized crime grant a credit at usury in order
to launder dirty money. The lender is a criminal that uses his illicit funds to lend money and
moreover he takes advantage by this financial activity consisting of the opportunity to take over legal
firms or however the collateral. As reported in Barone (2004) given the aim of torganized crime, the
usury rate applyed to the loan is not necessarily higher than the legal one, but rather it could be
cheaper.
- Traveller’ cheque: the purchase of traveller cheque by means of dirty money is a profitable money
laundering technique. Being free of any specific duties, the usefulness of this method is due to the
easy portability of them beyond borders. Moreover, these cheque are generally issued by well known
and respected societies. Therefore, these instruments could be easily changhed with money without
instill suspiciouses and specific requests.
- The purchase of gold, diamonds, luxury goods, jevelleryes.
- Real estate market: the role of real estate market as dirty money laundering channel for organized
crime has been analyzed by international organization such as FATF, OECD and some national
governments. Research on this topic is focused on methodologies used by launderers trough real
estate market and on real cases. Frequently used methods consist in: - the resort to loans and
mortgages. An example of loans’ structure is the loan-back scheme, according to which a criminal
deposits dirty money into an account opened at a bank located in a tax haven and that he controls.
Then asks for a loan to his bank, providing as collateral the cash deposited in overseas accounts. –
The manipulation of the value of real estate properties; - Purchase of real estate properties as a
catalyst for other illegal activities. Often organized crime buy real estate in order to cultivate
narcotics, such as, cannabis or synthetic drugs. With the proceeds of the drugs’ sales, they purchase
new properties; - income originated from the leased property that are purchased by dierty money,
and so on.

15
- Financial intermediaries: Both banking and financial intermediaries, consciously or unwittingly,
play a key role in money laundering activity (see Europol, 2006, 2007, 2008; Donato and
Masciandaro, 2001). From the point of view of the laundering services supply, the financial sector
holds an interest because of two main features: A level of “opacity” greater than standard
(asimmetric information), because the exchange and purchase power flows are seeped, monitored
and supervised by skilled agents (financial intermediaries); a privileged position of these executives.
From the criminals’ point of view, the presence of operators willing to collude with them (polluted
intermediaries), and/or the existence of honest intermediaries that are not efficient in the safeguard of
the financial system integrity (lax intermediaries), makes easier the use of such sector for concealing
purposes (see Takatz, 2007, Masciandaro et al., 2007, Picard and Pieretti, 2009, Dalla Pellegrina and
Masciandaro, 2009). All the money laundered passes through the financial system and therefore, by
definition, through banks. Thus, the banking sector is often the focal point for anti-money laundering
initiatives. But banks are nothing more than the channel through which flows the money. Morris-
Cotteril (2001) made an analogy: pour a glass of water and fall inside a drop of ink. Gradually the
latter blends in with the water, dissolving up to the invisibility. That's the problem that banks face.
They are aware that in their system there is dirty money, but can not separate it from the clean
money. The dirty money is generally more visible once it has been introduced into the financial
system. As a result, the anti-money laundering laws often require bankers to identify their customers
adopting the so-called "know your customer" (KYC) rule. The latter law consists not just of the
knowledge and collection of names and addresses of bank’s customer but also it captures data on
background and activities.
4. The quantitative analysis
4.1. General remakrs and procedures
The estimate of the financial laundering of illicit gain is not easy since, by its very shadowy nature, data are
hard to come by. Nevertheless, this does not imply that it is impossible to provide an answer to this empirical
question. An assessment of the magnitude of the phenomenon is the starting point to draw an effective
prevention and counteraction policies.
16
In his paper “How Big is Global Money Laundering?” John Walker (1999) properly called to mind Stanley
Morris (1998), the retiring chairperson of the O.E.C.D.'s FATF Working Group on Statistics and Methods,
who pinpointed at least four reasons that justify the quantitative analysis of the phenomenon as a relevant
issue:
1) Realising the vastness of the crime in order to allow the national and international autorities to agree
on the antimoneylaundering regulation’s draft;
2) evaluate the effectiveness of anti-money laundering policies, providing guidelines and measurement
scales;
3) get the macroeconomic effects of money laundering, in particular assessing the negative effects
produced by the phenomenon both on financial institutions and the economy; the adverse effects on
fiscal pressure and the outlook for fiscal policy; contamination in some trades and a change in the
behavioral expectations of market actors; speculative bubbles and so on.
4) Understanding money laundering in order to discern the various items that compose it and
participate to the quantitative analysis.
Nevertheless, two years after the issue of quantifying the phenomenon has raised, the experts of the Group
had not yet defined a methodology. In the meantime, John Walker discloused a model of criminal economy
that resembles an interregional input-output economic model. The author used a range of publicily available
crime statistics to estimate the amount of money generated by illegal activities in 226 countries. Later, he
used various socio-economic indicators to estimate the proportion of dirty money that is laundered, and the
destination countries the corresponding funds are sent for laundering. The databases used as source of data
were mainly: “UN Survey on Crime Trends and the Operations of Criminal Justice Systems”, that provide
informations on some crimes that, every year are reported to the authorithies (homicide, domestic violence,
robbery, corruption, rape, embezzlement, theft, burglary, both drugs’ trafficking and possession);
"International Crime Victims Survey"; corruption and laundering perception indicators – as those compiled
by "Transparency International" or the '' Australian Office of Strategic Crime Assessments in Canberra ";
17
geographical, economic, demographic, commercial and business at national and international level. Grouping
the data togheter he was able to estimate the size of money laundering and to make a comparison between
countries, assessing the share of each country. Then, the author analyzed how much of the dirty money will
be cleaned in the originary country (namely the country where the original offense was committed) and how
much in other countries.
The amount of money that will be laundered in every country will depend on some factors. First of all, by the
type of crime and its degree of diffusion that characterizes each country. The countries that, more than
others, run the risk of money laundering are characterized by higher crime rates or where the committed
offences allow to get high profits.
He defined an “attractiveness index to money launderers
”Attractiveness to Money Launderers = [GNP per capita]× [3 × BankSecrecy + Gov Attitude+ SWIFT
member - 3 × Conflict
- Corruption + 15]”
that express the attitude of countries towards ML, the bank secrecy law, GDP and the level of corruption.
Indeed, it is assumed that each point in the scale of corruption correspond to a percentage of 20% of dirty
money cleaned domestically. Therefore, countries characterized by a high level of corruption, launder within
approximately 80-100% of dirty money produced in the same economy. It is also assumed that criminals
prefer countries with high GDP per capita because it allows them to hide more easily the cleaned up money.
Other things being equal, geographic distance and linguistic or cultural differences are considered as
deterrents to money launderers.
This indicator, that looks artificially created and lacking a background model, suggests as less actrative
countries such as: Cameroon, Bhutan, North Korean, Ivory Coast, Federal States of Micronesia, Kiribati,
Tuvalu, Papua New Guinea, Zimbabwe, Western Sahara, Iran, Cape Verde, Senegal, Egypt, Peru, Sri Lanka,
Djibouti, Mongolia, Solomon Islands, Zambia, Lesotho, Yemen, Comoros, Sao Tome, Maldives, Benin,
Nicaragua, Pakistan, Guyana, Burkina Faso, Nigeria, Equatorial Guinea, Mauritania, Gambia, Myanmar,

18
Guinea, China, Ghana, Haiti, Vietnam, Madagascar, Kenya, Togo, Tadzhikistan, India, Central African
Republic, Sudan, Tanzania, Mali, Laos, Niger, Malawi, Uganda, Guinea Bissau, Nepal, Angola, Bangladesh,
Liberia, Democratic Republic of Congo, Cambodia, Rwanda, Mozambique, Ethiopia, Afghanistan, Burundi,
Sierra Leone, Chad, Antarctica, Europa Island.
Instead, the more actractive countries are: Luxembourg, the US, Switzerland, Cayman Islands, Austria,
Liechtenstein, Netherlands, Vatican City, UK, Singapore, Hong Kong, Ireland, Bermuda.
Italy (along with Bahrain, Qatar, Taiwan, United Arab Emirates, Barbados, Malta, France and Cyprus) has
an average low attractiveness level.
Nevertheless, from his analysis, it resulted that US choose to clean up at home (accounting for an 18.5% of
the total). They also clean a small share, equal to 4.6% of the total, in the Cayman Islands. Both Russia and
Italy clean up in their own country, accounting for 4.2% and 3.3%. Italy cleans even in Vatican City.
Initial output of the model suggested an estimate for global money laundering of $2.85 billion a year, heavily
concentrated in Europe and North America. However, the author pointed out that his results are just
provisional estimates.
Earlier than Walker also other researchers have provided a money laundering estimate. The pioneering
studies were those of Tanzi (1996, 1997 pp.91-104) and Quirk (1996, 1997). The latter also assessed the
impact that an increment in the financial laundering produces in terms of reducing annual GDP. Specifically,
it noted that a 10% increase in laundering produces a 0.1%reduction of the annual GDP.
Michel Camdessus, at that time Managing Director of the International Monetary Fund, in a FATF report
said that the amount of financial laundering is about 2-5% of global GDP. But unfortunately it is not
explained how it comes to this result (Camdessus, 1998).
Later, Unger (2007a) noted that Walker’s formula resembles Tinbergen’s gravity model. She compared
Walker’s formula to the original gravity model and she modified the attractiveness index, including
additional variables (the amount of financial deposits, and being a member of Egmont group or not). In 2009,
19
Unger and Walker used the revised formula to estimate the percentage of dirty money flowing to the
Netherlands from several countries. It resulted that Netherlands would be more attractive for launderers
based in foreign countries if it had a higher GDP per capita, if it had high bank secrecy, if it had the
technological means to transfer money quickly and if it had low conflict and corruption so that criminals do
not have to fear losing their laundered money. Indeed, the lower the distance between countries, the higher is
ML (Walker and Unger, 2009). According to their analysis Unger et al. (2006), showed in 2005 that the total
money laundered in the Netherlands was €14.783 billion. The main countries, exporters of dirty money, are
the United States, Italy, Russia, Germany, the United Kingdom and France. Considering also the laundering
of the proceeds of Dutch crime, we must add another 4 billion euros. In other words, Netherlands is
confronted with about €18.5 billion Euro of ML each year (about 5 percent of Dutch GDP). Primarly, the
Netherland would seem to be a transfer country for money laundering. The laundered money mainly turns up
into the Netherlands Antilles, Colombia, Turkey, Spain, Suriname.
Schneider (2010) estimated the turnover of organized crime during the years 1995-2006 for 20 OECD
countries. He used an indirect method, applying a MIMIC procedure based on the statistical theory of
unobservable latent variables (turnover of organized crime, in this case). To estimate criminal turnover, the
author used eight causing variables (five of which are statistically significant; namely: criminal activities
such as drug traffic, illegal weapon selling, trafficking of human beings, the faking of products, and the
functioning of the legal system) and three indicators (confiscated money, number of prosecuted persons, cash
used in criminal activities). For the variables, he assumed that the turnover of organized crime was higher the
greater is the frequency of criminal activities that take place in a country; worse is the quality of the legal
system. For the indicator variables, he assumed that the turnover of organized crime was positively
correlated with the amount of confiscated money, the cash used in criminal activities, and the number of
prosecuted persons. The results were that the turnover of organized crime activities increased from $270
billion in 1995 to $614 billion in 2006 in the total of 20 OECD countries considered. In the same work, he
wrote, however, that “these are very rough, preliminary calculations”.

20
Barone and Masciandaro (2011) proposed a dynamic model to address the following question: how to
measure the role of money laundering in determining the weight of organized crime in the European legal
economy? In general, it is well recognized that when organized crime increases its weight, it constitutes a
major threat for the development of the legal economy.
The authors analyzed the relationship between organized crime and money laundering focusing on a specific
aspect: the effects on the extent of legal assets owned by organized crime. The results of the simulation are
that the legal reinvestiment will increase: when the illegal return is higher; when the share of illegal capital to
be laundered decreases; when the initial illegal capital increases; and last but not least, when the level of
laxity in anti-money laundering regulation increases. The paper highlights as money laundering allows the
criminals not only to make consumption choices but also to invest cash in the legal and illegal sectors.
Organized crime have the opportunity to clean dirty money at home or abroad, depending on the laundering
costs. Focusing on Europe, Western and Central European illegal profits can be better washed in Eastern or
South Eastern Europe or in general abroad, in countries where anti money-laundering regulation is more lax.
If the cleaning operation is undertaken in Eastern Europe, the legal assets produced by money laundering
operation amount to US$bn 108.72 (0.67% of EU GDP in 2009), while if the criminal sector launders money
in South Eastern Europe he produces a legal capital equal to US$ 71.5 billion (0.44% of EU GDP in 2009).
Assuming that the money laundering technology is fixed, the choice will depend on the cost of anti money
laundering regulation, given that the legal regulations and their enforcement increase the transaction costs.
Ardizzi et al. (2014) tried to estimate ML for Italy, observing 91 provinces over the period 2005-2008. In
particular, they intended to answer the question: “How much cash deposited in legal financial institutions
can be traced back to criminal activities?”
It should be observed that a lot of illegal proceed that require to be laundered are cash. Indeed, cash money,
unlike other payment instruments, guarantees anonymity. The banknotes pass from hand to hand without
leaving any trace, and reducing the transparency of banking and financial systems. In Europe since mintage
to date, the amount of euro in circulation has doubled and since 2002, banknotes are legal tender.

21
The authors’ idea was firstly to separate the money deposited in legal financial institution in three parts: the
amount of dirty money proceeding from criminal activities (ML component), legal deposits, and illegal
money coming from tax evasion. In order to do this separation, they borrowed a theoretical model from
Masciandaro et al. (2007). Secondly, they defined the criminal activities that generate the illegal profits to be
laundered. They included illegal traffics and extortion. The results showed that dirty money accounts for a
7.5% share of GDP in the North, and 5.1% in the South. In particular, the percentage of dirty money to be
laundered resulting from illegal traffics amounted to 6.3% in the North and 3.4% in the South. In the case of
extortion, the results were reversed, with 1.2% in Northern Italy and 1.7% in Southern Italy.
Nevertheless, in all the analyses considered so far, there has been a limited interest in the relationship
between illegal markets, money laundering and the business cycle. However, as facts and anecdotal evidence
suggest such a relationship exists (see “The Observer”, 2009 and Ivanov, 2011).
With respect to previous literature, Barone et al. (2017) propose an innovative model where it is assumed
that the business cycle can influence illegal markets via two different channels. On the one side, illegal
markets grow at varying rates depending on the status of the legal economy. Secondly, a pass-through effect
can occur, since the business cycle influences legal markets that illegal operators make use of to reinvest
their profits.
The model was based on the assumption of a “saturation effect” (or “carrying capacity”) for maximum
illegal capital that the corresponding market can sustain. The model is tested using international data on drug
trafficking from 1998 to 2008.
The main results of the analysis were that growth in cumulative illegal capital is currently decelerating. In
particular, sic stantibus rebus, it will reach its limiting value of nearly US$ 16 trillion very far into the future.
Moreover, by means of money laundering activities, the illegal sector is annually able to disguise criminal
proceeds in the legal market for an amount equal to a multiplier of corresponding illegal capital. This factor
ranges between a maximum value near 16.5 in 1981 and a minimum of 4 forecasted for 2020, corresponding
to legal capital due to criminal activities of nearly US$ 1.2 trillion (about the GDP of Spain in 2015, at
22
current prices) for that year. Another main result was that as legal capital accumulated by organized crime
shows a decelerating growth trend, the stagnation assumption can be said to hold also for the illegal
economy. The authors forecast that it will reach a value of nearly US$ 120 trillion in 2020.
The quantitative analysis of money laundering phenomen not just meets up scientists that are in favor of the
production of estimates, albeit partial and not error-proof. There are also those who oppose it on grounds of
unreliability.
Among skeptics are Reuter (2013) and Van Duyne (2006, pp. 177–205; 2007, pp. 69–98) who believe that
any attempt to estimate ML is weak because of the lack of data. Levi (2012, pp. 595–622) criticizes the
estimates of ML for being nothing more than “speculative guesstimates”. However, in 1994 Levi, in a joint
paper with Gold tried to estimate financial ML analyzing suspicious financial operations. Despite of
criticism, as Kruisbergen et al. (2015) have observed, many of these estimates are frequently cited, becoming
“facts by repetition” (Levi and Reuter, 2009, pp. 356-380).
4.2. Transnational crime proceeds3 - worldwide and regional figures
In this subkapitle we present some empirical figures of transnational crime proceeds. We are aware thte the
criticism mode in subkapitle 4.1. also is valid in the part. “Dirty” money from crime is earned through
various underground activities, like drug and weapon dealing as well as human trafficking. How much illicit
crime money in all its forms can be observed?4 The most widely quoted figure for the extent of money
laundering criminal proceeds is the IMF consensus range of 2.0% to 5.0% of global GDP in 1998 (compare
IMF, 2001 and UNODC, 2011).
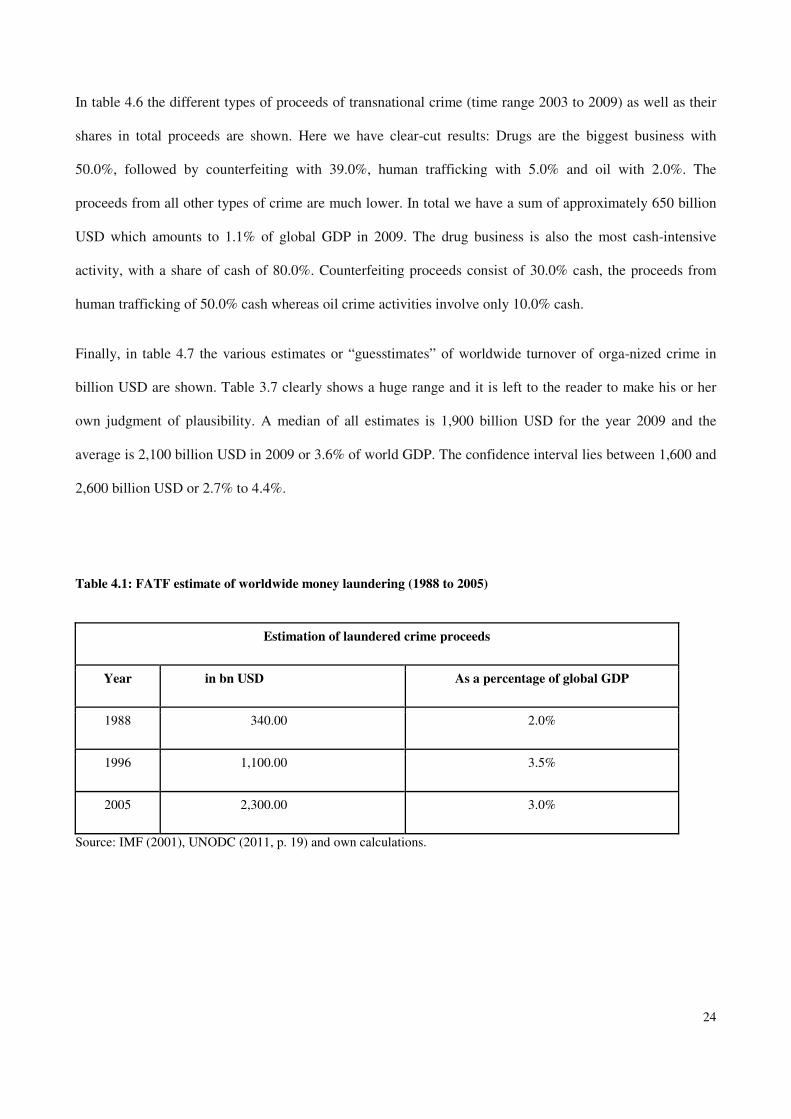
In the tables 4.1 and 4.2 the FATF estimates as well as the IMF estimates of worldwide mon-ey laundered
for a similar period are shown (FATF estimates for 1988 to 2005 and IMF esti-mates for the period 1996 to
3 For a detailed analysis see Schneider (2008a, 2008b, 2009, 2010a, 2010 b, 2011, and 2013, 2015), Schneider and Windischbauer (2008), Schneider, Dreer and Riegler (2006), and Takats (2009).
4 Smith (2011) estimates that this amount is 1.5 trillion USD per year. However, these estimates are more guesstimates, because no clear sources are given and, even more importantly, the procedure of calculation is not shown and critically discussed.
23
2009). Considering first the FATF estimates, the amount of worldwide money laundering is 2.0% in 1988,
which increased to 3.5% in 1996 and decreased again to 3.0% in 2005. The IMF estimates vary between
2.0% and 5.0% over the period 1996 to 2009. In absolute terms the worldwide money laundered increased by
36.0% from 1996 to 2005 and by 33.0% from 2005 to 2009, which is quite a strong increase. These FATF or
IMF figures are more or less in a similar range.
In table 4.3 the FATF estimates of global amounts of laundered money up to the year 2009 are shown. The
FATF model of global amounts laundered starts with an estimate of drug sales and from this estimate the
total amounts laundered from all criminal proceeds are calculated. For the year 2003 the FATF estimate of
the total amounts laundered (from all criminal pro-ceeds) is 880 billion USD or 2.4% of world GDP.
Extrapolated to the year 2009, the calcula-tion reaches 1.4 trillion USD.
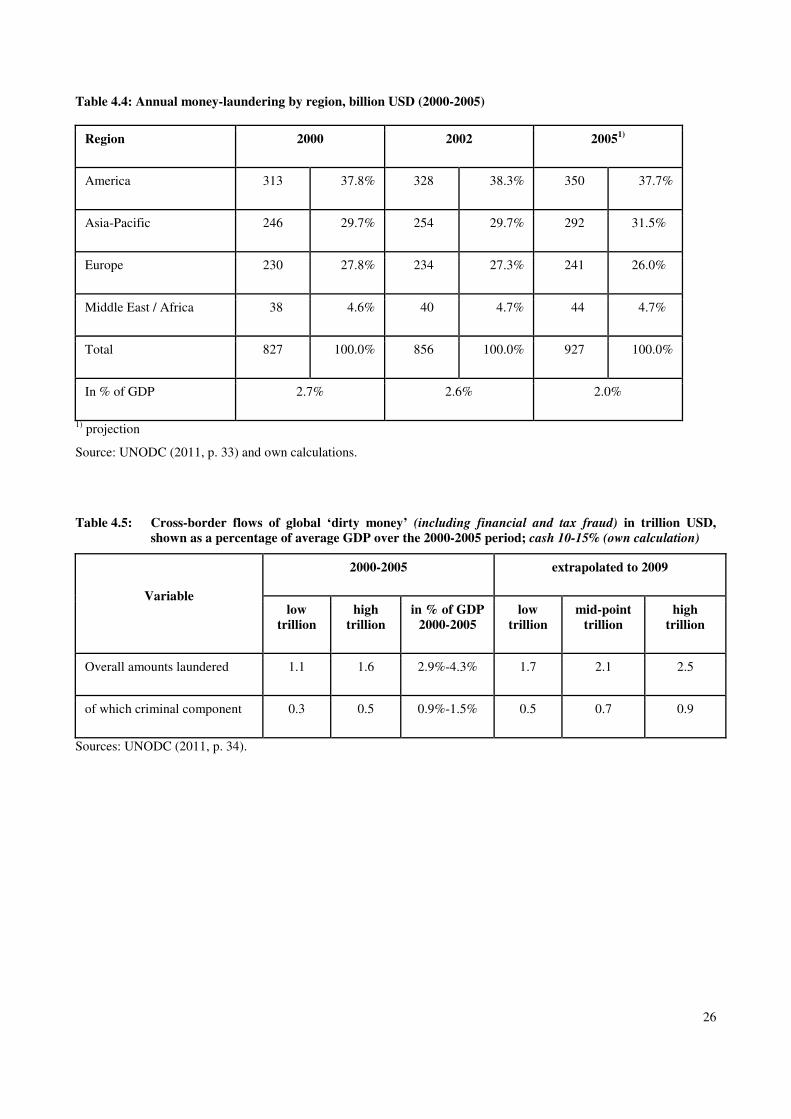
In table 4.4 money laundering by region is shown over the period 2000 to 2005. North and South America
have by far the biggest share with 37.8% in 2000, which remains more or less constant up to 2005, with
37.7%. Then the region Asia Pacific follows with a modest increase in the share of money laundering from
29.7% in 2000 to 31.5% in 2005. The share in total money laundering of Europe slightly decreased; it was
27.8% in 2000 (of all money laundered proceeds) and declined to 26.0% in 2005.
In table 4.5 the cross-border flows of global “dirty money” in trillion USD are shown over the period 2000 to
2005 on a worldwide basis. This includes financial and tax fraud money and all money which leaves a
country due to some criminal reason. Table 3.5 shows that the overall amount of dirty money laundered
varies between 1.1 and 1.6 trillion USD between 2000 and 2005 and increases to 1.7 to 2.5 trillion USD in
the year 2009. This is quite a large sum which accounts for a range of 2.9% to 4.3% of the world GDP.
Moreover, 10.0%-15.0% of this sum is used in the form of cash. The classical criminal component lies only
between 27.0% and 31.0% of the total dirty money. Hence, one clearly realizes that capital flight and tax
fraud money is by far the biggest proportion of dirty money5.
5 Compare also Pickhardt and Prinz (2012).
24
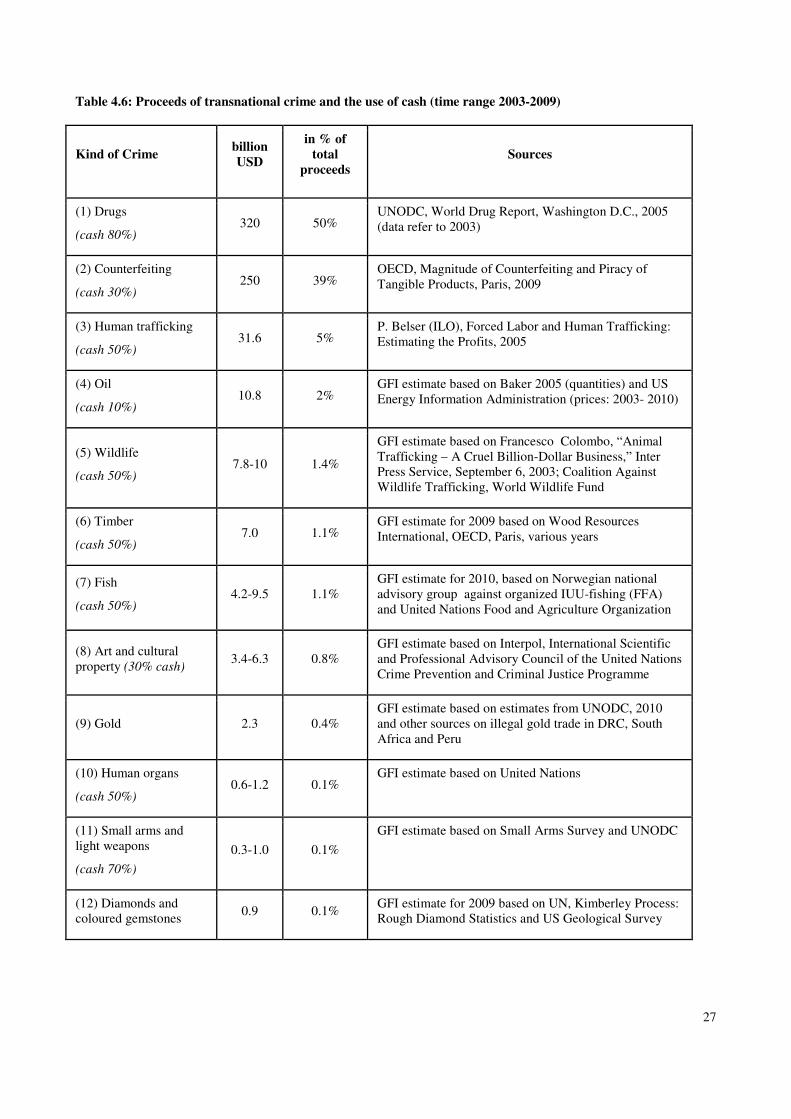
In table 4.6 the different types of proceeds of transnational crime (time range 2003 to 2009) as well as their
shares in total proceeds are shown. Here we have clear-cut results: Drugs are the biggest business with
50.0%, followed by counterfeiting with 39.0%, human trafficking with 5.0% and oil with 2.0%. The
proceeds from all other types of crime are much lower. In total we have a sum of approximately 650 billion
USD which amounts to 1.1% of global GDP in 2009. The drug business is also the most cash-intensive
activity, with a share of cash of 80.0%. Counterfeiting proceeds consist of 30.0% cash, the proceeds from
human trafficking of 50.0% cash whereas oil crime activities involve only 10.0% cash.
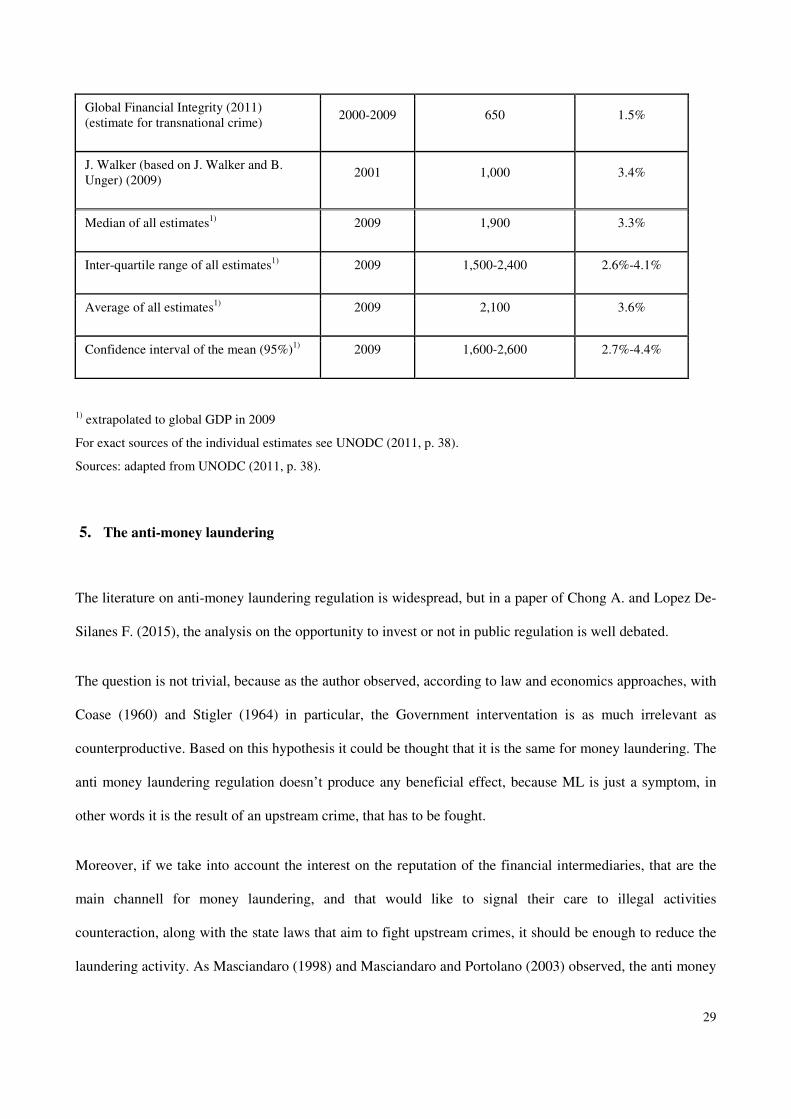
Finally, in table 4.7 the various estimates or “guesstimates” of worldwide turnover of orga-nized crime in
billion USD are shown. Table 3.7 clearly shows a huge range and it is left to the reader to make his or her
own judgment of plausibility. A median of all estimates is 1,900 billion USD for the year 2009 and the
average is 2,100 billion USD in 2009 or 3.6% of world GDP. The confidence interval lies between 1,600 and
2,600 billion USD or 2.7% to 4.4%.
Table 4.1: FATF estimate of worldwide money laundering (1988 to 2005)
Estimation of laundered crime proceeds
Year in bn USD As a percentage of global GDP
1988 340.00 2.0%
1996 1,100.00 3.5%
2005 2,300.00 3.0%
Source: IMF (2001), UNODC (2011, p. 19) and own calculations.

25
Table 4.2: IMF estimates of laundered money, worldwide (1996 to 2009)
Estimation Minimum Mid-point Maximum Increase in %
IMF estimates of money laundered as a percentage of global GDP
2.0% 3.5% 5.0% –
Estimate for 1996 in billion USD 600 1,100 1,500 –
Estimate for 2005 in billion USD 900 1,500 2,300 36.0%
Estimate for 2009 in billion USD 1,200 2,000 2,900 33.0%
Source: UNODC (2011, p. 19).
Table 4.3: Updated FATF model of global amounts laundered
Estimate of drug sales in key markets (1988) 124 bn USD
As a percentage of global GDP (1988) 0.8%
Estimate of drug sales in key markets (UNODC estimate for 2003) 322 bn USD
As a percentage of world GDP 0.9%
Assumed proportion that is laundered (initial FATF estimate) 66 – 70%
Estimate of amounts laundered related to drugs (2003) 220 bn USD
Proportion in % of global GDP (2003) 0.6%
Estimated proportion of drugs in total amounts laundered (initial FATF estimate)
25.0%
Estimated total amounts laundered in 2003 880 bn USD
As a percentage of GDP 2.4%
Extrapolated to global GDP in 2009 1.4 trillion USD
Sources: UNODC (2011, pp. 31-32).
26
Table 4.4: Annual money-laundering by region, billion USD (2000-2005)
Region 2000 2002 20051)
America 313 37.8% 328 38.3% 350 37.7%
Asia-Pacific 246 29.7% 254 29.7% 292 31.5%
Europe 230 27.8% 234 27.3% 241 26.0%
Middle East / Africa 38 4.6% 40 4.7% 44 4.7%
Total 827 100.0% 856 100.0% 927 100.0%
In % of GDP 2.7% 2.6% 2.0%
1) projection
Source: UNODC (2011, p. 33) and own calculations.
Table 4.5: Cross-border flows of global ‘dirty money’ (including financial and tax fraud) in trillion USD,
shown as a percentage of average GDP over the 2000-2005 period; cash 10-15% (own calculation)
Variable
2000-2005 extrapolated to 2009
low
trillion high
trillion in % of GDP
2000-2005 low
trillion mid-point
trillion high
trillion
Overall amounts laundered 1.1 1.6 2.9%-4.3% 1.7 2.1 2.5
of which criminal component 0.3 0.5 0.9%-1.5% 0.5 0.7 0.9
Sources: UNODC (2011, p. 34).
27
Table 4.6: Proceeds of transnational crime and the use of cash (time range 2003-2009)
Kind of Crime billion
USD
in % of
total
proceeds Sources
(1) Drugs
(cash 80%) 320 50%
UNODC, World Drug Report, Washington D.C., 2005 (data refer to 2003)
(2) Counterfeiting
(cash 30%) 250 39%
OECD, Magnitude of Counterfeiting and Piracy of Tangible Products, Paris, 2009
(3) Human trafficking
(cash 50%) 31.6 5%
P. Belser (ILO), Forced Labor and Human Trafficking: Estimating the Profits, 2005
(4) Oil
(cash 10%) 10.8 2%
GFI estimate based on Baker 2005 (quantities) and US Energy Information Administration (prices: 2003- 2010)
(5) Wildlife
(cash 50%) 7.8-10 1.4%
GFI estimate based on Francesco Colombo, “Animal Trafficking – A Cruel Billion-Dollar Business,” Inter Press Service, September 6, 2003; Coalition Against Wildlife Trafficking, World Wildlife Fund
(6) Timber
(cash 50%) 7.0 1.1%
GFI estimate for 2009 based on Wood Resources International, OECD, Paris, various years
(7) Fish
(cash 50%) 4.2-9.5 1.1%
GFI estimate for 2010, based on Norwegian national advisory group against organized IUU-fishing (FFA) and United Nations Food and Agriculture Organization
(8) Art and cultural property (30% cash)
3.4-6.3 0.8% GFI estimate based on Interpol, International Scientific and Professional Advisory Council of the United Nations Crime Prevention and Criminal Justice Programme
(9) Gold 2.3 0.4% GFI estimate based on estimates from UNODC, 2010 and other sources on illegal gold trade in DRC, South Africa and Peru
(10) Human organs
(cash 50%) 0.6-1.2 0.1%
GFI estimate based on United Nations
(11) Small arms and light weapons
(cash 70%)
0.3-1.0 0.1%
GFI estimate based on Small Arms Survey and UNODC
(12) Diamonds and coloured gemstones
0.9 0.1% GFI estimate for 2009 based on UN, Kimberley Process: Rough Diamond Statistics and US Geological Survey

28
Table 4.6 continued
Kind of Crime billion
USD
in % of
total
proceeds Sources
Total (1)-(12) (midpoint estimates)
645 100.0% Own calculations
Total (1)-(12) rounded 650 - Own calculations
In % of global GDP in 2009
1.1% - Own calculations
In % of average global GDP, 2000-2009
1.5% Own calculations
Sources: UNODC (2011, p. 36) and own remarks.
Table 4.7: Estimates of worldwide turnover of organized crime, billion USD and as a percentage of GDP
Origin/study Year Volume in bill USD
(worldwide) as a per-centage
of global GDP
M. Schuster 1994 500-800 0.9% - 3.0%
International Monetary Fund and Interpol 1996 500 1.6%
UN estimates 1994/98 700-1,000 2.4%-3.4%
S. Kerry 1997 420-1,000 1.4%-3.3%
J. Walker 1998 2,850 9.5%
National Criminal Intelligence Service
1998 1,300 4.3%
2001 1,900 5.9%
2003 2,100 5.6%
E. Takats (2009) 2005 600-1,500 1.3%-3.3%
J.D. Agarwal and A. Agarwal (2006) 2005 2,000-2,500 4.4%-5.5%
29
Global Financial Integrity (2011) (estimate for transnational crime)
2000-2009 650 1.5%
J. Walker (based on J. Walker and B. Unger) (2009)
2001 1,000 3.4%
Median of all estimates1) 2009 1,900 3.3%
Inter-quartile range of all estimates1) 2009 1,500-2,400 2.6%-4.1%
Average of all estimates1) 2009 2,100 3.6%
Confidence interval of the mean (95%)1) 2009 1,600-2,600 2.7%-4.4%
1) extrapolated to global GDP in 2009
For exact sources of the individual estimates see UNODC (2011, p. 38).
Sources: adapted from UNODC (2011, p. 38).
5. The anti-money laundering
The literature on anti-money laundering regulation is widespread, but in a paper of Chong A. and Lopez De-
Silanes F. (2015), the analysis on the opportunity to invest or not in public regulation is well debated.
The question is not trivial, because as the author observed, according to law and economics approaches, with
Coase (1960) and Stigler (1964) in particular, the Government interventation is as much irrelevant as
counterproductive. Based on this hypothesis it could be thought that it is the same for money laundering. The
anti money laundering regulation doesn’t produce any beneficial effect, because ML is just a symptom, in
other words it is the result of an upstream crime, that has to be fought.
Moreover, if we take into account the interest on the reputation of the financial intermediaries, that are the
main channell for money laundering, and that would like to signal their care to illegal activities
counteraction, along with the state laws that aim to fight upstream crimes, it should be enough to reduce the
laundering activity. As Masciandaro (1998) and Masciandaro and Portolano (2003) observed, the anti money
30
laundering law is costly because of the negative impact on the banking efficiency. They proved it in an
analysis of the Italian rule development and proposed a generalized model that support their theory.
On the other side there are those that assert the effectivness of the state law (among them Landis, 1938)
because of its usefulness in the illegal activities control. This approach supposes that the basic legal
framework that controls the crime is not enough to control the money laundering because the incentives to
implement the cleanup activities can be much stronger than the long-term benefits that can be achieved with
honesty. Furthermore, as higlited by La Porta et al. (2006) the trials can be unpredictable and too expensive
to be a deterrent.
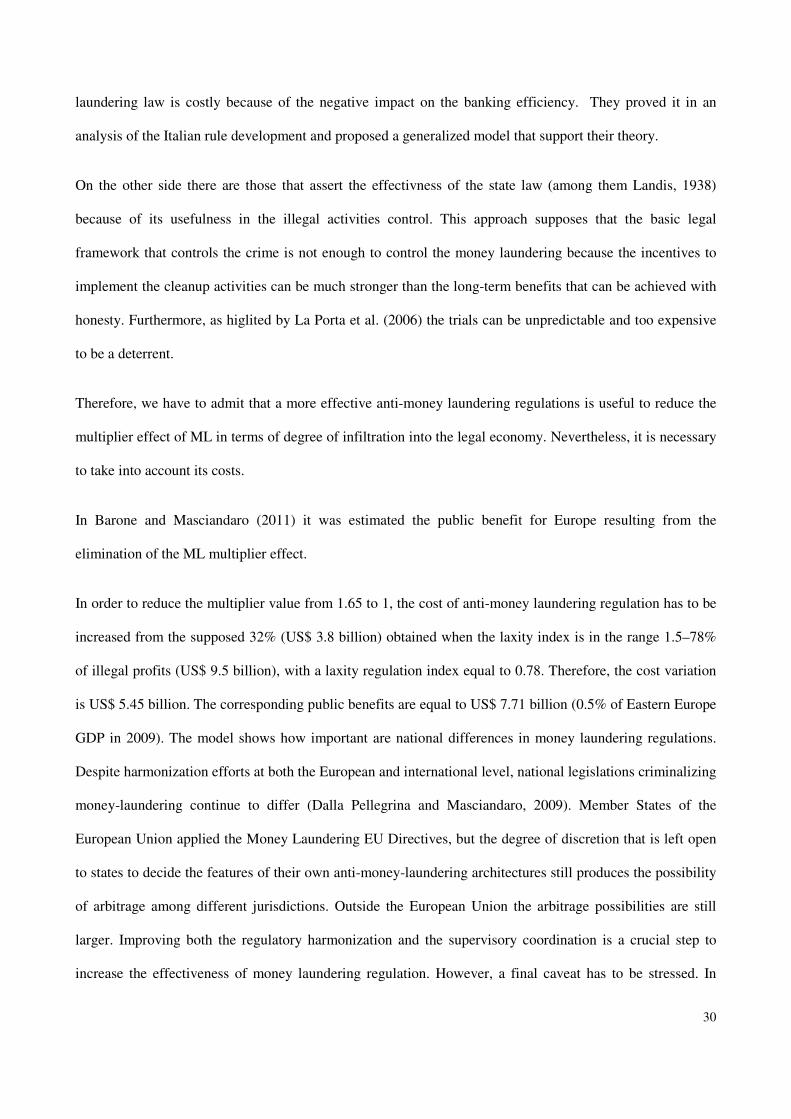
Therefore, we have to admit that a more effective anti-money laundering regulations is useful to reduce the
multiplier effect of ML in terms of degree of infiltration into the legal economy. Nevertheless, it is necessary
to take into account its costs.
In Barone and Masciandaro (2011) it was estimated the public benefit for Europe resulting from the
elimination of the ML multiplier effect.
In order to reduce the multiplier value from 1.65 to 1, the cost of anti-money laundering regulation has to be
increased from the supposed 32% (US$ 3.8 billion) obtained when the laxity index is in the range 1.5–78%
of illegal profits (US$ 9.5 billion), with a laxity regulation index equal to 0.78. Therefore, the cost variation
is US$ 5.45 billion. The corresponding public benefits are equal to US$ 7.71 billion (0.5% of Eastern Europe
GDP in 2009). The model shows how important are national differences in money laundering regulations.
Despite harmonization efforts at both the European and international level, national legislations criminalizing
money-laundering continue to differ (Dalla Pellegrina and Masciandaro, 2009). Member States of the
European Union applied the Money Laundering EU Directives, but the degree of discretion that is left open
to states to decide the features of their own anti-money-laundering architectures still produces the possibility
of arbitrage among different jurisdictions. Outside the European Union the arbitrage possibilities are still
larger. Improving both the regulatory harmonization and the supervisory coordination is a crucial step to
increase the effectiveness of money laundering regulation. However, a final caveat has to be stressed. In

31
highlighting the relationship between money laundering costs and the effectiveness of anti-money-laundering
regulations, we postulated the causal link that a more effective regulation produces increasing costs for
criminal organizations.
Otherwise a ML counter action may consist in the fight against the upstream offences of wich ML is just the
final result. From this point of view, legalizing drugs market is an opportunity to reduce criminal
organizations’ profits. Block (1996) claims that “there is nothing in positive economics that preclude
legalizing drugs”. In European Union, but not alone, the market of drugs is among the most profitable
business of organized crime (SOCTA, 2013). The drug business creates great profits for cartels, which are
often international organizations supporting terrorism. If the drugs market is whitened, free market forces
would equally distribute the corresponding revenues and there would be less opportunity to finance terrorist
organization, crime rings, and cartel activity and profit (Cussen and Block, 2000). Less criminals make also
possible to reduce the over-crowding of prisons. According to Block (1993) another saving will be in terms
of money expended in crime prevention. Furthermore, legalizing the market of drugs allows allocating a
share of the money actually spent on banning narcotics to improve the medical problem of curing addicted
people. A better health protection will be improved also by ensuring market driven high quality substances
and the availability of clean needles. In effect, needles are frequently shared because they are difficult to
obtain. Legalizing drugs would also permit to reduce the price of narcotics limiting all that crimes committed
in order to get enough money to pay the seller. Indeed, one can reply that a lower price could increase the
amount consumed. Nevertheless, as Cussen and Block (2000) suggested, the elasticity of demand for
narcotics is very low, because drug users see narcotics as necessities not as luxury goods. However, if an
increase in the drugs consumption should happen, it can be partially offset through sizable excise taxes on
producers. The revenues collected in this way could be usefully employed to take care of addicted people
and to make a sound information (Becker, 2001).
6. Conclusions

32
References
• Ardizzi G., Petraglia C., Piacenza M., Schneider F., Turati G. (2014), Money Laundering as a Crime in
the Financial Sector: A New Approach to Quantitative Assessment, with an Application to Italy, Journal
of Money, Credit and Banking, 46(8), pp. 1555-1590.
• Barone R. (2004), “Riciclaggio finanziario e credito d’usura: un modello di analisi economica”, Rivista
Internazionale di Scienze Sociali, CXII, pp. 119-135.
• Barone R. and Masciandaro D. (2011), Organized crime, money laundering and legal economy: theory
and simulations, European Journal of Law and Economics, 32(1), pp. 115-142.
• Barone R., Delle Side D. and Masciandaro D. (2017), “Drug Trafficking, Money Laundering and the
Business Cycle: Does Secular Stagnation Include Crime?”, BAFFI CAREFIN Centre Research Paper
No. 2017-47. Available at SSRN: https://ssrn.com/abstract=2896012 or
http://dx.doi.org/10.2139/ssrn.2896012
• Becker G. (1968), “Crime and Punishment: An Economic Approach”, Journal of Political Economy,
76(2), pp. 169-217.
• Becker G. (2001), Its Time to Give Up the War on Drugs, Business Week online, September
http://www.bloomberg.com/news/articles/2001-09-16/its-time-to-give-up-the-war-on-drugs
• Block W. (1996), Drug Prohibition and Individual Virtue, Review of Political Economy, 8(4), pp. 432-
436.
• Block W. (1993), Drug Prohibition: A legal and Economic Analysis, Journal of Business Ethics, 12(9),
pp. 689-700.
• Bradley C., (2007), “The Meaning of 'Laundering”, Trial Magazine, Indiana Legal Studies Research,
Paper No. 97. Available at SSRN: https://ssrn.com/abstract=1076623
• Buchanan B. (2004), “Money laundering – a global ostacle”, Research in International Business and
Finance, 18(1), pp. 115-127.
• Camdessus M. (1998), Money Laundering: The Importance of International Countermeasures, Plenary
Meeting of the Financial Action Task Force on Money Laundering, Paris, February 10.
• Centorrino M. (2009), Riciclaggio al Casinò, La Voce, 11 settembre 2009.
33
• Chong, A., e Lopez‐De‐Silanes, F. (2015), “Money Laundering and Its Regulation”.Economics and
Politics, 27(1), 78-123.
• Coase R., (1960), “The nature of the firm”, Economica, 6, pp. 386–405.
• Cussen M. and Block W. (2000), Legalize Drugs Now! An Anlysis of the Benefits of Legalized Drugs,
Amercian Journal of Economics and Sociology, 59(3), pp. 525-536.
• Dalla Pellegrina L., Masciandaro D. (2009), The Risk Based Approach in the New European Anti-
Money Laundering Legislation: a Law and Economics View, Review of Law and Economics, 5(2), pp.
931-952.
• Donato L. e Masciandao D. (2001), Moneta, Banca. Gli abusi del mercato, Hoepli 2001.
• Europol (2006), OCTA 2009: EU Organized Crime Threat Assessment, European Police Office, The
Netherlands.
• Europol (2007), OCTA 2009: EU Organized Crime Threat Assessment, European Police Office, The
Netherlands.
• Europol (2008), OCTA 2009: EU Organized Crime Threat Assessment, European Police Office, The
Netherlands.
• FATF, How much money is laundered per year?, http://www.fatf-gafi.org/faq/moneylaundering/
• FATF (2004), Money Laundering and Terrorist Financing Typologies 2003–2004, Paris, France.
• FATF (2005a), Report on Money Laundering and Terrorist Financing Typologies 2004–2005, Paris,
France.
• FATF (2005b), Third Mutual Evaluation/Detailed Assessment Report on Anti-Money Laun-dering and
Combating the Financing of Terrorism - Norway, June 2005, Paris, France.
• FATF (2006), Third Mutual Evaluation Report on Anti-Money Laundering and Competing the
Financing of Terrorism - Portugal, October 2006, Paris, France.
• FBI (2011), Financial Crimes Report to the Public, U.S. Department of Justice.
• Gilmour N. (2016), “Understanding the practices behind money laundering – A rational choice
interpretation”, International Journal of Law, Crime and Justice, Vol. 44, pp. 1-13.
• Hines, J. R. (2010), “Treasure Islands”, Journal of Economic Perspectives, 24(4), 103–26.

34
• IMF (2001), Financial System Abuse, Financial Crime and Money Laundering - Background Paper,
International Monetary Fund, Monetary and Exchange Affairs and Policy Development and Review
Departments, February 2001.
• Ivanov V., (2011), “Drug Trafficking and the Financial Crisis”, Executive Intelligence Review, 38(47).
• Kruisbergen E. W., Kleemans E. R. and Kouwenberg R. F. (2015), “Profitability, Power, or Proximity?
Organized Crime Offenders Investing Their Money in Legal Economy”, European Journal on Criminal
Policy and Research, June 2015, Volume 21(2), pp 237–256.
• La Porta R., Lopez- -Silanes F., Shleifer A. and Vishny R. (2006), “What Works in Securities Laws?”
Journal of Finance, American Finance Association, 61, pp. 1–32.
• Levi M. (2012), The Organization of Serious Crimes for Gain, in: Maguire M., Morgan R., & Steiner R.
(Eds.), The Oxford Handbook of Criminology, 5th ed., Oxford: Oxford University Press.
• Levi M. and Reuter P. (2009), Money Laundering, in: Tonry M. (Ed.), Handbook on Crime and Public
Policy, New York, Oxford University Press.
• Levi M. and Gold M. (1994), Money-Laundering in the UK: An Appraisal of Suspicion-Based Reporting,
London: Police Foundation.
• Lyssiotou P., Pashardes P. and Stengos T. (2004), “Estimates of the black economy based on consumer
demand approach”, The Economic Journal, 114(497), pp. 622-640.
• Masciandaro, D. (1999), “Money Laundering: The Economics of Regulation”, European Journal of Law
and Economics, 7(3), 225-240.
• Masciandaro D. (1998), “Money Laundering Regulation: The Micro Economics", Journal of Money
Laundering Control, 2(1), pp.49-58.
• Masciandaro D. (1993), Analisi economica della criminalità, teoria della regolamentazione e riciclaggio
finanziario, in S. Zamagni, (a cura di), Mercati illegali e mafie, Il Mulino, Bologna, 1993, pp. 243-297.
• Masciandaro D., Takats E. and Unger B. (2007), Black Finance. The Economics of Money Laundering,
Edward Elgar, Cheltenham.
• Masciandaro D. and Portolano A. (2003), “It takes two to tango: International Financial Regulation and
Off-shore Centres”, Journal of Money Laundering Control, 6(4), pp. 311-331.
• Morris S. (1998), Measuring Money Laundering (Rev. 1), An Interim Report to the FATF Ad Hoc
Group on Estimating the Magnitude of Money Laundering, 4th March, 1998, OECD, Paris.
• Morris- Cotteril N. (2001), “Money Laundering”, Foreign Policy, No. 124, pp. 16-22.
35
• Picard P.M. and Pieretti P. (2009), Bank Secrecy, Illicit Money and Offshore Financial Centres, Paolo
Baffi Centre, Research Series, n.45.
• Pickhardt, M. and Prinz, A. (eds.), (2012), Tax Evasion and the Shadow Economy, Cheltenham (U.K.):
Edward Elgar Publishing Company.
• Quirk, P. J. (1997), Money laundering: Muddying the macroeconomy, Washington, DC: International
Monetary Fund.
• Quirk, P. J. (1996), Macroeconomic implications of money laundering, Washington, DC: International
Monetary Fund.
• Reuter P. (2013), “Are estimates of the volume of money laundering either useful or feasible?”, in Unger
and van der Linde (Eds.), Research Handbook on Money Laundering, EdwardElgar Publishing.
• Schneider, F. (2008a), Turnover of Organised Crime and Money Laundering: Some Preliminary
Empirical Findings, Discussion Paper, Department of Economics, University of Linz.
• Schneider, F. (2008b), Money Laundering from Revenues from Organised Crime: Some Preliminary
Empirical Findings, revised version of a paper which was presented at the Conference „Illicit Trade and
Globalization“, CESifo Venice Summer Workshop, Venice National University, San Servolo, July 14-
15, 2008.
• Schneider, F. (2009), Die Finanzströme von Organisierter Kriminalität und Terrorismus: Was wissen wir
(nicht)?, Vierteljahreshefte zur Wirtschaftsforschung, DIW Berlin, 78/4, pp. 73-87.
• Schneider F. (2010), “Turnover of organized crime and money laundering: some preliminary empirical
findings”, Public Choice, 144(3), pp 473–486.
• Schneider, F. (2010a), The (Hidden) Financial Flows of Terrorist and Organized Crime: A Literature
Review and Some Preliminary Empirical Results, paper prepared for the EUSECON conference in
Athens, April 12-13, 2010.
• Schneider, F. (2010b), Turnover of Organized Crime and Money Laundering: Some Preliminary
Findings, Public Choice, 144, pp. 473-486.
• Schneider, F. (2011), The Financial Flows of Transnational Crime: Some Preliminary Empirical Results,
in: Antonopoulos, G. et al. (eds.), Usual and unusual organizing criminals in Europe and beyond:
Profitable crimes from underworld to upperworld, Festschrift for Petrus Van Duyne, Apeldoorn: Maklu
Publication Company, 2011, pp. 215-232.

36
• Schneider, F. (2013), The Financial Flows of Transnational Crime and Tax Fraud in OECD Countries:
What Do We (Not) Know?, Public Finance Review/Special Issue: The Shadow economy, Tax Evasion
and Money Laundering, 41/5, pp. 677-707.
• Schneider, F. (2015), Zahlungsströme der transnationalen organisierten Kriminalität (TOK) und
Steuerbetrug in OECD Ländern, in: Jäger, T.C. (ed.), Handbuch für Sicherheitsgefahren, Springer
Verlag, Wiesbaden, pp. 147-172.
• Schneider, F., Dreer, E. and Riegler, W. (2006), Geldwäsche: Formen, Akteure, Größenordnung –
Warum die Politik machtlos ist, Wiesbaden: Gabler-Verlag.
• Schneider, F. and Windischbauer, U. (2008), Money Laundering: Some Facts, European Journal of Law
and Economics, 26/4, pp. 387-404.
• Sharman J. C. (2010), “Shopping for Anonymous Shell Companies: An Audit Study of Anonymity and
Crime in the International Financial System”, Journal of Economic Perspectives, 24(4), 127–40.
• Smith, D. (2011), Black Money: the Business of Money Laundering, Economy Watch.com, June 7,
2011, available at http://www.economywatch.com/economy-business-and-finance-news/black-money-
the-business-of-money-laundering.08-06.html.
• SOCTA (2013), EU Serious and Organised Crime Threat Assessment, Europol.
• Stigler G., (1964), “Public regulation of the securities markets”, Journal of Business, 37(2) pp. 117-142.
• Takats E. (2007), A Theory of “Crying Wolf”: The Economics of Money Laundering Enforcement, IMF
Working Paper, n.81.
• Takats, E. (2009), A Theory of "Crying Wolf": The Economics of Money Laundering Enforcement, The
Journal of Law, Economics & Organization, 27/1, pp. 32-78.
• Tanzi, V. (1996), Money laundering and the international financial system. Working paper, International
Monetary Fund, 96(55).
• Tanzi, V. (1997), Macroeconomic implications of money laundering, in E. U. Savona (Ed.), Responding
to Money Laundering, International Perspective, Amsterdam: Harwood Academic Publishers.
• The Observer, Drug money saved banks in global crisis, The Guardian, December 13, 2009.
https://www.theguardian.com/global/2009/dec/13/drug-money-banks-saved-un-cfief-claims
• Unger B., Ferwerda J., de Kruijf W., Rawlings G., Siegel M., and Wokke K. (2006), The Amounts and
the Effects of Money Laundering, report for Dutch Ministry of Finance, Feb. 2006,
http://www.minfin.nl/binaries/minfin/assets/pdf/old/06_011a.pdf.

37
• Unger B. (2007), Implementing Money Laundering, in Masciandaro, Takáts, Unger (2007), Black
Finance: The Economics of Money Laundering, Edward Elgar Publishing, Cheltenham, UK.
• Unger B. (2007a), The scale and impacts of money laundering, Chelthenam, Edward Elgar.
• UNODC (2005), World Drug Report 2005 - Volume 1: Analysis, United Nations Office on Drugs and
Crime (UNODC), Vienna, Austria.
• UNODC (2011), Estimating illicit financial flows resulting from drug trafficking and other transnational
organized crimes, Research Report, United Nations Office on Drugs and Crime (UNODC), Vienna,
Austria.
• Van Duyne P. C. (2006), The organization of business crime, in Van Duyne P. C., Maljevic A., Van
Dijck M., von Lampe K., & Newel J. (Eds.), The organization of crime for profit: conduct, law and
measurement, Nijmegen: Wolf Legal.
• Van Duyne P. C. (2007), Criminal finances in the state-of-the-art: case for concern?, in Van Duyne P. C.,
Maljevic A., Van Dijck M., von Lampe K., & Harvey J. (Eds.), Crime business and crime money in
Europe: the dirty linen of illegal enterprise, Nijmegen: Wolf Legal, pp. 69–98.
• Walker J. (1999), How Big is Global Money Laundering?, Journal of Money Laundering Control, 3(1),
pp. 25-37.
• Walker, J. and Unger B. (2009), ‘Measuring global money laundering: the Walker Gravity Model’,
Review of Law and Economics, 5 (2), 821–53