Money Income in the United States: 1998 - Census.gov Income in the United States: 1998...
111
U.S. Department of Commerce Economics and Statistics Administration U.S. CENSUS BUREAU Issue 1998 Demographic Programs Issued September 1999 P60-206 Report Title Current Population Reports Consumer Income Current Population Reports Money Income in the United States (With Separate Data on Valuation of Noncash Benefits)
Transcript of Money Income in the United States: 1998 - Census.gov Income in the United States: 1998...

U.S.Department of CommerceEconomics and Statistics AdministrationU.S. CENSUS BUREAU
Issue
1998
Demographic Programs
Issued September 1999
P60-206
Report Title
Current Population Reports
Consumer Income
Current Population Reports
Money Incomein the United States(With Separate Data on Valuation of Noncash Benefits)

Carmen DeNavas and Robert W.Cleveland prepared this report under thedirection of Edward J. Welniak Jr., Chiefof the Income Statistics Branch. John T.Baker II, Arthur F. Jones Jr., andMarc I. Roemer made significant contri-butions to the preparation of this report.Diana Marz and Shirley L. Smithprovided statistical assistance. DorisSansbury and Marian L. Nobles pro-vided clerical assistance. Charles T.Nelson, Assistant Division Chief forIncome and Poverty, Housing and House-hold Economic Statistics Division, providedoverall direction.
David Nguyen and Anh Ly Teitler,Demographic Surveys Division, processedthe March 1999 Current Population Surveyfile. Richard A. Denby, Chief of the Com-puter Programming and Applications Staff,Donna K. Benton, Caroline Carbaugh,Kirk E. Davis, John Lukasiewicz, StacyMasano, Chandararith R. Phe, Nora PSzeto, and Victor M. Valdisera pro-grammed the detailed tables and producedthe publication tables.
Carrie Jones and Fred Meier of theDemographic Statistical Methods Divisionconducted sampling review.
Bonnie S. Tarsia, Demographic SurveysDivision, and Frances Simmons, Tech-nologies Management Office, prepared andprogrammed the computer-assisted inter-viewing instrument used to conduct theMarch income supplement.
U.S. Census Bureau field representativesand telephone interviewers collected thedata. Without their dedication, the prepara-tion of this report or any report from theCurrent Population Survey would beimpossible.
The staff of the Administrative and Cus-tomer Services Division, Walter C. Odom,Chief, performed publication planning,design , composition, editorial review,and printing planning and procurement forpublications, Internet products, and reportforms. Cynthia G. Brooks provided publi-cation coordination and editing.
ACKNOWLEDGMENTS

1998Issued September 1999
P60-206
(With Separate Data on Valuation of Noncash Benefits)
Money Incomein the United States
U.S. Department of CommerceWilliam M. Daley,
Secretary
Robert L. Mallett,Deputy Secretary
Economics and Statistics AdministrationRobert J. Shapiro,
Under Secretaryfor Economic Affairs
U.S. CENSUS BUREAUKenneth Prewitt,
Director
Current Population Reports
Consumer Income

Paula J. Schneider,Principal Associate Directorfor Programs
Nancy M. Gordon,Associate Directorfor Demographic Programs
Daniel H. Weinberg,Chief, Housing and HouseholdEconomic Statistics Division
SUGGESTED CITATION
U.S. Census Bureau, Current PopulationReports, P60-206, Money Income in theUnited States: 1998, U.S. GovernmentPrinting Office, Washington, DC, 1999.
For sale by Superintendent of Documents, U.S. Government Printing Office, Washington, DC 20402.
ECONOMICS
AND STATISTICS
ADMINISTRATION
Economicsand StatisticsAdministration
Robert J. Shapiro,Under Secretaryfor Economic Affairs
U.S. CENSUS BUREAU
Kenneth Prewitt,Director
William G. Barron,Deputy Director
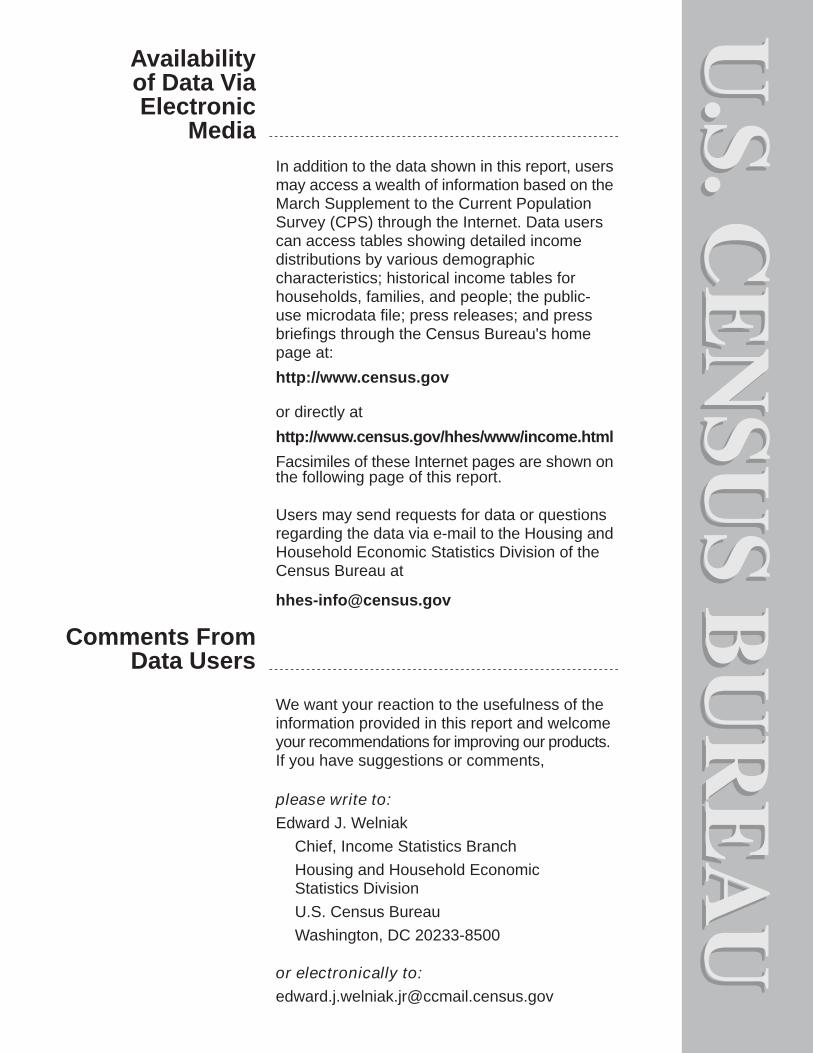
In addition to the data shown in this report, usersmay access a wealth of information based on theMarch Supplement to the Current PopulationSurvey (CPS) through the Internet. Data userscan access tables showing detailed incomedistributions by various demographiccharacteristics; historical income tables forhouseholds, families, and people; the public-use microdata file; press releases; and pressbriefings through the Census Bureau's homepage at:http://www.census.gov
or directly athttp://www.census.gov/hhes/www/income.htmlFacsimiles of these Internet pages are shown onthe following page of this report.
Users may send requests for data or questionsregarding the data via e-mail to the Housing andHousehold Economic Statistics Division of theCensus Bureau at
Availabilityof Data ViaElectronic
Media
Comments FromData Users
We want your reaction to the usefulness of theinformation provided in this report and welcomeyour recommendations for improving our products.If you have suggestions or comments,
please write to:Edward J. Welniak
Chief, Income Statistics BranchHousing and Household EconomicStatistics DivisionU.S. Census BureauWashington, DC 20233-8500
or electronically to:[email protected]
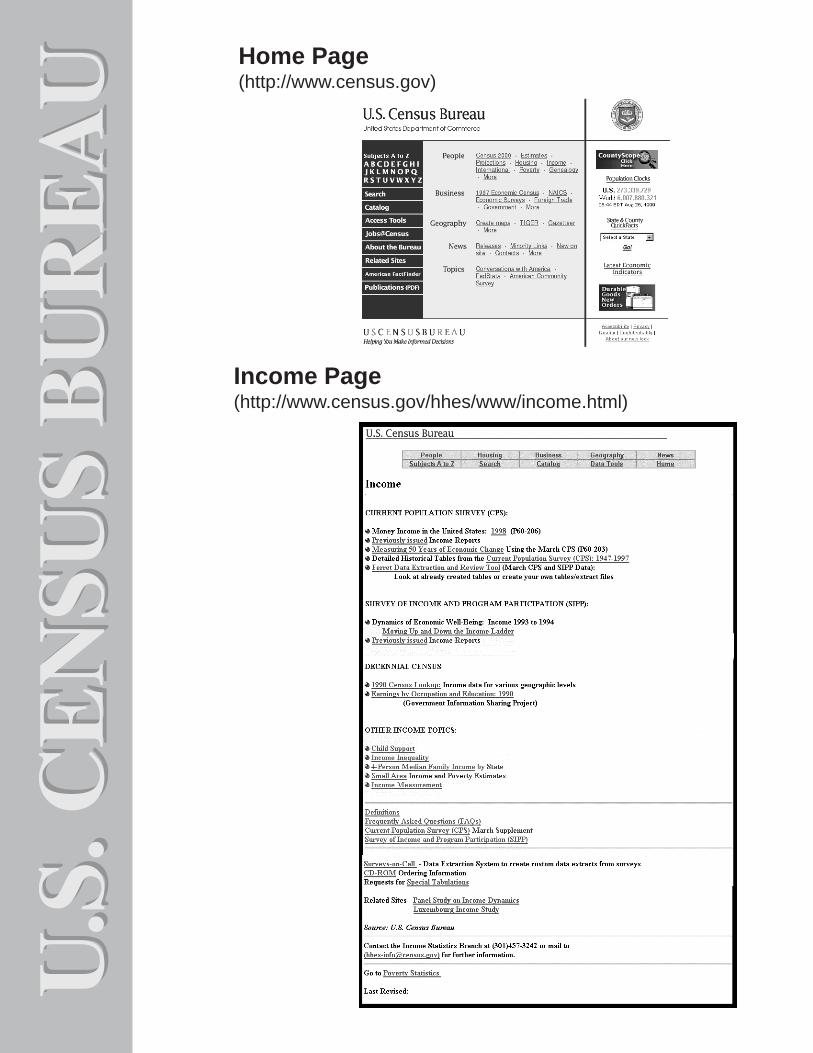
Home Page(http://www.census.gov)
Income Page(http://www.census.gov/hhes/www/income.html)

TEXT
Highlights . . . . . . . . . . . . . . . . . . . . . . . . . . . . . . . . . . . . vIntroduction . . . . . . . . . . . . . . . . . . . . . . . . . . . . . . . . . . . viiOfficial Estimates of Money Income . . . . . . . . . . . . . . . . . . . . . . vii
Household Income . . . . . . . . . . . . . . . . . . . . . . . . . . . . . . viiType of Household . . . . . . . . . . . . . . . . . . . . . . . . . . . . . . viiRace and Hispanic Origin of the Householder . . . . . . . . . . . . . . . . viiiNativity of the Householder . . . . . . . . . . . . . . . . . . . . . . . . . ixRegion. . . . . . . . . . . . . . . . . . . . . . . . . . . . . . . . . . . . . xResidence . . . . . . . . . . . . . . . . . . . . . . . . . . . . . . . . . . . xEarnings of Full-Time, Year-Round Male and Female Workers . . . . . . . . xPer Capita Income . . . . . . . . . . . . . . . . . . . . . . . . . . . . . . xiiIncome Inequality . . . . . . . . . . . . . . . . . . . . . . . . . . . . . . . xiiiIncome Data for States . . . . . . . . . . . . . . . . . . . . . . . . . . . . xvii
Experimental Estimates of Income Including Noncash Benefits and Taxes . . xviiDistributional Effects . . . . . . . . . . . . . . . . . . . . . . . . . . . . . xviiEffects on Selected Population Groups . . . . . . . . . . . . . . . . . . . . xx
Measurement Note . . . . . . . . . . . . . . . . . . . . . . . . . . . . . . . xxiRounding . . . . . . . . . . . . . . . . . . . . . . . . . . . . . . . . . . . . xxiSymbols Used in Tables . . . . . . . . . . . . . . . . . . . . . . . . . . . . . xxi
TEXT TABLES
A. Comparison of Summary Measures of Income by SelectedCharacteristics: 1989, 1997, and 1998. . . . . . . . . . . . . . . . vi
B. Median Earnings of Full-Time, Year-Round Workers by SelectedCharacteristics: 1998 . . . . . . . . . . . . . . . . . . . . . . . . . xi
C. Selected Measures of Household Income Dispersion: 1967 to 1998 . xvD. Median Income of Households by State . . . . . . . . . . . . . . . . xviE. Median Household Income by Definition: 1997 and 1998 . . . . . . xixF. Percentage of Aggregate Income Received by Income Quintiles and
Gini Coefficient by Definition of Income: 1998. . . . . . . . . . . . xixG. Median Income Using Different Definitions for Households With
Selected Characteristics: 1998 . . . . . . . . . . . . . . . . . . . . xx
FIGURES
1. Median Household Income by Type of Household: 1989 and 1998 . . viii2. Median Household Income by Race and Hispanic Origin: 1972 to
1998 . . . . . . . . . . . . . . . . . . . . . . . . . . . . . . . . . . ix3. Median Earnings by Sex and Educational Attainment: 1998 . . . . . . xii4. Median Earnings by Sex and Age: 1998 . . . . . . . . . . . . . . . . xiii5. Share of Aggregate Household Income by Quintile: 1967, 1993, and
1998 . . . . . . . . . . . . . . . . . . . . . . . . . . . . . . . . . . xiv6. Percent Change in the Household Gini Coefficient: 1967 to 1998 . . xiv7. Median Household Income by State: 1996-1998 Three-Year Average . xviii
CONTENTS
iii
DETAILED TABLES
Income
1. Median Income of Households by Selected Characteristics, Race, andHispanic Origin of Householder: 1998, 1997, and 1996. . . . . . . 1
2. Selected Characteristics—Households by Total Money Income in1998 . . . . . . . . . . . . . . . . . . . . . . . . . . . . . . . . . . 5
3. People in Households by Total Household Income in 1998,Relationship to Householder, Age, Sex, Race, and Hispanic Origin . 7
4. Median Income of Families by Selected Characteristics, Race, andHispanic Origin of Householder: 1998, 1997, and 1996. . . . . . . 13
5. Selected Characteristics of Families—Total Money Income ofFamilies in 1998 . . . . . . . . . . . . . . . . . . . . . . . . . . . . 17
6. Presence of Related Children Under 18 Years Old—Total MoneyIncome in 1998 of Married-Couple Families by Work Experience in1998 of Husband and Wife . . . . . . . . . . . . . . . . . . . . . . 19
7. Median Income of People by Selected Characteristics: 1998, 1997,and 1996 . . . . . . . . . . . . . . . . . . . . . . . . . . . . . . . . 26
8. Selected Characteristics of People—Total Money Income in 1998of People 15 Years Old and Over by Work Experience in 1998and Sex . . . . . . . . . . . . . . . . . . . . . . . . . . . . . . . . . 30
9. Educational Attainment—Total Money Earnings in 1998 of People 18Years Old and Over by Age, Work Experience in 1998, and Sex . . . 34
10. Work Experience in 1998 —Total Money Earnings in 1998 of People15 Years Old and Over by Race, Hispanic Origin, and Sex . . . . . . 38
11. Source of Income in 1998—Number With Income and Mean Incomeof Specified Type in 1998 of People 15 Years Old and Over by Age . 42
Experimental Estimates of Income
12. Income Distribution Measures by Definition of Income: 1998 . . . . 48
APPENDIXES
A. Definitions and Explanations . . . . . . . . . . . . . . . . . . . . . . A–1B. Time Series Estimates of Income . . . . . . . . . . . . . . . . . . . . B–1C. The Bureau of Labor Statistics’ Statement on the Use of the CPI-U-RS . C–1D. Trends in Income Using the CPI-U-X1 Versus the CPI-U-RS . . . . . . . D–1E. Source and Accuracy of Estimates . . . . . . . . . . . . . . . . . . . E–1
APPENDIX TABLES
B–1. Annual Average Consumer Price Index (CPI-U): 1947 to 1998 . . . . B–2B–2. Households by Total Money Income, Race, and Hispanic Origin of
Householder: 1967 to 1998. . . . . . . . . . . . . . . . . . . . . . B–3B–3. Share of Aggregate Income Received by Each Fifth and Top 5 Percent
of Households by Race and Hispanic Origin of Householder: 1967to 1998 . . . . . . . . . . . . . . . . . . . . . . . . . . . . . . . . . B–6
B–4. Families by Total Money Income, Race, and Hispanic Origin ofHouseholder: 1967 to 1998. . . . . . . . . . . . . . . . . . . . . . B–8
B–5. Total Money Income of People by Race, Hispanic Origin, andSex: 1967 to 1998. . . . . . . . . . . . . . . . . . . . . . . . . . . B–11
D–1. Median Household Income by Inflation Index: 1967 to 1998 . . . . . D–2E–1. Description of the March Current Population Survey. . . . . . . . . . E–2E–2. March CPS Coverage Ratios . . . . . . . . . . . . . . . . . . . . . . . E–3E–3. CPS Standard Error Parameters for Income and Nonincome
Characteristics: 1998 . . . . . . . . . . . . . . . . . . . . . . . . . E–4E–4. CPS Factors to Apply to a and b Parameters for Estimates Prior to
1998 . . . . . . . . . . . . . . . . . . . . . . . . . . . . . . . . . . E–5E–5. CPS Standard Error Parameters for Income and Nonincome
Characteristics of Hispanics: 1972 to 1983 . . . . . . . . . . . . . E–6E–6. CPS Standard Error Parameters for Income and Nonincome
Characteristics of Asians and Pacific Islanders: 1998 . . . . . . . . E–7E–7. CPS Year-to-Year Correlation Coefficients for Income Estimates: 1960
to 1998 . . . . . . . . . . . . . . . . . . . . . . . . . . . . . . . . . E–7
iv

Money Income in the United States: 1998
For the fourth consecutive year, real median incomeincreased for U.S. households—by 3.5 percent between1997 and 1998.1 Calendar year 1998 is the first year thatthe real median income of households surpassed the peakreached in 1989, the year before the most recent reces-sionary period (which lasted from July 1990 to March1991).
The 1998 income year proved to be economically fruit-ful for many households. All types of households experi-enced significant gains in real median income, regardlessof whether they were family households (composed ofmarried-couple families or families maintained by a manor woman with no spouse present) or nonfamily house-holds (composed of unrelated individuals living togetheror individuals living alone). For the first time since 1975(when regional estimates of household income becameavailable in tabulated form from the Current PopulationSurvey or CPS), all four regions of the country experiencedannual increases in median household income. Further-more, households inside central cities, in suburbs, andoutside metropolitan areas all experienced significantgains in median income.
The CPS demographic supplement conducted in Marchof each year is one of the best known and most widelyused of all continuing federal household surveys. For 50years, analysts, researchers, and policy makers have usedthe CPS to examine annual changes in income and earn-ings and to compare them with historical trends. Televi-sion, radio, and newspapers frequently draw upon thissource for statistics on Americans’ jobs, income, povertystatus, health insurance coverage, marital status, migra-tion, and other characteristics.
The estimates in this report are based on interviewing asample of the population. Respondents provide answersto the survey questions to the best of their ability. As withall surveys, the estimates differ from the actual values.
HIGHLIGHTS
(Table A presents the confidence intervals for estimatesdiscussed in the text. Data users should consider theuncertainty when using these estimates.)
• The real median income of households in the UnitedStates rose by 3.5 percent between 1997 and 1998,from $37,581 to $38,885. This is the fourth consecutiveyear that household income increased (see Tables A, 1,and Appendix Table B–2). Real median householdincome is now at the highest level recorded since theCensus Bureau started compiling these estimates in1967.
• 1998 is the first year that real median householdincome surpassed its 1989 prerecessionary peak. In1998, median household income was 2.6 percent higherthan the 1989 level of $37,884 (in 1998 dollars) (seeTable A).
• For the first time since 1995, all types of households—family and nonfamily alike— experienced annual growthin real median income (see Table A and Table 1).
• For the first time since 1975 (when median householdincome data by regions became available from the CPS),all four regions experienced significant annual gains inreal terms (see Tables A and 1).
• Metropolitan households and nonmetropolitan house-holds experienced growth in real median householdincome between 1997 and 1998 (see Table A).
• Real median earnings rose between 1997 and 1998 forboth men and women who worked full-time, year-round(see Table A). The female-to-male earnings ratio in 1998was 0.73,2 not statistically different from its all-timehigh, reached in 1996.
• Household income inequality remained unchanged. TheGini index of inequality has not experienced a year-to-year increase since 1993 (see Appendix B, Table B–3).Analysis of the aggregate shares of income also indi-cates that household income inequality was unchangedbetween 1997 and 1998.
• Real median household income rose significantly in 16states based on comparisons of 2-year moving averages(1996-1997 and 1997-1998). Six of these states (Ari-zona, Colorado, New Mexico, Utah, Washington, andWyoming) were in the West, four (Alabama, Florida,Georgia, and Oklahoma) were in the South, another four(Indiana, Minnesota, Missouri, and Ohio) were in the1Changes in real income refer to comparisons after adjusting for
inflation. The percentage changes in prices between earlier yearsand 1998were computed by dividing the annual average ConsumerPrice Index (CPI-U) for 1998 by the annual average for earlier years.See Table B–1 in Appendix B for values of the CPI-U from 1947 to1998.
2The 90-percent confidence interval for the 1998 female-to-maleearnings ratio is ± .01. Table A shows confidence intervals for otherstatistics shown in this report.
v
U.S. Census Bureau

Table A. Comparison of Summary Measures of Income by Selected Characteristics:1989, 1997, and 1998
[Households and people as of March of the following year. For meaning of symbols, see text]
Characteristics
1998Median income
in 1997(in 1998 dollars)
Median incomein 1989r
(in 1998 dollars)
Percent changein real income1997 to 1998
Percent changein real income1989r to 1998
Number(1,000)
Median income
Value(dollars)
90-percentconfidence
interval (+/–)(dollars)
Value(dollars)
90-percentconfidence
interval (+/–)(dollars)
Value(dollars)
90-percentconfidence
interval (+/–)(dollars)
Percentchange
90-percentconfidence
interval (+/–)Percentchange
90-percentconfidence
interval (+/–)
HOUSEHOLDS
All households . . . . . . . . . . . . . . 103,874 38,885 378 37,581 286 37,884 344 *3.5 0.6 *2.6 0.8
Type of Household
Family households . . . . . . . . . . . . . . 71,535 47,469 410 46,053 394 45,343 413 *3.1 0.6 *4.7 0.8Married-couple families . . . . . . . . . 54,770 54,276 530 52,486 388 50,702 458 *3.4 0.6 *7.0 0.9Female householder, no
husband present . . . . . . . . . . . . 12,789 24,393 655 23,399 657 22,662 603 *4.2 2.0 *7.6 2.5Male householder, no wife present . . 3,976 39,414 1,633 37,205 1,201 39,717 1,607 *5.9 2.8 –0.8 3.5
Nonfamily households. . . . . . . . . . . . 32,339 23,441 467 22,043 347 22,568 363 *6.3 1.3 *3.9 1.6Female householder . . . . . . . . . . . 17,971 18,615 462 17,887 428 18,143 474 *4.1 1.8 2.6 2.2Male householder . . . . . . . . . . . . . 14,368 30,414 559 28,022 770 29,489 660 *8.5 1.8 *3.1 1.8
Race and Hispanic Origin ofHouseholder
All races1 . . . . . . . . . . . . . . . . . . 103,874 38,885 378 37,581 286 37,884 344 *3.5 0.6 *2.6 0.8White. . . . . . . . . . . . . . . . . . . . . . . 87,212 40,912 336 39,579 413 39,852 320 *3.4 0.7 *2.7 0.7
Non-Hispanic White. . . . . . . . . . . . 78,577 42,439 401 41,209 354 40,792 331 *3.0 0.6 *4.0 0.8Black. . . . . . . . . . . . . . . . . . . . . . . 12,579 25,351 653 25,440 720 23,950 789 –0.3 1.9 *5.8 2.7Asian and Pacific Islander . . . . . . . . . 3,308 46,637 2,135 45,954 2,102 47,337 2,007 1.5 3.2 –1.5 3.7
Hispanic origin2 . . . . . . . . . . . . . . . . 9,060 28,330 898 27,043 792 28,631 882 *4.8 1.8 –1.1 2.7
Age of Householder
15 to 24 years. . . . . . . . . . . . . . . . . 5,770 23,564 730 22,935 822 24,401 755 2.7 2.4 –3.4 2.625 to 34 years. . . . . . . . . . . . . . . . . 18,819 40,069 696 38,769 755 39,041 603 *3.4 1.3 *2.6 1.535 to 44 years. . . . . . . . . . . . . . . . . 23,968 48,451 730 47,081 637 49,310 675 *2.9 1.0 –1.7 1.245 to 54 years. . . . . . . . . . . . . . . . . 20,158 54,148 877 52,683 727 54,575 893 *2.8 1.1 –0.8 1.455 to 64 years. . . . . . . . . . . . . . . . . 13,571 43,167 989 42,000 763 40,569 878 *2.8 1.5 *6.4 2.065 years and over . . . . . . . . . . . . . . 21,589 21,729 395 21,084 406 20,719 381 *3.1 1.3 *4.9 1.6
Nativity of the Householder
Native born. . . . . . . . . . . . . . . . . . . 92,853 39,677 390 38,229 381 (NA) (NA) *3.8 0.7 (X) (X)Foreign born . . . . . . . . . . . . . . . . . . 11,021 32,963 1,230 31,806 802 (NA) (NA) 3.6 2.3 (X) (X)
Naturalized citizen. . . . . . . . . . . . . 4,877 41,028 1,808 (NA) (NA) (NA) (NA) (X) (X) (X) (X)Not a citizen . . . . . . . . . . . . . . . . 6,143 28,278 1,199 27,379 971 (NA) (NA) 3.3 2.8 (X) (X)
Region
Northeast . . . . . . . . . . . . . . . . . . . . 19,877 40,634 772 39,535 877 42,780 709 *2.8 1.5 *–5.0 1.5Midwest . . . . . . . . . . . . . . . . . . . . . 24,489 40,609 600 38,913 747 37,685 642 *4.4 1.3 *7.8 1.5South . . . . . . . . . . . . . . . . . . . . . . 36,959 35,797 500 34,880 580 33,933 471 *2.6 1.1 *5.5 1.3West . . . . . . . . . . . . . . . . . . . . . . . 22,549 40,983 661 39,772 910 40,705 696 *3.0 1.4 0.7 1.4
Residence
Inside metropolitan areas . . . . . . . . . 83,441 40,983 352 39,994 448 40,776 346 *2.5 0.7 0.5 0.7Inside central cities . . . . . . . . . . . . 32,144 33,151 638 32,039 456 (NA) (NA) *3.5 1.5 (X) (X)Outside central cities . . . . . . . . . . . 51,297 46,402 512 45,364 568 (NA) (NA) *2.3 0.8 (X) (X)
Outside metropolitan areas . . . . . . . . 20,433 32,022 630 30,525 690 29,393 636 *4.9 1.5 *8.9 1.9
EARNINGS OF FULL-TIME,YEAR-ROUND WORKERS
Male . . . . . . . . . . . . . . . . . . . . . . . 56,951 35,345 219 34,199 535 35,727 242 *3.4 0.9 *–1.1 0.6Female . . . . . . . . . . . . . . . . . . . . . 38,785 25,862 194 25,362 259 24,614 270 *2.0 0.7 *5.1 0.9
PER CAPITA INCOME
All races1 . . . . . . . . . . . . . . . . . . 271,743 20,120 199 19,541 202 18,280 132 *3.0 0.7 *10.1 0.8White . . . . . . . . . . . . . . . . . . . . . . 223,294 21,394 237 20,743 239 19,385 147 *3.1 0.8 *10.4 0.8
Non-Hispanic White . . . . . . . . . . . 193,074 22,952 268 22,246 271 (NA) (NA) *3.2 0.9 (X) (X)Black. . . . . . . . . . . . . . . . . . . . . . . 35,070 12,957 322 12,543 346 11,406 253 *3.3 1.9 *13.6 2.1Asian and Pacific Islander . . . . . . . . . 10,897 18,709 1,094 18,510 1,128 (NA) (NA) 1.1 4.4 (X) (X)
Hispanic origin2 . . . . . . . . . . . . . . . . 31,689 11,434 410 10,941 393 10,770 294 *4.5 2.3 *6.2 2.7
*Statistically significant change at the 90-percent confidence level. rRevised to reflect the population distribution reported in the 1990 census.
1Data for American Indians, Eskimos, and Aleuts are not shown separately. Data for this population group are not tabulated from the CPS becauseof its small size.
2Hispanics may be of any race.
Source: U.S. Census Bureau, Current Population Survey, March 1990, 1998, and 1999.
vi
U.S. Census Bureau

Midwest, and two (Pennsylvania and Vermont) were inthe Northeast. This comparison also shows that medianhousehold income declined for Alaska. Median house-hold income did not change significantly for any of theremaining states or the District of Columbia (seeTable D).
• Real median income grew by 3.4 percent3 between1997 and 1998 using the most comprehensive defini-tion of income (which takes taxes and receipt of non-cash benefits into account). This change is not statisti-cally different from the 3.5 percent increase for theofficial measure.
• The more comprehensive income definition shows lessincome inequality than pre-tax (official) money incomesuggests. Government transfers have a much greatereffect than taxes on redistributing income.
INTRODUCTION
This report presents data on the income of households,families, and people in the United States for calendar year1998 and compares them with data for 1997 and, in somecases, with data for 1989 (the previous peak year in thebusiness cycle). Changes in income noted in this reportare based on real income (after adjusting for inflation).The Census Bureau compiled these data from informationcollected in March Supplements to the CPS. The March1999 CPS was based on approximately 50,000 randomlysampled households nationwide.
OFFICIAL ESTIMATES OF MONEY INCOME
The official income estimates in this report are basedsolely on money income before taxes and do not includethe value of noncash benefits, such as food stamps, medi-care, medicaid, public or subsidized housing, andemployment-based fringe benefits. A separate section ofthis report discusses the effect of taxes and selected non-cash benefits on household income using model-basedapproaches to estimating taxes and valuing benefits. TheCensus Bureau derived these modeled data from informa-tion collected in the March 1999 CPS, along with data fromother sources including the Internal Revenue Service, theFood and Nutrition Service, the Bureau of Labor Statistics,and the Health Care Financing Administration.4
Household Income
Between 1997 and 1998, the median income of house-holds grew, in real terms, by 3.5 percent, going from$37,581 to $38,885. This is the fourth consecutive year
that households have experienced an annual increase inincome (see Tables A, 1, and Appendix Table B–2). The1997-1998 growth in median household income was thelargest experienced since 1995 when median householdincome rose by 2.7 percent.5
For the first time, median household income surpassedits 1989 prerecessionary peak— exceeding the 1989 reallevel of $37,884 by 2.6 percent in 1998.6 In 1997, medianhousehold income achieved the 1989 prerecessionarypeak but did not surpass it.7
Type of Household
All types of households—family and nonfamilyalike—experienced growth in real median income between1997 and 1998. This outcome last occurred in 1995. Eventhough median household income rose for all types ofhouseholds, the percentage increase for nonfamily house-holds was twice as high as the increase for family house-holds, rising by 6.3 percent (from $22,043 to $23,441)compared with 3.1 percent growth (from $46,053 to$47,469) for family households.
Among family households, married-couple householdsexperienced a 3.4 percent growth in median income (from$52,486 to $54,276); households maintained by a womanwith no husband present, a 4.2 percent increase (from$23,399 to $24,393); and households maintained by aman with no wife present, a 5.9 percent rise (from$37,205 to $39,414). Among nonfamily households,median income for those maintained by a man rose 8.5percent (from $28,022 to $30,414)— twice the 4.1 per-cent increase for nonfamily households maintained by awoman (whose incomes grew from $17,887 to $18,615).8
In 1998, the median incomes of family and nonfamilyhouseholds were both higher than their 1989 prereces-sionary income peaks—by 4.7 percent and 3.9 percent,respectively (see Figure 1).9 This outcome occurred forboth married-couple families (7.0 percent higher) andfamilies maintained by a woman with no husband present
3The 90-percent confidence interval for the 3.4 percent increaseis ±0.8. Table A shows confidence intervals for other statisticsshown in this report.
4See Current Population Reports, Series P60-186RD, Measuringthe Effect of Benefits and Taxes on Income and Poverty: 1992, formore details.
5The difference between the 1994-1995 2.7 percent increase inmedian household income and the 1997-1998 increase of 3.5percent is not statistically significant.
6Historical income tables show a 1989 median income estimate(adjusted for inflation) of $37,997. The $37,884 estimate used inthe text for comparison purposes reflects adjustment in householdweighting based on results from the 1990 census, first introducedfor the entire sample in income year 1993.
7See Appendixes C and D for a discussion of the new ConsumerPrice Index Research Series (CPI-U-RS) recently proposed by theBureau of Labor Statistics and the effect of using the CPI-U-RS toadjust historical household income data for inflation.
8The differences between the 1997-1998 percentage increasesin median household income among most of the household typesmentioned in this paragraph are not statistically significant. Theonly ones that are significant are: family households compared withnonfamily households, and nonfamily households maintained by aman compared with nonfamily householdsmaintained by a woman.
9The difference between the 1989-1998 percentage increases inthe median incomes of family and nonfamily households is notstatistically significant.
vii
U.S. Census Bureau

(7.6 percent higher).10 Family households maintained by awoman with no husband present achieved their 1989 levelin 1995; whereas, married-couple households achievedand surpassed their 1989 level in 1996. In 1998, familyhouseholds maintained by a man with no wife presentachieved, but did not surpass, their 1989 level.
Although family households surpassed their 1989 levelin 1997, 1998 is the first year that nonfamily householdshave done so. Among nonfamily households, those main-tained by a man had a 1998 median income that sur-passed their 1989 level by 3.1 percent. Nonfamily house-holds maintained by a woman achieved their 1989 level in1997, but have not yet surpassed it.
Race and Hispanic Origin of the Householder
Asians and Pacific Islanders11 continued to have thehighest median household income among the racialgroups in 1998 ($46,637). Non-Hispanic White householdshad the second highest ($42,439) followed by Blackhouseholds ($25,351) (see Table A). Households main-tained by Hispanics had a median income of $28,330 in1998.12
Although Asians and Pacific Islanders as a group hadthe highest median household income in 1998, their
10The difference between the 1989-1998 percentage increasesin the median household incomes of married-couple families andfamilies maintained by a woman with no husband present is notstatistically significant.
11The Asian and Pacific Islander population consists of manydistinct groups that differ in socio-economic characteristics, cul-ture, and recency of immigration. Because of differences among theindividual groups, data users should exercise caution when inter-preting aggregate data for this population.
12Because Hispanics may be of any race, use caution in compar-ing data for Hispanics and data for racial groups (such as Blacks andAsians and Pacific Islanders). Furthermore, the Hispanic populationconsists of many distinct groups that differ in socio-economiccharacteristics, culture, and recency of immigration. Because ofdifferences among the individual groups, data users should exer-cise caution when interpreting aggregate data for this population.
0
10
20
30
40
50
60
Malehouseholder
Femalehouseholder
Totalnonfamily
households
Malehouseholder,
no wifepresent
Femalehouseholder,no husband
present
Married-couplefamilies
Totalfamily
households
Allhouseholds
Figure 1. Median Household Income by Type of Household: 1989 and 1998
Source: U.S. Census Bureau, Current Population Survey, March 1990 and March 1999 .
Income in thousands of 1998 dollars1989
1998
Family households Nonfamily households
viii
U.S. Census Bureau

income per household member was lower than non-Hispanic White households. The larger average size ofAsian and Pacific Islander households—3.15 people com-pared with 2.47 for non-Hispanic White households—maybe associated with lower income per household member($19,107 in 1998) for Asians and Pacific Islanders than fornon-Hispanic Whites ($22,633). For Black households in1998, the income per household member was $12,402,based on an average household size of 2.75. For Hispanichouseholds, income per household member in 1998 was$11,071, based on an average household size of 3.46.
Among the racial groups, non-Hispanic White house-holds were the only group to experience a significantgrowth in real median income between 1997 and 1998. Asa consequence, the median income of non-Hispanic Whitehouseholds is the highest recorded since 1972, the firstyear data by Hispanic origin were collected in the CPS. Themedian income of non-Hispanic White households rose by3.0 percent, going from $41,209 to $42,439. This is thefourth consecutive year that non-Hispanic White house-holds experienced an annual increase in median income.Black household income in 1998 remained at the all-timehigh first reached in 1997. The 1997-1998 change inmedian household income for the Asian and PacificIslander households was not statistically significant. His-panic households experienced their third consecutive year
of rising income—going from $27,043 to $28,330between 1997 and 1998, a 4.8 percent increase.13
Non-Hispanic White households and Black householdshad incomes in 1998 that surpassed their 1989 levels by4.0 percent and 5.8 percent, respectively (see Figure 2).14
Black households had achieved their 1989 income level in1995 and surpassed it for the first time in 1997. Non-Hispanic White households achieved their 1989 incomelevel in 1996 and surpassed it in 1998.
Nativity of the Householder
Between 1997 and 1998, real median income increasedfor households maintained by a native-born person. Themedian income of native households15 increased by 3.8percent, going from $38,229 to $39,677. The 1998
13The difference between the 1997-1998 percentage increase inthe median incomes of non-Hispanic White households and His-panic households was not statistically significant
14The difference between the 1989-1998 percentage increase inmedian incomes of non-Hispanic White households and Black house-holds was not statistically significant.
15‘‘Native’’ households are those in which the householder wasborn in the United States, Puerto Rico, or an outlying area of theUnited States, or was born in a foreign country but had at least oneparent who was a U.S. citizen. All other households are consideredforeign-born regardless of the date of entry into the United States orcitizenship status. The CPS does not interview people currentlyliving in Puerto Rico.
14
18
20
22
24
26
28
30
32
34
36
38
40
42
44
46
48
50
Figure 2.Median Household Income by Race and Hispanic Origin: 1972 to 1998
Source: U.S. Census Bureau, Current Population Survey, March 1973-1999.
1Hispanics may be of any race.
Income in thousands of 1998 dollars
Asian and Pacific Islander
Hispanic1
Recessionary periods
1972
Non-Hispanic White
Black
1974 1976 1978 1980 1982 1984 1986 1988 1990 1992 1994 1996 1998
0
ix
U.S. Census Bureau

median income of households maintained by a foreign-born person was $32,963; for households maintained by aforeign-born person who was not a citizen of the UnitedStates, it was $28,278, both statistically unchangedbetween 1997 and 1998. For households maintained by aperson who became a citizen, the median householdincome in 1998 was $41,028.16
Region
For the first time since 1975 (when the data were firsttabulated), median household income increased in all fourregions between 1997 and 1998 in real terms (see TablesA and 1). Between 1997 and 1998, median householdincome in the Northeast rose by 2.8 percent to $40,634;in the Midwest, by 4.4 percent to $40,609; in the South,by 2.6 percent to $35,797; and in the West, by 3.0 percentto $40,983. Even though the percentage increases byregion ranged from 2.6 percent to 4.4 percent, none of thedifferences among the four regions were statistically sig-nificant.
The South continues to have the lowest median house-hold income among the regions—$35,797 in 1998, repre-senting about 88 percent of the median household incomein the remaining regions. In each of the other regions—theNortheast, Midwest, and West—median household incomewas $40,000 or higher, but differences among theseregions were not statistically significant.
Median household income in both the South and theMidwest continued to surpass their 1989 incomepeaks—by 5.5 percent and 7.8 percent, respectively.17 TheMidwest achieved an income level comparable to its 1989level in 1995; the South, in 1996. The median householdincome of the West remained comparable to its 1989level—the West achieved its 1989 level in 1997. For theNortheast, however, the 1998 median household incomestill lagged 5.0 percent behind its 1989 level.
Residence
Both households inside and outside of metropolitanareas experienced growth in real median income between1997 and 1998—by 2.5 percent (going from $39,994 to$40,983) and by 4.9 percent (going from $30,525 to$32,022), respectively. Furthermore, within metropolitanareas, both households located inside central cities andthose in the suburbs had a higher median householdincome in 1998 than in 1997—rising by 3.5 percent (from
$32,039 to $33,151) and by 2.3 percent (from $45,364 to$46,402), respectively.18
Median household income varied by location of thehousehold. Households inside metropolitan areas had ahigher median income than those outside metropolitanareas ($40,983 versus $32,022, respectively). Householdslocated in the suburbs had a higher median income thanthose in the central cities ($46,402 versus $33,151,respectively).
Earnings of Full-Time, Year-Round Male andFemale Workers
For both men and women, the percentage who workedfull-time, year-round increased between 1997 and 1998.Of the 77.3 million men at least 15 years old who workedin 1998, 73.7 percent worked full-time, year-round—upfrom 71.6 percent in 1997. Of the 68.8 million women atleast 15 years old who worked in 1998, 56.3 percentworked full-time, year-round—up from 55.6 percent in1997 (see Table 7).
The real median earnings of both men and womenworking full-time, year-round increased between 1997 and1998—by 3.4 percent (from $34,199 to $35,345) and by2.0 percent (from $25,362 to $25,862), respectively (seeTables A and 7).19 For men, 1998 was the second straightyear of increase; for women, it was the third. The female-to-male earnings ratio in 1998 was 0.73, not significantlydifferent from the all-time high ratio reached in 1996(0.74).
Education, occupation, and age have important effectson the earnings of men and women, as discussed below.
Education. Americans with higher educational attainmenthave higher median earnings. For example, the medianearnings for females age 25 and older with a bachelor’sdegree in 1998 was $35,408, compared with $21,963 forthose with a high school diploma (or GED), and $15,847for those with a 9th to 12th grade education but no highschool diploma (see Table B and Figure 3). For men, thecomparable earnings were $49,982, $30,868, and$23,438, respectively.20
Women’s earnings as a percentage of men’s for full-time, year-round workers varied across education levelsfrom 61 percent to 76 percent in 1998. Women’s earningsfor those who attended high school, but did not graduate,were about 68 percent of men’s, 71 percent for high
16The difference between the 1998 median incomes of nativehouseholds and households maintained by a naturalized citizenwas not statistically significant.
17The difference in the percentage increases in median house-hold income between 1989 and 1998 for the Midwest and Southwas not statistically significant.
18 The differences among the 1997-1998 percentage changes inmedian household income for the various types of residence werenot statistically significant.
19The difference was not statistically significant between thepercentage increases in the earnings of men and women.
20The difference between the median earnings of females withprofessional and doctorate degrees is not statistically significant.
x
U.S. Census Bureau

school graduates, and 71 percent for those with bachelor’sdegrees. Women with professional degrees earned about61 percent of men’s earnings.21
Occupation. Median earnings also vary greatly by majoroccupation groupings (see Table B). In 1998, median earn-ings of women ranged from $15,647 for service occupa-tions to $36,261 for professional specialists.22 For men,median earnings ranged from $18,855 for farmers, fish-ers, and foresters, to $51,654 for professional special-ists.23 For major occupation groupings, the ratio offemale-to-male earnings in 1998 ranged from 62 percent
21The differences between the percentage of female-to-maleearnings for those with professional degrees and all other educa-tion levels were statistically significant, except for 9th to 12th grade(no diploma). Other statistically significant differenceswere betweenthose with less than 9th grade and 9th to 12th grade (no diploma),less than 9th grade and master’s degree, 9th to 12th grade (nodiploma) and some college (no degree), and 9th to 12th grade (nodiploma) and associate degree.
22The differences among the median earnings of females work-ing as service workers and of those working as handlers, equipmentcleaners, helpers, and laborers, or working in farming, forestry, andfishing occupations were not statistically significant.
23The difference between the earnings of males working asprofessional specialists and those working as executives, adminis-trators, and managers is not statistically significant.
Table B. Median Earnings of Full-Time, Year-Round Workers by Selected Characteristics: 1998
Characteristic
Female Male
Number withearnings
(1,000)Median
earningsStandard
error
Number withearnings
(1,000)Median
earningsStandard
error
EDUCATION
Total, 25 years and over . . . . . . . . . . . . . . . . . . . . . . . 35,603 26,711 122 52,380 36,679 134
Less than 9th grade . . . . . . . . . . . . . . . . . . . . . . . . . . . . . . . . 814 14,132 452 1,870 18,553 6509th to 12th grade (no diploma) . . . . . . . . . . . . . . . . . . . . . . . 1,876 15,847 346 3,613 23,438 516High school graduate (includes GED) . . . . . . . . . . . . . . . . . 11,605 21,963 146 16,442 30,868 158Some college, no degree. . . . . . . . . . . . . . . . . . . . . . . . . . . . 7,067 26,024 243 9,375 35,949 267Associate degree. . . . . . . . . . . . . . . . . . . . . . . . . . . . . . . . . . . 3,527 28,377 634 4,347 38,483 795Bachelor’s degree . . . . . . . . . . . . . . . . . . . . . . . . . . . . . . . . . . 7,276 35,408 287 11,058 49,982 533Master’s degree . . . . . . . . . . . . . . . . . . . . . . . . . . . . . . . . . . . . 2,639 42,002 469 3,414 60,168 922Professional degree . . . . . . . . . . . . . . . . . . . . . . . . . . . . . . . . 468 55,460 1,636 1,264 90,653 4,839Doctorate degree. . . . . . . . . . . . . . . . . . . . . . . . . . . . . . . . . . . 329 52,167 2,900 998 69,188 2,473
AGE
25 to 34 years . . . . . . . . . . . . . . . . . . . . . . . . . . . . . . . . . . . . . 9,658 25,556 212 14,353 31,262 17635 to 44 years . . . . . . . . . . . . . . . . . . . . . . . . . . . . . . . . . . . . . 11,582 27,186 236 17,510 37,663 43445 to 54 years . . . . . . . . . . . . . . . . . . . . . . . . . . . . . . . . . . . . . 9,681 28,424 485 13,286 41,583 25855 to 64 years . . . . . . . . . . . . . . . . . . . . . . . . . . . . . . . . . . . . . 4,107 26,144 337 6,192 40,654 36865 years and older . . . . . . . . . . . . . . . . . . . . . . . . . . . . . . . . . 575 21,858 1,193 1,039 30,259 2,156
OCCUPATION
Total with earnings . . . . . . . . . . . . . . . . . . . . . . . . . . . . 38,785 25,862 118 56,951 35,345 133
Executive, administrative, and managerial . . . . . . . . . . . . . 7,125 34,755 556 9,438 51,351 290Professional specialists . . . . . . . . . . . . . . . . . . . . . . . . . . . . . 6,922 36,261 271 7,768 51,654 297
Lawyers and judges . . . . . . . . . . . . . . . . . . . . . . . . . . . . . . 186 61,780 2,894 544 114,947 40,392Technical and related support . . . . . . . . . . . . . . . . . . . . . . . . 1,612 27,849 778 1,737 40,546 529Sales . . . . . . . . . . . . . . . . . . . . . . . . . . . . . . . . . . . . . . . . . . . . . 4,182 23,197 606 6,397 37,248 453
Supervisors and proprietors, self-employed . . . . . . . . . . 127 15,369 3,976 431 29,110 2,105Administrative support, including clerical . . . . . . . . . . . . . . 9,697 23,835 224 3,004 31,153 339
Mail and message distributing occupations . . . . . . . . . . 304 33,439 1,476 465 36,584 565Precision production, craft, and repair . . . . . . . . . . . . . . . . 927 23,907 1,004 11,064 31,631 208Machine operators, assemblers, and inspectors . . . . . . . . 1,955 19,015 383 3,953 27,890 581Transportation and material moving . . . . . . . . . . . . . . . . . . 268 21,449 879 3,671 30,422 351Handlers, equipment cleaners, helpers, and laborers . . . 544 16,550 522 2,633 21,871 362Service workers . . . . . . . . . . . . . . . . . . . . . . . . . . . . . . . . . . . . 5,262 15,647 206 4,881 22,515 414
Police and firefighters . . . . . . . . . . . . . . . . . . . . . . . . . . . . . 91 40,033 2,967 720 44,284 1,622Farming, forestry, and fishing . . . . . . . . . . . . . . . . . . . . . . . 235 15,865 1,269 1,739 18,855 1,115
Farm operators and managers . . . . . . . . . . . . . . . . . . . . 93 21,809 7,839 659 20,658 1,149
Source: U.S. Census Bureau, Current Population Survey, March 1999.
xi
U.S. Census Bureau
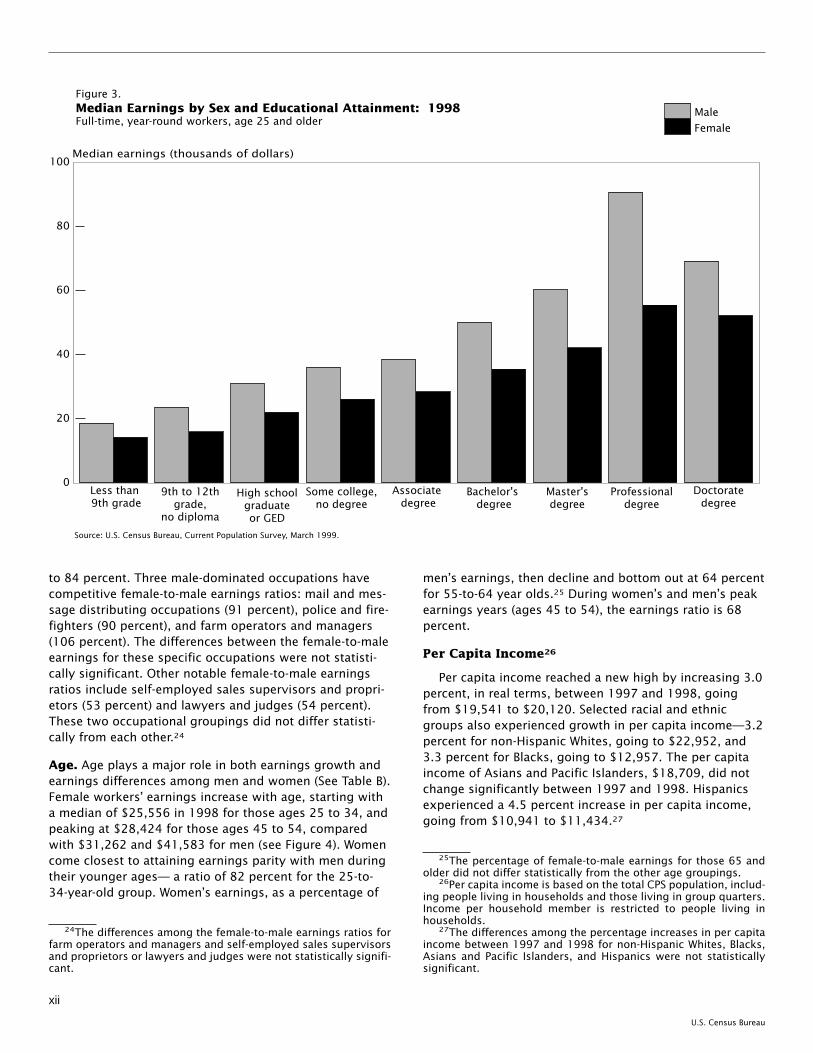
to 84 percent. Three male-dominated occupations havecompetitive female-to-male earnings ratios: mail and mes-sage distributing occupations (91 percent), police and fire-fighters (90 percent), and farm operators and managers(106 percent). The differences between the female-to-maleearnings for these specific occupations were not statisti-cally significant. Other notable female-to-male earningsratios include self-employed sales supervisors and propri-etors (53 percent) and lawyers and judges (54 percent).These two occupational groupings did not differ statisti-cally from each other.24
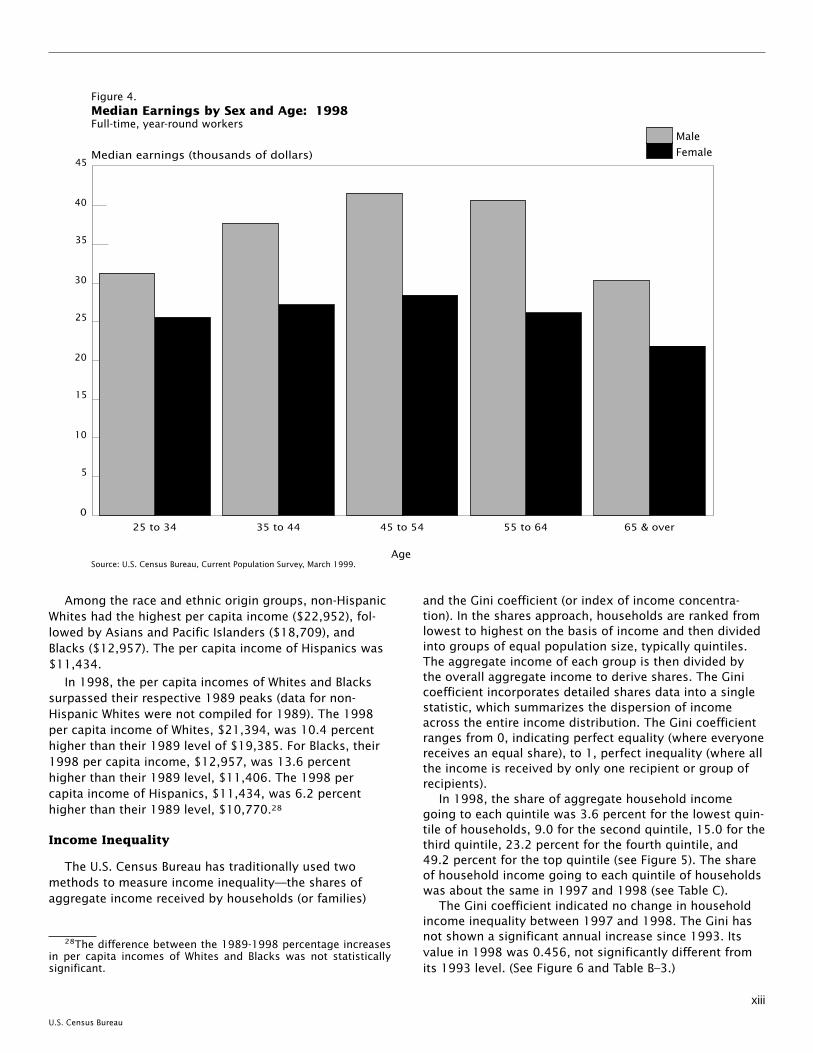
Age. Age plays a major role in both earnings growth andearnings differences among men and women (See Table B).Female workers’ earnings increase with age, starting witha median of $25,556 in 1998 for those ages 25 to 34, andpeaking at $28,424 for those ages 45 to 54, comparedwith $31,262 and $41,583 for men (see Figure 4). Womencome closest to attaining earnings parity with men duringtheir younger ages— a ratio of 82 percent for the 25-to-34-year-old group. Women’s earnings, as a percentage of
men’s earnings, then decline and bottom out at 64 percentfor 55-to-64 year olds.25 During women’s and men’s peakearnings years (ages 45 to 54), the earnings ratio is 68percent.
Per Capita Income26
Per capita income reached a new high by increasing 3.0percent, in real terms, between 1997 and 1998, goingfrom $19,541 to $20,120. Selected racial and ethnicgroups also experienced growth in per capita income—3.2percent for non-Hispanic Whites, going to $22,952, and3.3 percent for Blacks, going to $12,957. The per capitaincome of Asians and Pacific Islanders, $18,709, did notchange significantly between 1997 and 1998. Hispanicsexperienced a 4.5 percent increase in per capita income,going from $10,941 to $11,434.27
24The differences among the female-to-male earnings ratios forfarm operators and managers and self-employed sales supervisorsand proprietors or lawyers and judges were not statistically signifi-cant.
25The percentage of female-to-male earnings for those 65 andolder did not differ statistically from the other age groupings.
26Per capita income is based on the total CPS population, includ-ing people living in households and those living in group quarters.Income per household member is restricted to people living inhouseholds.
27The differences among the percentage increases in per capitaincome between 1997 and 1998 for non-Hispanic Whites, Blacks,Asians and Pacific Islanders, and Hispanics were not statisticallysignificant.
0
20
40
60
80
100
Doctoratedegree
Professionaldegree
Master'sdegree
Bachelor's degree
Associate degree
Some college,no degree
High schoolgraduateor GED
9th to 12thgrade,
no diploma
Less than 9th grade
Figure 3. Median Earnings by Sex and Educational Attainment: 1998 Full-time, year-round workers, age 25 and older
Source: U.S. Census Bureau, Current Population Survey, March 1999.
Median earnings (thousands of dollars)
Male
Female
xii
U.S. Census Bureau
Among the race and ethnic origin groups, non-HispanicWhites had the highest per capita income ($22,952), fol-lowed by Asians and Pacific Islanders ($18,709), andBlacks ($12,957). The per capita income of Hispanics was$11,434.
In 1998, the per capita incomes of Whites and Blackssurpassed their respective 1989 peaks (data for non-Hispanic Whites were not compiled for 1989). The 1998per capita income of Whites, $21,394, was 10.4 percenthigher than their 1989 level of $19,385. For Blacks, their1998 per capita income, $12,957, was 13.6 percenthigher than their 1989 level, $11,406. The 1998 percapita income of Hispanics, $11,434, was 6.2 percenthigher than their 1989 level, $10,770.28
Income Inequality
The U.S. Census Bureau has traditionally used twomethods to measure income inequality—the shares ofaggregate income received by households (or families)
and the Gini coefficient (or index of income concentra-tion). In the shares approach, households are ranked fromlowest to highest on the basis of income and then dividedinto groups of equal population size, typically quintiles.The aggregate income of each group is then divided bythe overall aggregate income to derive shares. The Ginicoefficient incorporates detailed shares data into a singlestatistic, which summarizes the dispersion of incomeacross the entire income distribution. The Gini coefficientranges from 0, indicating perfect equality (where everyonereceives an equal share), to 1, perfect inequality (where allthe income is received by only one recipient or group ofrecipients).
In 1998, the share of aggregate household incomegoing to each quintile was 3.6 percent for the lowest quin-tile of households, 9.0 for the second quintile, 15.0 for thethird quintile, 23.2 percent for the fourth quintile, and49.2 percent for the top quintile (see Figure 5). The shareof household income going to each quintile of householdswas about the same in 1997 and 1998 (see Table C).
The Gini coefficient indicated no change in householdincome inequality between 1997 and 1998. The Gini hasnot shown a significant annual increase since 1993. Itsvalue in 1998 was 0.456, not significantly different fromits 1993 level. (See Figure 6 and Table B–3.)
28The difference between the 1989-1998 percentage increasesin per capita incomes of Whites and Blacks was not statisticallysignificant.
Figure 4. Median Earnings by Sex and Age: 1998Full-time, year-round workers
Source: U.S. Census Bureau, Current Population Survey, March 1999.
Male
Female
Age
0
5
10
15
20
25
30
35
40
45
65 & over55 to 6445 to 5435 to 4425 to 34
Median earnings (thousands of dollars)
xiii
U.S. Census Bureau

0
1010
2020
3030
4040
5050
6060
7070
8080
199819931967199819931967199819931967199819931967199819931967
Figure 5.Share of Aggregate Household Income by Quintile: 1967, 1993 and 1998(In percent)
Source: U.S. Census Bureau, Current Population Survey, March 1968, 1994, 1999.
3.6
15.0
9.0
23.2
49.2
21.4
4.0 3.6
10.89.0
17.315.1
24.2 23.5
43.8
48.9
17.521.0
Lowest quintile Second quintile Third quintile Fourth quintile Highest quintile
Top 5percent
Middle 60 percent
Figure 6.Percent Change in the Household Gini Coefficient: 1967-1998
Source: U.S. Census Bureau, Current Population Survey, March 1968-1999. Data not available before 1967.
(Percent change, base year=1967)
*Computer-assisted personal interviewing (CAPI) was introduced in January 1994. As part of the conversion, increases were made in the limits for some income sources. This change in methodology increased measured income in 1993 for the highest income households by considerably more than their actual income rose. See CurrentPopulation Reports, Series P60-191, A Brief Look at Postwar U.S. Income Inequality.
-3
0
3
6
9
12
15
1998199219871982197719721967*1993
Recessionary periods
xiv
U.S. Census Bureau

Another common measure of income inequality isbased on comparing selected positions on the income dis-tribution. As Table C shows, the household at the 95thpercentile in 1998 received $132,199 in income, 8.2 timesthat of the household at the 20th percentile ($16,116). In1967, the first year the U.S. Census Bureau began report-ing on the income distribution of households, the house-hold at the 95th percentile had just 6.3 times the incomeof the household at the 20th percentile.
Regardless of the measure used, it seems clear thatincome inequality rose substantially between 1967 andthe early 1990s but has remained unchanged sincethen.29
29A change in data collection methodology occurred in 1993which affected income measurement and overstated the increase inincome inequality. See Paul Ryscavage, ‘‘A Surge in Growing IncomeInequality?,’’ Monthly Labor Review, August 1995. Long-run differ-ences in living arrangements affect comparisons of income differ-ences among households. Among those changes is the shift awayfrommarried-couple households toward single-parent and nonfam-ily households, which typically have lower incomes. See CurrentPopulation Reports, Series P60-191.
Table C. Selected Measures of Household Income Dispersion: 1967 to 1998
[Income in 1998 dollars]
Measures of income dispersion 1998 1997 1996 19951 1990 1985 19802 19753 1970 1968 1967
HOUSEHOLD INCOME ATSELECTED PERCENTILES
20th percentile upper limit . . . . 16,116 15,640 15,342 15,402 15,589 15,149 14,965 14,574 14,552 14,367 13,47150th (median) . . . . . . . . . . . . . . . 38,885 37,581 36,872 36,446 37,343 35,778 35,076 34,224 34,471 33,478 32,07580th percentile upper limit . . . . 75,000 72,614 70,659 69,654 68,848 66,365 62,784 59,446 57,863 54,858 53,17095th percentile lower limit . . . . . 132,199 128,521 124,187 120,860 118,163 110,984 101,999 94,787 91,477 85,824 85,317
HOUSEHOLD INCOMERATIOS OF SELECTEDPERCENTILES
95th/20th . . . . . . . . . . . . . . . . . . . . 8.20 8.22 8.09 7.85 7.58 7.33 6.82 6.50 6.29 5.97 6.3395th/50th . . . . . . . . . . . . . . . . . . . . 3.40 3.42 3.37 3.32 3.16 3.10 2.91 2.77 2.65 2.56 2.6680th/50th . . . . . . . . . . . . . . . . . . . . 1.93 1.93 1.92 1.91 1.84 1.85 1.79 1.74 1.68 1.64 1.6680th/20th . . . . . . . . . . . . . . . . . . . . 4.65 4.64 4.61 4.52 4.42 4.38 4.20 4.08 3.98 3.82 3.9520th/50th . . . . . . . . . . . . . . . . . . . . 0.41 0.42 0.42 0.42 0.42 0.42 0.43 0.43 0.42 0.43 0.42
MEAN HOUSEHOLD INCOMEOF QUINTILES
Lowest quintile . . . . . . . . . . . . . . . 9,223 9,010 8,930 8,931 8,973 8,782 8,879 8,800 8,008 7,921 7,301Second quintile . . . . . . . . . . . . . . 23,288 22,442 21,917 21,816 22,486 21,708 21,428 20,894 21,293 20,935 19,906Third quintile . . . . . . . . . . . . . . . . 38,967 37,756 36,866 36,478 37,141 35,955 35,268 34,186 34,289 33,201 31,783Fourth quintile . . . . . . . . . . . . . . . 60,266 58,479 57,057 56,076 55,997 54,072 51,928 49,645 48,336 46,319 44,468Highest quintile . . . . . . . . . . . . . . 127,529 124,676 120,005 117,021 108,671 99,741 91,211 86,457 85,581 81,120 80,584
SHARES OF HOUSEHOLDINCOME OF QUINTILES
Lowest quintile . . . . . . . . . . . . . . . 3.6 3.6 3.7 3.7 3.9 4.0 4.3 4.4 4.1 4.2 4.0Second quintile . . . . . . . . . . . . . . 9.0 8.9 9.0 9.1 9.6 9.7 10.3 10.5 10.8 11.1 10.8Third quintile. . . . . . . . . . . . . . . . . 15.0 15.0 15.1 15.2 15.9 16.3 16.9 17.1 17.4 17.5 17.3Fourth quintile . . . . . . . . . . . . . . . 23.2 23.2 23.3 23.3 24.0 24.6 24.9 24.8 24.5 24.4 24.2Highest quintile . . . . . . . . . . . . . . 49.2 49.4 49.0 48.7 46.6 45.3 43.7 43.2 43.3 42.8 43.8Gini coefficient of incomeinequality. . . . . . . . . . . . . . . . . . . 0.456 0.459 0.455 0.450 0.428 0.419 0.403 0.397 0.394 0.388 0.399
1Reflects the implementation of 1990 census adjusted population controls, 1990 census sample redesign, a change in data collection method frompaper-pencil to computer-assisted interviewing (CAI), and changes in income reporting limits. For detailed information concerning the impact of thesechanges, see Current Population Reports, Series P60-191, A Brief Look at Postwar U.S. Income Inequality.
2Reflects implementation of 1980 census population controls.3Reflects implementation of 1970 census population controls.
Source: U.S. Census Bureau, Current Population Surveys, selected March Supplements. Data not available before 1967.
xv
U.S. Census Bureau

Table D. Median Income of Households by State[Income in 1998 dollars. For meaning of symbols, see text]
States
Three-year average1996-1998
Two-year moving averages Differences in 2-yearmoving averages
1997-1998 less 1996-19971997-1998 1996-1997
Medianincome
Standarderror
Medianincome
Standarderror
Medianincome
Standarderror Difference
Percentchange
United States . . . . . . . . . . . . . . . 37,779 137 38,233 167 37,227 148 * 1,007 * 2.7
Alabama . . . . . . . . . . . . . . . . . . . . . . . . 33,394 1,003 34,351 1,210 31,958 1,211 * 2,393 * 7.5Alaska . . . . . . . . . . . . . . . . . . . . . . . . . . 51,421 1,236 49,717 1,418 51,786 1,354 –2,069 * –4.0Arizona . . . . . . . . . . . . . . . . . . . . . . . . . 34,402 909 35,170 1,057 33,058 1,085 * 2,112 * 6.4Arkansas . . . . . . . . . . . . . . . . . . . . . . . . 27,471 784 27,117 958 27,373 900 –256 –0.9California . . . . . . . . . . . . . . . . . . . . . . . . 40,522 548 40,623 604 40,317 710 307 0.8
Colorado . . . . . . . . . . . . . . . . . . . . . . . . 44,349 1,075 45,253 1,282 43,224 1,389 * 2,028 * 4.7Connecticut. . . . . . . . . . . . . . . . . . . . . . 44,978 1,832 45,589 1,961 44,213 2,174 1,376 3.1Delaware . . . . . . . . . . . . . . . . . . . . . . . . 42,000 1,260 42,581 1,583 42,270 1,470 310 0.7District of Columbia. . . . . . . . . . . . . . . 32,999 911 32,895 953 32,783 1,099 112 0.3Florida . . . . . . . . . . . . . . . . . . . . . . . . . . 33,234 442 33,935 561 32,396 462 * 1,538 * 4.7
Georgia . . . . . . . . . . . . . . . . . . . . . . . . . 36,553 891 37,950 869 35,497 1,117 * 2,453 * 6.9Hawaii . . . . . . . . . . . . . . . . . . . . . . . . . . 41,932 1,325 41,199 1,580 42,484 1,400 –1,285 –3.0Idaho . . . . . . . . . . . . . . . . . . . . . . . . . . . 35,554 903 35,302 1,009 34,991 1,131 311 0.9Illinois. . . . . . . . . . . . . . . . . . . . . . . . . . . 42,065 730 42,552 843 41,509 805 1,043 2.5Indiana. . . . . . . . . . . . . . . . . . . . . . . . . . 38,580 958 39,613 1,152 38,004 1,048 1,609 * 4.2
Iowa . . . . . . . . . . . . . . . . . . . . . . . . . . . . 35,276 954 35,664 1,029 34,405 1,189 1,259 3.7Kansas. . . . . . . . . . . . . . . . . . . . . . . . . . 35,867 1,115 36,875 1,338 35,445 1,297 1,430 4.0Kentucky . . . . . . . . . . . . . . . . . . . . . . . . 34,633 1,101 35,113 1,314 33,823 1,308 1,289 3.8Louisiana. . . . . . . . . . . . . . . . . . . . . . . . 32,317 1,072 32,757 1,329 32,608 1,199 148 0.5Maine . . . . . . . . . . . . . . . . . . . . . . . . . . . 34,989 854 34,461 977 34,664 1,060 –202 –0.6
Maryland . . . . . . . . . . . . . . . . . . . . . . . . 47,711 1,456 48,714 1,515 46,558 1,742 2,156 4.6Massachusetts . . . . . . . . . . . . . . . . . . . 42,017 1,236 42,511 1,392 41,853 1,412 658 1.6Michigan . . . . . . . . . . . . . . . . . . . . . . . . 40,639 758 40,583 841 40,048 950 536 1.3Minnesota . . . . . . . . . . . . . . . . . . . . . . . 44,579 1,159 45,576 1,508 42,906 1,155 * 2,671 * 6.2Mississippi. . . . . . . . . . . . . . . . . . . . . . . 28,592 924 29,031 1,056 28,329 1,140 703 2.5
Missouri . . . . . . . . . . . . . . . . . . . . . . . . . 37,640 1,307 38,662 1,628 36,360 1,512 * 2,302 * 6.3Montana . . . . . . . . . . . . . . . . . . . . . . . . 30,348 914 30,622 943 29,733 1,153 889 3.0Nebraska. . . . . . . . . . . . . . . . . . . . . . . . 35,661 1,086 35,823 1,274 35,284 1,278 538 1.5Nevada . . . . . . . . . . . . . . . . . . . . . . . . . 39,751 1,061 39,608 1,166 39,749 1,347 –141 –0.4New Hampshire . . . . . . . . . . . . . . . . . . 42,511 1,228 43,297 1,438 41,288 1,410 2,009 4.9
New Jersey. . . . . . . . . . . . . . . . . . . . . . 49,303 971 49,297 1,184 49,041 1,115 256 0.5New Mexico . . . . . . . . . . . . . . . . . . . . . 29,386 863 31,049 1,058 28,308 948 * 2,741 * 9.7New York. . . . . . . . . . . . . . . . . . . . . . . . 36,845 508 36,875 585 36,571 584 304 0.8North Carolina . . . . . . . . . . . . . . . . . . . 36,407 696 36,118 803 36,692 813 –574 –1.6North Dakota . . . . . . . . . . . . . . . . . . . . 31,717 891 31,229 1,055 32,424 1,074 –1,195 –3.7
Ohio . . . . . . . . . . . . . . . . . . . . . . . . . . . . 37,005 832 37,811 1,038 36,046 829 * 1,765 * 4.9Oklahoma . . . . . . . . . . . . . . . . . . . . . . . 31,357 789 32,783 935 30,172 893 * 2,612 * 8.7Oregon. . . . . . . . . . . . . . . . . . . . . . . . . . 37,922 1,197 38,447 1,538 37,350 1,297 1,098 2.9Pennsylvania . . . . . . . . . . . . . . . . . . . . 37,791 713 38,558 846 37,179 818 * 1,380 * 3.7Rhode Island . . . . . . . . . . . . . . . . . . . . 38,150 1,464 38,012 2,026 36,881 1,416 1,131 3.1
South Carolina . . . . . . . . . . . . . . . . . . . 34,692 1,037 34,031 1,213 35,404 1,272 –1,373 –3.9South Dakota . . . . . . . . . . . . . . . . . . . . 31,205 755 31,471 895 30,415 906 1,056 3.5Tennessee. . . . . . . . . . . . . . . . . . . . . . . 32,397 897 32,602 1,104 31,550 1,033 1,052 3.3Texas . . . . . . . . . . . . . . . . . . . . . . . . . . . 35,254 555 35,702 642 34,990 693 713 2.0Utah . . . . . . . . . . . . . . . . . . . . . . . . . . . . 42,073 1,084 43,870 1,315 40,960 1,318 * 2,911 * 7.1
Vermont . . . . . . . . . . . . . . . . . . . . . . . . . 36,196 1,097 37,485 1,374 34,607 1,260 2,878 * 8.3Virginia. . . . . . . . . . . . . . . . . . . . . . . . . . 42,572 1,326 43,490 1,695 42,181 1,419 1,309 3.1Washington. . . . . . . . . . . . . . . . . . . . . . 43,593 1,128 46,339 1,286 41,679 1,402 * 4,660 * 11.2West Virginia . . . . . . . . . . . . . . . . . . . . 26,950 831 27,310 883 27,072 1,104 238 0.9Wisconsin . . . . . . . . . . . . . . . . . . . . . . . 41,032 997 40,769 1,002 40,884 1,255 –115 –0.3Wyoming . . . . . . . . . . . . . . . . . . . . . . . . 33,783 878 34,597 1,143 33,050 981 * 1,547 * 4.7
New York, NY CMSA . . . . . . . . . . . . . 41,908 529 41,777 608 41,968 636 –191 –0.5Los Angeles, CA CMSA . . . . . . . . . . . 39,111 637 39,520 819 38,682 739 838 2.2
* Statistically significant at the 90-percent confidence level.
Source: U.S. Census Bureau, March 1999 Current Population Survey.
xvi
U.S. Census Bureau

Income Data for States
The March CPS is designed to collect reliable data pri-marily at the national level and only secondarily at theregional level. State estimates of income are considerablyless reliable. Specifically, the sampling variability associ-ated with the state estimates is higher than for estimatesbased on the country as a whole or on regions. Because ofthis increased sampling variability, year-to-year estimatesfluctuate more widely than national estimates. To reducethe chances of misinterpreting changes in, or rankings of,income estimates for states, the Census Bureau recom-mends using 2-year averages for evaluating changes instate estimates over time, and 3-year averages when com-paring the relative ranking of states (see Table D).
Based on comparisons of 2-year moving averages(1996-1997 versus 1997-1998), real median householdincome increased significantly for 16 states. Six of thesestates (Arizona, Colorado, New Mexico, Utah, Washington,and Wyoming) were in the West, four (Alabama, Florida,Georgia, and Oklahoma) were in the South, another four(Indiana, Minnesota, Missouri, and Ohio) were in the Mid-west, and two (Pennsylvania and Vermont) were in theNortheast. The two 2-year moving averages also showthat median household income declined for Alaska. Themedian household income did not change significantly forany of the remaining states or the District of Columbia(see Table D).
Comparing the relative ranking of states using the3-year average for 1996-1998 shows that the medianhousehold income for Alaska, although not statisticallydifferent from the median income for New Jersey, washigher than for the remaining 48 states and the District ofColumbia. Conversely, the median household income forWest Virginia, although not statistically different from themedians for Arkansas and Mississippi, was lower than thatof the remaining 47 states and the District of Columbia.The relative standing of the remaining states and the Dis-trict of Columbia is less clear because of sampling variabil-ity surrounding the estimates (see Figure 7).
The Census Bureau also computes improved (in thesense of having lower standard errors) biennial estimatesof median household income for states and also for coun-ties based on models using data from the CPS, the 1990decennial census, and administrative records. They areavailable on the Internet at:http://www.census.gov/hhes/www/saipe.html
EXPERIMENTAL ESTIMATES OF INCOME INCLUDINGNONCASH BENEFITS AND TAXES
Traditionally, income data presented in the CensusBureau’s reports have been based on the amount ofmoney received during a calendar year before taxes andexcluding capital gains, but this restricted definition ofincome does not provide a completely satisfactory mea-sure of the distribution of income. Over time, changes in
tax laws have affected the economic well-being of thepopulation. In the early 1980s, the U.S. Census Bureauembarked on a research program to examine the effects oftaxes. Four types of modeled tax data are included here:federal individual income taxes, state individual incometaxes, property taxes on owner-occupied housing, andpayroll taxes.
Receiving noncash benefits increases the resourcesavailable to individuals and families. Hence, this reportalso presents income measures that include the valuationof various noncash benefits, such as food stamps, schoollunches, housing subsidies, medicare, medicaid, employercontributions to health insurance, and net imputed returnson home equity.30
Distributional Effects
Taxes, government transfers, and other benefits affectthe distribution of income and the level of income, as isevident from examining the different definitions of incomeused in this section. Tables E, F, G, and Table 12 show thedistribution of income under the different definitions. Foreach of the 15 definitions of income (only a few of whichare discussed below) real median household incomeincreased between 1997 and 1998.
Definition 1, the official definition of income, is basedon money income before taxes and includes governmentcash transfers. Under definition 1, the share of aggregatehousehold income going to each quintile was 3.6 percentfor the lowest quintile, 9.2 percent for the second quintile,14.9 percent for the third quintile, 23.3 percent for thefourth quintile, and 49.0 percent for the top quintile (seeTable F). The Gini coefficient for all households under defi-nition 1 was 0.446 in 1998, unchanged from 1997.31
Definition 4 reflects income generated by the privatesector and results in a more unequal distribution than thedistribution under the official definition of income (seeTable F). It excludes cash transfers, adds net capital gains,and adds employer contributions to health insurance.Under definition 4, shares of income received by the low-est two quintiles of households declined from that of defi-nition 1 (from 3.6 percent to 1.0 percent, and from 9.2percent to 7.1 percent, respectively), while the share of
30For more information on the methodology and proceduresused to estimate taxes and to value noncash benefits see P60-186RD, Measuring the Effect of Benefits and Taxes on Income andPoverty: 1992.
31 Two methods are used in this report to estimate shares ofaggregate income received by each quintile and the Gini index. Thefirst method, reported in Table C, incorporates the use of actualsorted household data resulting in a Gini index of .456 and quintileshares of 3.6, 9.0, 15.0, 23.2, and 49.2. The second method,reported in Table F, uses grouped data and employs several inter-polation routines resulting in a Gini index of .446 and quintileshares of 3.6, 9.2, 14.9, 23.3, and 49.0. The grouped data methodis used throughout this report for calculating Gini indexes whenthey appear with other income summary measures in the detailedtables, as well as for share estimates under the alternative defini-tions of income.
xvii
U.S. Census Bureau

�
Figure 7.Median Household Income by State:1996-1998 Three-Year Average
Median household income in thousands of 1998 dollars
Source: U.S. Census Bureau, Current Population Survey, March 1997, 1998, and 1999.
90 percent confidence intervalMidpoint
0 10 20 30 40 50 60
AlaskaNew Jersey
MarylandConnecticut
Minnesota
Colorado
WashingtonVirginia
New HampshireUtah
IllinoisMassachusetts
DelawareHawaii
WisconsinMichiganCalifornia
NevadaIndiana
Rhode IslandOregon
PennsylvaniaUnited States
MissouriOhio
New YorkGeorgia
North CarolinaVermont
Kansas
NebraskaIdahoIowa
TexasMaine
South CarolinaKentucky
ArizonaWyoming
AlabamaFlorida
District of ColumbiaTennesseeLouisiana
North DakotaOklahoma
South Dakota
MontanaNew Mexico
Mississippi
ArkansasWest Virginia
xviii
U.S. Census Bureau

income received by the highest quintile increased from49.0 percent to 54.1 percent. The Gini coefficient underthis definition of income, 0.509, was 14.1 percent higher(showing more income inequality) than the coefficientunder the official income definition (0.446).
The net effect of deducting social security payroll taxes,federal individual income taxes, and state individual
income taxes, and adding the earned income tax creditreduced income inequality. This result is shown by defini-tion 8. The share of income going to the bottom threequintiles increased and the share of the highest quintiledeclined. This reduced the Gini coefficient for 1998 fromthat of definition 4 by 4.9 percent, from 0.509 to 0.484.
Table E. Median Household Income by Definition: 1997 and 1998
[Median are in 1998 dollars]
Definition of incomeMedian income
Percent change1997-19981998 1997
INCOME BEFORE TAXES:
1. Money income excluding capital gains (official measure). . . . . . . . . . . . . . . . . . . . . . 38,885 37,581 * 3.52. Definition 1 less government cash transfers . . . . . . . . . . . . . . . . . . . . . . . . . . . . . . . . . 35,712 34,495 * 3.53. Definition 2 plus capital gains. . . . . . . . . . . . . . . . . . . . . . . . . . . . . . . . . . . . . . . . . . . . . . 36,011 34,766 * 3.64. Definition 3 plus health insurance supplements to wage or salary income. . . . . . . 37,673 36,536 * 3.1
INCOME AFTER TAXES:
5. Definition 4 less social security payroll taxes . . . . . . . . . . . . . . . . . . . . . . . . . . . . . . . . 35,369 34,234 * 3.36. Definition 5 less federal income taxes (excluding the EIC) . . . . . . . . . . . . . . . . . . . . 32,656 31,463 * 3.87. Definition 6 plus the earned income credit (EIC) . . . . . . . . . . . . . . . . . . . . . . . . . . . . . 32,801 31,611 * 3.88. Definition 7 less state income taxes . . . . . . . . . . . . . . . . . . . . . . . . . . . . . . . . . . . . . . . . 31,816 30,721 * 3.69. Definition 8 plus nonmeans-tested government cash transfers . . . . . . . . . . . . . . . . . 35,183 33,950 * 3.610. Definition 9 plus the value of medicare . . . . . . . . . . . . . . . . . . . . . . . . . . . . . . . . . . . . 37,001 35,833 * 3.311. Definition 10 plus the value of regular-price school lunches . . . . . . . . . . . . . . . . . . 37,012 35,845 * 3.312. Definition 11 plus means-tested government cash transfers . . . . . . . . . . . . . . . . . . 37,195 36,002 * 3.313. Definition 12 plus the value of medicaid . . . . . . . . . . . . . . . . . . . . . . . . . . . . . . . . . . . 37,530 36,300 * 3.414. Definition 13 plus the value of other means-tested government noncash
transfers . . . . . . . . . . . . . . . . . . . . . . . . . . . . . . . . . . . . . . . . . . . . . . . . . . . . . . . . . . . . . . 37,673 36,419 * 3.415. Definition 14 plus net imputed return on equity in own home . . . . . . . . . . . . . . . . . 39,308 38,209 * 2.9
* Statistically significant at the 90-percent confidence level.
Source: U.S. Census Bureau, Current Population Survey, March 1998 and 1999.
Table F. Percentage of Aggregate Income Received by Income Quintiles and Gini Coefficient byDefinition of Income: 1998
Definition of incomeQuintiles
Gini coefficientLowest Second Third Fourth Highest
Definition 1 (official measure) . . . . . . . . . . . . . . . . . . 3.6 9.2 14.9 23.3 49.0 .446
Definition 4 (definition 1 less government cashtransfers plus capital gains and employeehealth benefits) . . . . . . . . . . . . . . . . . . . . . . . . . . . . . 1.0 7.1 14.2 23.4 54.1 .509
Definition 8 (definition 4 less taxes, includesEIC) . . . . . . . . . . . . . . . . . . . . . . . . . . . . . . . . . . . . . . . 1.3 8.4 15.5 24.3 50.5 .484
Definition 11 (definition 8 plus nonmeans-testedgovernment cash transfers). . . . . . . . . . . . . . . . . . . 4.0 10.3 16.0 23.2 46.5 .419
Definition 14 (definition 11 plus means-testedgovernment cash transfers) . . . . . . . . . . . . . . . . . 4.7 10.6 16.0 23.0 45.8 .405
Definition 15 (definition 14 plus return on homeequity) . . . . . . . . . . . . . . . . . . . . . . . . . . . . . . . . . . . . . 4.9 10.7 16.0 23.0 45.4 .399
Source: U.S. Census Bureau, Current Population Survey, March 1999.
xix
U.S. Census Bureau

Nonmeans-tested transfers reduced income inequalitymore than taxes. These transfers lowered the Gini coeffi-cient by 13.4 percent, from 0.484 to 0.419, as shown bycomparing definition 11 estimates with definition 8 esti-mates. Including the benefits increased the share ofincome going to the lowest quintile (from 1.3 percent to4.0 percent) and lowered the share of income going to thehighest quintile (from 50.5 percent to 46.5 percent).
Means-tested transfers also reduced income inequality,as shown by definition 14. The share of income in the low-est quintile increased from 4.0 percent to 4.7 percent,though the change in the share of income going to thehighest quintile was not significantly different at 45.8 per-cent. The Gini coefficient declined 3.3 percent from 0.419to 0.405. The inclusion of net imputed return on homeequity had a minimal effect on the Gini coefficient, asshown by definition 15.
An important finding of the Census Bureau’s tax andbenefit research is that government transfers have a sig-nificantly greater impact on lowering income inequalitythan the tax system. In 1998, subtracting taxes andincluding the earned income credit (EIC) lowered the Ginicoefficient by 4.9 percent (from 0.509 to 0.484), while
including transfers lowered the Gini coefficient by 16.3percent (from 0.484 to 0.405).
Effects on Selected Population Groups
Taxes and transfers affect income comparisons amongpopulation subgroups to varying degrees, as shown inTable G.
Under the official income definition, the median house-hold income of Blacks ($25,351) was 62 percent of themedian household income of Whites ($40,912). Subtract-ing cash transfers and adding capital gains and healthinsurance supplements (definition 4) reduced that percent-age to 59 percent. The subtraction of federal and stateincome taxes and payroll taxes and inclusion of EIC (defi-nition 8) resulted in an increase to 64 percent, and theaddition of cash (definition 11) and noncash transfers(definition 14) resulted in a further increase in the Black-to-White income percentage to 68 percent.
The different definitions of income affect comparisonsof various types of households. Under the official incomedefinition, the median income of households with a femalehouseholder (no husband present) with children was 36
Table G. Median Income Using Different Definitions for Households With Selected Characteristics:1998
[Dollars]
Characteristics
Definition 1(Official
measure)
Definition 4(Definition 1
lessgovernment
cash transfersplus capital
gains andemployee
healthbenefits)
Definition 8(Definition 4
less taxes,includes EIC)
Definition 11(Definition 8
plusnonmeans
testedgovernment
cash transfers)
Definition 14(Definition 11
plusmeans-tested
governmentcash transfers)
Definition 15(Definition 14
plus return onhome equity)
All households . . . . . . . . . . . . . . . . . . . . . . . . . . 38,885 37,673 31,816 37,012 37,673 39,308
RACE AND HISPANIC ORIGIN OFHOUSEHOLDER
White . . . . . . . . . . . . . . . . . . . . . . . . . . . . . . . . . . . . . . . 40,912 39,910 33,494 38,785 39,283 41,024Black . . . . . . . . . . . . . . . . . . . . . . . . . . . . . . . . . . . . . . . 25,351 23,587 21,344 24,869 26,714 27,560Asian or Pacific Islander . . . . . . . . . . . . . . . . . . . . . . 46,637 48,029 39,163 41,533 42,341 44,140Hispanic origin1 . . . . . . . . . . . . . . . . . . . . . . . . . . . . . . 28,330 28,155 25,440 27,754 29,013 29,786
TYPE OF HOUSEHOLD
Married-couple households with related childrenunder 18 . . . . . . . . . . . . . . . . . . . . . . . . . . . . . . . . . . . 57,090 59,809 49,925 51,177 51,565 52,967
Female householder, no husband present withrelated children under 18. . . . . . . . . . . . . . . . . . . . . 20,692 19,969 20,074 21,528 24,103 24,581
AGE OF HOUSEHOLD MEMBERS
With members 65 years old and over . . . . . . . . . . . 23,369 10,337 9,890 29,781 30,314 33,261With related children under 18 . . . . . . . . . . . . . . . . . 46,562 48,765 41,613 43,203 44,028 45,086
1Persons of Hispanic origin may be of any race.
Source: U.S. Census Bureau, Current Population Survey, March 1999.
xx
U.S. Census Bureau

percent that of married-couple households with children.Based on a definition of income that includes the effect oftaxes and transfers (definition 14), the percentageincreased to 47 percent.
The effects of the different income definitions are par-ticularly evident for households with children and elderlymembers. Under definition 1, median money income forhouseholds with children under 18 years of age was$46,562 in 1998, while for households with members 65years old and over it was $23,369—or half as much (50percent). Subtracting cash transfers and adding capitalgains and employer-provided health insurance (definition4) lowered the ratio from 50 percent to 21 percent, whileincorporating the effect of the tax system (definition 8)raised it to 24 percent. Adding cash (definition 11) andnoncash transfers (definition 14) almost tripled it, bringingit to 69 percent, and adding the return on home equity(definition 15) resulted in a further increase to 74 percent.
MEASUREMENT NOTE
The Census Bureau changed the way dividend incomewas collected in March 1999. This resulted in morerespondents reporting receiving dividend income or hav-ing dividend income imputed this year than in previous
years. Aggregate dividend income increased by 23 percentbetween 1997 and 1998 to a level $116.25 billion. Only asmall proportion was due to increased imputation. Theshare of imputed dividends increased by approximately 4percentage points.
ROUNDING
The Census Bureau rounds percentages to the nearesttenth of a percent; therefore, the percentages in a distribu-tion do not always add to exactly 100.0 percent.
SYMBOLS USED IN TABLES
– Represents zero or rounds to zero.
B Base less than 75,000.
NA Not available.
r Revised.
X Not applicable.
xxi
U.S. Census Bureau

Table 1. Median Income of Households by Selected Characteristics, Race, and Hispanic Originof Householder: 1998, 1997, and 1996
[Households as of March of the following year. An asterisk (*) preceding percent change indicates statistically significant change at the 90~percent confidence level. For meaning of symbols, see text]
Characteristic
199619971998
Median income Median income Median income
Number(1,000)
Value(dollars)
Standarderror
(dollars)Number(1,000)
Value(dollars)
Standarderror
(dollars)Number(1,000)
Value(dollars)
Standarderror
(dollars)
Percentchangein real
median income
(1997~1998)
ALL RACES
All households 103 874.................... 38 885 230 102 528 37 005 171 101 018 35 492 179 * 3.5
Type of Residence
Inside metropolitan areas 83 441................ 40 983 214 82 122 39 381 268 80 950 37 640 245 * 2.51 million or more 55 541..................... 43 431 372 54 667 41 502 254 53 760 39 815 327 * 3.0
Inside central cities 20 513................. 33 559 500 20 310 31 789 356 19 934 30 150 385 * 3.9Outside central cities 35 028............... 49 940 394 34 357 47 981 476 33 825 45 526 365 * 2.5
Under 1 million 27 900...................... 36 420 330 27 455 35 409 335 27 190 34 430 402 1.3Inside central cities 11 631................. 32 488 535 11 597 31 168 425 11 413 30 659 405 2.6Outside central cities 16 269............... 39 428 564 15 858 38 581 518 15 778 37 399 456 0.6
Outside metropolitan areas 20 433.............. 32 022 383 20 406 30 057 413 20 068 28 089 395 * 4.9
Region
Northeast 19 877.............................. 40 634 469 19 810 38 929 525 19 724 37 406 456 * 2.8Midwest 24 489............................... 40 609 365 24 236 38 316 447 23 972 36 579 365 * 4.4South 36 959................................. 35 797 304 36 578 34 345 347 35 693 32 422 288 * 2.6West 22 549.................................. 40 983 402 21 905 39 162 545 21 629 37 125 387 * 3.0
Type of Household
Family households 71 535...................... 47 469 249 70 880 45 347 236 70 241 43 082 251 * 3.1Married~couple families 54 770............... 54 276 322 54 317 51 681 232 53 604 49 858 290 * 3.4Male householder, no wifepresent 3 976............................ 39 414 993 3 911 36 634 719 3 847 35 658 909 * 5.9
Female householder, no husbandpresent 12 789............................ 24 393 398 12 652 23 040 393 12 790 21 564 326 * 4.2
Nonfamily households 32 339................... 23 441 284 31 648 21 705 208 30 777 20 973 205 * 6.3Male householder 14 368.................... 30 414 340 14 133 27 592 461 13 707 27 266 315 * 8.5
Living alone 10 966....................... 26 021 334 11 010 23 871 425 10 442 24 050 401 * 7.3Female householder 17 971................. 18 615 281 17 516 17 613 256 17 070 16 398 219 * 4.1
Living alone 15 640....................... 16 406 236 15 317 15 530 245 14 961 14 626 183 * 4.0
Age of Householder
Under 65 years 82 286......................... 44 697 274 81 031 42 365 201 79 610 40 941 188 * 3.915 to 24 years 5 770....................... 23 564 444 5 435 22 583 492 5 160 21 438 417 2.725 to 34 years 18 819....................... 40 069 423 19 033 38 174 452 19 314 35 888 355 * 3.435 to 44 years 23 968....................... 48 451 444 23 943 46 359 381 23 823 44 420 446 * 2.945 to 54 years 20 158....................... 54 148 533 19 547 51 875 435 18 843 50 472 484 * 2.855 to 64 years 13 571....................... 43 167 601 13 072 41 356 457 12 469 39 815 615 * 2.8
65 years and over 21 589...................... 21 729 240 21 497 20 761 243 21 408 19 448 208 * 3.165 to 74 years 11 373....................... 26 112 399 11 272 25 292 391 11 679 23 411 339 1.775 years and over 10 216................... 17 885 283 10 226 17 079 245 9 729 15 995 246 * 3.1
Size of Household
One person 26 606............................ 20 154 221 26 327 18 762 209 25 402 17 897 225 * 5.8Two people 34 262............................ 41 512 301 32 965 39 343 352 32 736 37 283 303 * 3.9Three people 17 386........................... 49 069 517 17 331 47 115 455 17 065 44 813 422 * 2.5Four people 15 030............................ 55 886 607 15 358 53 165 585 15 396 51 405 392 * 3.5Five people 6 962............................ 53 706 911 7 048 50 407 701 6 774 47 841 841 * 4.9Six people 2 367............................. 49 080 1 500 2 232 46 465 1 326 2 311 42 438 1 277 4.0Seven people or more 1 261................... 46 646 1 675 1 267 42 343 1 688 1 334 40 337 1 458 * 8.5
Number of Earners
No earners 21 263............................. 14 442 147 21 280 14 142 152 21 228 13 320 143 0.6One earner 36 216............................ 31 162 182 35 150 29 780 259 34 026 27 895 237 * 3.0Two earners or more 46 396.................... 60 787 258 46 098 57 525 310 45 764 55 547 262 * 4.0
Two earners 36 501........................ 57 388 319 36 188 54 192 340 35 753 52 416 276 * 4.3Three earners 7 409....................... 70 012 816 7 429 67 182 734 7 455 62 428 655 * 2.6Four earners or more 2 485................. 86 676 1 640 2 480 84 816 1 324 2 556 78 504 1 349 0.6
Work Experience of Householder
Total 103 874............................ 38 885 230 102 528 37 005 171 101 018 35 492 179 * 3.5Worked 74 296................................ 48 179 262 73 415 45 877 218 72 377 43 975 237 * 3.4
Worked full~time, year~round 54 963.......... 53 033 301 53 665 51 336 212 52 699 49 530 307 * 1.7Did not work 29 578........................... 19 093 193 29 113 18 143 194 28 641 16 730 171 * 3.6
See footnotes at end of table.
INCOME 1U.S. Census Bureau

Table 1. Median Income of Households by Selected Characteristics, Race, and Hispanic Originof Householder: 1998, 1997, and 1996 mCon.
[Households as of March of the following year. An asterisk (*) preceding percent change indicates statistically significant change at the 90~percent confidence level. For meaning of symbols, see text]
Characteristic
199619971998
Median income Median income Median income
Number(1,000)
Value(dollars)
Standarderror
(dollars)Number(1,000)
Value(dollars)
Standarderror
(dollars)Number(1,000)
Value(dollars)
Standarderror
(dollars)
Percentchangein real
median income
(1997~1998)
WHITE
All households 87 212.................... 40 912 204 86 106 38 972 247 85 059 37 161 191 * 3.4
Type of Residence
Inside metropolitan areas 68 821................ 43 491 330 67 800 41 576 232 67 006 40 113 238 * 3.01 million or more 44 738..................... 46 831 334 44 096 44 581 409 43 436 42 207 286 * 3.4
Inside central cities 13 932................. 37 691 668 13 918 35 451 529 13 622 33 213 655 * 4.7Outside central cities 30 806............... 50 867 370 30 179 49 290 502 29 813 46 460 389 1.6
Under 1 million 24 083...................... 38 233 455 23 703 36 906 363 23 570 36 222 381 2.0Inside central cities 9 338................. 35 290 572 9 258 33 113 646 9 095 32 943 653 * 4.9Outside central cities 14 744............... 40 506 511 14 446 39 352 516 14 475 38 051 492 1.4
Outside metropolitan areas 18 392.............. 33 104 520 18 307 31 110 428 18 053 29 536 405 * 4.8
Region
Northeast 16 901.............................. 43 246 581 16 926 41 214 431 16 848 40 120 518 * 3.3Midwest 21 659............................... 42 218 423 21 465 40 040 414 21 254 38 057 473 * 3.8South 29 305................................. 38 489 414 28 948 36 681 340 28 382 35 214 365 * 3.3West 19 347.................................. 41 122 437 18 767 39 479 579 18 575 37 281 439 * 2.6
Type of Household
Family households 60 068...................... 49 781 277 59 511 47 454 277 58 934 45 382 244 * 3.3Married~couple families 48 456............... 54 845 329 48 066 52 199 248 47 650 50 302 250 * 3.5Male householder, no wifepresent 3 086............................ 41 384 889 3 137 38 511 1 141 2 944 36 938 887 * 5.8
Female householder, no husbandpresent 8 526............................ 27 542 434 8 308 25 670 422 8 339 24 375 407 * 5.6
Nonfamily households 27 144................... 24 582 310 26 596 22 380 247 26 125 21 536 222 * 8.2Male householder 11 995.................... 31 659 366 11 725 30 009 459 11 481 28 520 486 * 3.9
Living alone 9 028....................... 27 096 377 9 018 25 415 405 8 730 25 098 378 * 5.0Female householder 15 150................. 19 239 286 14 871 17 997 273 14 644 16 765 227 * 5.3
Living alone 13 148....................... 16 960 252 12 980 15 818 272 12 783 14 890 194 * 5.6
Age of Householder
Under 65 years 67 958......................... 47 303 238 66 910 45 210 241 65 877 43 353 253 * 3.015 to 24 years 4 587....................... 25 108 502 4 242 24 423 620 4 040 22 606 523 1.225 to 34 years 15 062....................... 42 131 406 15 344 40 477 347 15 661 38 283 435 * 2.535 to 44 years 19 793....................... 51 091 416 19 761 49 695 520 19 642 47 046 389 1.245 to 54 years 16 939....................... 56 704 509 16 400 54 879 622 15 936 52 750 575 1.755 to 64 years 11 577....................... 45 803 696 11 163 43 053 788 10 598 42 027 583 * 4.8
65 years and over 19 254...................... 22 442 263 19 196 21 374 255 19 182 19 977 230 * 3.465 to 74 years 9 998....................... 27 385 435 9 917 26 363 415 10 366 24 169 355 2.375 years and over 9 257................... 18 205 294 9 279 17 410 257 8 816 16 402 246 3.0
Size of Household
One person 22 176............................ 20 845 237 21 998 19 288 219 21 513 18 426 235 * 6.4Two people 29 897............................ 43 218 451 28 817 40 954 296 28 534 39 039 393 * 3.9Three people 14 217........................... 51 462 441 14 215 50 269 483 14 042 47 529 541 0.8Four people 12 476............................ 58 580 676 12 654 55 819 556 12 739 53 704 649 * 3.3Five people 5 699............................ 56 169 772 5 801 52 493 916 5 459 51 102 842 * 5.4Six people 1 848............................. 52 721 1 579 1 738 48 974 1 668 1 831 44 782 1 906 6.0Seven people or more 898................... 51 915 2 424 883 46 044 2 306 941 45 241 1 865 * 11.0
Number of Earners
No earners 17 968............................. 15 929 199 18 104 15 324 187 17 815 14 579 151 2.4One earner 29 308............................ 32 844 304 28 332 31 412 197 27 854 29 592 254 * 3.0Two earners or more 39 936.................... 61 747 284 39 670 58 947 380 39 391 56 521 288 * 3.1
Two earners 31 477........................ 58 524 360 31 256 55 474 316 30 828 53 362 332 * 3.9Three earners 6 380....................... 70 882 912 6 306 68 363 799 6 356 63 919 827 2.1Four earners or more 2 080................. 90 049 1 874 2 108 86 319 1 586 2 207 78 899 1 512 2.7
Work Experience of Householder
Total 87 212............................ 40 912 204 86 106 38 972 247 85 059 37 161 191 * 3.4Worked 62 385................................ 50 360 232 61 469 47 973 297 61 132 45 813 231 * 3.4
Worked full~time, year~round 46 411.......... 55 001 308 45 226 53 045 325 44 833 51 055 235 * 2.1Did not work 24 827........................... 20 463 235 24 637 19 342 201 23 927 18 003 206 * 4.2
See footnotes at end of table.
2 INCOMEU.S. Census Bureau

Table 1. Median Income of Households by Selected Characteristics, Race, and Hispanic Originof Householder: 1998, 1997, and 1996 mCon.
[Households as of March of the following year. An asterisk (*) preceding percent change indicates statistically significant change at the 90~percent confidence level. For meaning of symbols, see text]
Characteristic
199619971998
Median income Median income Median income
Number(1,000)
Value(dollars)
Standarderror
(dollars)Number(1,000)
Value(dollars)
Standarderror
(dollars)Number(1,000)
Value(dollars)
Standarderror
(dollars)
Percentchangein real
median income
(1997~1998)
BLACK
All households 12 579.................... 25 351 397 12 474 25 050 431 12 109 23 482 462 –0.3
Type of Residence
Inside metropolitan areas 10 928................ 26 024 428 10 761 25 720 463 10 492 25 019 485 –0.41 million or more 8 001..................... 26 828 551 7 884 26 967 529 7 739 25 693 537 –2.0
Inside central cities 5 274................. 22 717 706 5 157 23 156 703 4 999 21 573 605 –3.4Outside central cities 2 726............... 35 646 1 348 2 727 34 949 1 261 2 740 34 448 1 072 0.4
Under 1 million 2 928...................... 24 041 1 081 2 877 21 683 792 2 753 22 957 967 * 9.2Inside central cities 1 832................. 22 386 1 061 1 876 19 901 913 1 825 19 941 1 118 * 10.8Outside central cities 1 095............... 26 026 1 029 1 002 24 597 1 286 928 27 913 1 572 4.2
Outside metropolitan areas 1 651.............. 21 123 1 076 1 713 20 184 1 735 1 617 16 903 1 013 3.0
Region
Northeast 2 354.............................. 22 908 1 060 2 286 23 312 1 033 2 278 22 177 836 –3.2Midwest 2 344............................... 24 215 874 2 288 23 861 1 032 2 251 23 314 1 150 –0.1South 6 817................................. 25 420 528 6 814 25 074 555 6 519 23 277 647 –0.2West 1 064.................................. 33 040 2 297 1 086 29 988 1 405 1 061 30 176 1 939 8.5
Type of Household
Family households 8 444...................... 30 636 574 8 408 29 915 570 8 455 27 496 631 0.8Married~couple families 3 975............... 47 382 1 171 3 921 45 372 755 3 851 42 069 1 000 2.8Male householder, no wifepresent 660............................ 30 360 1 742 562 28 593 1 191 657 30 995 990 4.6
Female householder, no husbandpresent 3 809............................ 17 737 516 3 926 17 962 627 3 947 16 256 512 –2.8
Nonfamily households 4 135................... 16 071 646 4 066 17 073 559 3 654 15 454 661 * –7.3Male householder 1 827.................... 20 673 912 1 876 19 459 864 1 669 20 525 960 4.6
Living alone 1 545....................... 18 351 1 065 1 594 17 139 921 1 303 16 447 1 058 5.4Female householder 2 308................. 13 608 592 2 190 15 341 722 1 985 12 434 654 *–12.7
Living alone 2 087....................... 12 397 540 1 982 13 738 837 1 823 11 529 559 *–11.1
Age of Householder
Under 65 years 10 703......................... 27 764 611 10 595 27 238 455 10 291 25 699 410 0.415 to 24 years 866....................... 13 630 1 611 935 15 056 1 284 871 13 246 918 –10.925 to 34 years 2 750....................... 26 346 654 2 752 26 149 857 2 687 23 275 871 –0.835 to 44 years 3 110....................... 31 297 835 3 096 27 710 769 3 095 29 859 939 * 11.245 to 54 years 2 444....................... 35 472 1 123 2 371 33 761 1 766 2 210 33 878 1 738 3.555 to 64 years 1 532....................... 25 200 1 243 1 441 27 350 1 936 1 428 23 449 1 227 –9.3
65 years and over 1 877...................... 13 936 563 1 878 14 241 583 1 818 14 019 450 –3.665 to 74 years 1 084....................... 14 560 764 1 123 16 287 965 1 085 15 944 837 *–12.075 years and over 793................... 12 886 881 755 12 101 715 733 12 102 753 4.9
Size of Household
One person 3 633............................ 14 285 487 3 576 15 258 563 3 126 13 771 478 * –7.8Two people 3 339............................ 26 506 638 3 120 26 870 775 3 196 24 844 944 –2.9Three people 2 342........................... 28 661 1 233 2 338 28 047 1 287 2 298 26 321 810 0.6Four people 1 771............................ 37 862 1 666 1 930 35 529 1 283 1 891 32 944 1 318 4.9Five people 905............................ 36 160 1 479 916 36 525 2 596 988 31 806 1 209 –2.5Six people 348............................. 31 752 2 325 340 32 050 2 871 333 30 931 1 875 –2.4Seven people or more 242................... 31 420 1 756 253 30 799 3 558 277 27 318 2 842 0.5
Number of Earners
No earners 2 759............................. 8 084 214 2 660 8 172 249 2 800 7 612 220 –2.6One earner 5 472............................ 22 046 361 5 428 21 319 386 4 867 20 658 385 1.8Two earners or more 4 348.................... 50 668 704 4 386 47 602 776 4 442 45 129 841 * 4.8
Two earners 3 453........................ 46 905 930 3 459 44 728 730 3 512 42 539 900 3.3Three earners 657....................... 58 713 2 611 755 57 599 1 698 745 51 894 1 837 0.4Four earners or more 238................. 74 696 3 595 172 77 190 4 350 185 71 429 6 961 –4.7
Work Experience of Householder
Total 12 579............................ 25 351 397 12 474 25 050 431 12 109 23 482 462 –0.3Worked 8 735................................ 33 046 673 8 855 31 461 417 8 301 31 259 461 * 3.4
Worked full~time, year~round 6 221.......... 39 565 810 6 141 36 928 541 5 742 36 939 593 * 5.5Did not work 3 845........................... 10 656 402 3 619 10 523 375 3 808 9 840 272 –0.3
See footnotes at end of table.
INCOME 3U.S. Census Bureau

Table 1. Median Income of Households by Selected Characteristics, Race, and Hispanic Originof Householder: 1998, 1997, and 1996 mCon.
[Households as of March of the following year. An asterisk (*) preceding percent change indicates statistically significant change at the 90~percent confidence level. For meaning of symbols, see text]
Characteristic
199619971998
Median income Median income Median income
Number(1,000)
Value(dollars)
Standarderror
(dollars)Number(1,000)
Value(dollars)
Standarderror
(dollars)Number(1,000)
Value(dollars)
Standarderror
(dollars)
Percentchangein real
median income
(1997~1998)
HISPANIC ORIGIN1
All households 9 060.................... 28 330 545 8 590 26 628 474 8 225 24 906 482 * 4.8
Type of Residence
Inside metropolitan areas 8 322................ 28 819 581 7 808 27 078 517 7 475 25 362 506 * 4.81 million or more 6 157..................... 30 206 570 5 805 28 433 740 5 587 26 318 595 * 4.6
Inside central cities 3 258................. 25 655 638 3 099 23 398 789 2 995 21 903 591 * 8.0Outside central cities 2 900............... 35 892 809 2 706 35 506 1 081 2 592 32 013 815 –0.5
Under 1 million 2 165...................... 25 292 875 2 002 23 883 1 079 1 888 22 367 935 4.3Inside central cities 1 241................. 23 543 1 521 1 180 23 262 1 551 1 126 21 823 1 107 –0.3Outside central cities 924............... 26 748 1 318 822 24 408 1 273 762 23 334 1 447 7.9
Outside metropolitan areas 738.............. 24 537 1 784 783 22 383 1 800 750 20 244 1 606 7.9
Region
Northeast 1 526.............................. 26 009 1 244 1 468 24 023 1 435 1 424 20 859 1 041 6.6Midwest 651............................... 32 365 1 764 644 31 009 1 676 592 30 177 1 745 2.8South 3 200................................. 27 222 818 2 939 26 207 754 2 797 24 814 802 2.3West 3 684.................................. 29 193 810 3 539 27 276 930 3 412 25 619 759 * 5.4
Type of Household
Family households 7 270...................... 30 812 505 6 961 29 253 638 6 631 27 152 541 * 3.7Married~couple families 4 945............... 35 207 668 4 804 34 317 890 4 520 32 379 756 1.0Male householder, no wifepresent 600............................ 32 239 1 393 545 28 249 1 839 494 28 322 1 522 * 12.4
Female householder, no husbandpresent 1 725............................ 18 452 927 1 612 16 393 641 1 617 14 535 695 * 10.8
Nonfamily households 1 790................... 16 805 1 243 1 630 16 807 902 1 593 15 705 757 –1.5Male householder 927.................... 23 427 1 566 875 21 059 857 854 19 323 1 394 9.5
Living alone 644....................... 18 358 1 975 623 16 524 930 575 14 506 1 240 9.4Female householder 863................. 11 669 654 754 11 485 667 740 11 770 958 –
Living alone 685....................... 9 812 529 617 9 666 605 621 9 746 619 –0.1
Age of Householder
Under 65 years 8 096......................... 30 131 507 7 674 28 315 644 7 329 26 368 489 * 4.815 to 24 years 908....................... 21 739 1 156 780 19 341 1 021 687 17 200 858 * 10.725 to 34 years 2 423....................... 28 980 854 2 303 27 519 879 2 263 26 444 705 3.735 to 44 years 2 412....................... 32 488 1 029 2 316 31 148 900 2 229 27 781 974 2.745 to 54 years 1 447....................... 37 026 1 383 1 386 32 074 1 290 1 296 30 709 1 641 * 13.755 to 64 years 906....................... 28 765 1 720 889 27 648 2 325 854 26 294 1 956 2.4
65 years and over 964...................... 14 729 802 916 14 168 868 895 14 006 1 045 2.465 to 74 years 632....................... 16 542 1 167 566 15 885 1 271 611 16 104 1 035 2.575 years and over 332................... 12 246 935 350 11 015 1 261 284 11 337 934 9.5
Size of Household
One person 1 329............................ 12 584 676 1 240 12 222 777 1 195 11 894 632 1.4Two people 1 972............................ 26 522 917 1 838 26 390 961 1 815 22 258 803 –1.0Three people 1 767........................... 29 405 1 133 1 728 26 396 1 050 1 650 27 078 1 143 * 9.7Four people 1 823............................ 32 998 1 203 1 763 33 053 1 577 1 632 30 048 1 054 –1.7Five people 1 264............................ 33 714 1 677 1 199 31 586 1 247 995 30 356 1 152 5.1Six people 544............................. 33 797 1 699 463 30 185 2 045 538 27 510 1 953 10.2Seven people or more 361................... 41 343 3 717 358 36 088 3 060 399 34 864 2 754 12.8
Number of Earners
No earners 1 296............................. 8 353 328 1 312 7 842 351 1 281 7 912 320 4.9One earner 3 303............................ 21 175 440 3 081 20 464 401 2 959 18 883 540 1.9Two earners or more 4 461.................... 42 941 771 4 197 41 081 590 3 984 39 231 864 * 2.9
Two earners 3 234........................ 38 288 1 043 3 096 37 106 799 2 863 34 835 969 1.6Three earners 842....................... 48 156 1 743 759 47 569 1 604 787 47 044 1 735 –0.3Four earners or more 386................. 71 630 2 486 342 58 360 2 270 334 58 055 2 792 * 20.9
Work Experience of Householder
Total 9 060............................ 28 330 545 8 590 26 628 474 8 225 24 906 482 * 4.8Worked 6 851................................ 33 355 658 6 401 32 019 462 6 058 30 226 534 2.6
Worked full~time, year~round 4 922.......... 37 152 647 4 592 36 701 629 4 228 35 038 765 –0.3Did not work 2 209........................... 13 618 569 2 189 11 893 442 2 167 11 737 438 * 12.8
1Hispanics may be of any race.
4 INCOMEU.S. Census Bureau

Table 2. Selected Characteristics mHouseholds by Total Money Income in 1998[Numbers in thousands. Households as of March of the following year. For meaning of symbols, see text]
Characteristic
Median income Mean income
Total
Lessthan
$5,000
$5,000to
$9,999
$10,000to
$14,999
$15,000to
$24,999
$25,000to
$34,999
$35,000to
$49,999
$50,000to
$74,999
$75,000to
$99,999
$100,000and
overValue
(dollars)
Standarderror
(dollars)Value
(dollars)
Standarderror
(dollars)
All households 103 874.......... 3 373 7 332 8 093 14 587 13 698 16 660 19 272 9 934 10 926 38 885 230 51 855 280
TYPE OF RESIDENCE
Inside metropolitan areas 83 441....... 2 687 5 408 6 193 11 103 10 669 13 091 15 643 8 636 10 012 40 983 215 54 725 330Inside central cities 32 144.......... 1 562 2 909 3 042 4 878 4 320 4 931 5 134 2 581 2 788 33 151 388 46 467 460
1 million or more 20 513.......... 997 1 954 1 987 2 999 2 628 3 065 3 269 1 686 1 928 33 559 500 47 529 595Under 1 million 11 631............ 566 955 1 054 1 879 1 692 1 867 1 865 895 859 32 488 535 44 593 716
Outside central cities 51 297......... 1 125 2 499 3 151 6 225 6 349 8 159 10 509 6 055 7 224 46 402 311 59 901 4491 million or more 35 028.......... 671 1 523 1 974 3 830 4 083 5 452 7 312 4 421 5 762 49 940 395 63 998 571Under 1 million 16 269............ 454 976 1 177 2 395 2 266 2 707 3 198 1 634 1 462 39 428 564 51 079 693
Outside metropolitan areas 20 433..... 686 1 924 1 900 3 484 3 029 3 569 3 629 1 298 914 32 022 383 40 131 547
REGION
Northeast 19 877.................... 687 1 468 1 580 2 614 2 358 3 007 3 582 2 048 2 532 40 634 469 55 041 624Midwest 24 489...................... 646 1 541 1 834 3 304 3 353 3 940 5 032 2 418 2 422 40 609 365 52 430 592South 36 959........................ 1 391 2 989 2 925 5 683 5 100 5 907 6 473 3 168 3 323 35 797 304 48 284 467West 22 549......................... 648 1 334 1 755 2 985 2 887 3 806 4 185 2 300 2 648 40 983 403 54 274 632
RACE AND HISPANICORIGIN OFHOUSEHOLDER
White 87 212........................ 2 263 5 352 6 468 11 937 11 480 14 230 16 862 8 730 9 889 40 912 205 54 207 319Black 12 579........................ 918 1 773 1 338 2 183 1 700 1 795 1 659 708 507 25 351 397 34 139 456Hispanic origin1 9 060............... 441 912 989 1 620 1 477 1 432 1 271 503 416 28 330 546 38 280 814
TYPE OF HOUSEHOLD
Family households 71 535............. 1 650 2 537 3 653 8 639 8 996 12 192 15 676 8 489 9 702 47 469 249 60 406 371Married~couple families 54 770....... 627 914 1 841 5 488 6 329 9 454 13 301 7 739 9 077 54 276 322 68 010 452Male householder, no wifepresent 3 976................... 97 138 209 641 675 759 845 319 293 39 414 993 48 306 1 053
Female householder, nohusband present 12 789........... 925 1 486 1 603 2 510 1 992 1 979 1 530 431 333 24 393 398 31 608 496
Nonfamily households 32 339.......... 1 723 4 795 4 440 5 948 4 701 4 468 3 596 1 444 1 224 23 441 285 32 938 319Male householder 14 368........... 726 1 358 1 364 2 475 2 237 2 415 2 128 849 816 30 414 340 40 127 565
Living alone 10 966............... 642 1 283 1 201 2 119 1 783 1 768 1 338 425 408 26 021 334 34 572 626Female householder 17 971......... 998 3 437 3 076 3 473 2 464 2 053 1 467 595 408 18 615 281 27 190 342
Living alone 15 640............... 947 3 366 2 951 3 155 2 144 1 638 959 295 186 16 406 236 23 362 321
AGE OF HOUSEHOLDER
Under 65 years 82 286............... 2 741 4 128 4 645 9 694 10 627 14 029 17 386 9 104 9 930 44 697 274 56 688 32715 to 24 years 5 770.............. 493 582 668 1 325 944 932 551 151 123 23 564 445 30 947 99525 to 34 years 18 819.............. 673 833 1 193 2 521 2 932 3 502 4 192 1 713 1 260 40 069 423 47 960 54035 to 44 years 23 968.............. 606 888 1 132 2 426 2 950 4 387 5 529 3 002 3 049 48 451 444 60 103 61645 to 54 years 20 158.............. 475 813 790 1 831 2 119 3 123 4 621 2 724 3 663 54 148 534 67 293 72955 to 64 years 13 571.............. 494 1 013 863 1 590 1 681 2 086 2 494 1 515 1 835 43 167 601 57 952 865
65 years and over 21 589............. 632 3 204 3 448 4 893 3 071 2 631 1 886 829 995 21 729 240 33 432 46865 to 74 years 11 373.............. 306 1 406 1 353 2 400 1 742 1 645 1 257 587 678 26 112 399 38 580 69175 years and over 10 216........... 327 1 798 2 095 2 493 1 329 986 629 243 317 17 885 283 27 700 609
Mean age of householder 48.6...... 45.8 57.0 55.6 51.7 47.9 46.1 45.0 46.0 47.8 (X) (X) (X) (X)
SIZE OF HOUSEHOLD
One person 26 606................... 1 588 4 649 4 151 5 273 3 926 3 406 2 297 720 594 20 154 221 27 982 324Two people 34 262................... 872 1 310 2 051 5 115 4 991 5 936 6 871 3 327 3 788 41 512 301 54 930 515Three people 17 386................. 411 661 844 1 941 2 014 2 999 3 971 2 247 2 297 49 069 518 60 356 708Four people 15 030................... 255 381 544 1 241 1 567 2 536 3 723 2 206 2 578 55 886 607 67 691 770Five people 6 962................... 167 204 310 622 729 1 161 1 680 976 1 113 53 706 911 66 523 1 336Six people 2 367.................... 46 95 126 256 299 383 473 330 360 49 080 1 500 63 626 2 125Seven people or more 1 261......... 33 33 66 138 171 239 256 128 196 46 646 1 676 62 922 3 063
Mean size of household 2.61........ 2.06 1.74 1.98 2.23 2.45 2.72 2.97 3.18 3.25 (X) (X) (X) (X)
NUMBER OF EARNERS
No earners 21 263................... 2 056 5 005 3 984 4 702 2 400 1 594 893 299 330 14 442 147 20 946 242One earner 36 216................... 1 150 2 007 3 350 7 134 6 787 6 670 5 121 1 947 2 050 31 162 183 42 498 461Two earners or more 46 396........... 167 321 759 2 752 4 511 8 396 13 257 7 687 8 545 60 787 258 73 323 453
Two earners 36 501................ 146 308 712 2 527 3 935 7 117 10 427 5 481 5 848 57 388 319 69 238 486Three earners 7 409............... 21 12 47 213 506 1 066 2 223 1 558 1 763 70 012 816 84 455 1 326Four earners or more 2 485........ 0 1 0 12 71 213 608 648 933 86 676 1 640 100 147 1 953
Mean number of earners 1.41....... 0.45 0.37 0.62 0.90 1.23 1.55 1.88 2.11 2.18 (X) (X) (X) (X)
WORK EXPERIENCE OFHOUSEHOLDER
Total 103 874................... 3 373 7 332 8 093 14 587 13 698 16 660 19 272 9 934 10 926 38 885 230 51 855 280Worked 74 296...................... 1 177 2 038 3 571 8 487 9 867 13 421 16 937 8 929 9 869 48 179 263 60 766 353
Worked at full~time jobs 64 566...... 690 1 179 2 485 6 882 8 626 11 941 15 419 8 298 9 046 50 562 223 63 102 38350 weeks or more 54 963......... 283 448 1 676 5 302 7 240 10 323 13 853 7 542 8 296 53 033 301 66 088 42027 to 49 weeks 6 194............ 60 301 447 998 968 1 136 1 103 599 582 39 041 808 52 071 1 21126 weeks or less 3 409.......... 346 430 363 581 418 482 463 158 167 24 525 1 140 34 993 1 078
Worked at part~time jobs 9 730..... 487 859 1 086 1 605 1 241 1 480 1 518 631 823 31 470 618 45 266 85750 weeks or more 4 867......... 118 363 561 872 667 721 763 337 465 32 276 852 47 585 1 24427 to 49 weeks 2 325............ 89 217 234 384 268 407 371 147 209 33 945 1 312 47 049 1 79126 weeks or less 2 538.......... 280 280 290 349 306 352 384 147 149 27 249 1 194 39 184 1 540
Did not work 29 578.................. 2 196 5 294 4 522 6 100 3 831 3 239 2 335 1 005 1 056 19 093 193 29 471 362
See footnotes at end of table.
INCOME 5U.S. Census Bureau

Table 2. Selected Characteristics mHouseholds by Total Money Income in 1998 mCon.[Numbers in thousands. Households as of March of the following year. For meaning of symbols, see text]
Characteristic
Median income Mean income
Total
Lessthan
$5,000
$5,000to
$9,999
$10,000to
$14,999
$15,000to
$24,999
$25,000to
$34,999
$35,000to
$49,999
$50,000to
$74,999
$75,000to
$99,999
$100,000and
overValue
(dollars)
Standarderror
(dollars)Value
(dollars)
Standarderror
(dollars)
EDUCATIONALATTAINMENT2
Total 98 104................... 2 880 6 750 7 425 13 262 12 754 15 727 18 721 9 783 10 802 40 296 194 53 084 290Less than 9th grade 7 047........... 414 1 573 1 327 1 537 918 668 402 104 104 16 154 347 23 501 6109th to 12th grade (no diploma) 9 407.. 586 1 473 1 346 2 056 1 304 1 289 890 286 177 20 724 336 28 234 479High school graduate (includesequivalency) 30 613................. 1 010 2 258 2 613 4 840 4 831 5 534 5 729 2 347 1 450 34 373 334 42 352 370
Some college, no degree 17 833....... 437 771 1 126 2 357 2 579 3 330 3 852 1 842 1 539 41 658 374 51 220 597Associate degree 7 468.............. 146 246 387 772 918 1 376 1 875 924 824 48 604 818 57 317 1 066Bachelor’s degree or more 25 738...... 287 430 626 1 700 2 204 3 531 5 973 4 280 6 707 66 474 499 83 096 755
Bachelor’s degree 16 781........... 191 323 422 1 251 1 616 2 465 4 070 2 758 3 684 62 188 549 75 213 796Master’s degree 5 961............. 60 71 134 340 429 805 1 337 1 061 1 723 71 086 955 87 497 1 692Professional degree 1 623......... 23 19 51 64 81 132 282 200 771 95 309 3 560 127 499 4 787Doctorate degree 1 373............ 13 17 18 45 77 129 284 261 528 84 100 3 491 107 847 3 700
1Hispanics may be of any race.2Restricted to people 25 years and over.
6 INCOMEU.S. Census Bureau

Table 3. People in Households by Total Household Income in 1998, Relationship toHouseholder, Age, Sex, Race, and Hispanic Origin
[Numbers in thousands. People in households as of March of the following year. For meaning of symbols, see text]
Total money income
Male Female
TotalHouse~holder
Spouseof house~
holder
Child ofhouse~holder
Otherrelative
of house~holder
Non~relative Total
House~holder
Spouseof house~
holder
Child ofhouse~holder
Otherrelative
of house~holder
Non~relative
ALL RACES
All Ages
Total 132 665........................... 59 360 13 754 45 631 7 128 6 791 138 881 44 514 41 015 40 954 7 155 5 242Less than $5,000 2 957................... 1 272 177 1 217 165 126 3 992 2 101 449 1 167 174 101$5,000 to $9,999 4 681................... 2 174 236 1 800 278 193 8 058 5 158 678 1 765 308 149$10,000 to $14,999 6 594................. 2 930 485 2 438 402 339 9 462 5 163 1 356 2 260 414 269$15,000 to $19,999 7 291................. 3 377 619 2 477 442 376 8 705 3 940 1 896 2 109 429 331$20,000 to $24,999 7 858................. 3 807 801 2 362 507 381 8 685 3 463 2 172 2 217 489 343$25,000 to $29,999 8 224................. 3 945 716 2 635 500 427 8 820 3 112 2 434 2 364 520 389$30,000 to $34,999 7 989................. 3 771 810 2 545 437 425 8 564 2 870 2 369 2 399 475 451$35,000 to $39,999 7 733................. 3 577 769 2 470 511 406 7 889 2 446 2 347 2 341 456 298$40,000 to $44,999 7 645................. 3 316 837 2 555 448 489 7 616 2 174 2 316 2 343 453 329$45,000 to $49,999 7 413................. 3 310 819 2 332 455 497 7 052 1 837 2 365 2 188 380 283
$50,000 to $54,999 7 326................. 3 287 729 2 552 420 338 6 831 1 636 2 398 2 148 368 281$55,000 to $59,999 6 070................. 2 678 737 2 102 288 264 6 013 1 407 2 079 1 940 341 246$60,000 to $64,999 6 037................. 2 631 701 2 080 293 331 5 698 1 285 2 030 1 920 243 220$65,000 to $69,999 5 051................. 2 260 567 1 712 248 263 4 808 1 019 1 796 1 516 285 191$70,000 to $74,999 4 912................. 2 132 551 1 741 215 273 4 547 935 1 713 1 477 255 166$75,000 to $79,999 3 918................. 1 720 445 1 368 154 231 3 769 745 1 384 1 315 168 157$80,000 to $84,999 4 046................. 1 613 504 1 520 210 198 3 600 786 1 342 1 160 158 154$85,000 to $89,999 3 010................. 1 325 368 1 030 125 163 2 800 572 1 100 883 124 121$90,000 to $94,999 2 910................. 1 220 327 1 100 124 140 2 655 495 1 068 888 114 89$95,000 to $99,999 2 537................. 1 095 289 911 140 101 2 314 362 913 828 133 78$100,000 and over 18 462.................. 7 917 2 268 6 681 767 828 17 004 3 009 6 809 5 724 867 594
Under 3 Years Old
Total 5 965........................... – – 5 141 695 129 5 624 – – 4 882 620 122Less than $5,000 219................... – – 190 21 7 211 – – 186 17 8$5,000 to $9,999 313................... – – 267 35 10 357 – – 298 50 9$10,000 to $14,999 384................. – – 316 55 13 403 – – 360 30 14$15,000 to $19,999 366................. – – 289 65 12 329 – – 274 54 1$20,000 to $24,999 350................. – – 311 39 – 334 – – 292 37 5$25,000 to $29,999 348................. – – 297 36 16 407 – – 357 38 12$30,000 to $34,999 394................. – – 363 20 11 346 – – 299 30 18$35,000 to $39,999 316................. – – 276 35 5 323 – – 287 29 7$40,000 to $44,999 362................. – – 312 43 7 352 – – 314 30 8$45,000 to $49,999 323................. – – 266 46 11 322 – – 264 51 8
$50,000 to $54,999 378................. – – 334 36 8 287 – – 250 33 4$55,000 to $59,999 226................. – – 186 35 5 246 – – 213 32 –$60,000 to $64,999 231................. – – 209 17 4 227 – – 205 19 2$65,000 to $69,999 210................. – – 192 18 1 198 – – 154 34 10$70,000 to $74,999 201................. – – 180 16 5 164 – – 135 28 –$75,000 to $79,999 153................. – – 135 18 – 138 – – 119 17 2$80,000 to $84,999 171................. – – 137 33 1 124 – – 108 10 5$85,000 to $89,999 125................. – – 108 16 1 107 – – 93 11 3$90,000 to $94,999 152................. – – 145 7 – 86 – – 80 6 –$95,000 to $99,999 88................. – – 64 23 2 77 – – 55 19 3$100,000 and over 654.................. – – 564 83 7 584 – – 538 42 4
3 to 5 Years Old
Total 6 133........................... – – 5 481 505 147 5 923 – – 5 317 499 107Less than $5,000 251................... – – 233 19 – 246 – – 231 13 1$5,000 to $9,999 339................... – – 299 34 6 339 – – 318 19 2$10,000 to $14,999 360................. – – 330 23 7 423 – – 375 44 3$15,000 to $19,999 435................. – – 396 31 9 380 – – 318 43 19$20,000 to $24,999 419................. – – 375 31 13 376 – – 330 30 16$25,000 to $29,999 364................. – – 318 36 10 376 – – 342 23 11$30,000 to $34,999 361................. – – 312 34 15 446 – – 382 52 12$35,000 to $39,999 375................. – – 345 25 5 374 – – 338 31 5$40,000 to $44,999 368................. – – 308 41 20 311 – – 275 28 8$45,000 to $49,999 351................. – – 303 42 6 327 – – 286 34 6
$50,000 to $54,999 323................. – – 283 24 15 287 – – 263 20 4$55,000 to $59,999 270................. – – 254 10 6 227 – – 201 24 2$60,000 to $64,999 223................. – – 198 14 11 291 – – 262 20 9$65,000 to $69,999 232................. – – 212 13 7 187 – – 167 19 1$70,000 to $74,999 210................. – – 192 17 – 191 – – 184 5 1$75,000 to $79,999 118................. – – 106 10 2 149 – – 123 23 3$80,000 to $84,999 164................. – – 150 13 1 126 – – 109 17 –$85,000 to $89,999 110................. – – 93 13 4 69 – – 68 1 –$90,000 to $94,999 90................. – – 69 19 2 98 – – 97 1 –$95,000 to $99,999 84................. – – 76 5 3 86 – – 80 6 –$100,000 and over 686.................. – – 630 50 5 615 – – 566 46 3
See footnotes at end of table.
INCOME 7U.S. Census Bureau
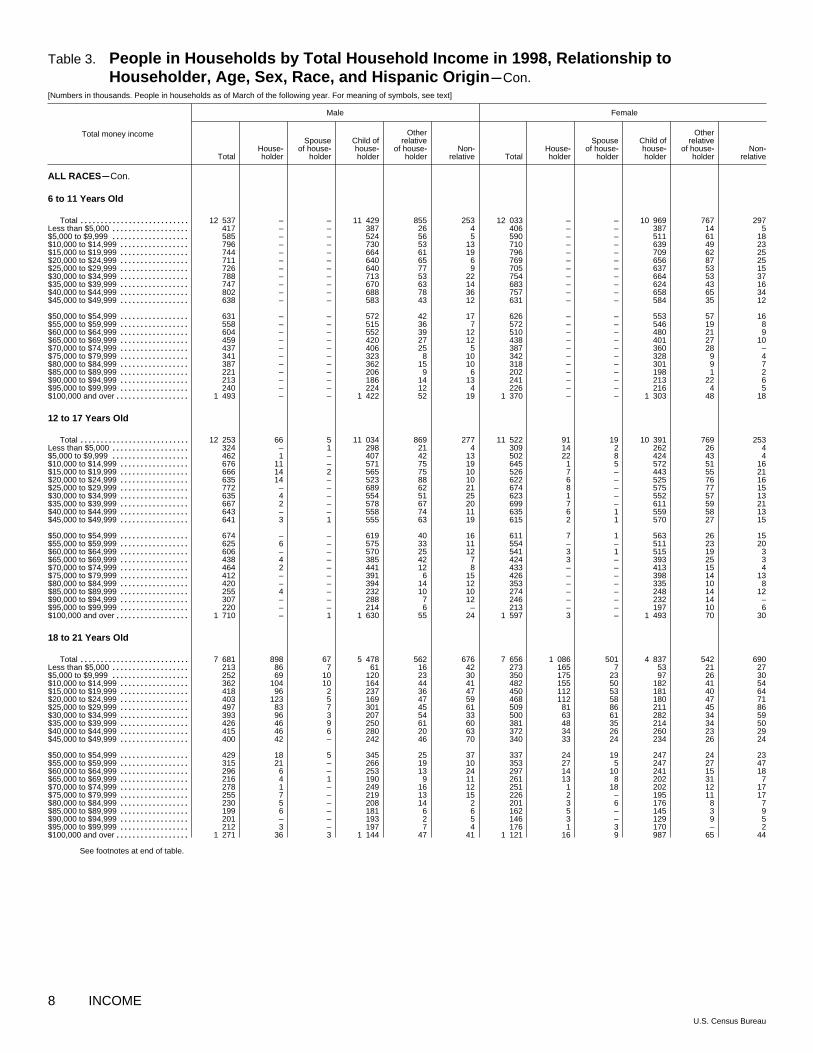
Table 3. People in Households by Total Household Income in 1998, Relationship toHouseholder, Age, Sex, Race, and Hispanic Origin mCon.
[Numbers in thousands. People in households as of March of the following year. For meaning of symbols, see text]
Total money income
Male Female
TotalHouse~holder
Spouseof house~
holder
Child ofhouse~holder
Otherrelative
of house~holder
Non~relative Total
House~holder
Spouseof house~
holder
Child ofhouse~holder
Otherrelative
of house~holder
Non~relative
ALL RACESmCon.
6 to 11 Years Old
Total 12 537........................... – – 11 429 855 253 12 033 – – 10 969 767 297Less than $5,000 417................... – – 387 26 4 406 – – 387 14 5$5,000 to $9,999 585................... – – 524 56 5 590 – – 511 61 18$10,000 to $14,999 796................. – – 730 53 13 710 – – 639 49 23$15,000 to $19,999 744................. – – 664 61 19 796 – – 709 62 25$20,000 to $24,999 711................. – – 640 65 6 769 – – 656 87 25$25,000 to $29,999 726................. – – 640 77 9 705 – – 637 53 15$30,000 to $34,999 788................. – – 713 53 22 754 – – 664 53 37$35,000 to $39,999 747................. – – 670 63 14 683 – – 624 43 16$40,000 to $44,999 802................. – – 688 78 36 757 – – 658 65 34$45,000 to $49,999 638................. – – 583 43 12 631 – – 584 35 12
$50,000 to $54,999 631................. – – 572 42 17 626 – – 553 57 16$55,000 to $59,999 558................. – – 515 36 7 572 – – 546 19 8$60,000 to $64,999 604................. – – 552 39 12 510 – – 480 21 9$65,000 to $69,999 459................. – – 420 27 12 438 – – 401 27 10$70,000 to $74,999 437................. – – 406 25 5 387 – – 360 28 –$75,000 to $79,999 341................. – – 323 8 10 342 – – 328 9 4$80,000 to $84,999 387................. – – 362 15 10 318 – – 301 9 7$85,000 to $89,999 221................. – – 206 9 6 202 – – 198 1 2$90,000 to $94,999 213................. – – 186 14 13 241 – – 213 22 6$95,000 to $99,999 240................. – – 224 12 4 226 – – 216 4 5$100,000 and over 1 493.................. – – 1 422 52 19 1 370 – – 1 303 48 18
12 to 17 Years Old
Total 12 253........................... 66 5 11 034 869 277 11 522 91 19 10 391 769 253Less than $5,000 324................... – 1 298 21 4 309 14 2 262 26 4$5,000 to $9,999 462................... 1 – 407 42 13 502 22 8 424 43 4$10,000 to $14,999 676................. 11 – 571 75 19 645 1 5 572 51 16$15,000 to $19,999 666................. 14 2 565 75 10 526 7 – 443 55 21$20,000 to $24,999 635................. 14 – 523 88 10 622 6 – 525 76 16$25,000 to $29,999 772................. – – 689 62 21 674 8 – 575 77 15$30,000 to $34,999 635................. 4 – 554 51 25 623 1 – 552 57 13$35,000 to $39,999 667................. 2 – 578 67 20 699 7 – 611 59 21$40,000 to $44,999 643................. – – 558 74 11 635 6 1 559 58 13$45,000 to $49,999 641................. 3 1 555 63 19 615 2 1 570 27 15
$50,000 to $54,999 674................. – – 619 40 16 611 7 1 563 26 15$55,000 to $59,999 625................. 6 – 575 33 11 554 – – 511 23 20$60,000 to $64,999 606................. – – 570 25 12 541 3 1 515 19 3$65,000 to $69,999 438................. 4 – 385 42 7 424 3 – 393 25 3$70,000 to $74,999 464................. 2 – 441 12 8 433 – – 413 15 4$75,000 to $79,999 412................. – – 391 6 15 426 – – 398 14 13$80,000 to $84,999 420................. – – 394 14 12 353 – – 335 10 8$85,000 to $89,999 255................. 4 – 232 10 10 274 – – 248 14 12$90,000 to $94,999 307................. – – 288 7 12 246 – – 232 14 –$95,000 to $99,999 220................. – – 214 6 – 213 – – 197 10 6$100,000 and over 1 710.................. – 1 1 630 55 24 1 597 3 – 1 493 70 30
18 to 21 Years Old
Total 7 681........................... 898 67 5 478 562 676 7 656 1 086 501 4 837 542 690Less than $5,000 213................... 86 7 61 16 42 273 165 7 53 21 27$5,000 to $9,999 252................... 69 10 120 23 30 350 175 23 97 26 30$10,000 to $14,999 362................. 104 10 164 44 41 482 155 50 182 41 54$15,000 to $19,999 418................. 96 2 237 36 47 450 112 53 181 40 64$20,000 to $24,999 403................. 123 5 169 47 59 468 112 58 180 47 71$25,000 to $29,999 497................. 83 7 301 45 61 509 81 86 211 45 86$30,000 to $34,999 393................. 96 3 207 54 33 500 63 61 282 34 59$35,000 to $39,999 426................. 46 9 250 61 60 381 48 35 214 34 50$40,000 to $44,999 415................. 46 6 280 20 63 372 34 26 260 23 29$45,000 to $49,999 400................. 42 – 242 46 70 340 33 24 234 26 24
$50,000 to $54,999 429................. 18 5 345 25 37 337 24 19 247 24 23$55,000 to $59,999 315................. 21 – 266 19 10 353 27 5 247 27 47$60,000 to $64,999 296................. 6 – 253 13 24 297 14 10 241 15 18$65,000 to $69,999 216................. 4 1 190 9 11 261 13 8 202 31 7$70,000 to $74,999 278................. 1 – 249 16 12 251 1 18 202 12 17$75,000 to $79,999 255................. 7 – 219 13 15 226 2 – 195 11 17$80,000 to $84,999 230................. 5 – 208 14 2 201 3 6 176 8 7$85,000 to $89,999 199................. 6 – 181 6 6 162 5 – 145 3 9$90,000 to $94,999 201................. – – 193 2 5 146 3 – 129 9 5$95,000 to $99,999 212................. 3 – 197 7 4 176 1 3 170 – 2$100,000 and over 1 271.................. 36 3 1 144 47 41 1 121 16 9 987 65 44
See footnotes at end of table.
8 INCOMEU.S. Census Bureau

Table 3. People in Households by Total Household Income in 1998, Relationship toHouseholder, Age, Sex, Race, and Hispanic Origin mCon.
[Numbers in thousands. People in households as of March of the following year. For meaning of symbols, see text]
Total money income
Male Female
TotalHouse~holder
Spouseof house~
holder
Child ofhouse~holder
Otherrelative
of house~holder
Non~relative Total
House~holder
Spouseof house~
holder
Child ofhouse~holder
Otherrelative
of house~holder
Non~relative
ALL RACESmCon.
22 to 24 Years Old
Total 5 221........................... 1 744 311 1 962 458 745 5 337 1 884 946 1 552 307 648Less than $5,000 122................... 74 1 8 15 24 206 154 6 19 10 17$5,000 to $9,999 183................... 107 15 25 11 26 298 208 33 25 10 22$10,000 to $14,999 285................. 164 24 51 10 36 356 234 43 16 20 43$15,000 to $19,999 334................. 165 37 71 27 33 423 271 63 37 12 41$20,000 to $24,999 371................. 199 31 68 32 41 404 208 99 41 15 41$25,000 to $29,999 370................. 177 24 49 57 62 369 158 80 54 27 50$30,000 to $34,999 349................. 153 39 72 34 51 395 119 90 75 27 85$35,000 to $39,999 329................. 170 29 44 26 60 330 125 99 67 10 29$40,000 to $44,999 324................. 117 25 86 27 69 306 90 79 79 15 43$45,000 to $49,999 329................. 82 31 120 26 70 277 80 64 71 13 49
$50,000 to $54,999 243................. 69 15 110 24 25 263 42 82 97 21 20$55,000 to $59,999 238................. 55 13 109 28 33 240 55 54 72 8 50$60,000 to $64,999 195................. 41 12 110 16 16 211 48 42 86 8 27$65,000 to $69,999 192................. 32 2 93 29 36 134 9 22 74 16 13$70,000 to $74,999 148................. 29 1 80 9 31 143 17 28 70 15 12$75,000 to $79,999 96................. 24 3 36 9 24 106 9 20 59 3 15$80,000 to $84,999 126................. 10 – 85 19 12 107 16 15 57 6 13$85,000 to $89,999 99................. 13 – 71 5 10 97 12 8 64 6 7$90,000 to $94,999 115................. 5 – 98 8 6 101 4 3 70 13 10$95,000 to $99,999 122................. 9 5 82 14 12 80 8 3 53 5 12$100,000 and over 651.................. 51 2 495 35 68 492 17 15 366 45 48
25 to 29 Years Old
Total 9 147........................... 4 576 1 093 1 741 520 1 217 9 466 3 943 3 231 1 092 340 861Less than $5,000 153................... 101 12 12 11 17 309 269 25 7 7 2$5,000 to $9,999 211................... 106 36 30 19 20 366 288 41 14 11 10$10,000 to $14,999 414................. 242 73 47 10 42 600 386 147 28 9 29$15,000 to $19,999 374................. 209 60 41 17 48 539 325 121 39 14 40$20,000 to $24,999 575................. 341 102 55 23 55 581 309 178 34 20 40$25,000 to $29,999 622................. 432 60 62 26 41 679 333 216 44 22 64$30,000 to $34,999 653................. 392 73 96 38 53 701 343 219 39 31 69$35,000 to $39,999 625................. 348 89 65 38 86 587 221 259 50 14 43$40,000 to $44,999 593................. 297 69 121 22 84 602 227 214 68 29 65$45,000 to $49,999 593................. 284 72 79 40 120 539 207 203 55 25 48
$50,000 to $54,999 649................. 378 69 101 40 61 675 204 313 76 14 68$55,000 to $59,999 479................. 234 72 83 32 57 402 119 173 65 16 29$60,000 to $64,999 486................. 253 81 70 14 69 434 121 198 55 8 52$65,000 to $69,999 345................. 150 33 96 14 51 391 106 171 47 9 58$70,000 to $74,999 357................. 152 37 81 25 63 342 96 127 62 8 49$75,000 to $79,999 273................. 123 23 64 14 50 272 72 124 45 7 24$80,000 to $84,999 306................. 94 42 83 21 67 221 66 86 27 14 29$85,000 to $89,999 191................. 83 9 68 16 15 144 23 72 33 10 6$90,000 to $94,999 164................. 56 17 58 15 18 159 50 66 28 6 10$95,000 to $99,999 105................. 42 10 38 6 10 116 22 44 23 12 15$100,000 and over 977.................. 260 55 391 81 191 806 156 232 252 53 112
30 to 34 Years Old
Total 9 763........................... 6 072 1 662 896 329 803 10 059 4 228 4 443 599 229 560Less than $5,000 152................... 113 22 5 2 10 237 190 30 12 1 4$5,000 to $9,999 218................... 134 42 21 11 10 405 304 60 16 7 18$10,000 to $14,999 393................. 254 49 44 12 34 467 311 105 22 7 21$15,000 to $19,999 391................. 268 44 31 21 27 598 376 165 28 7 23$20,000 to $24,999 544................. 360 86 45 15 37 589 333 187 43 3 23$25,000 to $29,999 546................. 349 97 45 12 44 649 316 239 47 17 31$30,000 to $34,999 761................. 476 125 74 22 63 667 291 290 17 26 43$35,000 to $39,999 642................. 416 95 63 33 36 621 254 278 39 18 32$40,000 to $44,999 634................. 398 132 18 22 65 651 259 303 31 14 44$45,000 to $49,999 624................. 399 114 40 22 48 614 194 323 42 15 40
$50,000 to $54,999 627................. 399 117 49 12 50 547 190 300 20 4 34$55,000 to $59,999 483................. 318 80 43 7 36 516 168 260 37 24 26$60,000 to $64,999 521................. 325 108 29 14 44 489 165 253 30 16 25$65,000 to $69,999 474................. 293 66 50 16 51 435 114 264 21 8 28$70,000 to $74,999 466................. 295 67 41 16 47 367 112 189 28 16 22$75,000 to $79,999 328................. 202 52 32 6 36 242 69 146 15 2 10$80,000 to $84,999 338................. 183 63 48 29 14 303 112 141 14 12 24$85,000 to $89,999 222................. 116 55 23 3 26 252 96 114 21 2 19$90,000 to $94,999 200................. 117 29 24 9 22 185 44 106 14 7 14$95,000 to $99,999 174................. 110 23 10 8 22 135 33 81 13 1 7$100,000 and over 1 025.................. 547 197 162 38 81 1 090 297 609 90 22 72
See footnotes at end of table.
INCOME 9U.S. Census Bureau

Table 3. People in Households by Total Household Income in 1998, Relationship toHouseholder, Age, Sex, Race, and Hispanic Origin mCon.
[Numbers in thousands. People in households as of March of the following year. For meaning of symbols, see text]
Total money income
Male Female
TotalHouse~holder
Spouseof house~
holder
Child ofhouse~holder
Otherrelative
of house~holder
Non~relative Total
House~holder
Spouseof house~
holder
Child ofhouse~holder
Otherrelative
of house~holder
Non~relative
ALL RACESmCon.
35 to 44 Years Old
Total 22 141........................... 14 411 3 781 1 771 834 1 345 22 576 9 558 10 889 806 475 849Less than $5,000 279................... 217 34 8 13 7 528 389 105 10 14 10$5,000 to $9,999 468................... 306 46 74 10 32 751 582 109 31 13 17$10,000 to $14,999 806................. 474 65 127 64 75 928 658 182 33 31 25$15,000 to $19,999 885................. 591 104 107 33 51 941 557 276 44 17 47$20,000 to $24,999 975................. 619 142 102 53 59 1 077 660 293 48 40 37$25,000 to $29,999 1 243................. 815 133 150 52 93 1 186 635 432 42 25 52$30,000 to $34,999 1 264................. 835 185 106 55 82 1 321 664 510 55 25 67$35,000 to $39,999 1 367................. 889 188 144 62 84 1 274 622 496 70 35 51$40,000 to $44,999 1 420................. 882 260 153 51 74 1 280 535 616 56 41 32$45,000 to $49,999 1 384................. 935 234 109 37 68 1 313 522 681 52 19 40
$50,000 to $54,999 1 382................. 892 214 116 87 73 1 197 421 634 54 35 55$55,000 to $59,999 1 149................. 755 237 57 43 58 1 174 438 645 32 32 26$60,000 to $64,999 1 212................. 822 207 67 34 82 1 131 391 650 40 6 45$65,000 to $69,999 950................. 625 190 53 23 59 920 309 512 43 27 29$70,000 to $74,999 931................. 612 167 64 25 62 959 264 611 19 16 48$75,000 to $79,999 780................. 517 140 46 25 52 821 243 508 23 7 40$80,000 to $84,999 782................. 510 165 44 13 49 827 266 506 16 10 28$85,000 to $89,999 561................. 359 112 19 24 47 571 164 350 9 11 38$90,000 to $94,999 509................. 336 113 28 14 18 548 160 336 20 10 22$95,000 to $99,999 482................. 310 118 5 20 30 497 137 332 14 7 7$100,000 and over 3 312.................. 2 109 726 193 97 187 3 329 940 2 108 95 53 133
45 to 54 Years Old
Total 17 137........................... 12 643 2 866 516 453 659 18 081 7 515 9 093 388 606 478Less than $5,000 286................... 232 27 7 16 3 363 243 84 – 23 13$5,000 to $9,999 409................... 348 15 26 3 17 617 465 101 23 16 12$10,000 to $14,999 406................. 283 51 31 21 20 690 506 125 23 21 14$15,000 to $19,999 599................. 412 77 39 21 49 727 463 189 16 36 24$20,000 to $24,999 706................. 502 76 59 27 42 826 454 249 55 30 38$25,000 to $29,999 782................. 561 104 59 30 28 921 494 308 37 50 32$30,000 to $34,999 758................. 546 108 38 24 42 920 518 328 24 23 26$35,000 to $39,999 765................. 595 112 17 24 16 917 460 365 32 40 20$40,000 to $44,999 839................. 613 141 32 26 26 939 430 416 36 26 31$45,000 to $49,999 945................. 663 175 30 33 44 868 361 441 21 27 17
$50,000 to $54,999 932................. 726 141 21 18 26 1 002 372 527 23 53 26$55,000 to $59,999 846................. 641 160 12 13 20 862 312 484 11 29 27$60,000 to $64,999 855................. 611 158 22 35 29 868 309 496 6 32 25$65,000 to $69,999 761................. 554 153 19 17 18 708 246 412 12 17 22$70,000 to $74,999 810................. 605 147 7 17 34 723 245 449 1 18 10$75,000 to $79,999 639................. 477 116 11 17 18 556 164 346 9 21 16$80,000 to $84,999 647................. 475 135 9 13 17 591 183 364 14 10 20$85,000 to $89,999 541................. 367 107 29 15 24 496 142 311 4 20 18$90,000 to $94,999 499................. 353 91 10 6 38 476 115 346 6 3 6$95,000 to $99,999 455................. 348 77 2 14 14 409 99 278 8 11 13$100,000 and over 3 658.................. 2 730 695 35 63 135 3 602 933 2 474 27 99 68
55 to 64 Years Old
Total 10 966........................... 8 264 1 898 145 399 260 11 937 5 307 5 804 105 541 180Less than $5,000 284................... 240 33 8 4 – 362 255 98 – 8 1$5,000 to $9,999 421................... 361 22 6 24 7 821 651 139 8 18 4$10,000 to $14,999 416................. 330 44 15 12 16 835 533 264 9 22 7$15,000 to $19,999 467................. 345 68 26 11 17 745 390 307 20 24 4$20,000 to $24,999 632................. 447 97 16 45 27 749 409 290 8 27 15$25,000 to $29,999 612................. 487 86 14 14 11 790 367 363 13 37 10$30,000 to $34,999 613................. 478 84 10 21 19 756 349 363 7 25 12$35,000 to $39,999 540................. 373 110 17 29 11 700 291 345 8 41 16$40,000 to $44,999 573................. 443 101 – 14 15 715 302 351 8 43 10$45,000 to $49,999 610................. 471 92 6 23 18 628 205 364 8 40 10
$50,000 to $54,999 577................. 444 102 2 23 7 567 208 328 2 19 10$55,000 to $59,999 493................. 361 103 2 20 7 443 142 265 4 23 9$60,000 to $64,999 483................. 343 87 – 29 24 407 151 225 – 29 2$65,000 to $69,999 438................. 345 64 2 24 3 392 120 236 2 23 10$70,000 to $74,999 358................. 250 88 – 15 5 355 130 196 2 24 3$75,000 to $79,999 343................. 256 65 4 9 10 326 118 182 – 21 6$80,000 to $84,999 318................. 223 75 – 16 5 274 90 159 2 20 4$85,000 to $89,999 292................. 217 58 1 7 9 238 81 146 – 6 6$90,000 to $94,999 302................. 243 54 – 3 3 252 73 158 – 8 13$95,000 to $99,999 227................. 178 39 – 10 – 185 37 126 – 18 3$100,000 and over 1 964.................. 1 429 426 15 46 48 1 394 406 899 2 65 23
See footnotes at end of table.
10 INCOMEU.S. Census Bureau

Table 3. People in Households by Total Household Income in 1998, Relationship toHouseholder, Age, Sex, Race, and Hispanic Origin mCon.
[Numbers in thousands. People in households as of March of the following year. For meaning of symbols, see text]
Total money income
Male Female
TotalHouse~holder
Spouseof house~
holder
Child ofhouse~holder
Otherrelative
of house~holder
Non~relative Total
House~holder
Spouseof house~
holder
Child ofhouse~holder
Otherrelative
of house~holder
Non~relative
ALL RACESmCon.
65 to 74 Years Old
Total 8 027........................... 6 304 1 272 33 246 172 9 816 5 069 4 069 15 572 92Less than $5,000 159................... 141 16 – – 2 238 165 65 – 7 2$5,000 to $9,999 438................... 403 25 – 3 7 1 091 1 003 77 – 10 1$10,000 to $14,999 623................. 487 97 13 8 18 1 191 866 267 1 48 10$15,000 to $19,999 795................. 606 129 9 16 35 1 086 658 399 – 26 3$20,000 to $24,999 813................. 632 142 – 18 21 1 045 504 508 2 25 5$25,000 to $29,999 737................. 558 125 12 21 22 899 396 452 5 38 8$30,000 to $34,999 613................. 481 114 – 16 2 694 308 342 2 32 11$35,000 to $39,999 588................. 484 83 – 19 2 603 225 326 – 44 9$40,000 to $44,999 421................. 330 76 – 7 9 437 174 222 – 32 9$45,000 to $49,999 394................. 298 73 – 12 11 395 134 216 – 33 11
$50,000 to $54,999 325................. 256 47 – 17 5 292 106 161 – 25 1$55,000 to $59,999 246................. 190 45 – 8 3 232 80 120 – 31 1$60,000 to $64,999 220................. 163 37 – 20 – 179 44 113 – 19 3$65,000 to $69,999 225................. 176 37 – 8 4 219 59 139 – 21 –$70,000 to $74,999 179................. 143 30 – 6 – 150 40 77 – 33 –$75,000 to $79,999 129................. 87 36 – 7 – 101 43 47 – 9 2$80,000 to $84,999 114................. 83 17 – 8 6 100 32 52 – 13 4$85,000 to $89,999 141................. 121 16 – 1 2 123 30 84 – 7 2$90,000 to $94,999 94................. 75 13 – 2 4 62 24 32 – 5 2$95,000 to $99,999 102................. 78 13 – 12 – 76 15 40 – 19 2$100,000 and over 670.................. 514 100 – 37 18 603 164 331 4 97 7
75 Years Old and Over
Total 5 695........................... 4 380 800 3 403 108 8 851 5 835 2 020 2 889 105Less than $5,000 97................... 68 24 – – 5 303 259 26 – 12 6$5,000 to $9,999 383................... 339 24 – 7 12 1 570 1 459 87 – 24 –$10,000 to $14,999 672................. 581 72 – 15 4 1 732 1 514 168 – 41 10$15,000 to $19,999 817................. 671 95 3 29 19 1 164 781 325 – 39 18$20,000 to $24,999 724................. 570 120 – 23 11 846 470 309 2 52 12$25,000 to $29,999 606................. 484 81 – 32 10 654 324 259 – 68 3$30,000 to $34,999 407................. 308 78 – 15 5 438 213 166 – 60 –$35,000 to $39,999 345................. 253 54 – 30 8 396 193 145 – 58 –$40,000 to $44,999 250................. 191 27 – 22 10 259 117 87 – 50 4$45,000 to $49,999 183................. 133 26 – 24 1 183 98 49 – 34 2
$50,000 to $54,999 156................. 106 19 – 31 – 139 63 32 – 38 5$55,000 to $59,999 142................. 98 27 – 6 11 193 66 73 – 51 2$60,000 to $64,999 103................. 66 11 – 24 2 114 39 43 – 32 –$65,000 to $69,999 110................. 78 21 – 8 3 100 41 32 – 27 1$70,000 to $74,999 74................. 42 15 – 17 – 82 29 16 – 37 –$75,000 to $79,999 52................. 29 11 – 12 – 64 25 13 – 23 4$80,000 to $84,999 41................. 30 7 – 3 1 55 18 13 – 20 4$85,000 to $89,999 53................. 39 10 – 1 2 66 19 16 – 31 –$90,000 to $94,999 64................. 35 11 – 18 – 55 21 22 – 11 –$95,000 to $99,999 26................. 17 4 – 6 – 38 9 7 – 20 2$100,000 and over 392.................. 241 63 – 82 5 401 77 132 – 161 32
WHITE
Total 110 184........................... 51 675 11 862 36 416 4 563 5 668 113 960 35 537 36 594 32 743 4 730 4 355Less than $5,000 1 944................... 951 156 664 81 92 2 527 1 312 372 667 95 81$5,000 to $9,999 3 112................... 1 612 194 1 047 114 145 5 620 3 741 571 1 053 159 96$10,000 to $14,999 4 929................. 2 412 418 1 623 203 273 7 200 4 057 1 166 1 544 247 185$15,000 to $19,999 5 691................. 2 916 514 1 722 249 290 6 710 3 057 1 677 1 427 253 295$20,000 to $24,999 6 292................. 3 258 679 1 731 326 298 6 808 2 705 1 924 1 637 265 279$25,000 to $29,999 6 686................. 3 370 587 2 054 329 346 7 151 2 519 2 153 1 807 362 309$30,000 to $34,999 6 560................. 3 274 698 1 964 279 344 6 965 2 316 2 113 1 932 256 348$35,000 to $39,999 6 391................. 3 106 670 1 970 293 352 6 556 2 016 2 099 1 888 303 249$40,000 to $44,999 6 252................. 2 896 719 1 995 245 397 6 245 1 746 2 046 1 915 280 257$45,000 to $49,999 6 264................. 2 936 694 1 925 291 419 5 991 1 531 2 127 1 837 246 250
$50,000 to $54,999 6 183................. 2 872 618 2 148 279 266 5 786 1 370 2 107 1 814 259 235$55,000 to $59,999 5 331................. 2 402 648 1 871 184 226 5 199 1 213 1 881 1 637 242 225$60,000 to $64,999 5 245................. 2 354 577 1 807 215 292 4 866 1 054 1 836 1 628 163 185$65,000 to $69,999 4 415................. 2 018 514 1 454 185 245 4 137 884 1 610 1 261 205 178$70,000 to $74,999 4 262................. 1 922 451 1 480 168 240 3 902 773 1 548 1 244 197 140$75,000 to $79,999 3 365................. 1 512 416 1 142 99 195 3 329 681 1 208 1 173 137 130$80,000 to $84,999 3 445................. 1 439 426 1 298 129 152 3 076 654 1 201 1 003 91 127$85,000 to $89,999 2 643................. 1 189 317 901 94 142 2 432 489 988 765 90 100$90,000 to $94,999 2 467................. 1 071 284 913 92 108 2 258 413 939 755 85 66$95,000 to $99,999 2 230................. 962 264 800 116 89 2 007 320 805 725 92 65$100,000 and over 16 478.................. 7 202 2 019 5 908 591 759 15 197 2 687 6 221 5 031 704 554
See footnotes at end of table.
INCOME 11U.S. Census Bureau
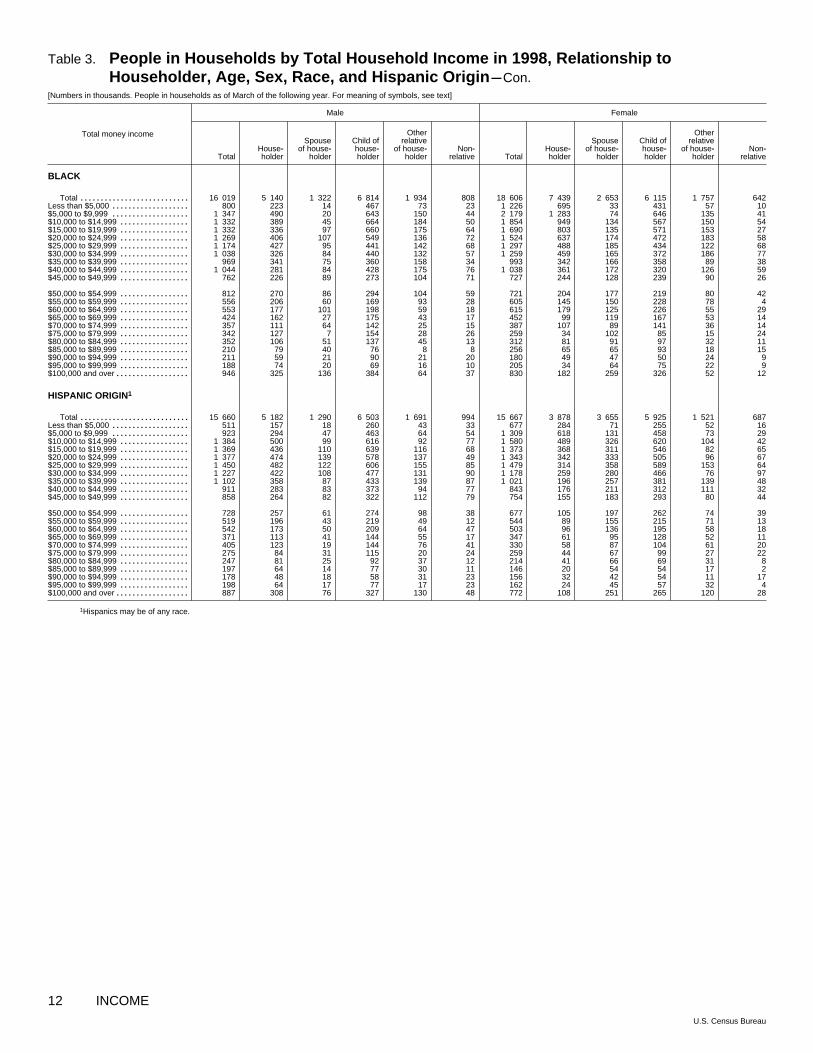
Table 3. People in Households by Total Household Income in 1998, Relationship toHouseholder, Age, Sex, Race, and Hispanic Origin mCon.
[Numbers in thousands. People in households as of March of the following year. For meaning of symbols, see text]
Total money income
Male Female
TotalHouse~holder
Spouseof house~
holder
Child ofhouse~holder
Otherrelative
of house~holder
Non~relative Total
House~holder
Spouseof house~
holder
Child ofhouse~holder
Otherrelative
of house~holder
Non~relative
BLACK
Total 16 019........................... 5 140 1 322 6 814 1 934 808 18 606 7 439 2 653 6 115 1 757 642Less than $5,000 800................... 223 14 467 73 23 1 226 695 33 431 57 10$5,000 to $9,999 1 347................... 490 20 643 150 44 2 179 1 283 74 646 135 41$10,000 to $14,999 1 332................. 389 45 664 184 50 1 854 949 134 567 150 54$15,000 to $19,999 1 332................. 336 97 660 175 64 1 690 803 135 571 153 27$20,000 to $24,999 1 269................. 406 107 549 136 72 1 524 637 174 472 183 58$25,000 to $29,999 1 174................. 427 95 441 142 68 1 297 488 185 434 122 68$30,000 to $34,999 1 038................. 326 84 440 132 57 1 259 459 165 372 186 77$35,000 to $39,999 969................. 341 75 360 158 34 993 342 166 358 89 38$40,000 to $44,999 1 044................. 281 84 428 175 76 1 038 361 172 320 126 59$45,000 to $49,999 762................. 226 89 273 104 71 727 244 128 239 90 26
$50,000 to $54,999 812................. 270 86 294 104 59 721 204 177 219 80 42$55,000 to $59,999 556................. 206 60 169 93 28 605 145 150 228 78 4$60,000 to $64,999 553................. 177 101 198 59 18 615 179 125 226 55 29$65,000 to $69,999 424................. 162 27 175 43 17 452 99 119 167 53 14$70,000 to $74,999 357................. 111 64 142 25 15 387 107 89 141 36 14$75,000 to $79,999 342................. 127 7 154 28 26 259 34 102 85 15 24$80,000 to $84,999 352................. 106 51 137 45 13 312 81 91 97 32 11$85,000 to $89,999 210................. 79 40 76 8 8 256 65 65 93 18 15$90,000 to $94,999 211................. 59 21 90 21 20 180 49 47 50 24 9$95,000 to $99,999 188................. 74 20 69 16 10 205 34 64 75 22 9$100,000 and over 946.................. 325 136 384 64 37 830 182 259 326 52 12
HISPANIC ORIGIN1
Total 15 660........................... 5 182 1 290 6 503 1 691 994 15 667 3 878 3 655 5 925 1 521 687Less than $5,000 511................... 157 18 260 43 33 677 284 71 255 52 16$5,000 to $9,999 923................... 294 47 463 64 54 1 309 618 131 458 73 29$10,000 to $14,999 1 384................. 500 99 616 92 77 1 580 489 326 620 104 42$15,000 to $19,999 1 369................. 436 110 639 116 68 1 373 368 311 546 82 65$20,000 to $24,999 1 377................. 474 139 578 137 49 1 343 342 333 505 96 67$25,000 to $29,999 1 450................. 482 122 606 155 85 1 479 314 358 589 153 64$30,000 to $34,999 1 227................. 422 108 477 131 90 1 178 259 280 466 76 97$35,000 to $39,999 1 102................. 358 87 433 139 87 1 021 196 257 381 139 48$40,000 to $44,999 911................. 283 83 373 94 77 843 176 211 312 111 32$45,000 to $49,999 858................. 264 82 322 112 79 754 155 183 293 80 44
$50,000 to $54,999 728................. 257 61 274 98 38 677 105 197 262 74 39$55,000 to $59,999 519................. 196 43 219 49 12 544 89 155 215 71 13$60,000 to $64,999 542................. 173 50 209 64 47 503 96 136 195 58 18$65,000 to $69,999 371................. 113 41 144 55 17 347 61 95 128 52 11$70,000 to $74,999 405................. 123 19 144 76 41 330 58 87 104 61 20$75,000 to $79,999 275................. 84 31 115 20 24 259 44 67 99 27 22$80,000 to $84,999 247................. 81 25 92 37 12 214 41 66 69 31 8$85,000 to $89,999 197................. 64 14 77 30 11 146 20 54 54 17 2$90,000 to $94,999 178................. 48 18 58 31 23 156 32 42 54 11 17$95,000 to $99,999 198................. 64 17 77 17 23 162 24 45 57 32 4$100,000 and over 887.................. 308 76 327 130 48 772 108 251 265 120 28
1Hispanics may be of any race.
12 INCOMEU.S. Census Bureau

Table 4. Median Income of Families by Selected Characteristics, Race, and Hispanic Origin ofHouseholder: 1998, 1997, and 1996
[Families as of March of the following year. An asterisk (*) preceding percent change indicates statistically significant change at the 90~percent confidence level. For meaning of symbols, see text]
Characteristic
199619971998
Median income Median income Median income
Number(1,000)
Value(dollars)
Standarderror
(dollars)Number(1,000)
Value(dollars)
Standarderror
(dollars)Number(1,000)
Value(dollars)
Standarderror
(dollars)
Percentchangein real
median income
(1997~1998)
ALL RACES
All families 71 551....................... 46 737 241 70 884 44 568 267 70 241 42 300 209 * 3.3
Type of Residence
Inside metropolitan areas 56 993................ 49 407 308 56 350 47 315 280 55 930 45 117 277 * 2.81 million or more 37 793..................... 51 935 338 37 417 50 311 330 36 858 47 442 384 * 1.6
Inside central cities 12 425................. 39 965 774 12 386 38 049 673 12 248 35 792 531 3.4Outside central cities 25 368............... 58 104 524 25 030 55 809 443 24 610 52 577 417 * 2.5
Under 1 million 19 200...................... 44 768 513 18 934 42 917 459 19 071 41 395 371 * 2.7Inside central cities 7 188................. 41 099 641 7 206 39 276 758 7 287 37 633 736 3.0Outside central cities 12 012............... 46 929 547 11 728 44 993 518 11 784 43 260 485 * 2.7
Outside metropolitan areas 14 558.............. 38 326 582 14 534 36 149 447 14 311 33 874 554 * 4.4
Region
Northeast 13 384.............................. 50 567 536 13 338 48 328 791 13 404 46 553 459 * 3.0Midwest 16 875............................... 49 552 543 16 594 46 734 501 16 457 44 957 485 * 4.4South 25 894................................. 42 711 474 25 682 41 001 372 25 438 38 710 408 * 2.6West 15 398.................................. 46 819 496 15 270 45 590 537 14 943 42 569 519 1.1
Type of Family
Married~couple families 54 778.................. 54 180 321 54 321 51 591 231 53 604 49 707 305 * 3.4Wife in paid labor force 33 680............... 63 751 379 33 535 60 669 291 33 242 58 381 322 * 3.5Wife not in paid labor force 21 098............ 37 161 369 20 786 36 027 305 20 362 33 748 393 1.6
Male householder, no wife present 3 977........ 35 681 850 3 911 32 960 839 3 847 31 600 549 * 6.6Female householder, no husband present 12 796.. 22 163 325 12 652 21 023 308 12 790 19 911 306 * 3.8
Age of Householder
Under 65 years 60 053......................... 50 259 239 59 614 47 825 315 59 107 45 517 248 * 3.515 to 24 years 3 242....................... 21 918 576 3 018 20 820 521 2 964 19 937 704 3.725 to 34 years 13 226....................... 41 074 466 13 639 39 979 483 13 737 37 177 482 1.235 to 44 years 18 823....................... 51 883 463 18 872 50 424 369 19 026 47 725 506 1.345 to 54 years 15 127....................... 61 833 586 14 695 59 959 570 14 384 57 161 607 1.555 to 64 years 9 635....................... 52 577 665 9 391 50 241 614 8 997 48 198 854 * 3.0
65 years and over 11 498...................... 31 568 394 11 270 30 660 386 11 133 28 983 356 1.465 to 74 years 7 051....................... 34 719 594 6 989 33 372 495 7 120 31 366 496 2.475 years and over 4 447................... 27 717 454 4 282 26 611 463 4 013 25 510 463 2.6
Size of Family
Two people 31 102............................ 39 721 364 30 287 37 562 344 29 780 36 072 307 * 4.1Three people 16 227........................... 48 933 547 16 231 46 783 463 16 239 44 108 450 * 3.0Four people 14 390............................ 56 061 607 14 633 53 350 612 14 602 51 518 392 * 3.5Five people 6 573............................ 54 357 893 6 555 51 101 640 6 326 48 058 925 * 4.7Six people 2 135............................. 48 816 1 643 2 047 45 473 1 406 2 108 41 774 1 290 5.7Seven people or more 1 124................... 45 254 1 773 1 130 42 001 1 838 1 186 40 339 1 665 6.1
Number of Earners
No earners 9 692............................. 20 689 297 9 835 19 731 274 9 947 18 088 274 * 3.2One earner 21 221............................ 31 483 273 20 494 30 204 287 20 052 28 383 321 * 2.6Two earners or more 40 638.................... 61 675 282 40 555 58 972 375 40 242 56 442 278 * 3.0
Two earners 31 787........................ 58 397 366 31 752 55 443 309 31 309 53 361 332 * 3.7Three earners 6 642....................... 70 339 838 6 638 68 028 781 6 697 63 281 745 1.8Four earners or more 2 209................. 88 031 1 851 2 165 85 978 1 503 2 236 79 371 1 370 0.8
See footnotes at end of table.
INCOME 13U.S. Census Bureau

Table 4. Median Income of Families by Selected Characteristics, Race, and Hispanic Origin ofHouseholder: 1998, 1997, and 1996 mCon.
[Families as of March of the following year. An asterisk (*) preceding percent change indicates statistically significant change at the 90~percent confidence level. For meaning of symbols, see text]
Characteristic
199619971998
Median income Median income Median income
Number(1,000)
Value(dollars)
Standarderror
(dollars)Number(1,000)
Value(dollars)
Standarderror
(dollars)Number(1,000)
Value(dollars)
Standarderror
(dollars)
Percentchangein real
median income
(1997~1998)
WHITE
All families 60 077....................... 49 023 283 59 515 46 754 259 58 934 44 756 266 * 3.2
Type of Residence
Inside metropolitan areas 46 962................ 52 103 302 46 429 50 410 274 46 079 47 769 345 * 1.81 million or more 30 374..................... 55 930 418 30 060 53 572 462 29 624 50 977 343 * 2.8
Inside central cities 8 120................. 46 290 815 8 147 43 444 990 8 024 40 743 643 * 4.9Outside central cities 22 253............... 59 387 531 21 913 57 063 496 21 600 54 027 480 * 2.5
Under 1 million 16 588...................... 46 640 488 16 369 44 819 491 16 455 43 316 442 * 2.5Inside central cities 5 683................. 44 059 857 5 717 42 206 872 5 699 41 713 708 2.8Outside central cities 10 906............... 47 866 563 10 651 45 728 508 10 756 44 085 512 * 3.1
Outside metropolitan areas 13 115.............. 39 610 591 13 086 37 305 483 12 856 35 681 456 * 4.6
Region
Northeast 11 374.............................. 53 591 762 11 390 51 354 584 11 403 49 235 596 * 2.8Midwest 15 022............................... 51 159 393 14 771 48 614 549 14 628 46 579 477 * 3.6South 20 540................................. 46 239 477 20 358 43 915 494 20 184 41 955 362 * 3.7West 13 140.................................. 46 686 519 12 996 46 006 607 12 719 42 906 612 –0.1
Type of Family
Married~couple families 48 461.................. 54 736 335 48 070 52 098 247 47 650 50 190 257 * 3.5Wife in paid labor force 29 378............... 64 480 402 29 344 61 441 309 29 308 58 995 333 * 3.3Wife not in paid labor force 19 083............ 37 755 416 18 726 36 343 319 18 342 34 214 406 * 2.3
Male householder, no wife present 3 087........ 37 798 1 099 3 137 34 802 950 2 944 32 439 962 * 6.9Female householder, no husband present 8 529.. 25 175 414 8 308 22 999 465 8 339 22 373 408 * 7.8
Age of Householder
Under 65 years 49 846......................... 52 550 297 49 443 50 701 237 48 963 48 352 324 * 2.115 to 24 years 2 504....................... 24 283 637 2 270 22 431 809 2 204 22 419 825 * 6.625 to 34 years 10 522....................... 43 970 674 10 965 41 890 410 11 128 39 967 477 * 3.435 to 44 years 15 619....................... 54 682 584 15 603 52 753 549 15 686 50 741 398 * 2.145 to 54 years 12 845....................... 64 119 634 12 455 61 852 467 12 227 60 001 691 * 2.155 to 64 years 8 356....................... 54 476 771 8 149 51 598 550 7 718 50 419 672 * 4.0
65 years and over 10 231...................... 32 398 429 10 072 31 167 408 9 971 29 470 360 2.465 to 74 years 6 249....................... 35 784 622 6 222 34 179 523 6 376 31 934 536 3.175 years and over 3 982................... 28 205 474 3 850 26 758 483 3 595 26 004 464 * 3.8
Size of Family
Two people 27 051............................ 41 358 337 26 380 39 492 385 25 903 37 593 379 * 3.1Three people 13 235........................... 51 331 432 13 312 50 149 523 13 316 47 239 536 0.8Four people 11 952............................ 58 834 702 12 078 56 022 583 12 100 53 816 647 * 3.4Five people 5 392............................ 56 560 822 5 366 53 696 1 166 5 123 51 434 858 * 3.7Six people 1 655............................. 52 421 1 732 1 598 48 079 1 679 1 663 43 377 1 774 * 7.4Seven people or more 792................... 51 196 2 509 782 45 816 2 539 828 45 416 2 149 10.0
Number of Earners
No earners 8 152............................. 22 672 310 8 367 21 516 293 8 198 20 311 323 * 3.8One earner 16 991............................ 34 466 438 16 239 32 811 424 16 025 30 831 317 * 3.4Two earners or more 34 934.................... 62 695 356 34 910 60 291 281 34 712 57 461 306 * 2.4
Two earners 27 410........................ 59 480 383 27 467 56 624 335 27 068 54 292 347 * 3.4Three earners 5 678....................... 71 374 951 5 618 69 239 850 5 713 65 008 821 1.5Four earners or more 1 846................. 91 307 1 627 1 824 87 747 1 532 1 931 80 110 1 485 2.5
See footnotes at end of table.
14 INCOMEU.S. Census Bureau

Table 4. Median Income of Families by Selected Characteristics, Race, and Hispanic Origin ofHouseholder: 1998, 1997, and 1996 mCon.
[Families as of March of the following year. An asterisk (*) preceding percent change indicates statistically significant change at the 90~percent confidence level. For meaning of symbols, see text]
Characteristic
199619971998
Median income Median income Median income
Number(1,000)
Value(dollars)
Standarderror
(dollars)Number(1,000)
Value(dollars)
Standarderror
(dollars)Number(1,000)
Value(dollars)
Standarderror
(dollars)
Percentchangein real
median income
(1997~1998)
BLACK
All families 8 452....................... 29 404 713 8 408 28 602 629 8 455 26 522 470 1.2
Type of Residence
Inside metropolitan areas 7 314................ 30 159 687 7 242 29 737 667 7 279 28 468 846 –0.11 million or more 5 335..................... 31 125 745 5 298 30 485 641 5 296 29 520 918 0.5
Inside central cities 3 414................. 26 265 926 3 350 26 210 994 3 343 24 882 883 –1.3Outside central cities 1 921............... 41 571 1 774 1 949 38 703 1 639 1 953 37 572 1 225 5.8
Under 1 million 1 979...................... 27 436 1 068 1 944 27 150 1 091 1 984 26 275 1 128 –0.5Inside central cities 1 210................. 26 229 1 248 1 208 25 503 2 185 1 266 23 450 1 272 1.3Outside central cities 769............... 29 677 2 007 736 30 982 2 082 718 31 135 1 322 –5.7
Outside metropolitan areas 1 138.............. 25 981 1 361 1 166 24 619 1 448 1 176 18 990 1 152 3.9
Region
Northeast 1 553.............................. 27 167 1 347 1 501 29 217 1 562 1 558 25 458 1 175 –8.4Midwest 1 494............................... 27 409 1 610 1 468 28 129 1 355 1 505 27 448 1 416 –4.1South 4 723................................. 29 512 863 4 721 27 734 814 4 707 25 552 605 4.8West 682.................................. 37 036 3 051 717 33 604 1 898 686 36 571 2 411 8.5
Type of Family
Married~couple families 3 979.................. 47 383 1 165 3 921 45 372 755 3 851 41 963 965 2.8Wife in paid labor force 2 852............... 55 579 984 2 716 51 702 748 2 636 50 805 1 002 * 5.9Wife not in paid labor force 1 127............ 27 927 1 056 1 205 28 757 1 499 1 216 27 594 1 173 –4.4
Male householder, no wife present 660........ 27 087 1 178 562 25 654 1 212 657 26 338 2 006 4.0Female householder, no husband present 3 813.. 16 770 418 3 926 16 879 438 3 947 15 530 503 –2.2
Age of Householder
Under 65 years 7 489......................... 30 946 598 7 492 29 343 669 7 536 27 113 526 3.815 to 24 years 587....................... 11 212 847 630 13 556 1 468 635 11 239 773 * –18.625 to 34 years 2 040....................... 25 165 1 258 2 054 24 620 1 073 1 982 20 470 1 134 0.635 to 44 years 2 323....................... 32 839 1 609 2 352 28 148 897 2 437 30 735 1 022 * 14.945 to 54 years 1 642....................... 45 785 2 139 1 594 41 903 1 817 1 584 40 009 1 749 7.655 to 64 years 898....................... 34 749 1 792 862 36 415 2 133 897 33 703 2 088 –6.0
65 years and over 962...................... 22 102 1 081 916 23 420 1 490 919 21 328 1 297 –7.165 to 74 years 605....................... 22 419 1 539 607 23 767 2 039 604 23 885 1 734 –7.175 years and over 357................... 21 589 1 607 309 22 919 2 872 316 18 647 1 415 –7.2
Size of Family
Two people 3 175............................ 25 698 632 3 022 25 061 931 2 987 23 500 1 018 1.0Three people 2 212........................... 27 604 1 141 2 184 26 060 1 230 2 242 24 503 1 026 4.3Four people 1 693............................ 35 918 1 303 1 789 34 644 1 531 1 762 32 747 1 501 2.1Five people 833............................ 36 455 2 032 866 36 984 2 717 905 31 120 1 595 –2.9Six people 318............................. 31 754 3 264 317 31 197 1 128 313 30 871 2 031 0.2Seven people or more 221................... 30 475 3 544 230 32 544 3 490 247 27 231 3 399 –7.8
Number of Earners
No earners 1 271............................. 9 422 446 1 202 9 012 468 1 402 7 776 447 3.0One earner 3 348............................ 20 524 441 3 396 19 597 486 3 222 19 066 462 3.1Two earners or more 3 833.................... 51 737 748 3 809 48 750 945 3 832 45 280 890 * 4.5
Two earners 3 008........................ 48 018 1 319 2 973 45 780 715 3 007 42 637 999 3.3Three earners 613....................... 58 438 2 417 676 57 701 1 835 676 51 457 1 844 –0.3Four earners or more 211................. 74 299 4 764 160 75 641 5 576 149 70 325 9 334 –3.3
See footnotes at end of table.
INCOME 15U.S. Census Bureau

Table 4. Median Income of Families by Selected Characteristics, Race, and Hispanic Origin ofHouseholder: 1998, 1997, and 1996 mCon.
[Families as of March of the following year. An asterisk (*) preceding percent change indicates statistically significant change at the 90~percent confidence level. For meaning of symbols, see text]
Characteristic
199619971998
Median income Median income Median income
Number(1,000)
Value(dollars)
Standarderror
(dollars)Number(1,000)
Value(dollars)
Standarderror
(dollars)Number(1,000)
Value(dollars)
Standarderror
(dollars)
Percentchangein real
median income
(1997~1998)
HISPANIC ORIGIN1
All families 7 273....................... 29 608 568 6 961 28 142 655 6 631 26 179 495 * 3.6
Type of Residence
Inside metropolitan areas 6 677................ 30 129 561 6 307 28 708 694 6 036 26 528 533 3.31 million or more 4 933..................... 31 195 569 4 686 30 115 679 4 480 27 394 696 2.0
Inside central cities 2 481................. 26 750 660 2 394 24 567 853 2 309 22 951 742 * 7.2Outside central cities 2 452............... 36 410 888 2 292 36 718 1 051 2 171 33 092 1 158 –2.4
Under 1 million 1 744...................... 26 177 822 1 621 25 244 1 085 1 556 23 547 1 247 2.1Inside central cities 966................. 25 057 1 492 943 25 490 1 672 911 23 658 1 790 –3.2Outside central cities 778............... 27 431 1 713 679 25 008 1 401 645 23 440 1 590 8.0
Outside metropolitan areas 596.............. 25 120 1 714 654 24 130 2 144 595 22 423 2 229 2.5
Region
Northeast 1 149.............................. 28 951 1 378 1 128 25 784 1 376 1 088 23 240 1 354 * 10.6Midwest 525............................... 34 088 1 688 542 31 580 2 918 494 30 700 2 131 6.3South 2 538................................. 28 866 1 037 2 341 28 617 1 034 2 255 26 362 818 –0.7West 3 061.................................. 29 471 904 2 950 28 014 1 046 2 794 26 252 790 3.6
Type of Family
Married~couple families 4 945.................. 34 816 745 4 804 33 914 902 4 520 31 930 611 1.1Wife in paid labor force 2 726............... 45 188 980 2 650 42 280 893 2 536 40 956 778 * 5.2Wife not in paid labor force 2 219............ 24 939 716 2 153 23 749 724 1 984 22 769 675 3.4
Male householder, no wife present 600........ 29 227 1 357 545 25 543 1 780 494 25 875 1 249 * 12.7Female householder, no husband present 1 728.. 16 532 710 1 612 14 994 703 1 617 12 952 677 * 8.6
Age of Householder
Under 65 years 6 683......................... 30 363 542 6 414 28 770 698 6 112 26 713 517 * 3.915 to 24 years 659....................... 19 738 1 106 626 17 900 1 079 545 15 695 973 8.625 to 34 years 2 008....................... 27 587 831 1 944 26 291 756 1 905 25 645 727 3.335 to 44 years 2 128....................... 32 299 1 050 2 002 31 431 959 1 925 27 877 1 052 1.245 to 54 years 1 194....................... 39 277 1 876 1 166 34 592 1 983 1 074 33 390 2 083 * 11.855 to 64 years 693....................... 33 872 1 732 676 33 628 2 200 662 31 881 2 260 –0.8
65 years and over 591...................... 21 935 1 353 547 22 677 1 482 519 21 068 1 257 –4.865 to 74 years 409....................... 24 115 2 264 372 23 988 1 917 383 22 714 1 716 –1.075 years and over 181................... 20 420 1 888 174 20 419 2 108 136 18 228 2 083 –1.5
Size of Family
Two people 1 889............................ 24 671 1 042 1 748 23 593 1 228 1 731 21 466 730 3.0Three people 1 686........................... 27 854 977 1 669 26 210 1 110 1 571 25 275 1 106 4.6Four people 1 715............................ 32 230 1 193 1 678 31 462 1 175 1 555 29 962 1 126 0.9Five people 1 192............................ 32 960 1 674 1 108 31 175 1 142 931 29 926 1 256 4.1Six people 479............................. 32 604 1 940 445 30 233 2 199 488 26 460 1 535 6.2Seven people or more 312................... 39 160 3 468 313 35 508 3 190 355 33 540 3 769 8.6
Number of Earners
No earners 772............................. 9 574 616 815 8 870 554 809 8 601 508 6.3One earner 2 566............................ 20 548 517 2 434 19 662 637 2 320 18 388 593 2.9Two earners or more 3 936.................... 42 679 847 3 712 41 153 629 3 502 39 354 880 2.1
Two earners 2 903........................ 38 007 985 2 761 37 425 900 2 548 35 114 966 –Three earners 733....................... 49 408 2 167 669 47 549 1 635 694 48 292 2 232 2.3Four earners or more 300................. 74 857 4 305 282 59 456 2 564 260 58 446 3 073 * 24.0
1Hispanics may be of any race.
16 INCOMEU.S. Census Bureau

Table 5. Selected Characteristics of Families mTotal Money Income of Families in 1998[Numbers in thousands. Families as of March of the following year. For meaning of symbols, see text]
Characteristic
Median income Mean income
Total
Lessthan
$5,000
$5,000to
$9,999
$10,000to
$14,999
$15,000to
$24,999
$25,000to
$34,999
$35,000to
$49,999
$50,000to
$74,999
$75,000to
$99,999
$100,000and
overValue
(dollars)
Standarderror
(dollars)Value
(dollars)
Standarderror
(dollars)
All families 71 551.............. 1 902 2 691 3 799 8 811 9 052 11 995 15 427 8 350 9 524 46 737 241 59 589 369
TYPE OF RESIDENCE
Inside metropolitan areas 56 993....... 1 517 2 005 2 830 6 527 6 849 9 113 12 248 7 197 8 708 49 407 308 63 080 437Inside central cities 19 613.......... 812 1 103 1 397 2 814 2 511 3 120 3 647 1 973 2 235 40 444 441 54 080 662
1 million or more 12 425.......... 519 742 936 1 876 1 545 1 820 2 237 1 229 1 521 39 965 774 54 652 853Under 1 million 7 188............ 293 360 461 938 966 1 300 1 411 745 714 41 099 641 53 092 1 042
Outside central cities 37 380......... 704 902 1 433 3 713 4 338 5 992 8 601 5 223 6 473 53 977 431 67 803 5661 million or more 25 368.......... 412 574 811 2 209 2 711 3 908 5 838 3 754 5 150 58 104 524 72 638 725Under 1 million 12 012............ 292 328 622 1 504 1 627 2 084 2 762 1 470 1 323 46 929 548 57 591 852
Outside metropolitan areas 14 558..... 385 686 968 2 284 2 203 2 882 3 179 1 153 816 38 326 582 45 921 690
REGION
Northeast 13 384.................... 361 478 634 1 523 1 489 2 122 2 819 1 739 2 219 50 567 536 64 887 830Midwest 16 875...................... 350 553 750 1 826 2 200 2 839 4 108 2 083 2 168 49 552 543 60 908 768South 25 894........................ 780 1 076 1 567 3 602 3 463 4 413 5 314 2 749 2 929 42 711 474 55 417 611West 15 398......................... 412 584 847 1 860 1 900 2 621 3 186 1 779 2 209 46 819 496 60 554 842
RACE AND HISPANICORIGIN OFHOUSEHOLDER
White 60 077........................ 1 225 1 768 2 844 6 996 7 570 10 268 13 460 7 343 8 601 49 023 283 62 384 420Black 8 452........................ 545 806 803 1 511 1 145 1 245 1 351 598 446 29 404 586 38 563 586Hispanic origin1 7 273............... 351 515 758 1 371 1 247 1 168 1 090 413 361 29 608 568 39 727 924
TYPE OF FAMILY
All primary families 71 551............ 1 902 2 691 3 799 8 811 9 052 11 995 15 427 8 350 9 524 46 737 241 59 589 369Married~couple families 54 778....... 627 926 1 842 5 515 6 345 9 452 13 303 7 736 9 033 54 180 321 67 875 452Male householder, no wifepresent 3 977................... 146 171 237 707 690 756 777 263 231 35 681 851 43 913 912
Female householder, nohusband present 12 796........... 1 130 1 594 1 720 2 589 2 017 1 788 1 347 351 261 22 163 326 28 990 450
Unrelated subfamilies 525.......... 132 65 81 108 59 44 29 5 2 13 691 1 156 18 169 1 156
AGE OF HOUSEHOLDER
Under 65 years 60 053............... 1 724 2 235 2 862 6 221 6 840 9 948 13 887 7 655 8 683 50 259 239 62 383 41315 to 24 years 3 242.............. 342 405 372 722 491 456 316 73 65 21 918 576 30 124 1 54925 to 34 years 13 226.............. 550 664 873 1 694 1 860 2 329 3 048 1 253 956 41 074 466 48 598 66335 to 44 years 18 823.............. 429 582 787 1 776 2 059 3 361 4 537 2 588 2 703 51 883 464 63 925 73045 to 54 years 15 127.............. 218 308 442 1 050 1 319 2 225 3 865 2 398 3 301 61 833 586 75 582 90255 to 64 years 9 635.............. 185 277 386 978 1 112 1 576 2 120 1 343 1 658 52 577 665 68 425 1 119
65 years and over 11 498............. 178 456 937 2 590 2 213 2 047 1 540 694 842 31 568 395 44 998 75865 to 74 years 7 051.............. 121 253 489 1 383 1 309 1 340 1 078 501 576 34 719 594 47 927 94775 years and over 4 447........... 57 203 448 1 207 904 707 462 193 265 27 717 454 40 355 1 253
Mean age of householder 47.1...... 39.3 43.2 47.3 49.8 48.8 47.1 45.7 46.6 48.2 (X) (X) (X) (X)
PRESENCE OF RELATEDCHILDREN UNDER 18YEARS OLD
No related children 34 283............ 535 861 1 593 4 420 4 541 5 860 7 465 4 062 4 946 48 227 368 62 417 568One or more related children 37 268.... 1 367 1 830 2 206 4 391 4 511 6 135 7 962 4 288 4 578 45 442 327 56 988 477
All under 6 years 8 878.......... 421 551 582 1 151 1 122 1 476 1 731 877 967 41 245 606 51 952 915Some under 6, some 6 to 17years 7 945................... 384 439 555 1 041 953 1 333 1 691 752 796 41 015 611 53 049 1 057
All 6 to 17 years 20 445........... 561 841 1 069 2 199 2 436 3 326 4 540 2 659 2 814 48 971 525 60 705 653One child 15 526................... 542 827 908 1 885 1 941 2 501 3 260 1 787 1 873 45 364 500 55 986 714
Under 6 years 5 783............. 270 361 409 779 719 960 1 146 548 591 40 943 734 50 784 1 1066 to 17 years 9 743.............. 272 466 499 1 106 1 222 1 541 2 114 1 240 1 282 47 569 699 59 074 926
Two children or more 21 742........ 825 1 003 1 298 2 506 2 570 3 634 4 702 2 501 2 704 45 506 453 57 703 639All under 6 years 3 095.......... 151 189 173 372 403 515 585 330 376 41 850 1 160 54 135 1 617Some under 6, some 6 to 17years 7 945................... 384 439 555 1 041 953 1 333 1 691 752 796 41 015 611 53 049 1 057
All 6 to 17 years 10 703........... 289 375 570 1 093 1 214 1 785 2 426 1 419 1 532 50 215 685 62 189 919
Mean number of relatedchildren 0.98..................... 1.46 1.33 1.18 0.96 0.93 0.97 0.95 0.93 0.88 (X) (X) (X) (X)
SIZE OF FAMILY
Two people 31 102................... 915 1 362 1 985 4 858 4 642 5 263 5 937 2 777 3 361 39 721 364 53 693 555Three people 16 227................. 450 637 808 1 842 1 848 2 714 3 676 2 101 2 150 48 933 547 60 118 737Four people 14 390................... 283 374 544 1 154 1 478 2 396 3 557 2 126 2 478 56 061 607 67 834 798Five people 6 573................... 173 201 284 582 674 1 062 1 595 950 1 053 54 357 893 66 830 1 392Six people 2 135.................... 45 86 112 235 268 346 444 287 313 48 816 1 643 62 053 2 106Seven people or more 1 124......... 36 31 65 139 142 214 218 110 169 45 254 1 774 62 512 3 393
Mean size of family 3.18............ 3.00 2.97 3.00 2.91 3.02 3.18 3.27 3.39 3.39 (X) (X) (X) (X)
NUMBER OF EARNERS
No earners 9 692................... 985 1 149 1 236 2 517 1 624 1 091 606 217 266 20 689 297 27 221 443One earner 21 221................... 765 1 274 1 973 4 046 3 637 3 678 3 120 1 252 1 476 31 483 273 45 323 692Two earners or more 40 638........... 152 268 590 2 247 3 792 7 226 11 700 6 881 7 782 61 675 283 74 758 498
Two earners 31 787................ 131 257 549 2 065 3 287 6 146 9 140 4 861 5 352 58 397 366 70 834 538Three earners 6 642............... 21 11 40 173 447 924 2 020 1 409 1 597 70 339 838 84 993 1 440Four earners or more 2 209........ – 1 – 9 59 156 541 610 834 88 031 1 852 100 450 1 961
Mean number of earners 1.64....... 0.58 0.69 0.86 1.02 1.34 1.67 1.98 2.19 2.22 (X) (X) (X) (X)
See footnotes at end of table.
INCOME 17U.S. Census Bureau

Table 5. Selected Characteristics of Families mTotal Money Income of Families in 1998 mCon.[Numbers in thousands. Families as of March of the following year. For meaning of symbols, see text]
Characteristic
Median income Mean income
Total
Lessthan
$5,000
$5,000to
$9,999
$10,000to
$14,999
$15,000to
$24,999
$25,000to
$34,999
$35,000to
$49,999
$50,000to
$74,999
$75,000to
$99,999
$100,000and
overValue
(dollars)
Standarderror
(dollars)Value
(dollars)
Standarderror
(dollars)
WORK EXPERIENCE OFHOUSEHOLDER
Total 71 551................... 1 902 2 691 3 799 8 811 9 052 11 995 15 427 8 350 9 524 46 737 241 59 589 369Worked 54 167...................... 793 1 284 2 091 5 053 6 120 9 368 13 425 7 466 8 567 53 500 305 66 394 442
Worked at full~time jobs 47 366...... 463 774 1 598 4 156 5 288 8 204 12 118 6 931 7 835 55 605 294 68 492 48050 weeks or more 40 470......... 153 266 1 054 3 148 4 428 7 098 10 812 6 314 7 197 58 274 357 71 755 52827 to 49 weeks 4 465............ 41 213 302 666 581 757 916 488 502 43 709 1 198 55 794 1 43926 weeks or less 2 430.......... 268 295 242 343 278 350 389 129 136 26 912 1 124 37 488 1 383
Worked at part~time jobs 6 801..... 330 511 493 896 833 1 164 1 308 535 732 39 038 725 51 779 1 06850 weeks or more 3 347......... 62 183 273 471 448 571 651 274 415 40 571 1 284 54 717 1 47927 to 49 weeks 1 604............ 66 151 85 195 175 323 301 122 184 41 279 1 192 53 614 2 35226 weeks or less 1 851.......... 202 177 134 230 209 271 356 139 133 33 755 1 521 44 878 2 001
Did not work 17 384.................. 1 109 1 407 1 708 3 758 2 932 2 627 2 002 884 957 26 956 272 38 385 572
EDUCATIONALATTAINMENT2
Total 68 309................... 1 560 2 286 3 427 8 088 8 562 11 539 15 111 8 277 9 459 48 194 270 60 988 377Less than 9th grade 4 464........... 185 473 689 1 153 812 600 359 97 97 22 328 461 29 547 9129th to 12th grade (no diploma) 6 227.. 380 531 652 1 364 1 005 1 110 772 272 142 26 707 539 33 356 653High school graduate (includesequivalency) 21 689................. 576 724 1 190 2 998 3 459 4 365 4 984 2 096 1 298 41 302 358 48 434 456
Some college, no degree 12 612....... 254 320 508 1 349 1 664 2 434 3 149 1 593 1 342 48 495 571 57 315 754Associate degree 5 420.............. 62 103 180 474 557 998 1 538 798 710 54 719 943 63 524 1 354Bachelor’s degree or more 17 896...... 105 136 207 750 1 064 2 033 4 309 3 421 5 870 76 999 602 95 481 989
Bachelor’s degree 11 593........... 78 100 144 565 777 1 480 3 029 2 228 3 192 71 680 583 85 423 1 033Master’s degree 4 093............. 14 21 43 140 186 404 924 849 1 513 83 052 1 114 101 670 2 223Professional degree 1 228......... 7 10 18 26 55 77 184 151 700 100 000 5 933 147 170 5 933Doctorate degree 982............ 7 4 3 19 47 72 172 192 466 96 945 2 509 123 796 4 738
1Hispanics may be of any race.2Restricted to people 25 years and over.
18 INCOMEU.S. Census Bureau

Table 6. Presence of Related Children Under 18 Years Old mTotal Money Income in 1998 ofMarried ~Couple Families by Work Experience in 1998 of Husband and Wife
[Numbers in thousands. Married~couple families as of March of the following year. For meaning of symbols, see text]
Total money income
One or more related children under 18 years old
One child Two children or more
Total
Norelated
children Total
Allunder
6 years
Someunder 6,some 6
to 17years
All6 to 17
years TotalUnder
6 years6 to 17
years Total
Allunder 6
years
Someunder 6,some 6
to 17years
All6 to 17
years
Meannumber
of relatedchildren
ALL MARRIED ~COUPLE FAMILIES
Total............................... 54 778......... 28 552 26 226 6 399 5 824 14 004 10 077 3 927 6 149 16 150 2 471 5 824 7 854 0.92Less than $5,000 ....................... 627......... 394 232 49 58 125 77 24 53 155 25 58 72 0.79$5,000 to $9,999 ....................... 926......... 557 368 136 92 140 151 85 66 217 50 92 75 0.80$10,000 to $14,999 ..................... 1 842......... 1 109 733 210 230 293 249 133 116 484 76 230 177 0.88$15,000 to $19,999 ..................... 2 529......... 1 631 898 269 268 361 352 175 177 546 94 268 184 0.74$20,000 to $24,999 ..................... 2 986......... 1 856 1 131 340 327 464 403 194 208 728 145 327 255 0.77$25,000 to $29,999 ..................... 3 166......... 1 817 1 349 395 319 636 468 238 230 882 157 319 406 0.87$30,000 to $34,999 ..................... 3 179......... 1 724 1 455 389 392 673 492 207 285 962 182 392 388 0.91$35,000 to $39,999 ..................... 3 127......... 1 611 1 516 382 427 707 512 210 302 1 004 172 427 406 0.98$40,000 to $44,999 ..................... 3 138......... 1 538 1 600 409 379 812 540 251 289 1 060 158 379 523 1.03$45,000 to $49,999 ..................... 3 187......... 1 584 1 603 466 329 808 676 312 364 926 154 329 443 0.94
$50,000 to $54,999 ..................... 3 130......... 1 497 1 633 422 381 831 644 269 375 989 152 381 456 0.97$55,000 to $59,999 ..................... 2 817......... 1 373 1 445 308 312 824 594 210 384 851 99 312 441 0.96$60,000 to $64,999 ..................... 2 720......... 1 252 1 469 311 301 856 569 204 364 900 107 301 492 1.01$65,000 to $69,999 ..................... 2 370......... 1 166 1 203 297 262 644 457 188 269 747 109 262 376 0.94$70,000 to $74,999 ..................... 2 265......... 1 075 1 190 249 263 678 462 157 305 728 92 263 373 0.98$75,000 to $79,999 ..................... 1 825......... 834 991 205 162 623 414 134 280 577 71 162 344 1.00$80,000 to $84,999 ..................... 1 843......... 840 1 004 188 191 624 402 99 303 602 89 191 321 1.01$85,000 to $89,999 ..................... 1 474......... 800 674 148 135 391 268 96 172 406 52 135 219 0.83$90,000 to $94,999 ..................... 1 400......... 653 747 179 115 453 347 117 230 400 63 115 223 0.92$95,000 to $99,999 ..................... 1 194......... 594 600 107 118 375 221 59 162 379 47 118 214 0.96$100,000 and over ..................... 9 033......... 4 645 4 387 940 764 2 684 1 779 563 1 216 2 608 376 764 1 468 0.90
Median income dollars............................ 54 180 51 323 57 022 51 474 51 019 61 630 59 033 51 883 62 672 55 674 50 623 51 019 60 888 (X)Standard error dollars.......................... 321 369 411 570 641 440 608 682 860 526 1 200 641 577 (X)
Mean income dollars............................. 67 875 66 240 69 655 63 542 63 975 74 810 71 068 63 506 75 897 68 773 63 600 63 975 73 958 (X)Standard error dollars.......................... 452 650 624 1 173 1 349 868 995 1 486 1 318 800 1 908 1 349 1 154 (X)
Income per family member dollars................. 21 001 28 463 16 518 17 367 12 752 18 073 20 807 19 707 21 447 14 580 14 615 12 752 16 045 (X)Standard error dollars.......................... 159 332 177 392 318 259 362 573 470 203 534 318 310 (X)
HUSBAND WORKED
Total............................... 43 705......... 18 822 24 883 6 177 5 581 13 126 9 429 3 781 5 648 15 454 2 395 5 581 7 478 1.09Less than $5,000 ....................... 253......... 127 126 35 30 61 46 20 26 80 15 30 35 1.04$5,000 to $9,999 ....................... 393......... 123 270 111 75 84 101 68 33 169 42 75 51 1.38$10,000 to $14,999 ..................... 850......... 259 592 185 200 207 180 110 70 411 75 200 137 1.54$15,000 to $19,999 ..................... 1 155......... 409 745 248 246 251 265 156 109 480 92 246 142 1.38$20,000 to $24,999 ..................... 1 609......... 607 1 001 327 293 382 356 186 169 646 141 293 212 1.25$25,000 to $29,999 ..................... 1 944......... 734 1 209 371 294 545 414 222 192 796 149 294 353 1.28$30,000 to $34,999 ..................... 2 267......... 916 1 351 375 370 606 451 204 248 900 171 370 358 1.19$35,000 to $39,999 ..................... 2 366......... 938 1 428 374 412 643 462 207 255 966 167 412 387 1.23$40,000 to $44,999 ..................... 2 568......... 1 032 1 537 401 372 764 510 245 265 1 027 156 372 500 1.21$45,000 to $49,999 ..................... 2 688......... 1 149 1 539 442 322 775 635 295 340 904 147 322 435 1.07
$50,000 to $54,999 ..................... 2 767......... 1 178 1 589 416 377 797 618 266 353 971 150 377 444 1.08$55,000 to $59,999 ..................... 2 506......... 1 104 1 403 302 305 795 572 207 364 831 95 305 431 1.05$60,000 to $64,999 ..................... 2 454......... 1 008 1 446 307 295 843 557 202 355 888 105 295 488 1.10$65,000 to $69,999 ..................... 2 129......... 953 1 176 286 260 629 438 182 256 738 105 260 373 1.03$70,000 to $74,999 ..................... 2 080......... 912 1 167 242 259 666 452 153 299 716 90 259 367 1.05$75,000 to $79,999 ..................... 1 690......... 713 977 202 159 617 404 131 273 573 71 159 344 1.07$80,000 to $84,999 ..................... 1 713......... 727 986 186 191 609 392 97 296 593 89 191 313 1.07$85,000 to $89,999 ..................... 1 360......... 694 666 147 135 384 261 96 166 405 52 135 218 0.89$90,000 to $94,999 ..................... 1 283......... 548 735 179 109 448 341 116 225 394 63 109 223 1.00$95,000 to $99,999 ..................... 1 126......... 532 594 107 118 369 219 59 159 375 47 118 210 1.01$100,000 and over ..................... 8 505......... 4 158 4 347 935 760 2 651 1 756 561 1 195 2 591 375 760 1 456 0.94
Median income dollars............................ 60 867 64 090 58 730 52 126 52 013 63 616 60 784 52 613 65 767 57 118 51 244 52 013 62 230 (X)Standard error dollars.......................... 279 540 431 631 662 625 546 985 977 532 1 073 662 628 (X)
Mean income dollars............................. 75 356 80 306 71 611 64 640 65 539 77 474 73 496 64 690 79 391 70 462 64 562 65 539 76 026 (X)Standard error dollars.......................... 537 902 649 1 206 1 396 909 1 047 1 531 1 404 826 1 958 1 396 1 191 (X)
Income per family member dollars................. 22 043 33 714 17 039 17 759 13 163 18 724 21 597 20 228 22 425 15 022 14 886 13 163 16 567 (X)Standard error dollars.......................... 183 466 185 407 332 273 385 597 506 212 551 332 324 (X)
INCOME 19U.S. Census Bureau
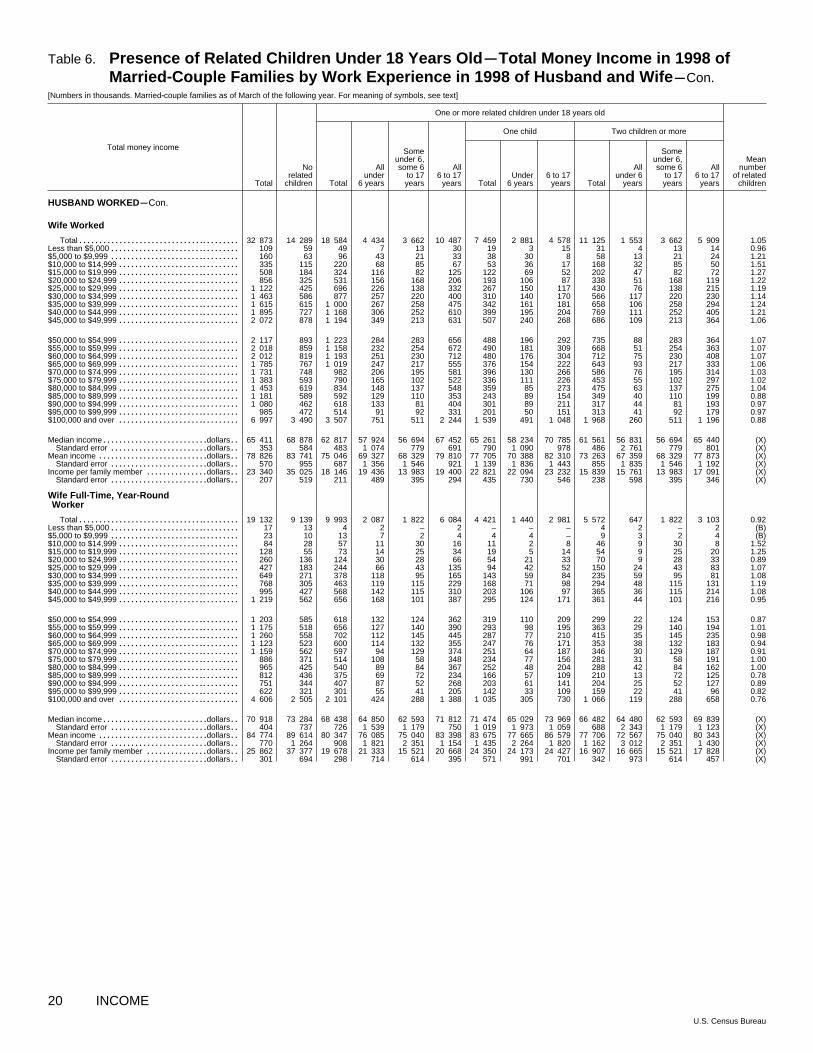
Table 6. Presence of Related Children Under 18 Years Old mTotal Money Income in 1998 ofMarried ~Couple Families by Work Experience in 1998 of Husband and Wife mCon.
[Numbers in thousands. Married~couple families as of March of the following year. For meaning of symbols, see text]
Total money income
One or more related children under 18 years old
One child Two children or more
Total
Norelated
children Total
Allunder
6 years
Someunder 6,some 6
to 17years
All6 to 17
years TotalUnder
6 years6 to 17
years Total
Allunder 6
years
Someunder 6,some 6
to 17years
All6 to 17
years
Meannumber
of relatedchildren
HUSBAND WORKEDmCon.
Wife Worked
Total............................... 32 873......... 14 289 18 584 4 434 3 662 10 487 7 459 2 881 4 578 11 125 1 553 3 662 5 909 1.05Less than $5,000 ....................... 109......... 59 49 7 13 30 19 3 15 31 4 13 14 0.96$5,000 to $9,999 ....................... 160......... 63 96 43 21 33 38 30 8 58 13 21 24 1.21$10,000 to $14,999 ..................... 335......... 115 220 68 85 67 53 36 17 168 32 85 50 1.51$15,000 to $19,999 ..................... 508......... 184 324 116 82 125 122 69 52 202 47 82 72 1.27$20,000 to $24,999 ..................... 856......... 325 531 156 168 206 193 106 87 338 51 168 119 1.22$25,000 to $29,999 ..................... 1 122......... 425 696 226 138 332 267 150 117 430 76 138 215 1.19$30,000 to $34,999 ..................... 1 463......... 586 877 257 220 400 310 140 170 566 117 220 230 1.14$35,000 to $39,999 ..................... 1 615......... 615 1 000 267 258 475 342 161 181 658 106 258 294 1.24$40,000 to $44,999 ..................... 1 895......... 727 1 168 306 252 610 399 195 204 769 111 252 405 1.21$45,000 to $49,999 ..................... 2 072......... 878 1 194 349 213 631 507 240 268 686 109 213 364 1.06
$50,000 to $54,999 ..................... 2 117......... 893 1 223 284 283 656 488 196 292 735 88 283 364 1.07$55,000 to $59,999 ..................... 2 018......... 859 1 158 232 254 672 490 181 309 668 51 254 363 1.07$60,000 to $64,999 ..................... 2 012......... 819 1 193 251 230 712 480 176 304 712 75 230 408 1.07$65,000 to $69,999 ..................... 1 785......... 767 1 019 247 217 555 376 154 222 643 93 217 333 1.06$70,000 to $74,999 ..................... 1 731......... 748 982 206 195 581 396 130 266 586 76 195 314 1.03$75,000 to $79,999 ..................... 1 383......... 593 790 165 102 522 336 111 226 453 55 102 297 1.02$80,000 to $84,999 ..................... 1 453......... 619 834 148 137 548 359 85 273 475 63 137 275 1.04$85,000 to $89,999 ..................... 1 181......... 589 592 129 110 353 243 89 154 349 40 110 199 0.88$90,000 to $94,999 ..................... 1 080......... 462 618 133 81 404 301 89 211 317 44 81 193 0.97$95,000 to $99,999 ..................... 985......... 472 514 91 92 331 201 50 151 313 41 92 179 0.97$100,000 and over ..................... 6 997......... 3 490 3 507 751 511 2 244 1 539 491 1 048 1 968 260 511 1 196 0.88
Median income dollars............................ 65 411 68 878 62 817 57 924 56 694 67 452 65 261 58 234 70 785 61 561 56 831 56 694 65 440 (X)Standard error dollars.......................... 353 584 483 1 074 779 691 790 1 090 978 486 2 761 779 801 (X)
Mean income dollars............................. 78 826 83 741 75 046 69 327 68 329 79 810 77 705 70 388 82 310 73 263 67 359 68 329 77 873 (X)Standard error dollars.......................... 570 955 687 1 356 1 546 921 1 139 1 836 1 443 855 1 835 1 546 1 192 (X)
Income per family member dollars................. 23 340 35 025 18 146 19 436 13 983 19 400 22 821 22 094 23 232 15 839 15 761 13 983 17 091 (X)Standard error dollars.......................... 207 519 211 489 395 294 435 730 546 238 598 395 346 (X)
Wife Full ~Time, Year ~RoundWorker
Total............................... 19 132......... 9 139 9 993 2 087 1 822 6 084 4 421 1 440 2 981 5 572 647 1 822 3 103 0.92Less than $5,000 ....................... 17......... 13 4 2 – 2 – – – 4 2 – 2 (B)$5,000 to $9,999 ....................... 23......... 10 13 7 2 4 4 4 – 9 3 2 4 (B)$10,000 to $14,999 ..................... 84......... 28 57 11 30 16 11 2 8 46 9 30 8 1.52$15,000 to $19,999 ..................... 128......... 55 73 14 25 34 19 5 14 54 9 25 20 1.25$20,000 to $24,999 ..................... 260......... 136 124 30 28 66 54 21 33 70 9 28 33 0.89$25,000 to $29,999 ..................... 427......... 183 244 66 43 135 94 42 52 150 24 43 83 1.07$30,000 to $34,999 ..................... 649......... 271 378 118 95 165 143 59 84 235 59 95 81 1.08$35,000 to $39,999 ..................... 768......... 305 463 119 115 229 168 71 98 294 48 115 131 1.19$40,000 to $44,999 ..................... 995......... 427 568 142 115 310 203 106 97 365 36 115 214 1.08$45,000 to $49,999 ..................... 1 219......... 562 656 168 101 387 295 124 171 361 44 101 216 0.95
$50,000 to $54,999 ..................... 1 203......... 585 618 132 124 362 319 110 209 299 22 124 153 0.87$55,000 to $59,999 ..................... 1 175......... 518 656 127 140 390 293 98 195 363 29 140 194 1.01$60,000 to $64,999 ..................... 1 260......... 558 702 112 145 445 287 77 210 415 35 145 235 0.98$65,000 to $69,999 ..................... 1 123......... 523 600 114 132 355 247 76 171 353 38 132 183 0.94$70,000 to $74,999 ..................... 1 159......... 562 597 94 129 374 251 64 187 346 30 129 187 0.91$75,000 to $79,999 ..................... 886......... 371 514 108 58 348 234 77 156 281 31 58 191 1.00$80,000 to $84,999 ..................... 965......... 425 540 89 84 367 252 48 204 288 42 84 162 1.00$85,000 to $89,999 ..................... 812......... 436 375 69 72 234 166 57 109 210 13 72 125 0.78$90,000 to $94,999 ..................... 751......... 344 407 87 52 268 203 61 141 204 25 52 127 0.89$95,000 to $99,999 ..................... 622......... 321 301 55 41 205 142 33 109 159 22 41 96 0.82$100,000 and over ..................... 4 606......... 2 505 2 101 424 288 1 388 1 035 305 730 1 066 119 288 658 0.76
Median income dollars............................ 70 918 73 284 68 438 64 850 62 593 71 812 71 474 65 029 73 969 66 482 64 480 62 593 69 839 (X)Standard error dollars.......................... 404 737 726 1 539 1 179 750 1 019 1 973 1 059 688 2 343 1 179 1 123 (X)
Mean income dollars............................. 84 774 89 614 80 347 76 085 75 040 83 398 83 675 77 665 86 579 77 706 72 567 75 040 80 343 (X)Standard error dollars.......................... 770 1 264 908 1 821 2 351 1 154 1 435 2 264 1 820 1 162 3 012 2 351 1 430 (X)
Income per family member dollars................. 25 862 37 377 19 678 21 333 15 521 20 668 24 350 24 173 24 427 16 907 16 665 15 521 17 828 (X)Standard error dollars.......................... 301 694 298 714 614 395 571 991 701 342 973 614 457 (X)
20 INCOMEU.S. Census Bureau

Table 6. Presence of Related Children Under 18 Years Old mTotal Money Income in 1998 ofMarried ~Couple Families by Work Experience in 1998 of Husband and Wife mCon.
[Numbers in thousands. Married~couple families as of March of the following year. For meaning of symbols, see text]
Total money income
One or more related children under 18 years old
One child Two children or more
Total
Norelated
children Total
Allunder
6 years
Someunder 6,some 6
to 17years
All6 to 17
years TotalUnder
6 years6 to 17
years Total
Allunder 6
years
Someunder 6,some 6
to 17years
All6 to 17
years
Meannumber
of relatedchildren
HUSBAND WORKEDmCon.
Wife Did Not Work
Total............................... 10 832......... 4 532 6 300 1 742 1 919 2 639 1 970 900 1 070 4 329 842 1 919 1 568 1.24Less than $5,000 ....................... 144......... 68 76 28 17 31 27 17 10 49 11 17 21 1.10$5,000 to $9,999 ....................... 234......... 60 174 68 54 52 63 38 25 110 30 54 27 1.50$10,000 to $14,999 ..................... 516......... 144 372 117 115 140 128 74 54 244 43 115 86 1.56$15,000 to $19,999 ..................... 647......... 225 421 131 163 127 143 86 57 278 45 163 70 1.47$20,000 to $24,999 ..................... 753......... 282 471 171 125 175 163 81 82 308 90 125 93 1.28$25,000 to $29,999 ..................... 822......... 309 513 144 155 213 147 72 75 366 72 155 138 1.39$30,000 to $34,999 ..................... 804......... 330 474 118 151 206 141 64 77 333 53 151 129 1.28$35,000 to $39,999 ..................... 751......... 323 428 107 154 168 120 46 74 308 61 154 93 1.22$40,000 to $44,999 ..................... 674......... 305 369 94 120 155 110 50 61 258 45 120 94 1.21$45,000 to $49,999 ..................... 616......... 270 345 93 108 144 128 55 73 218 38 108 71 1.12
$50,000 to $54,999 ..................... 651......... 285 366 131 94 140 130 70 61 236 62 94 80 1.10$55,000 to $59,999 ..................... 489......... 244 244 70 51 123 81 27 55 163 43 51 68 0.98$60,000 to $64,999 ..................... 442......... 189 253 56 66 131 77 26 51 176 30 66 80 1.24$65,000 to $69,999 ..................... 344......... 186 158 40 44 74 62 28 35 95 12 44 40 0.91$70,000 to $74,999 ..................... 349......... 164 185 36 64 85 55 23 33 130 13 64 53 1.12$75,000 to $79,999 ..................... 307......... 119 188 37 57 94 68 20 47 120 16 57 47 1.27$80,000 to $84,999 ..................... 260......... 108 152 38 54 60 34 11 22 119 27 54 38 1.19$85,000 to $89,999 ..................... 179......... 105 74 18 26 31 18 7 11 56 11 26 19 0.94$90,000 to $94,999 ..................... 203......... 86 117 46 28 44 40 27 13 77 19 28 30 1.13$95,000 to $99,999 ..................... 141......... 61 80 16 25 39 18 10 8 62 6 25 31 1.30$100,000 and over ..................... 1 508......... 669 840 184 249 407 216 70 147 623 115 249 260 1.24
Median income dollars............................ 45 541 49 128 42 079 39 361 40 714 46 673 42 063 36 870 46 353 42 084 40 987 40 714 46 942 (X)Standard error dollars.......................... 598 878 669 1 463 974 1 259 1 465 2 448 1 737 859 1 460 974 2 036 (X)
Mean income dollars............................. 64 825 69 475 61 480 52 713 60 214 68 191 57 562 46 459 66 905 63 264 59 401 60 214 69 068 (X)Standard error dollars.......................... 1 293 2 207 1 554 2 475 2 780 2 631 2 478 2 396 4 045 1 959 4 409 2 780 3 461 (X)
Income per family member dollars................. 18 291 29 515 13 971 13 780 11 681 16 113 16 952 14 351 18 960 13 022 13 336 11 681 14 659 (X)Standard error dollars.......................... 407 1 072 396 735 605 702 838 907 1 304 451 1 099 605 828 (X)
HUSBAND FULL ~TIME, YEAR~ROUND WORKER
Total............................... 36 285......... 14 576 21 709 5 361 4 853 11 494 8 155 3 252 4 903 13 554 2 109 4 853 6 592 1.15Less than $5,000 ....................... 145......... 60 86 23 20 43 32 11 20 54 12 20 22 1.24$5,000 to $9,999 ....................... 151......... 47 103 38 25 41 38 24 15 65 14 25 26 1.51$10,000 to $14,999 ..................... 496......... 129 367 123 111 133 116 73 43 250 50 111 90 1.59$15,000 to $19,999 ..................... 781......... 245 536 189 189 157 198 124 74 337 65 189 84 1.47$20,000 to $24,999 ..................... 1 107......... 325 782 269 247 266 274 149 125 508 119 247 141 1.43$25,000 to $29,999 ..................... 1 424......... 457 967 305 236 426 332 183 149 635 122 236 277 1.39$30,000 to $34,999 ..................... 1 723......... 600 1 123 311 299 513 373 165 207 750 146 299 306 1.31$35,000 to $39,999 ..................... 1 849......... 609 1 241 336 370 535 404 188 216 837 148 370 318 1.36$40,000 to $44,999 ..................... 2 058......... 737 1 321 339 318 664 424 202 222 897 137 318 442 1.31$45,000 to $49,999 ..................... 2 204......... 861 1 342 384 293 665 532 248 285 810 137 293 381 1.14
$50,000 to $54,999 ..................... 2 341......... 913 1 428 383 334 710 547 237 310 881 146 334 400 1.14$55,000 to $59,999 ..................... 2 153......... 883 1 270 271 279 719 504 179 325 766 92 279 394 1.12$60,000 to $64,999 ..................... 2 157......... 824 1 333 288 274 772 509 183 325 824 104 274 446 1.16$65,000 to $69,999 ..................... 1 811......... 758 1 053 259 231 563 380 163 218 673 96 231 345 1.10$70,000 to $74,999 ..................... 1 809......... 742 1 067 230 242 595 403 147 256 664 82 242 339 1.10$75,000 to $79,999 ..................... 1 467......... 601 866 164 150 553 347 112 235 519 52 150 318 1.11$80,000 to $84,999 ..................... 1 556......... 638 917 175 185 558 357 93 265 560 82 185 293 1.10$85,000 to $89,999 ..................... 1 201......... 588 614 129 122 362 242 85 157 372 44 122 206 0.92$90,000 to $94,999 ..................... 1 159......... 469 691 177 98 415 322 115 207 368 63 98 208 1.02$95,000 to $99,999 ..................... 1 031......... 473 558 98 108 352 206 53 153 352 44 108 199 1.03$100,000 and over ..................... 7 661......... 3 616 4 044 871 721 2 452 1 613 518 1 095 2 432 353 721 1 357 0.98
Median income dollars............................ 63 750 68 930 60 883 54 673 54 710 65 830 62 429 55 632 67 777 59 910 53 356 54 710 64 574 (X)Standard error dollars.......................... 399 599 336 943 929 642 678 1 239 1 261 539 1 303 929 842 (X)
Mean income dollars............................. 78 932 86 117 74 108 66 418 68 194 80 192 75 592 66 186 81 831 73 215 66 776 68 194 78 972 (X)Standard error dollars.......................... 602 1 097 681 1 136 1 436 996 1 082 1 350 1 546 876 2 000 1 436 1 302 (X)
Income per family member dollars................. 22 686 35 675 17 667 18 231 13 727 19 438 22 231 20 713 23 140 15 669 15 409 13 727 17 305 (X)Standard error dollars.......................... 205 563 199 407 352 302 410 578 559 230 578 352 358 (X)
INCOME 21U.S. Census Bureau

Table 6. Presence of Related Children Under 18 Years Old mTotal Money Income in 1998 ofMarried ~Couple Families by Work Experience in 1998 of Husband and Wife mCon.
[Numbers in thousands. Married~couple families as of March of the following year. For meaning of symbols, see text]
Total money income
One or more related children under 18 years old
One child Two children or more
Total
Norelated
children Total
Allunder
6 years
Someunder 6,some 6
to 17years
All6 to 17
years TotalUnder
6 years6 to 17
years Total
Allunder 6
years
Someunder 6,some 6
to 17years
All6 to 17
years
Meannumber
of relatedchildren
HUSBAND FULL ~TIME, YEAR~ROUND WORKERmCon.
Wife Worked
Total............................... 27 799......... 11 555 16 244 3 870 3 172 9 202 6 491 2 504 3 988 9 753 1 367 3 172 5 215 1.08Less than $5,000 ....................... 76......... 35 41 7 10 24 17 3 14 24 4 10 10 1.13$5,000 to $9,999 ....................... 49......... 27 22 8 5 9 3 3 – 18 4 5 9 (B)$10,000 to $14,999 ..................... 144......... 52 92 35 23 34 21 16 4 71 18 23 30 1.37$15,000 to $19,999 ..................... 304......... 115 189 73 50 66 82 49 33 107 24 50 32 1.20$20,000 to $24,999 ..................... 578......... 181 397 123 140 135 143 80 63 255 43 140 72 1.38$25,000 to $29,999 ..................... 787......... 262 525 178 106 241 204 118 85 321 60 106 155 1.29$30,000 to $34,999 ..................... 1 114......... 412 703 206 173 324 243 110 133 460 97 173 191 1.22$35,000 to $39,999 ..................... 1 279......... 422 857 242 226 389 291 147 144 565 95 226 245 1.33$40,000 to $44,999 ..................... 1 527......... 532 995 257 211 527 335 163 173 660 94 211 355 1.28$45,000 to $49,999 ..................... 1 710......... 666 1 044 311 193 540 432 208 225 612 104 193 315 1.12
$50,000 to $54,999 ..................... 1 797......... 699 1 099 261 246 592 437 176 261 661 85 246 330 1.12$55,000 to $59,999 ..................... 1 753......... 716 1 037 202 232 603 423 153 271 614 49 232 332 1.11$60,000 to $64,999 ..................... 1 783......... 691 1 092 238 208 646 439 164 275 653 74 208 371 1.11$65,000 to $69,999 ..................... 1 532......... 620 911 222 193 497 328 137 191 583 85 193 306 1.11$70,000 to $74,999 ..................... 1 520......... 621 899 199 181 519 356 126 230 543 73 181 289 1.08$75,000 to $79,999 ..................... 1 192......... 497 695 132 101 462 286 96 190 409 35 101 272 1.06$80,000 to $84,999 ..................... 1 330......... 557 772 139 131 502 328 81 247 444 57 131 255 1.06$85,000 to $89,999 ..................... 1 064......... 511 553 119 100 334 230 84 145 323 34 100 188 0.91$90,000 to $94,999 ..................... 994......... 417 577 132 73 372 283 88 195 294 44 73 178 0.96$95,000 to $99,999 ..................... 908......... 425 484 82 86 315 191 44 147 293 38 86 168 0.98$100,000 and over ..................... 6 358......... 3 097 3 261 706 484 2 071 1 418 458 960 1 843 248 484 1 111 0.90
Median income dollars............................ 68 075 72 342 65 140 60 578 59 333 69 724 67 325 60 663 72 691 63 693 60 375 59 333 67 401 (X)Standard error dollars.......................... 450 635 479 885 974 754 908 983 1 023 666 2 336 974 882 (X)
Mean income dollars............................. 81 983 88 235 77 536 71 117 71 832 82 202 79 692 71 893 84 589 76 101 69 695 71 832 80 376 (X)Standard error dollars.......................... 629 1 111 726 1 239 1 728 1 001 1 158 1 607 1 581 930 1 911 1 728 1 286 (X)
Income per family member dollars................. 24 013 36 522 18 801 19 929 14 750 20 046 23 447 22 600 23 926 16 520 16 292 14 750 17 732 (X)Standard error dollars.......................... 230 601 228 486 445 323 459 706 601 262 641 445 379 (X)
Wife Full ~Time, Year ~RoundWorker
Total............................... 16 703......... 7 774 8 929 1 870 1 617 5 442 3 932 1 286 2 646 4 997 584 1 617 2 796 0.94Less than $5,000 ....................... 15......... 11 4 2 – 2 – – – 4 2 – 2 (B)$5,000 to $9,999 ....................... 12......... 10 2 – 1 1 – – – 2 – 1 1 (B)$10,000 to $14,999 ..................... 53......... 26 27 8 13 6 1 – 1 26 8 13 6 (B)$15,000 to $19,999 ..................... 76......... 37 40 3 16 20 14 2 12 26 2 16 8 1.09$20,000 to $24,999 ..................... 161......... 73 88 19 22 46 37 13 24 51 6 22 23 1.08$25,000 to $29,999 ..................... 302......... 121 181 58 37 87 69 36 33 112 22 37 54 1.13$30,000 to $34,999 ..................... 503......... 197 306 98 75 133 119 52 67 186 45 75 66 1.13$35,000 to $39,999 ..................... 613......... 226 388 105 100 183 139 64 75 249 41 100 107 1.23$40,000 to $44,999 ..................... 818......... 335 483 114 102 266 161 83 78 322 31 102 188 1.13$45,000 to $49,999 ..................... 1 023......... 450 574 149 90 335 247 105 142 327 44 90 192 0.99
$50,000 to $54,999 ..................... 1 014......... 466 548 116 104 328 289 97 193 259 20 104 135 0.91$55,000 to $59,999 ..................... 1 030......... 435 595 112 129 354 254 83 171 341 29 129 184 1.07$60,000 to $64,999 ..................... 1 124......... 484 640 104 128 408 262 69 192 378 34 128 216 1.01$65,000 to $69,999 ..................... 960......... 431 529 102 111 316 221 68 152 308 33 111 164 0.96$70,000 to $74,999 ..................... 1 026......... 479 547 93 119 335 226 64 162 321 29 119 173 0.94$75,000 to $79,999 ..................... 799......... 329 469 93 58 318 211 70 141 258 22 58 177 1.01$80,000 to $84,999 ..................... 896......... 386 509 86 78 345 240 48 192 269 38 78 153 1.01$85,000 to $89,999 ..................... 749......... 398 351 65 65 222 155 52 103 196 13 65 119 0.79$90,000 to $94,999 ..................... 692......... 316 376 85 46 244 189 60 129 187 25 46 116 0.86$95,000 to $99,999 ..................... 579......... 292 287 51 41 195 135 29 106 152 22 41 89 0.83$100,000 and over ..................... 4 258......... 2 273 1 985 408 280 1 297 964 292 672 1 021 116 280 624 0.78
Median income dollars............................ 72 930 76 459 70 515 66 814 64 542 73 466 73 502 67 496 75 576 68 203 65 705 64 542 71 350 (X)Standard error dollars.......................... 519 892 620 1 462 1 335 849 979 2 030 1 095 966 2 172 1 335 1 016 (X)
Mean income dollars............................. 87 436 92 967 82 620 78 425 78 040 85 423 85 687 80 188 88 361 80 207 74 542 78 040 82 642 (X)Standard error dollars.......................... 854 1 441 982 1 938 2 606 1 244 1 550 2 456 1 966 1 260 3 030 2 606 1 544 (X)
Income per family member dollars................. 26 482 38 530 20 271 21 993 16 188 21 199 24 950 24 986 24 934 17 511 17 129 16 188 18 409 (X)Standard error dollars.......................... 332 783 325 769 681 428 620 1 081 758 374 1 016 681 497 (X)
22 INCOMEU.S. Census Bureau
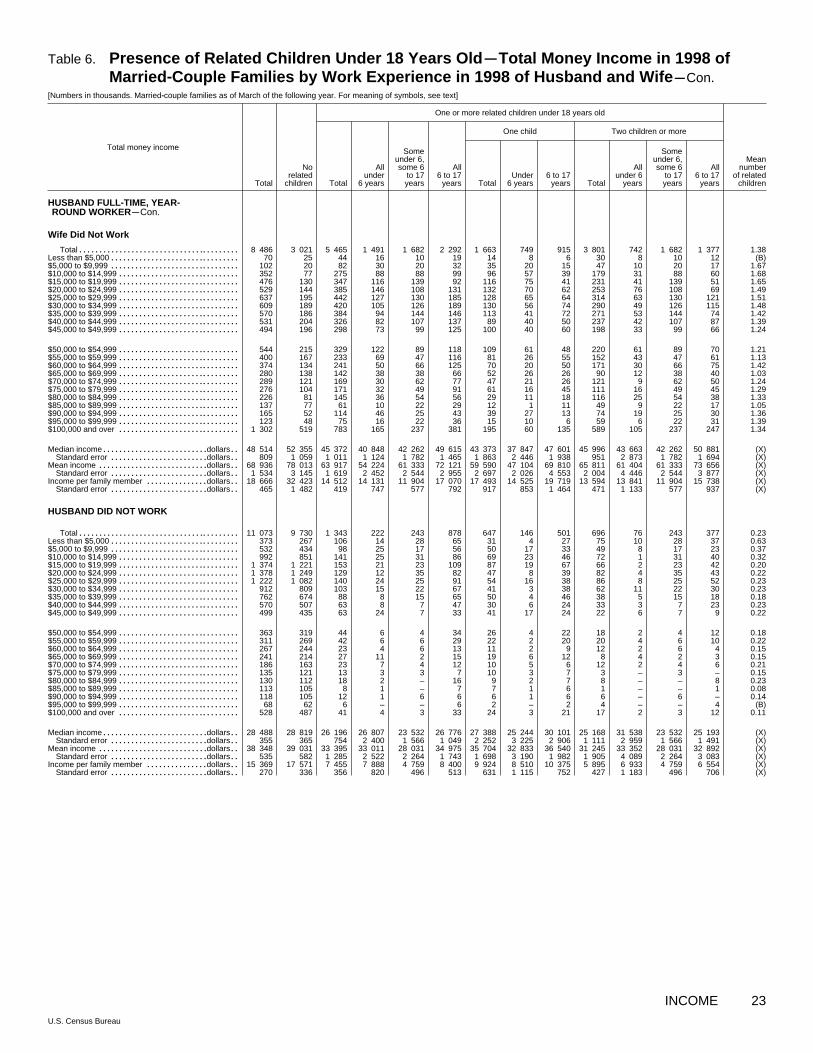
Table 6. Presence of Related Children Under 18 Years Old mTotal Money Income in 1998 ofMarried ~Couple Families by Work Experience in 1998 of Husband and Wife mCon.
[Numbers in thousands. Married~couple families as of March of the following year. For meaning of symbols, see text]
Total money income
One or more related children under 18 years old
One child Two children or more
Total
Norelated
children Total
Allunder
6 years
Someunder 6,some 6
to 17years
All6 to 17
years TotalUnder
6 years6 to 17
years Total
Allunder 6
years
Someunder 6,some 6
to 17years
All6 to 17
years
Meannumber
of relatedchildren
HUSBAND FULL ~TIME, YEAR~ROUND WORKERmCon.
Wife Did Not Work
Total............................... 8 486......... 3 021 5 465 1 491 1 682 2 292 1 663 749 915 3 801 742 1 682 1 377 1.38Less than $5,000 ....................... 70......... 25 44 16 10 19 14 8 6 30 8 10 12 (B)$5,000 to $9,999 ....................... 102......... 20 82 30 20 32 35 20 15 47 10 20 17 1.67$10,000 to $14,999 ..................... 352......... 77 275 88 88 99 96 57 39 179 31 88 60 1.68$15,000 to $19,999 ..................... 476......... 130 347 116 139 92 116 75 41 231 41 139 51 1.65$20,000 to $24,999 ..................... 529......... 144 385 146 108 131 132 70 62 253 76 108 69 1.49$25,000 to $29,999 ..................... 637......... 195 442 127 130 185 128 65 64 314 63 130 121 1.51$30,000 to $34,999 ..................... 609......... 189 420 105 126 189 130 56 74 290 49 126 115 1.48$35,000 to $39,999 ..................... 570......... 186 384 94 144 146 113 41 72 271 53 144 74 1.42$40,000 to $44,999 ..................... 531......... 204 326 82 107 137 89 40 50 237 42 107 87 1.39$45,000 to $49,999 ..................... 494......... 196 298 73 99 125 100 40 60 198 33 99 66 1.24
$50,000 to $54,999 ..................... 544......... 215 329 122 89 118 109 61 48 220 61 89 70 1.21$55,000 to $59,999 ..................... 400......... 167 233 69 47 116 81 26 55 152 43 47 61 1.13$60,000 to $64,999 ..................... 374......... 134 241 50 66 125 70 20 50 171 30 66 75 1.42$65,000 to $69,999 ..................... 280......... 138 142 38 38 66 52 26 26 90 12 38 40 1.03$70,000 to $74,999 ..................... 289......... 121 169 30 62 77 47 21 26 121 9 62 50 1.24$75,000 to $79,999 ..................... 276......... 104 171 32 49 91 61 16 45 111 16 49 45 1.29$80,000 to $84,999 ..................... 226......... 81 145 36 54 56 29 11 18 116 25 54 38 1.33$85,000 to $89,999 ..................... 137......... 77 61 10 22 29 12 1 11 49 9 22 17 1.05$90,000 to $94,999 ..................... 165......... 52 114 46 25 43 39 27 13 74 19 25 30 1.36$95,000 to $99,999 ..................... 123......... 48 75 16 22 36 15 10 6 59 6 22 31 1.39$100,000 and over ..................... 1 302......... 519 783 165 237 381 195 60 135 589 105 237 247 1.34
Median income dollars............................ 48 514 52 355 45 372 40 848 42 262 49 615 43 373 37 847 47 601 45 996 43 663 42 262 50 881 (X)Standard error dollars.......................... 809 1 059 1 011 1 124 1 782 1 465 1 863 2 446 1 938 951 2 873 1 782 1 694 (X)
Mean income dollars............................. 68 936 78 013 63 917 54 224 61 333 72 121 59 590 47 104 69 810 65 811 61 404 61 333 73 656 (X)Standard error dollars.......................... 1 534 3 145 1 619 2 452 2 544 2 955 2 697 2 026 4 553 2 004 4 446 2 544 3 877 (X)
Income per family member dollars................. 18 666 32 423 14 512 14 131 11 904 17 070 17 493 14 525 19 719 13 594 13 841 11 904 15 738 (X)Standard error dollars.......................... 465 1 482 419 747 577 792 917 853 1 464 471 1 133 577 937 (X)
HUSBAND DID NOT WORK
Total............................... 11 073......... 9 730 1 343 222 243 878 647 146 501 696 76 243 377 0.23Less than $5,000 ....................... 373......... 267 106 14 28 65 31 4 27 75 10 28 37 0.63$5,000 to $9,999 ....................... 532......... 434 98 25 17 56 50 17 33 49 8 17 23 0.37$10,000 to $14,999 ..................... 992......... 851 141 25 31 86 69 23 46 72 1 31 40 0.32$15,000 to $19,999 ..................... 1 374......... 1 221 153 21 23 109 87 19 67 66 2 23 42 0.20$20,000 to $24,999 ..................... 1 378......... 1 249 129 12 35 82 47 8 39 82 4 35 43 0.22$25,000 to $29,999 ..................... 1 222......... 1 082 140 24 25 91 54 16 38 86 8 25 52 0.23$30,000 to $34,999 ..................... 912......... 809 103 15 22 67 41 3 38 62 11 22 30 0.23$35,000 to $39,999 ..................... 762......... 674 88 8 15 65 50 4 46 38 5 15 18 0.18$40,000 to $44,999 ..................... 570......... 507 63 8 7 47 30 6 24 33 3 7 23 0.23$45,000 to $49,999 ..................... 499......... 435 63 24 7 33 41 17 24 22 6 7 9 0.22
$50,000 to $54,999 ..................... 363......... 319 44 6 4 34 26 4 22 18 2 4 12 0.18$55,000 to $59,999 ..................... 311......... 269 42 6 6 29 22 2 20 20 4 6 10 0.22$60,000 to $64,999 ..................... 267......... 244 23 4 6 13 11 2 9 12 2 6 4 0.15$65,000 to $69,999 ..................... 241......... 214 27 11 2 15 19 6 12 8 4 2 3 0.15$70,000 to $74,999 ..................... 186......... 163 23 7 4 12 10 5 6 12 2 4 6 0.21$75,000 to $79,999 ..................... 135......... 121 13 3 3 7 10 3 7 3 – 3 – 0.15$80,000 to $84,999 ..................... 130......... 112 18 2 – 16 9 2 7 8 – – 8 0.23$85,000 to $89,999 ..................... 113......... 105 8 1 – 7 7 1 6 1 – – 1 0.08$90,000 to $94,999 ..................... 118......... 105 12 1 6 6 6 1 6 6 – 6 – 0.14$95,000 to $99,999 ..................... 68......... 62 6 – – 6 2 – 2 4 – – 4 (B)$100,000 and over ..................... 528......... 487 41 4 3 33 24 3 21 17 2 3 12 0.11
Median income dollars............................ 28 488 28 819 26 196 26 807 23 532 26 776 27 388 25 244 30 101 25 168 31 538 23 532 25 193 (X)Standard error dollars.......................... 355 365 754 2 400 1 566 1 049 2 252 3 225 2 906 1 111 2 959 1 566 1 491 (X)
Mean income dollars............................. 38 348 39 031 33 395 33 011 28 031 34 975 35 704 32 833 36 540 31 245 33 352 28 031 32 892 (X)Standard error dollars.......................... 535 582 1 285 2 522 2 264 1 743 1 698 3 190 1 982 1 905 4 089 2 264 3 083 (X)
Income per family member dollars................. 15 369 17 571 7 455 7 888 4 759 8 400 9 924 8 510 10 375 5 895 6 933 4 759 6 554 (X)Standard error dollars.......................... 270 336 356 820 496 513 631 1 115 752 427 1 183 496 706 (X)
INCOME 23U.S. Census Bureau

Table 6. Presence of Related Children Under 18 Years Old mTotal Money Income in 1998 ofMarried ~Couple Families by Work Experience in 1998 of Husband and Wife mCon.
[Numbers in thousands. Married~couple families as of March of the following year. For meaning of symbols, see text]
Total money income
One or more related children under 18 years old
One child Two children or more
Total
Norelated
children Total
Allunder
6 years
Someunder 6,some 6
to 17years
All6 to 17
years TotalUnder
6 years6 to 17
years Total
Allunder 6
years
Someunder 6,some 6
to 17years
All6 to 17
years
Meannumber
of relatedchildren
HUSBAND DID NOT WORKmCon.
Wife Worked
Total............................... 3 019......... 2 230 789 148 133 507 393 94 299 396 54 133 208 0.47Less than $5,000 ....................... 27......... 16 11 – – 11 2 – 2 9 – – 9 (B)$5,000 to $9,999 ....................... 85......... 39 46 15 10 21 24 9 15 21 6 10 5 0.89$10,000 to $14,999 ..................... 157......... 93 63 16 12 35 37 16 21 26 – 12 14 0.86$15,000 to $19,999 ..................... 231......... 146 85 16 12 56 44 14 30 40 2 12 26 0.64$20,000 to $24,999 ..................... 260......... 177 82 10 22 50 28 6 23 54 4 22 27 0.71$25,000 to $29,999 ..................... 277......... 190 87 14 18 55 30 6 24 58 8 18 31 0.61$30,000 to $34,999 ..................... 291......... 214 77 12 14 51 25 1 23 52 11 14 27 0.55$35,000 to $39,999 ..................... 232......... 178 55 2 10 43 36 2 34 19 – 10 9 0.32$40,000 to $44,999 ..................... 197......... 154 43 5 6 32 18 2 16 25 3 6 17 0.40$45,000 to $49,999 ..................... 191......... 153 39 19 3 17 28 15 13 10 3 3 4 0.31
$50,000 to $54,999 ..................... 157......... 123 34 6 2 26 22 4 19 12 2 2 7 0.30$55,000 to $59,999 ..................... 136......... 99 37 6 6 25 21 2 18 16 4 6 6 0.44$60,000 to $64,999 ..................... 119......... 101 17 2 6 10 6 – 6 12 2 6 4 0.29$65,000 to $69,999 ..................... 105......... 86 19 9 2 9 10 4 6 8 4 2 3 0.28$70,000 to $74,999 ..................... 89......... 69 19 7 4 8 7 5 2 12 2 4 6 0.41$75,000 to $79,999 ..................... 56......... 48 8 1 – 7 8 1 7 – – – – (B)$80,000 to $84,999 ..................... 67......... 51 16 2 – 13 9 2 7 6 – – 6 (B)$85,000 to $89,999 ..................... 50......... 42 8 1 – 7 7 1 6 1 – – 1 (B)$90,000 to $94,999 ..................... 58......... 48 10 1 3 6 6 1 6 3 – 3 – (B)$95,000 to $99,999 ..................... 35......... 32 2 – – 2 2 – 2 – – – – (B)$100,000 and over ..................... 199......... 167 31 4 3 23 21 3 18 11 2 3 6 0.22
Median income dollars............................ 38 818 41 883 31 098 31 031 26 947 32 361 35 727 25 898 36 353 28 875 (B) 26 947 28 204 (X)Standard error dollars.......................... 947 1 124 1 181 5 118 2 439 1 655 2 161 10 139 1 837 1 494 (B) 2 439 1 878 (X)
Mean income dollars............................. 48 402 52 000 38 228 37 774 34 080 39 451 41 241 36 364 42 768 35 236 (B) 34 080 34 677 (X)Standard error dollars.......................... 1 207 1 537 1 432 3 184 3 135 1 840 2 144 4 284 2 461 1 874 (B) 3 135 2 682 (X)
Income per family member dollars................. 16 899 21 895 9 000 9 260 6 313 9 876 11 817 9 845 12 483 7 047 (B) 6 313 7 206 (X)Standard error dollars.......................... 544 851 475 1 119 809 653 890 1 591 1 062 524 (B) 809 761 (X)
Wife Full ~Time, Year ~RoundWorker
Total............................... 1 666......... 1 194 472 83 71 317 230 52 178 242 31 71 139 0.49Less than $5,000 ....................... 2......... 2 – – – – – – – – – – – (B)$5,000 to $9,999 ....................... 13......... 2 11 6 2 3 4 3 1 7 3 2 2 (B)$10,000 to $14,999 ..................... 47......... 26 20 7 3 11 16 7 8 5 – 3 2 (B)$15,000 to $19,999 ..................... 104......... 54 50 9 9 32 24 9 16 26 1 9 16 0.77$20,000 to $24,999 ..................... 123......... 76 47 5 6 36 14 1 13 33 4 6 23 0.83$25,000 to $29,999 ..................... 142......... 91 51 6 11 34 18 – 18 34 6 11 16 0.63$30,000 to $34,999 ..................... 159......... 112 47 4 5 39 16 1 15 31 2 5 24 0.56$35,000 to $39,999 ..................... 152......... 116 36 – 5 31 23 – 23 13 – 5 8 0.32$40,000 to $44,999 ..................... 144......... 109 35 5 6 25 13 2 11 22 3 6 13 0.47$45,000 to $49,999 ..................... 123......... 96 27 12 3 13 17 9 9 10 3 3 4 0.37
$50,000 to $54,999 ..................... 94......... 69 26 4 – 22 18 4 14 8 – – 7 0.36$55,000 to $59,999 ..................... 73......... 44 29 4 4 21 17 2 15 12 1 4 6 (B)$60,000 to $64,999 ..................... 82......... 67 15 2 6 7 4 – 4 11 2 6 3 0.38$65,000 to $69,999 ..................... 72......... 55 17 9 2 7 9 4 4 8 4 2 3 (B)$70,000 to $74,999 ..................... 50......... 37 13 5 4 4 5 5 – 8 – 4 4 (B)$75,000 to $79,999 ..................... 25......... 21 4 1 – 3 4 1 3 – – – – (B)$80,000 to $84,999 ..................... 45......... 34 11 2 – 8 6 2 4 4 – – 4 (B)$85,000 to $89,999 ..................... 35......... 27 8 1 – 7 7 1 6 1 – – 1 (B)$90,000 to $94,999 ..................... 45......... 36 10 1 3 6 6 1 6 3 – 3 – (B)$95,000 to $99,999 ..................... 24......... 24 – – – – – – – – – – – (B)$100,000 and over ..................... 111......... 97 15 3 3 8 8 1 6 7 2 3 2 0.22
Median income dollars............................ 43 080 45 437 36 102 45 260 (B) 35 485 40 107 (B) 38 539 32 030 (B) (B) 31 686 (X)Standard error dollars.......................... 1 076 1 310 2 208 8 548 (B) 2 031 3 5(B) (B) 2 982 1 877 (B) (B) 1 746 (X)
Mean income dollars............................. 52 791 56 976 42 192 43 639 (B) 41 594 44 875 (B) 45 011 39 639 (B) (B) 37 227 (X)Standard error dollars.......................... 1 820 2 420 1 740 4 456 (B) 2 019 2 588 (B) 2 855 2 311 (B) (B) 2 700 (X)
Income per family member dollars................. 18 074 23 710 9 970 10 143 (B) 10 274 12 663 (B) 13 093 8 111 (B) (B) 7 709 (X)Standard error dollars.......................... 796 1 297 633 1 557 (B) 787 1 159 (B) 1 351 718 (B) (B) 878 (X)
24 INCOMEU.S. Census Bureau

Table 6. Presence of Related Children Under 18 Years Old mTotal Money Income in 1998 ofMarried ~Couple Families by Work Experience in 1998 of Husband and Wife mCon.
[Numbers in thousands. Married~couple families as of March of the following year. For meaning of symbols, see text]
Total money income
One or more related children under 18 years old
One child Two children or more
Total
Norelated
children Total
Allunder
6 years
Someunder 6,some 6
to 17years
All6 to 17
years TotalUnder
6 years6 to 17
years Total
Allunder 6
years
Someunder 6,some 6
to 17years
All6 to 17
years
Meannumber
of relatedchildren
HUSBAND DID NOT WORKmCon.
Wife Did Not Work
Total............................... 8 055......... 7 500 554 74 110 371 254 52 202 300 22 110 169 0.14Less than $5,000 ....................... 346......... 251 95 14 28 54 29 4 25 66 10 28 29 0.62$5,000 to $9,999 ....................... 447......... 394 53 10 7 35 25 8 17 27 2 7 18 0.27$10,000 to $14,999 ..................... 835......... 757 78 9 18 50 32 8 24 46 1 18 26 0.21$15,000 to $19,999 ..................... 1 143......... 1 075 68 5 10 53 42 5 38 26 – 10 16 0.11$20,000 to $24,999 ..................... 1 118......... 1 071 47 2 12 32 18 2 16 28 – 12 16 0.10$25,000 to $29,999 ..................... 945......... 892 53 10 7 35 24 10 14 28 – 7 21 0.11$30,000 to $34,999 ..................... 621......... 594 27 2 8 17 16 2 14 10 – 8 3 0.07$35,000 to $39,999 ..................... 529......... 496 33 6 5 22 14 1 12 20 5 5 10 0.11$40,000 to $44,999 ..................... 373......... 352 20 4 1 15 12 4 9 8 – 1 7 0.13$45,000 to $49,999 ..................... 307......... 283 25 5 4 16 13 2 11 12 3 4 5 0.17
$50,000 to $54,999 ..................... 206......... 196 10 – 2 8 4 – 4 6 – 2 4 0.09$55,000 to $59,999 ..................... 175......... 170 5 – – 5 1 – 1 3 – – 3 0.05$60,000 to $64,999 ..................... 148......... 143 6 2 – 3 6 2 3 – – – – 0.04$65,000 to $69,999 ..................... 136......... 128 8 2 – 6 8 2 6 – – – – 0.05$70,000 to $74,999 ..................... 97......... 94 3 – – 3 3 – 3 – – – – 0.04$75,000 to $79,999 ..................... 78......... 73 5 2 3 – 2 2 – 3 – 3 – 0.14$80,000 to $84,999 ..................... 63......... 61 2 – – 2 – – – 2 – – 2 (B)$85,000 to $89,999 ..................... 63......... 63 – – – – – – – – – – – (B)$90,000 to $94,999 ..................... 60......... 58 3 – 3 – – – – 3 – 3 – (B)$95,000 to $99,999 ..................... 34......... 30 4 – – 4 – – – 4 – – 4 (B)$100,000 and over ..................... 329......... 320 9 – – 9 3 – 3 6 – – 6 0.04
Median income dollars............................ 25 657 26 029 19 116 (B) 15 562 19 570 19 903 (B) 19 738 17 312 (B) 15 562 19 112 (X)Standard error dollars.......................... 320 331 933 (B) 2 612 1 089 2 121 (B) 1 823 2 364 (B) 2 612 2 525 (X)
Mean income dollars............................. 34 580 35 176 26 519 (B) 20 667 28 857 27 155 (B) 27 326 25 980 (B) 20 667 30 693 (X)Standard error dollars.......................... 568 584 2 284 (B) 2 934 3 209 2 575 (B) 3 052 3 612 (B) 2 934 6 025 (X)
Income per family member dollars................. 14 672 16 168 5 514 (B) 3 185 6 566 7 214 (B) 7 458 4 561 (B) 3 185 5 822 (X)Standard error dollars.......................... 307 350 533 (B) 550 812 837 (B) 1 005 689 (B) 550 1 233 (X)
INCOME 25U.S. Census Bureau

Table 7. Median Income of People by Selected Characteristics: 1998, 1997, and 1996[People 15 years old and over as of March of the following year. An asterisk (*) preceding percent change indicates statistically significant change at the 90~percent confidence level. For meaning ofsymbols, see text]
Characteristic
199619971998
Median income Median income Median income
Numberwith
income(1,000)
Value(dollars)
Standarderror
(dollars)
Numberwith
income(1,000)
Value(dollars)
Standarderror
(dollars)
Numberwith
income(1,000)
Value(dollars)
Standarderror
(dollars)
Percentchangein real
median income
(1997~1998)
TOTAL
Male
All males 94 948........................ 26 492 128 94 168 25 212 123 93 439 23 834 157 * 3.5
Region
Northeast 18 024.............................. 27 521 373 17 953 26 378 300 18 060 25 282 264 * 2.7Midwest 22 551............................... 27 668 330 22 086 26 285 245 21 908 25 406 243 * 3.6South 33 002................................. 25 297 212 32 950 23 896 271 32 464 22 234 187 * 4.2West 21 370.................................. 26 358 324 21 179 24 832 386 21 006 23 395 366 * 4.5
Race and Hispanic Origin
White 80 896................................. 27 646 206 80 400 26 115 135 80 041 24 949 156 * 4.2Black 9 776.................................. 19 321 451 9 671 18 096 477 9 410 16 491 329 * 5.1Hispanic origin1 9 617......................... 17 257 238 9 585 16 216 243 9 305 15 437 250 * 4.8
Relationship to FamilyHouseholder
In families 75 182.............................. 26 985 149 74 887 25 819 143 74 453 24 513 182 * 2.9Householder 44 415........................ 33 517 339 45 172 31 844 167 45 760 30 853 162 * 3.6Spouse of householder 13 504............... 32 885 498 12 203 31 177 291 10 816 29 672 509 * 3.9Other relative of householder 17 263.......... 9 665 191 17 512 9 284 175 17 876 8 392 185 2.5
In unrelated subfamilies 297................. 11 091 683 306 17 267 2 103 341 12 650 1 254 * –36.8Unrelated individuals 19 469.................... 25 081 271 18 975 22 820 308 18 646 21 975 228 * 8.2
Age
Under 65 years 81 447......................... 28 355 226 80 860 26 629 129 80 265 25 548 130 * 4.815 to 24 years 14 079....................... 8 190 222 13 905 7 468 154 14 016 6 960 127 * 8.025 to 34 years 18 330....................... 28 117 379 18 936 25 996 179 19 354 25 179 194 * 6.535 to 44 years 21 539....................... 35 177 287 21 456 32 851 444 21 181 32 167 216 * 5.445 to 54 years 16 821....................... 38 922 587 16 203 37 624 436 15 748 36 232 312 1.955 to 64 years 10 678....................... 32 776 627 10 361 31 157 393 9 966 29 526 583 * 3.6
65 years and over 13 501...................... 18 166 224 13 308 17 768 228 13 173 16 684 221 0.765 to 74 years 7 902....................... 19 734 329 7 843 19 651 311 7 947 18 605 338 –1.175 years and over 5 599................... 16 479 289 5 465 15 407 324 5 227 14 494 192 * 5.3
Occupation Group of Longest Job 2
(Earnings)
Total with earnings3 77 295............... 28 755 233 76 694 26 843 122 76 121 25 785 123 * 5.5Executive, administrators, and managerial 10 818. 48 902 1 129 10 448 45 970 440 10 396 42 681 742 * 4.7Professional specialty 9 793................... 46 981 545 9 639 44 401 871 9 118 42 309 467 * 4.2Technical and related support 2 132............ 36 903 709 2 074 34 751 962 2 056 32 608 1 065 4.6Sales 8 788.................................. 30 332 451 8 566 27 550 660 8 324 27 493 569 * 8.4Administrative support, including clerical 4 236... 24 450 487 4 312 23 126 626 4 294 22 450 542 4.1
Precision production, craft, and repair 14 131..... 28 860 409 14 176 27 429 299 13 993 26 296 229 * 3.6Machine operators, assemblers, andinspectors 5 170............................ 25 495 311 5 249 23 991 633 5 327 22 096 283 * 4.6
Transportation and material moving 5 100....... 25 986 328 5 216 23 739 572 5 234 23 692 528 * 7.8Handlers, equipment cleaners, helpers,and laborers 5 049.......................... 13 915 629 4 806 12 469 423 5 055 10 908 310 * 9.9
Service workers 8 168........................ 14 205 346 8 481 13 145 415 8 340 12 569 308 * 6.4Private household 53.................... (B) (B) 37 (B) (B) 34 (B) (B) (X)Service workers, except privatehousehold 8 115......................... 14 268 349 8 444 13 207 414 8 305 12 612 318 * 6.4
Farming, forestry, and fishing 3 184............. 12 045 323 3 013 11 645 322 3 284 11 355 303 1.9
Educational Attainment
Total, 25 years and over 80 869........... 30 654 121 80 263 28 919 215 79 423 27 248 123 * 4.4Less than 9th grade 5 641..................... 12 571 235 5 839 12 157 163 6 139 12 174 176 1.89th to 12th grade (no diploma) 7 366............ 17 462 313 7 601 16 818 265 7 671 16 058 255 2.2High school graduate (includesequivalency) 25 636.......................... 26 542 173 25 777 25 453 171 25 510 24 814 228 * 2.7
Some college, no degree 13 935................ 31 627 259 13 892 30 536 232 13 756 29 160 398 * 2.0Associate degree 5 766....................... 35 962 412 5 591 32 930 646 5 210 33 065 645 * 7.5Bachelor’s degree or more 22 525............... 50 272 330 21 563 47 126 348 21 136 44 161 506 * 5.0
Bachelor’s degree 14 614................... 45 749 460 13 900 41 949 347 13 510 39 624 521 * 7.4Master’s degree 4 772..................... 55 784 977 4 583 52 530 1 093 4 709 50 003 1 013 * 4.6Professional degree 1 695.................. 76 362 3 120 1 741 72 274 4 086 1 702 71 869 2 643 4.0Doctorate degree 1 443.................... 65 319 1 678 1 338 68 643 2 222 1 215 62 255 1 638 * –6.3
See footnotes at end of table.
26 INCOMEU.S. Census Bureau
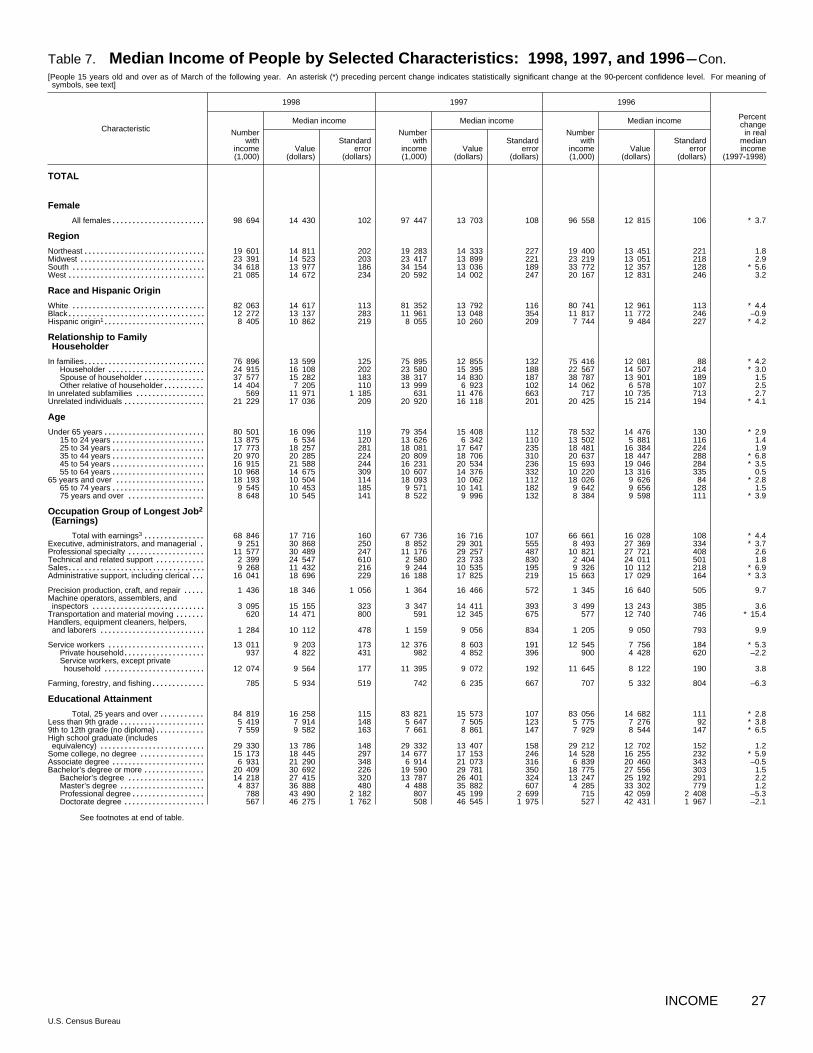
Table 7. Median Income of People by Selected Characteristics: 1998, 1997, and 1996 mCon.[People 15 years old and over as of March of the following year. An asterisk (*) preceding percent change indicates statistically significant change at the 90~percent confidence level. For meaning ofsymbols, see text]
Characteristic
199619971998
Median income Median income Median income
Numberwith
income(1,000)
Value(dollars)
Standarderror
(dollars)
Numberwith
income(1,000)
Value(dollars)
Standarderror
(dollars)
Numberwith
income(1,000)
Value(dollars)
Standarderror
(dollars)
Percentchangein real
median income
(1997~1998)
TOTAL
Female
All females 98 694....................... 14 430 102 97 447 13 703 108 96 558 12 815 106 * 3.7
Region
Northeast 19 601.............................. 14 811 202 19 283 14 333 227 19 400 13 451 221 1.8Midwest 23 391............................... 14 523 203 23 417 13 899 221 23 219 13 051 218 2.9South 34 618................................. 13 977 186 34 154 13 036 189 33 772 12 357 128 * 5.6West 21 085.................................. 14 672 234 20 592 14 002 247 20 167 12 831 246 3.2
Race and Hispanic Origin
White 82 063................................. 14 617 113 81 352 13 792 116 80 741 12 961 113 * 4.4Black 12 272.................................. 13 137 283 11 961 13 048 354 11 817 11 772 246 –0.9Hispanic origin1 8 405......................... 10 862 219 8 055 10 260 209 7 744 9 484 227 * 4.2
Relationship to FamilyHouseholder
In families 76 896.............................. 13 599 125 75 895 12 855 132 75 416 12 081 88 * 4.2Householder 24 915........................ 16 108 202 23 580 15 395 188 22 567 14 507 214 * 3.0Spouse of householder 37 577............... 15 282 183 38 317 14 830 187 38 787 13 901 189 1.5Other relative of householder 14 404.......... 7 205 110 13 999 6 923 102 14 062 6 578 107 2.5
In unrelated subfamilies 569................. 11 971 1 185 631 11 476 663 717 10 735 713 2.7Unrelated individuals 21 229.................... 17 036 209 20 920 16 118 201 20 425 15 214 194 * 4.1
Age
Under 65 years 80 501......................... 16 096 119 79 354 15 408 112 78 532 14 476 130 * 2.915 to 24 years 13 875....................... 6 534 120 13 626 6 342 110 13 502 5 881 116 1.425 to 34 years 17 773....................... 18 257 281 18 081 17 647 235 18 481 16 384 224 1.935 to 44 years 20 970....................... 20 285 224 20 809 18 706 310 20 637 18 447 288 * 6.845 to 54 years 16 915....................... 21 588 244 16 231 20 534 236 15 693 19 046 284 * 3.555 to 64 years 10 968....................... 14 675 309 10 607 14 376 332 10 220 13 316 335 0.5
65 years and over 18 193...................... 10 504 114 18 093 10 062 112 18 026 9 626 84 * 2.865 to 74 years 9 545....................... 10 453 185 9 571 10 141 182 9 642 9 656 128 1.575 years and over 8 648................... 10 545 141 8 522 9 996 132 8 384 9 598 111 * 3.9
Occupation Group of Longest Job 2
(Earnings)
Total with earnings3 68 846............... 17 716 160 67 736 16 716 107 66 661 16 028 108 * 4.4Executive, administrators, and managerial 9 251. 30 868 250 8 852 29 301 555 8 493 27 369 334 * 3.7Professional specialty 11 577................... 30 489 247 11 176 29 257 487 10 821 27 721 408 2.6Technical and related support 2 399............ 24 547 610 2 580 23 733 830 2 404 24 011 501 1.8Sales 9 268.................................. 11 432 216 9 244 10 535 195 9 326 10 112 218 * 6.9Administrative support, including clerical 16 041... 18 696 229 16 188 17 825 219 15 663 17 029 164 * 3.3
Precision production, craft, and repair 1 436..... 18 346 1 056 1 364 16 466 572 1 345 16 640 505 9.7Machine operators, assemblers, andinspectors 3 095............................ 15 155 323 3 347 14 411 393 3 499 13 243 385 3.6
Transportation and material moving 620....... 14 471 800 591 12 345 675 577 12 740 746 * 15.4Handlers, equipment cleaners, helpers,and laborers 1 284.......................... 10 112 478 1 159 9 056 834 1 205 9 050 793 9.9
Service workers 13 011........................ 9 203 173 12 376 8 603 191 12 545 7 756 184 * 5.3Private household 937.................... 4 822 431 982 4 852 396 900 4 428 620 –2.2Service workers, except privatehousehold 12 074......................... 9 564 177 11 395 9 072 192 11 645 8 122 190 3.8
Farming, forestry, and fishing 785............. 5 934 519 742 6 235 667 707 5 332 804 –6.3
Educational Attainment
Total, 25 years and over 84 819........... 16 258 115 83 821 15 573 107 83 056 14 682 111 * 2.8Less than 9th grade 5 419..................... 7 914 148 5 647 7 505 123 5 775 7 276 92 * 3.89th to 12th grade (no diploma) 7 559............ 9 582 163 7 661 8 861 147 7 929 8 544 147 * 6.5High school graduate (includesequivalency) 29 330.......................... 13 786 148 29 332 13 407 158 29 212 12 702 152 1.2
Some college, no degree 15 173................ 18 445 297 14 677 17 153 246 14 528 16 255 232 * 5.9Associate degree 6 931....................... 21 290 348 6 914 21 073 316 6 839 20 460 343 –0.5Bachelor’s degree or more 20 409............... 30 692 226 19 590 29 781 350 18 775 27 556 303 1.5
Bachelor’s degree 14 218................... 27 415 320 13 787 26 401 324 13 247 25 192 291 2.2Master’s degree 4 837..................... 36 888 480 4 488 35 882 607 4 285 33 302 779 1.2Professional degree 788.................. 43 490 2 182 807 45 199 2 699 715 42 059 2 408 –5.3Doctorate degree 567.................... 46 275 1 762 508 46 545 1 975 527 42 431 1 967 –2.1
See footnotes at end of table.
INCOME 27U.S. Census Bureau

Table 7. Median Income of People by Selected Characteristics: 1998, 1997, and 1996 mCon.[People 15 years old and over as of March of the following year. An asterisk (*) preceding percent change indicates statistically significant change at the 90~percent confidence level. For meaning ofsymbols, see text]
Characteristic
199619971998
Median income Median income Median income
Numberwith
income(1,000)
Value(dollars)
Standarderror
(dollars)
Numberwith
income(1,000)
Value(dollars)
Standarderror
(dollars)
Numberwith
income(1,000)
Value(dollars)
Standarderror
(dollars)
Percentchangein real
median income
(1997~1998)
FULL ~TIME, YEAR~ROUNDWORKERS
Male
All males 56 951........................ 36 252 144 54 914 35 248 150 53 792 33 538 267 * 1.3
Region
Northeast 10 605.............................. 38 694 549 10 279 37 897 531 10 127 36 296 330 0.5Midwest 13 596............................... 37 205 291 12 953 36 052 305 12 967 35 053 373 * 1.6South 20 060................................. 34 326 469 19 622 31 929 193 18 849 31 259 218 * 5.9West 12 691.................................. 36 252 314 12 060 35 701 361 11 849 34 319 715 –
Race and Hispanic Origin
White 48 908................................. 37 196 160 47 230 36 118 164 46 661 34 741 281 * 1.4Black 5 400.................................. 27 472 483 5 172 26 897 310 4 799 27 136 372 0.6Hispanic origin1 6 147......................... 22 505 413 5 976 21 799 267 5 540 21 265 312 1.7
Relationship to FamilyHouseholder
In families 45 128.............................. 37 229 169 44 027 36 339 171 43 317 35 135 184 0.9Householder 29 313........................ 41 197 187 29 635 40 087 223 29 988 37 830 333 * 1.2Spouse of householder 9 484............... 39 846 552 8 312 38 487 690 7 283 37 076 412 1.9Other relative of householder 6 331.......... 21 416 209 6 080 20 442 262 6 046 19 731 332 * 3.2
In unrelated subfamilies 174................. 14 997 1 712 197 22 812 1 781 186 20 379 1 581 * –35.3Unrelated individuals 11 649.................... 32 151 233 10 690 30 886 220 10 289 29 968 387 * 2.5
Age
Under 65 years 55 912......................... 36 170 144 53 919 35 126 162 52 730 33 321 268 * 1.415 to 24 years 4 571....................... 19 510 334 4 107 17 651 352 4 028 17 410 281 * 8.825 to 34 years 14 353....................... 31 600 190 14 374 30 145 216 14 449 28 962 356 * 3.235 to 44 years 17 510....................... 39 226 509 16 997 37 413 311 16 577 36 957 236 * 3.245 to 54 years 13 286....................... 43 482 612 12 577 42 370 394 12 234 41 481 310 1.155 to 64 years 6 192....................... 44 095 1 025 5 863 41 096 426 5 441 39 563 669 * 5.7
65 years and over 1 039...................... 43 157 1 915 995 45 648 2 391 1 063 42 836 2 086 –6.965 to 74 years 877....................... 43 060 1 997 794 43 937 2 516 883 43 359 2 212 –3.575 years and over 162................... 43 750 7 911 201 49 672 2 753 179 40 833 6 764 –13.3
Occupation Group of Longest Job 2
(Earnings)
Total with earnings3 56 951............... 35 345 133 54 909 33 674 320 53 787 32 144 114 * 3.4Executive, administrators, and managerial 9 438. 51 351 290 9 046 50 149 604 9 066 46 654 485 0.8Professional specialty 7 768................... 51 654 297 7 516 50 402 367 7 085 50 012 748 0.9Technical and related support 1 737............ 40 546 529 1 591 37 704 1 094 1 638 36 775 575 * 5.9Sales 6 397.................................. 37 248 453 6 108 35 655 396 5 997 35 104 701 * 2.9Administrative support, including clerical 3 004... 31 153 339 3 035 29 442 713 2 875 30 381 518 * 4.2
Precision production, craft, and repair 11 064..... 31 631 207 10 629 31 496 188 10 278 30 421 222 –1.1Machine operators, assemblers, andinspectors 3 953............................ 27 890 581 4 026 26 969 292 4 032 25 625 322 1.8
Transportation and material moving 3 671....... 30 422 351 3 641 28 227 780 3 634 27 723 589 * 6.1Handlers, equipment cleaners, helpers,and laborers 2 633.......................... 21 871 362 2 304 21 475 487 2 231 20 793 358 0.3
Service workers 4 881........................ 22 515 414 4 703 22 335 434 4 654 21 028 322 –0.7Private household 9.................... (B) (B) 7 (B) (B) 9 (B) (B) (X)Service workers, except privatehousehold 4 872......................... 22 557 421 4 696 22 359 445 4 645 21 036 322 –0.7
Farming, forestry, and fishing 1 739............. 18 855 1 115 1 651 17 394 720 1 672 18 127 791 6.7
Educational Attainment
Total, 25 years and over 52 381........... 37 906 291 50 807 36 678 148 49 764 35 622 150 * 1.8Less than 9th grade 1 870..................... 19 380 599 1 914 19 291 629 2 041 17 962 594 –1.19th to 12th grade (no diploma) 3 613............ 23 958 546 3 548 24 726 465 3 441 22 717 413 * –4.6High school graduate (includesequivalency) 16 442.......................... 31 477 169 16 225 31 215 171 15 840 30 709 183 –0.7
Some college, no degree 9 375................ 36 934 291 9 170 35 945 293 9 173 34 845 456 1.2Associate degree 4 347....................... 40 274 539 4 086 38 022 774 3 931 37 131 434 * 4.3Bachelor’s degree or more 16 733............... 56 524 421 15 864 53 450 755 15 339 51 436 303 * 4.1
Bachelor’s degree 11 058................... 51 405 348 10 349 48 616 850 9 898 45 846 458 * 4.1Master’s degree 3 414..................... 62 244 847 3 228 61 690 771 3 272 60 508 945 –0.6Professional degree 1 264.................. 94 737 4 039 1 321 85 011 4 253 1 277 85 963 3 317 9.7Doctorate degree 998.................... 75 078 2 506 966 76 234 3 611 893 71 227 3 362 –3.0
See footnotes at end of table.
28 INCOMEU.S. Census Bureau

Table 7. Median Income of People by Selected Characteristics: 1998, 1997, and 1996 mCon.[People 15 years old and over as of March of the following year. An asterisk (*) preceding percent change indicates statistically significant change at the 90~percent confidence level. For meaning ofsymbols, see text]
Characteristic
199619971998
Median income Median income Median income
Numberwith
income(1,000)
Value(dollars)
Standarderror
(dollars)
Numberwith
income(1,000)
Value(dollars)
Standarderror
(dollars)
Numberwith
income(1,000)
Value(dollars)
Standarderror
(dollars)
Percentchangein real
median income
(1997~1998)
FULL ~TIME, YEAR~ROUNDWORKERS
Female
All females 38 810....................... 26 855 122 37 696 26 029 131 36 445 24 935 149 * 1.6
Region
Northeast 7 500.............................. 29 083 439 7 218 29 158 412 6 988 27 103 271 –1.8Midwest 9 093............................... 26 741 240 8 865 25 800 258 8 752 24 599 308 * 2.1South 14 017................................. 25 629 202 13 931 23 963 283 13 588 22 946 286 * 5.3West 8 199.................................. 28 123 502 7 682 27 295 384 7 117 26 132 316 1.5
Race and Hispanic Origin
White 31 497................................. 27 304 133 30 598 26 470 145 29 607 25 358 146 * 1.6Black 5 459.................................. 23 864 494 5 313 22 764 404 5 098 21 990 272 3.2Hispanic origin1 3 478......................... 19 817 473 3 143 19 676 534 2 952 19 272 546 –0.8
Relationship to FamilyHouseholder
In families 30 412.............................. 26 302 140 29 730 25 533 147 28 846 24 438 171 * 1.4Householder 11 157........................ 26 731 244 10 369 26 208 256 9 808 25 281 252 0.4Spouse of householder 15 451............... 27 457 239 15 767 26 549 200 15 640 25 442 192 * 1.8Other relative of householder 3 805.......... 20 282 315 3 594 19 707 393 3 399 18 663 354 1.3
In unrelated subfamilies 270................. 22 244 1 276 223 21 959 1 034 245 20 291 1 293 –0.3Unrelated individuals 8 127.................... 29 737 384 7 743 28 650 533 7 353 26 686 279 2.2
Age
Under 65 years 38 230......................... 26 838 123 37 078 25 978 132 35 885 24 899 152 * 1.715 to 24 years 3 182....................... 17 348 257 3 072 16 290 232 2 895 15 699 255 * 4.925 to 34 years 9 663....................... 26 301 215 9 681 25 144 227 9 481 23 838 269 * 3.035 to 44 years 11 587....................... 28 585 370 11 126 27 524 289 11 094 26 787 241 2.345 to 54 years 9 684....................... 30 027 334 9 191 29 364 449 8 709 27 154 279 0.755 to 64 years 4 113....................... 27 783 612 4 008 26 661 448 3 706 25 080 431 2.6
65 years and over 580...................... 28 326 1 444 618 30 359 1 884 559 27 070 1 393 –8.165 to 74 years 486....................... 27 438 1 493 517 31 426 2 150 489 26 829 1 408 * –14.075 years and over 94................... 33 716 3 792 101 26 917 2 958 71 (B) (B) (X)
Occupation Group of Longest Job 2
(Earnings)
Total with earnings3 38 785............... 25 862 118 37 683 24 973 155 36 430 23 710 166 * 2.0Executive, administrators, and managerial 7 125. 34 755 556 6 611 33 037 581 6 480 31 208 252 * 3.6Professional specialty 6 922................... 36 261 271 6 679 35 417 294 6 230 34 537 535 0.8Technical and related support 1 612............ 27 849 778 1 735 27 576 754 1 569 27 239 536 –0.6Sales 4 182.................................. 23 197 606 4 077 21 392 335 3 988 21 350 327 * 6.8Administrative support, including clerical 9 697... 23 835 223 9 790 22 474 175 9 435 21 758 141 * 4.4
Precision production, craft, and repair 927..... 23 907 1 003 865 21 649 664 851 21 165 470 * 8.7Machine operators, assemblers, andinspectors 1 955............................ 19 015 383 2 090 17 683 397 2 139 17 456 373 * 5.9
Transportation and material moving 268....... 21 449 879 247 21 024 914 235 17 681 2 105 0.5Handlers, equipment cleaners, helpers,and laborers 544.......................... 16 550 522 465 15 774 502 448 16 856 506 3.3
Service workers 5 262........................ 15 647 206 4 807 15 964 190 4 754 14 976 232 * –3.5Private household 245.................... 11 840 541 225 12 648 702 257 11 365 442 –7.8Service workers, except privatehousehold 5 017......................... 15 801 213 4 583 16 120 191 4 497 15 225 226 * –3.5
Farming, forestry, and fishing 235............. 15 865 1 269 223 17 301 1 254 233 17 251 1 955 –9.7
Educational Attainment
Total, 25 years and over 35 628........... 27 956 199 34 624 26 974 134 33 549 25 808 131 * 2.1Less than 9th grade 814..................... 14 467 429 791 14 161 491 750 14 414 559 0.69th to 12th grade (no diploma) 1 878............ 16 482 321 1 765 16 697 335 1 751 16 953 333 –2.8High school graduate (includesequivalency) 11 613.......................... 22 780 253 11 475 22 067 148 11 363 21 175 143 1.6
Some college, no degree 7 070................ 27 420 271 6 628 26 335 291 6 582 25 167 267 * 2.5Associate degree 3 527....................... 29 924 513 3 538 28 812 660 3 468 28 083 526 2.3Bachelor’s degree or more 10 725............... 39 786 408 10 427 38 038 481 9 636 36 461 296 * 3.0
Bachelor’s degree 7 288................... 36 559 305 7 173 35 379 295 6 689 33 525 437 * 1.8Master’s degree 2 639..................... 45 283 760 2 448 44 949 836 2 213 41 901 564 –0.8Professional degree 468.................. 57 565 1 705 488 61 051 4 737 413 57 624 3 635 –7.2Doctorate degree 329.................... 57 796 1 880 318 53 038 3 626 322 56 267 3 300 7.3
1Hispanics may be of any race.2Amounts shown are median earnings.3Includes people whose longest job was in the Armed Forces.
INCOME 29U.S. Census Bureau

Table 8. Selected Characteristics of People mTotal Money Income in 1998 of People 15 YearsOld and Over by Work Experience in 1998 and Sex
[Numbers in thousands. People 15 years old and over as of March of the following year. For meaning of symbols, see text]
Characteristic
With income
Median income Mean income
Total Total
$1 to$4,999or loss
$5,000to
$9,999
$10,000to
$14,999
$15,000to
$24,999
$25,000to
$34,999
$35,000to
$49,999
$50,000to
$74,999$75,000and over
Value(dollars)
Standarderror
(dollars)Value
(dollars)
Standarderror
(dollars)
MALE
Total
All males 102 048.................. 94 948 8 360 9 142 9 548 17 620 14 718 15 234 11 763 8 562 26 492 128 36 315 257
Type of Residence
Inside metropolitan areas 82 144....... 76 275 6 483 6 842 7 410 13 730 11 513 12 413 10 076 7 809 27 532 201 38 301 301Inside central cities 29 841.......... 27 115 2 431 3 067 3 096 5 477 4 045 3 913 2 819 2 267 23 851 289 34 026 448
1 million or more 19 274.......... 17 405 1 518 2 004 2 054 3 525 2 498 2 440 1 823 1 543 23 662 347 34 423 562Under 1 million 10 567............ 9 710 913 1 063 1 043 1 952 1 547 1 473 996 724 24 228 517 33 315 739
Outside central cities 52 303......... 49 160 4 052 3 776 4 313 8 253 7 468 8 500 7 257 5 541 30 503 164 40 659 3961 million or more 35 879.......... 33 763 2 807 2 406 2 678 5 410 4 935 5 836 5 310 4 381 31 701 202 43 004 498Under 1 million 16 424............ 15 397 1 245 1 370 1 635 2 842 2 533 2 663 1 947 1 161 26 912 307 35 517 630
Outside metropolitan areas 19 904..... 18 673 1 877 2 300 2 139 3 890 3 205 2 822 1 687 753 22 365 322 28 204 531
Region
Northeast 19 308.................... 18 024 1 658 1 710 1 648 3 114 2 713 2 962 2 343 1 876 27 521 373 37 427 479Midwest 23 687...................... 22 551 2 020 1 986 2 083 3 973 3 743 3 844 2 965 1 937 27 668 331 36 941 564South 35 895........................ 33 002 2 832 3 455 3 451 6 556 5 176 5 172 3 733 2 625 25 297 212 34 905 469West 23 158......................... 21 370 1 850 1 991 2 366 3 977 3 085 3 256 2 721 2 124 26 358 324 36 895 557
Race and Hispanic Origin
White 85 750........................ 80 896 6 588 7 072 8 017 14 744 12 592 13 434 10 551 7 898 27 646 206 37 920 291Black 11 483........................ 9 776 1 275 1 605 1 120 2 022 1 541 1 219 718 276 19 321 451 23 971 411Hispanic origin1 10 937............... 9 617 912 1 431 1 686 2 436 1 332 952 579 289 17 257 238 24 355 687
Age
Under 65 years 88 321............... 81 447 7 861 6 960 6 849 14 058 13 027 13 931 10 932 7 828 28 355 226 37 694 28415 to 24 years 19 131.............. 14 079 5 019 2 778 2 057 2 557 971 477 160 61 8 190 222 12 343 37925 to 34 years 18 923.............. 18 330 893 1 104 1 639 4 117 3 955 3 604 2 085 931 28 117 380 33 334 44835 to 44 years 22 156.............. 21 539 786 1 232 1 245 3 482 3 944 4 600 3 668 2 582 35 177 288 44 191 56345 to 54 years 17 144.............. 16 821 608 938 995 2 196 2 648 3 424 3 341 2 671 38 922 587 49 910 73855 to 64 years 10 967.............. 10 678 556 908 913 1 705 1 510 1 826 1 678 1 583 32 776 628 46 257 957
65 years and over 13 727............. 13 501 499 2 182 2 699 3 562 1 690 1 303 831 734 18 166 225 27 997 56965 to 74 years 8 027.............. 7 902 292 1 125 1 464 1 984 1 070 892 558 518 19 734 330 30 441 74675 years and over 5 700........... 5 599 207 1 058 1 235 1 578 620 412 273 216 16 479 289 24 547 875
Mean age 42.2............. 43.5 29.7 43.8 46.6 44.6 43.2 44.0 45.5 47.9 (X) (X) (X) (X)
Relationship to FamilyHouseholder
Householder 45 000.................. 44 415 1 402 2 571 3 813 7 739 7 405 8 742 7 291 5 452 33 517 324 44 233 407Spouse of householder 13 755......... 13 504 473 758 1 134 2 420 2 330 2 639 2 027 1 724 32 885 499 44 708 785Child of householder 18 074........... 13 430 4 787 2 652 1 700 2 309 1 166 523 216 76 8 174 229 12 655 255Other relative of householder 4 676... 3 833 610 762 627 977 404 266 104 83 14 216 458 18 235 485Nonrelatives 20 543.................. 19 766 1 088 2 399 2 275 4 175 3 413 3 065 2 124 1 227 24 846 299 32 371 451
Educational Attainment
Total, 25 years and over 82 917..... 80 869 3 342 6 364 7 491 15 063 13 747 14 757 11 603 8 501 30 654 122 40 489 289Less than 9th grade 5 990........... 5 641 405 1 600 1 357 1 381 495 255 95 54 12 571 235 16 381 3819th to 12th grade (no diploma) 7 736.. 7 366 592 1 174 1 280 2 078 1 169 660 305 108 17 462 313 21 514 431High school graduate (includesequivalency) 26 368................. 25 636 1 090 2 031 2 637 5 940 5 540 4 964 2 585 848 26 542 173 30 318 278
Some college, no degree 14 201....... 13 935 520 753 1 063 2 671 2 784 2 966 2 229 949 31 627 259 38 057 637Associate degree 5 841.............. 5 766 195 235 393 855 1 066 1 455 1 082 484 35 962 412 41 924 1 116Bachelor’s degree or more 22 781...... 22 525 540 571 762 2 137 2 693 4 457 5 306 6 058 50 272 330 65 444 774
Bachelor’s degree 14 808........... 14 614 394 390 522 1 554 2 046 3 164 3 392 3 153 45 749 461 57 801 870Master’s degree 4 811............. 4 772 94 114 157 359 439 897 1 291 1 421 55 784 978 67 715 1 614Professional degree 1 700......... 1 695 32 40 35 123 114 194 292 866 76 362 3 120 107 825 4 157Doctorate degree 1 463............ 1 443 20 27 49 102 94 202 331 618 65 319 1 678 85 530 3 251
See footnotes at end of table.
30 INCOMEU.S. Census Bureau

Table 8. Selected Characteristics of People mTotal Money Income in 1998 of People 15 YearsOld and Over by Work Experience in 1998 and Sex mCon.
[Numbers in thousands. People 15 years old and over as of March of the following year. For meaning of symbols, see text]
Characteristic
With income
Median income Mean income
Total Total
$1 to$4,999or loss
$5,000to
$9,999
$10,000to
$14,999
$15,000to
$24,999
$25,000to
$34,999
$35,000to
$49,999
$50,000to
$74,999$75,000and over
Value(dollars)
Standarderror
(dollars)Value
(dollars)
Standarderror
(dollars)
MALEmCon.
Full ~Time, Year ~RoundWorker
All males 56 957.................. 56 951 751 1 206 3 414 10 429 11 055 12 435 10 213 7 448 36 252 144 47 459 377
Type of Residence
Inside metropolitan areas 46 622....... 46 617 541 947 2 693 8 144 8 568 10 136 8 766 6 823 37 377 188 49 646 432Inside central cities 15 951.......... 15 946 187 404 1 204 3 510 3 049 3 210 2 459 1 923 32 751 489 44 652 637
1 million or more 10 354.......... 10 354 106 282 837 2 309 1 889 2 010 1 599 1 321 32 492 564 44 772 751Under 1 million 5 597............ 5 592 80 123 367 1 201 1 160 1 200 860 602 33 120 767 44 431 1 170
Outside central cities 30 672......... 30 671 354 542 1 490 4 634 5 519 6 926 6 307 4 899 40 391 198 52 242 5661 million or more 21 470.......... 21 470 249 382 969 2 985 3 653 4 749 4 599 3 882 41 612 230 54 837 710Under 1 million 9 202............ 9 201 105 161 521 1 649 1 865 2 177 1 707 1 017 36 432 358 46 187 892
Outside metropolitan areas 10 334..... 10 334 210 259 720 2 285 2 488 2 300 1 447 625 31 137 321 37 595 865
Region
Northeast 10 605.................... 10 605 107 236 517 1 747 1 977 2 374 2 015 1 631 38 694 549 49 610 707Midwest 13 599...................... 13 596 149 229 632 2 231 2 856 3 143 2 637 1 718 37 205 292 48 384 797South 20 060........................ 20 060 299 456 1 308 4 114 4 018 4 326 3 246 2 292 34 326 470 45 691 719West 12 693......................... 12 691 196 284 957 2 337 2 204 2 591 2 315 1 807 36 252 314 47 464 776
Race and Hispanic Origin
White 48 911........................ 48 908 620 984 2 789 8 354 9 329 10 861 9 117 6 854 37 196 160 49 167 429Black 5 400........................ 5 400 71 138 450 1 497 1 265 1 091 643 245 27 472 483 33 719 601Hispanic origin1 6 148............... 6 147 113 337 1 003 1 926 1 146 860 517 244 22 505 413 30 462 931
Age
Under 65 years 55 917............... 55 912 732 1 160 3 390 10 249 10 927 12 243 10 064 7 146 36 170 145 46 956 36915 to 24 years 4 573.............. 4 571 105 368 909 1 844 783 394 125 44 19 510 334 22 658 77625 to 34 years 14 353.............. 14 353 177 257 953 3 282 3 518 3 310 1 988 869 31 600 190 37 114 43335 to 44 years 17 514.............. 17 510 174 236 739 2 709 3 489 4 240 3 476 2 447 39 226 509 49 480 65745 to 54 years 13 286.............. 13 286 170 175 512 1 595 2 253 3 016 3 114 2 450 43 482 613 56 303 88755 to 64 years 6 192.............. 6 192 107 123 277 819 884 1 283 1 362 1 337 44 095 1 026 60 518 1 511
65 years and over 1 039............. 1 039 18 47 24 181 128 192 149 301 43 157 1 915 74 482 5 63565 to 74 years 877.............. 877 14 41 14 157 100 173 120 257 43 060 1 997 71 607 5 02775 years and over 162........... 162 4 6 9 24 28 19 28 44 43 750 7 912 90 020 23 666
Mean age 40.5............. 40.5 40.2 36.0 35.0 36.6 38.8 41.1 43.5 46.3 (X) (X) (X) (X)
Relationship to FamilyHouseholder
Householder 29 313.................. 29 313 337 402 1 140 4 005 5 324 6 998 6 367 4 740 41 197 179 53 251 552Spouse of householder 9 484......... 9 484 115 136 436 1 488 1 771 2 217 1 786 1 535 39 846 552 52 533 1 032Child of householder 4 440........... 4 439 76 237 710 1 687 989 493 172 74 21 488 237 25 155 638Other relative of householder 1 893... 1 892 40 104 344 696 335 220 80 73 21 215 436 25 878 791Nonrelatives 11 826.................. 11 823 183 327 783 2 553 2 637 2 507 1 808 1 026 31 998 232 40 856 641
Educational Attainment
Total, 25 years and over 52 384..... 52 381 646 838 2 505 8 586 10 273 12 041 10 088 7 404 37 906 291 49 623 401Less than 9th grade 1 870........... 1 870 27 100 410 723 343 163 65 40 19 380 600 24 027 9609th to 12th grade (no diploma) 3 613.. 3 613 75 144 472 1 206 890 508 245 75 23 958 547 27 631 653High school graduate (includesequivalency) 16 445................. 16 442 281 320 997 3 563 4 212 4 091 2 262 715 31 477 169 35 575 326
Some college, no degree 9 375....... 9 375 125 107 325 1 501 2 125 2 453 1 912 827 36 934 291 44 428 842Associate degree 4 347.............. 4 347 55 50 124 552 861 1 292 999 413 40 274 539 47 036 1 371Bachelor’s degree or more 16 733...... 16 733 83 116 177 1 039 1 843 3 534 4 605 5 335 56 524 421 74 618 973
Bachelor’s degree 11 058........... 11 058 58 82 134 799 1 475 2 649 3 034 2 827 51 405 349 65 392 1 080Master’s degree 3 414............. 3 414 15 17 28 150 250 643 1 074 1 238 62 244 847 78 178 2 082Professional degree 1 264......... 1 264 9 11 6 57 63 129 219 771 94 737 12 105 125 451 5 116Doctorate degree 998............ 998 2 7 9 33 54 114 278 500 75 078 2 507 100 291 4 240
See footnotes at end of table.
INCOME 31U.S. Census Bureau
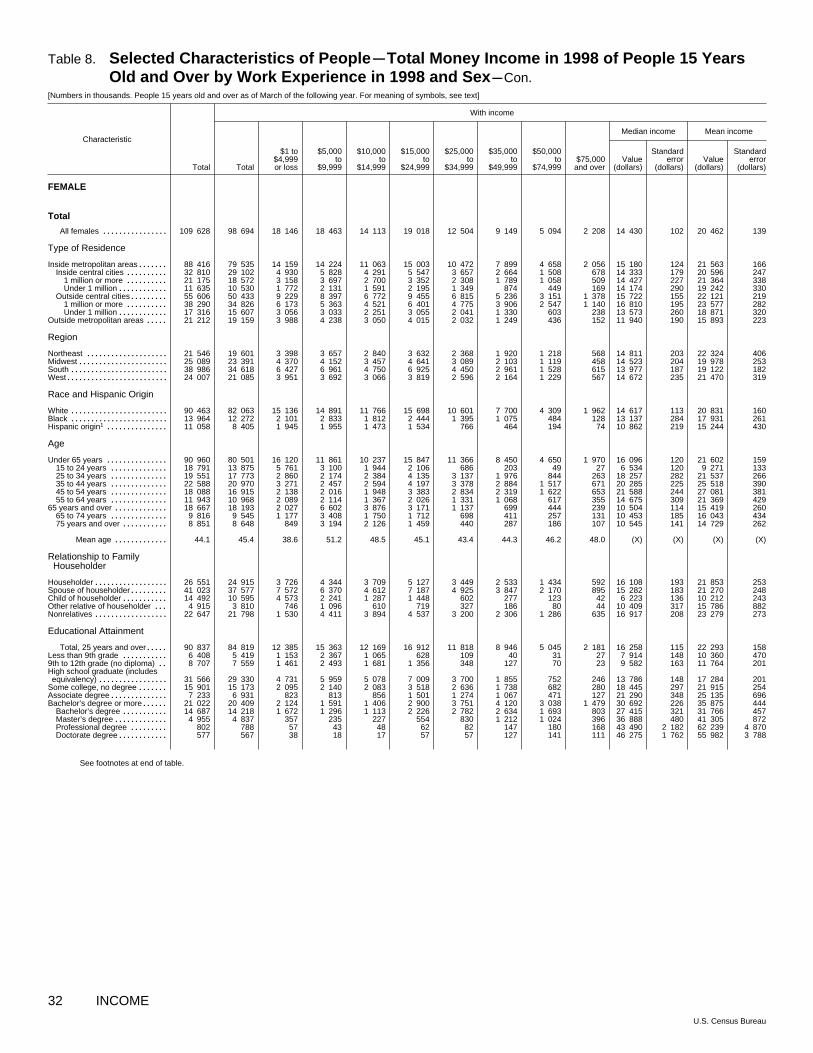
Table 8. Selected Characteristics of People mTotal Money Income in 1998 of People 15 YearsOld and Over by Work Experience in 1998 and Sex mCon.
[Numbers in thousands. People 15 years old and over as of March of the following year. For meaning of symbols, see text]
Characteristic
With income
Median income Mean income
Total Total
$1 to$4,999or loss
$5,000to
$9,999
$10,000to
$14,999
$15,000to
$24,999
$25,000to
$34,999
$35,000to
$49,999
$50,000to
$74,999$75,000and over
Value(dollars)
Standarderror
(dollars)Value
(dollars)
Standarderror
(dollars)
FEMALE
Total
All females 109 628................ 98 694 18 146 18 463 14 113 19 018 12 504 9 149 5 094 2 208 14 430 102 20 462 139
Type of Residence
Inside metropolitan areas 88 416....... 79 535 14 159 14 224 11 063 15 003 10 472 7 899 4 658 2 056 15 180 124 21 563 166Inside central cities 32 810.......... 29 102 4 930 5 828 4 291 5 547 3 657 2 664 1 508 678 14 333 179 20 596 247
1 million or more 21 175.......... 18 572 3 158 3 697 2 700 3 352 2 308 1 789 1 058 509 14 427 227 21 364 338Under 1 million 11 635............ 10 530 1 772 2 131 1 591 2 195 1 349 874 449 169 14 174 290 19 242 330
Outside central cities 55 606......... 50 433 9 229 8 397 6 772 9 455 6 815 5 236 3 151 1 378 15 722 155 22 121 2191 million or more 38 290.......... 34 826 6 173 5 363 4 521 6 401 4 775 3 906 2 547 1 140 16 810 195 23 577 282Under 1 million 17 316............ 15 607 3 056 3 033 2 251 3 055 2 041 1 330 603 238 13 573 260 18 871 320
Outside metropolitan areas 21 212..... 19 159 3 988 4 238 3 050 4 015 2 032 1 249 436 152 11 940 190 15 893 223
Region
Northeast 21 546.................... 19 601 3 398 3 657 2 840 3 632 2 368 1 920 1 218 568 14 811 203 22 324 406Midwest 25 089...................... 23 391 4 370 4 152 3 457 4 641 3 089 2 103 1 119 458 14 523 204 19 978 253South 38 986........................ 34 618 6 427 6 961 4 750 6 925 4 450 2 961 1 528 615 13 977 187 19 122 182West 24 007......................... 21 085 3 951 3 692 3 066 3 819 2 596 2 164 1 229 567 14 672 235 21 470 319
Race and Hispanic Origin
White 90 463........................ 82 063 15 136 14 891 11 766 15 698 10 601 7 700 4 309 1 962 14 617 113 20 831 160Black 13 964........................ 12 272 2 101 2 833 1 812 2 444 1 395 1 075 484 128 13 137 284 17 931 261Hispanic origin1 11 058............... 8 405 1 945 1 955 1 473 1 534 766 464 194 74 10 862 219 15 244 430
Age
Under 65 years 90 960............... 80 501 16 120 11 861 10 237 15 847 11 366 8 450 4 650 1 970 16 096 120 21 602 15915 to 24 years 18 791.............. 13 875 5 761 3 100 1 944 2 106 686 203 49 27 6 534 120 9 271 13325 to 34 years 19 551.............. 17 773 2 860 2 174 2 384 4 135 3 137 1 976 844 263 18 257 282 21 537 26635 to 44 years 22 588.............. 20 970 3 271 2 457 2 594 4 197 3 378 2 884 1 517 671 20 285 225 25 518 39045 to 54 years 18 088.............. 16 915 2 138 2 016 1 948 3 383 2 834 2 319 1 622 653 21 588 244 27 081 38155 to 64 years 11 943.............. 10 968 2 089 2 114 1 367 2 026 1 331 1 068 617 355 14 675 309 21 369 429
65 years and over 18 667............. 18 193 2 027 6 602 3 876 3 171 1 137 699 444 239 10 504 114 15 419 26065 to 74 years 9 816.............. 9 545 1 177 3 408 1 750 1 712 698 411 257 131 10 453 185 16 043 43475 years and over 8 851........... 8 648 849 3 194 2 126 1 459 440 287 186 107 10 545 141 14 729 262
Mean age 44.1............. 45.4 38.6 51.2 48.5 45.1 43.4 44.3 46.2 48.0 (X) (X) (X) (X)
Relationship to FamilyHouseholder
Householder 26 551.................. 24 915 3 726 4 344 3 709 5 127 3 449 2 533 1 434 592 16 108 193 21 853 253Spouse of householder 41 023......... 37 577 7 572 6 370 4 612 7 187 4 925 3 847 2 170 895 15 282 183 21 270 248Child of householder 14 492........... 10 595 4 573 2 241 1 287 1 448 602 277 123 42 6 223 136 10 212 243Other relative of householder 4 915... 3 810 746 1 096 610 719 327 186 80 44 10 409 317 15 786 882Nonrelatives 22 647.................. 21 798 1 530 4 411 3 894 4 537 3 200 2 306 1 286 635 16 917 208 23 279 273
Educational Attainment
Total, 25 years and over 90 837..... 84 819 12 385 15 363 12 169 16 912 11 818 8 946 5 045 2 181 16 258 115 22 293 158Less than 9th grade 6 408........... 5 419 1 153 2 367 1 065 628 109 40 31 27 7 914 148 10 360 4709th to 12th grade (no diploma) 8 707.. 7 559 1 461 2 493 1 681 1 356 348 127 70 23 9 582 163 11 764 201High school graduate (includesequivalency) 31 566................. 29 330 4 731 5 959 5 078 7 009 3 700 1 855 752 246 13 786 148 17 284 201
Some college, no degree 15 901....... 15 173 2 095 2 140 2 083 3 518 2 636 1 738 682 280 18 445 297 21 915 254Associate degree 7 233.............. 6 931 823 813 856 1 501 1 274 1 067 471 127 21 290 348 25 135 696Bachelor’s degree or more 21 022...... 20 409 2 124 1 591 1 406 2 900 3 751 4 120 3 038 1 479 30 692 226 35 875 444
Bachelor’s degree 14 687........... 14 218 1 672 1 296 1 113 2 226 2 782 2 634 1 693 803 27 415 321 31 766 457Master’s degree 4 955............. 4 837 357 235 227 554 830 1 212 1 024 396 36 888 480 41 305 872Professional degree 802......... 788 57 43 48 62 82 147 180 168 43 490 2 182 62 239 4 870Doctorate degree 577............ 567 38 18 17 57 57 127 141 111 46 275 1 762 55 982 3 788
See footnotes at end of table.
32 INCOMEU.S. Census Bureau

Table 8. Selected Characteristics of People mTotal Money Income in 1998 of People 15 YearsOld and Over by Work Experience in 1998 and Sex mCon.
[Numbers in thousands. People 15 years old and over as of March of the following year. For meaning of symbols, see text]
Characteristic
With income
Median income Mean income
Total Total
$1 to$4,999or loss
$5,000to
$9,999
$10,000to
$14,999
$15,000to
$24,999
$25,000to
$34,999
$35,000to
$49,999
$50,000to
$74,999$75,000and over
Value(dollars)
Standarderror
(dollars)Value
(dollars)
Standarderror
(dollars)
FEMALEmCon.
Full ~Time, Year ~RoundWorker
All females 38 819................ 38 810 490 1 351 4 398 10 827 9 157 7 007 3 917 1 663 26 855 122 32 714 275
Type of Residence
Inside metropolitan areas 32 019....... 32 011 336 990 3 342 8 425 7 631 6 108 3 621 1 559 28 036 218 34 300 325Inside central cities 11 700.......... 11 699 119 458 1 442 3 230 2 716 2 066 1 164 503 26 523 215 32 290 448
1 million or more 7 635.......... 7 635 82 313 952 1 941 1 702 1 418 838 388 27 259 308 33 479 595Under 1 million 4 065............ 4 064 37 145 489 1 288 1 014 648 327 115 25 448 312 30 056 640
Outside central cities 20 319......... 20 313 216 531 1 900 5 195 4 915 4 042 2 457 1 056 29 220 263 35 457 4421 million or more 14 350.......... 14 350 154 349 1 191 3 403 3 408 2 975 1 983 888 30 641 225 37 325 553Under 1 million 5 969............ 5 962 62 183 710 1 792 1 507 1 067 474 168 26 129 291 30 959 692
Outside metropolitan areas 6 801..... 6 798 154 361 1 056 2 403 1 526 899 295 104 22 236 309 25 247 389
Region
Northeast 7 505.................... 7 500 68 214 753 1 934 1 667 1 488 943 433 29 083 439 36 995 897Midwest 9 093...................... 9 093 126 249 984 2 638 2 299 1 611 865 321 26 741 240 31 753 453South 14 022........................ 14 017 173 571 1 704 4 261 3 373 2 303 1 154 477 25 629 202 30 072 326West 8 199......................... 8 199 123 317 957 1 994 1 818 1 604 954 431 28 123 502 34 379 625
Race and Hispanic Origin
White 31 507........................ 31 497 379 1 023 3 405 8 538 7 658 5 780 3 247 1 467 27 304 133 33 594 329Black 5 459........................ 5 459 82 262 793 1 735 1 127 930 433 97 23 864 494 27 630 392Hispanic origin1 3 480............... 3 478 47 270 798 1 121 630 396 156 60 19 817 473 24 448 709
Age
Under 65 years 38 239............... 38 230 481 1 338 4 345 10 668 9 028 6 904 3 848 1 618 26 838 123 32 662 27815 to 24 years 3 182.............. 3 182 77 315 760 1 332 503 156 32 7 17 348 257 18 873 29025 to 34 years 9 663.............. 9 663 92 243 1 097 2 934 2 653 1 677 726 240 26 301 215 29 925 36435 to 44 years 11 592.............. 11 587 129 352 1 241 2 927 2 696 2 334 1 314 595 28 585 370 35 493 63245 to 54 years 9 685.............. 9 684 83 259 893 2 382 2 262 1 945 1 325 536 30 027 334 35 950 57055 to 64 years 4 118.............. 4 113 100 168 353 1 093 915 793 451 240 27 783 612 34 039 886
65 years and over 580............. 580 9 13 53 159 130 103 68 45 28 326 1 445 36 155 1 82965 to 74 years 486.............. 486 8 11 48 144 101 85 51 37 27 438 1 493 35 252 2 02575 years and over 94........... 94 1 2 5 15 28 18 17 8 33 716 3 793 40 806 4 136
Mean age 40.4............. 40.4 40.8 38.0 37.6 39.0 40.4 42.1 43.6 44.9 (X) (X) (X) (X)
Relationship to FamilyHouseholder
Householder 11 157.................. 11 157 125 357 1 365 3 145 2 608 1 995 1 096 466 26 731 233 32 016 397Spouse of householder 15 460......... 15 451 218 461 1 487 4 307 3 625 2 968 1 691 693 27 457 239 34 249 515Child of householder 2 573........... 2 573 46 197 523 946 500 234 100 27 20 069 403 23 306 778Other relative of householder 1 231... 1 231 23 89 243 407 259 125 51 34 20 815 619 27 684 2 555Nonrelatives 8 398.................. 8 398 78 246 779 2 022 2 165 1 685 978 444 29 446 398 34 437 452
Educational Attainment
Total, 25 years and over 35 638..... 35 628 413 1 036 3 638 9 495 8 654 6 851 3 885 1 656 27 956 199 33 950 296Less than 9th grade 814........... 814 14 117 304 289 44 23 12 11 14 467 429 18 355 1 6739th to 12th grade (no diploma) 1 880.. 1 878 44 187 552 725 240 98 25 7 16 482 322 18 587 401High school graduate (includesequivalency) 11 616................. 11 613 174 404 1 688 4 278 2 870 1 492 557 149 22 780 254 26 064 352
Some college, no degree 7 075....... 7 070 83 186 564 2 046 2 053 1 406 534 198 27 420 271 31 145 385Associate degree 3 527.............. 3 527 35 67 231 912 964 838 384 97 29 924 513 34 711 1 249Bachelor’s degree or more 10 726...... 10 725 63 74 299 1 245 2 482 2 993 2 374 1 194 39 786 408 47 961 703
Bachelor’s degree 7 289........... 7 288 51 58 250 1 025 1 919 1 985 1 348 653 36 559 305 43 400 735Master’s degree 2 639............. 2 639 10 15 29 172 476 854 767 317 45 283 760 51 840 1 193Professional degree 468......... 468 2 1 12 25 57 85 145 140 57 565 1 705 81 962 7 536Doctorate degree 329............ 329 – – 9 23 31 70 114 83 57 796 1 881 69 499 5 710
1Hispanics may be of any race.
INCOME 33U.S. Census Bureau

Table 9. Educational Attainment mTotal Money Earnings in 1998 of People 18 Years Old andOver by Age, Work Experience in 1998, and Sex
[People 18 years old and over as of March of the following year. For meaning of symbols, see text]
Age
Educational attainment
CollegeHigh school
Bachelor’s degree or more
TotalLess than9th grade
9th to12th grade
(nodiploma)
High schoolgraduate(includes
equiv~alency)
Somecollege,
no degreeAssociate
degree TotalBachelor’s
degreeMaster’s
degree
Profes~sional
degreeDoctorate
degree
MALE
Total
Number With Earnings (thousands)
Total 75 213................................ 3 088 6 997 24 155 15 015 5 530 20 428 13 486 4 219 1 475 1 248Under 65 years 72 308......................... 2 812 6 766 23 330 14 558 5 397 19 446 12 944 4 040 1 356 1 106
18 to 24 years 10 585........................ 290 2 078 3 692 3 438 431 655 617 32 5 –25 to 34 years 17 686........................ 633 1 516 5 734 3 317 1 460 5 026 3 877 791 207 151
25 to 29 years 8 530...................... 308 802 2 717 1 657 731 2 314 1 912 280 76 4630 to 34 years 9 157...................... 325 714 3 017 1 660 729 2 712 1 965 511 131 105
35 to 44 years 20 527........................ 753 1 565 7 031 3 581 1 686 5 911 3 932 1 210 426 34335 to 39 years 10 408...................... 410 856 3 743 1 696 810 2 895 1 966 597 186 14540 to 44 years 10 119...................... 343 710 3 288 1 885 877 3 016 1 966 613 240 198
45 to 54 years 15 453........................ 652 895 4 326 2 856 1 396 5 327 3 182 1 326 446 37345 to 49 years 8 562...................... 343 450 2 515 1 577 845 2 831 1 749 687 211 18450 to 54 years 6 890...................... 309 445 1 811 1 278 551 2 496 1 433 638 236 189
55 to 64 years 8 057........................ 484 711 2 546 1 366 424 2 527 1 335 681 271 24055 to 59 years 4 933...................... 258 408 1 587 812 262 1 606 852 442 170 14160 to 64 years 3 125...................... 226 302 959 554 161 921 483 238 102 98
65 years and over 2 905....................... 276 231 825 457 133 982 542 179 119 14265 to 74 years 2 343........................ 204 187 676 370 114 792 439 149 83 120
65 to 69 years 1 522...................... 120 103 465 231 83 521 308 87 61 6470 to 74 years 821...................... 84 84 211 140 31 272 132 62 22 56
75 years and over 561..................... 72 44 150 87 19 190 103 29 36 22
Mean Earnings (dollars)
Total 38 134................................ 19 389 19 052 28 742 32 005 40 082 62 588 55 057 64 533 108 926 82 619Under 65 years 38 478......................... 20 267 19 223 29 018 32 071 40 026 63 529 55 747 66 273 110 571 86 887
18 to 24 years 14 125........................ 22 210 8 983 16 507 11 321 23 609 21 902 21 677 (B) (B) (B)25 to 34 years 33 053........................ 15 269 20 062 27 333 32 399 35 504 45 459 43 447 45 118 69 275 66 305
25 to 29 years 29 071...................... 14 145 19 017 25 704 29 713 31 118 37 388 37 253 35 967 43 486 (B)30 to 34 years 36 763...................... 16 332 21 236 28 800 35 080 39 907 52 346 49 473 50 125 84 322 77 184
35 to 44 years 43 924........................ 19 396 23 660 32 080 40 649 43 700 68 551 60 689 76 421 112 170 76 71835 to 39 years 41 141...................... 18 814 22 985 30 368 39 322 41 716 64 504 54 762 79 197 109 951 77 81940 to 44 years 46 786...................... 20 091 24 473 34 029 41 842 45 533 72 435 66 619 73 715 113 887 75 910
45 to 54 years 49 544........................ 23 382 27 284 34 599 42 280 41 848 74 534 69 436 69 183 107 312 97 81245 to 49 years 47 315...................... 20 801 24 019 33 256 39 722 41 127 72 800 66 247 69 747 118 542 94 09850 to 54 years 52 313...................... 26 247 30 586 36 465 45 436 42 956 76 502 73 328 68 576 97 271 101 429
55 to 64 years 47 287........................ 22 796 27 456 33 012 39 673 51 684 75 313 60 035 68 978 146 907 97 35455 to 59 years 51 177...................... 23 712 27 722 35 555 42 506 60 022 79 928 64 925 75 452 152 535 97 19960 to 64 years 41 146...................... 21 752 27 097 28 801 35 524 38 119 67 273 51 414 56 943 137 511 97 576
65 years and over 29 564....................... 10 457 14 036 20 945 29 887 42 344 43 951 38 592 25 201 90 139 49 40865 to 74 years 29 862........................ 10 976 15 229 22 719 26 183 23 990 46 838 41 124 25 785 106 125 52 937
65 to 69 years 30 644...................... 12 507 16 773 18 483 25 375 21 594 52 199 41 680 33 042 (B) (B)70 to 74 years 28 414...................... 8 783 13 340 32 052 27 519 (B) 36 559 39 826 (B) (B) (B)
75 years and over 28 318..................... (B) (B) 12 951 45 717 (B) 31 897 27 791 (B) (B) (B)
Standard Error of Mean (dollars)
Total 301................................ 986 433 312 581 1 184 809 901 1 742 4 399 3 452Under 65 years 302......................... 1 074 445 308 557 1 109 832 923 1 799 4 570 3 700
18 to 24 years 492........................ 8 272 354 1 008 293 5 089 1 231 1 294 (B) (B) (B)25 to 34 years 452........................ 530 700 694 1 272 1 482 909 1 039 1 461 6 698 6 355
25 to 29 years 579...................... 708 1 086 1 212 1 707 1 251 757 831 1 879 5 715 (B)30 to 34 years 681...................... 773 843 739 1 879 2 666 1 526 1 858 1 927 9 479 8 285
35 to 44 years 570........................ 838 648 414 1 206 1 985 1 544 1 602 4 156 7 951 5 86835 to 39 years 709...................... 1 021 735 483 1 740 2 119 1 981 1 277 6 862 12 599 10 91140 to 44 years 896...................... 1 373 1 119 691 1 671 3 277 2 350 2 924 4 752 10 188 6 278
45 to 54 years 761........................ 2 198 2 060 602 1 333 1 239 1 833 2 558 2 610 6 770 6 59445 to 49 years 908...................... 1 130 1 141 619 1 153 1 707 2 369 2 939 4 351 11 665 7 83950 to 54 years 1 279...................... 4 451 3 965 1 148 2 609 1 730 2 843 4 398 2 724 7 309 10 524
55 to 64 years 1 157........................ 1 763 2 026 843 2 136 8 034 2 843 2 893 5 271 13 778 9 62055 to 59 years 1 657...................... 3 031 2 970 1 180 3 262 12 673 3 827 3 738 7 491 20 153 10 34160 to 64 years 1 416...................... 1 512 2 566 1 062 2 186 3 967 4 008 4 459 5 561 14 743 18 125
65 years and over 2 029....................... 1 089 1 584 2 682 7 116 19 898 3 366 3 970 3 943 15 955 8 26865 to 74 years 1 932........................ 1 346 1 772 3 234 5 638 3 921 4 000 4 686 4 419 21 335 9 486
65 to 69 years 2 134...................... 2 049 2 513 1 709 6 480 3 928 4 898 4 237 6 248 (B) (B)70 to 74 years 3 840...................... 1 367 2 425 9 574 10 438 (B) 6 818 12 096 (B) (B) (B)
75 years and over 6 721..................... (B) (B) 2 121 28 616 (B) 4 716 5 835 (B) (B) (B)
34 INCOMEU.S. Census Bureau
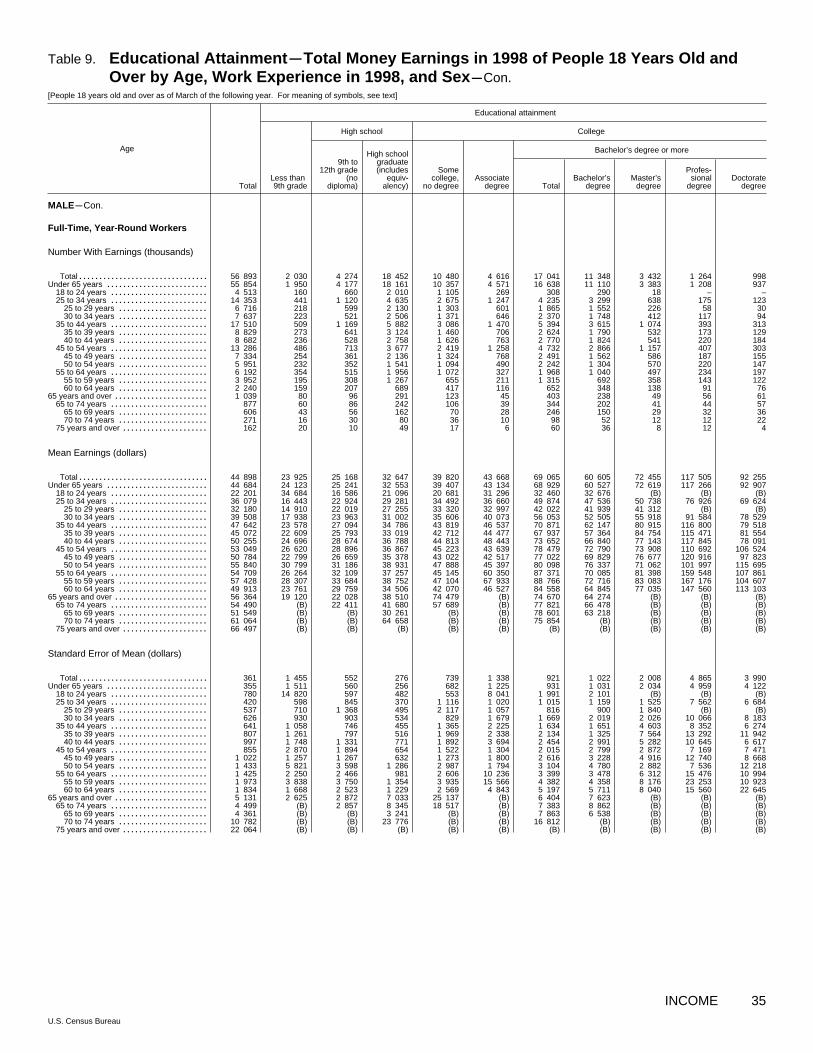
Table 9. Educational Attainment mTotal Money Earnings in 1998 of People 18 Years Old andOver by Age, Work Experience in 1998, and Sex mCon.
[People 18 years old and over as of March of the following year. For meaning of symbols, see text]
Age
Educational attainment
CollegeHigh school
Bachelor’s degree or more
TotalLess than9th grade
9th to12th grade
(nodiploma)
High schoolgraduate(includes
equiv~alency)
Somecollege,
no degreeAssociate
degree TotalBachelor’s
degreeMaster’s
degree
Profes~sional
degreeDoctorate
degree
MALEmCon.
Full ~Time, Year ~Round Workers
Number With Earnings (thousands)
Total 56 893................................ 2 030 4 274 18 452 10 480 4 616 17 041 11 348 3 432 1 264 998Under 65 years 55 854......................... 1 950 4 177 18 161 10 357 4 571 16 638 11 110 3 383 1 208 937
18 to 24 years 4 513........................ 160 660 2 010 1 105 269 308 290 18 – –25 to 34 years 14 353........................ 441 1 120 4 635 2 675 1 247 4 235 3 299 638 175 123
25 to 29 years 6 716...................... 218 599 2 130 1 303 601 1 865 1 552 226 58 3030 to 34 years 7 637...................... 223 521 2 506 1 371 646 2 370 1 748 412 117 94
35 to 44 years 17 510........................ 509 1 169 5 882 3 086 1 470 5 394 3 615 1 074 393 31335 to 39 years 8 829...................... 273 641 3 124 1 460 706 2 624 1 790 532 173 12940 to 44 years 8 682...................... 236 528 2 758 1 626 763 2 770 1 824 541 220 184
45 to 54 years 13 286........................ 486 713 3 677 2 419 1 258 4 732 2 866 1 157 407 30345 to 49 years 7 334...................... 254 361 2 136 1 324 768 2 491 1 562 586 187 15550 to 54 years 5 951...................... 232 352 1 541 1 094 490 2 242 1 304 570 220 147
55 to 64 years 6 192........................ 354 515 1 956 1 072 327 1 968 1 040 497 234 19755 to 59 years 3 952...................... 195 308 1 267 655 211 1 315 692 358 143 12260 to 64 years 2 240...................... 159 207 689 417 116 652 348 138 91 76
65 years and over 1 039....................... 80 96 291 123 45 403 238 49 56 6165 to 74 years 877........................ 60 86 242 106 39 344 202 41 44 57
65 to 69 years 606...................... 43 56 162 70 28 246 150 29 32 3670 to 74 years 271...................... 16 30 80 36 10 98 52 12 12 22
75 years and over 162..................... 20 10 49 17 6 60 36 8 12 4
Mean Earnings (dollars)
Total 44 898................................ 23 925 25 168 32 647 39 820 43 668 69 065 60 605 72 455 117 505 92 255Under 65 years 44 684......................... 24 123 25 241 32 553 39 407 43 134 68 929 60 527 72 619 117 266 92 907
18 to 24 years 22 201........................ 34 684 16 586 21 096 20 681 31 296 32 460 32 676 (B) (B) (B)25 to 34 years 36 079........................ 16 443 22 924 29 281 34 492 36 660 49 874 47 536 50 738 76 926 69 624
25 to 29 years 32 180...................... 14 910 22 019 27 255 33 320 32 997 42 022 41 939 41 312 (B) (B)30 to 34 years 39 508...................... 17 938 23 963 31 002 35 606 40 073 56 053 52 505 55 918 91 584 78 529
35 to 44 years 47 642........................ 23 578 27 094 34 786 43 819 46 537 70 871 62 147 80 915 116 800 79 51835 to 39 years 45 072...................... 22 609 25 793 33 019 42 712 44 477 67 937 57 364 84 754 115 471 81 55440 to 44 years 50 255...................... 24 696 28 674 36 788 44 813 48 443 73 652 66 840 77 143 117 845 78 091
45 to 54 years 53 049........................ 26 620 28 896 36 867 45 223 43 639 78 479 72 790 73 908 110 692 106 52445 to 49 years 50 784...................... 22 799 26 659 35 378 43 022 42 517 77 022 69 829 76 677 120 916 97 82350 to 54 years 55 840...................... 30 799 31 186 38 931 47 888 45 397 80 098 76 337 71 062 101 997 115 695
55 to 64 years 54 709........................ 26 264 32 109 37 257 45 145 60 350 87 371 70 085 81 398 159 548 107 86155 to 59 years 57 428...................... 28 307 33 684 38 752 47 104 67 933 88 766 72 716 83 083 167 176 104 60760 to 64 years 49 913...................... 23 761 29 759 34 506 42 070 46 527 84 558 64 845 77 035 147 560 113 103
65 years and over 56 364....................... 19 120 22 028 38 510 74 479 (B) 74 670 64 274 (B) (B) (B)65 to 74 years 54 490........................ (B) 22 411 41 680 57 689 (B) 77 821 66 478 (B) (B) (B)
65 to 69 years 51 549...................... (B) (B) 30 261 (B) (B) 78 601 63 218 (B) (B) (B)70 to 74 years 61 064...................... (B) (B) 64 658 (B) (B) 75 854 (B) (B) (B) (B)
75 years and over 66 497..................... (B) (B) (B) (B) (B) (B) (B) (B) (B) (B)
Standard Error of Mean (dollars)
Total 361................................ 1 455 552 276 739 1 338 921 1 022 2 008 4 865 3 990Under 65 years 355......................... 1 511 560 256 682 1 225 931 1 031 2 034 4 959 4 122
18 to 24 years 780........................ 14 820 597 482 553 8 041 1 991 2 101 (B) (B) (B)25 to 34 years 420........................ 598 845 370 1 116 1 020 1 015 1 159 1 525 7 562 6 684
25 to 29 years 537...................... 710 1 368 495 2 117 1 057 816 900 1 840 (B) (B)30 to 34 years 626...................... 930 903 534 829 1 679 1 669 2 019 2 026 10 066 8 183
35 to 44 years 641........................ 1 058 746 455 1 365 2 225 1 634 1 651 4 603 8 352 6 27435 to 39 years 807...................... 1 261 797 516 1 969 2 338 2 134 1 325 7 564 13 292 11 94240 to 44 years 997...................... 1 748 1 331 771 1 892 3 694 2 454 2 991 5 282 10 645 6 617
45 to 54 years 855........................ 2 870 1 894 654 1 522 1 304 2 015 2 799 2 872 7 169 7 47145 to 49 years 1 022...................... 1 257 1 267 632 1 273 1 800 2 616 3 228 4 916 12 740 8 66850 to 54 years 1 433...................... 5 821 3 598 1 286 2 987 1 794 3 104 4 780 2 882 7 536 12 218
55 to 64 years 1 425........................ 2 250 2 466 981 2 606 10 236 3 399 3 478 6 312 15 476 10 99455 to 59 years 1 973...................... 3 838 3 750 1 354 3 935 15 566 4 382 4 358 8 176 23 253 10 92360 to 64 years 1 834...................... 1 668 2 523 1 229 2 569 4 843 5 197 5 711 8 040 15 560 22 645
65 years and over 5 131....................... 2 625 2 872 7 033 25 137 (B) 6 404 7 623 (B) (B) (B)65 to 74 years 4 499........................ (B) 2 857 8 345 18 517 (B) 7 383 8 862 (B) (B) (B)
65 to 69 years 4 361...................... (B) (B) 3 241 (B) (B) 7 863 6 538 (B) (B) (B)70 to 74 years 10 782...................... (B) (B) 23 776 (B) (B) 16 812 (B) (B) (B) (B)
75 years and over 22 064..................... (B) (B) (B) (B) (B) (B) (B) (B) (B) (B)
INCOME 35U.S. Census Bureau

Table 9. Educational Attainment mTotal Money Earnings in 1998 of People 18 Years Old andOver by Age, Work Experience in 1998, and Sex mCon.
[People 18 years old and over as of March of the following year. For meaning of symbols, see text]
Age
Educational attainment
CollegeHigh school
Bachelor’s degree or more
TotalLess than9th grade
9th to12th grade
(nodiploma)
High schoolgraduate(includes
equiv~alency)
Somecollege,
no degreeAssociate
degree TotalBachelor’s
degreeMaster’s
degree
Profes~sional
degreeDoctorate
degree
FEMALE
Total
Number With Earnings (thousands)
Total 66 840................................ 1 690 4 967 21 832 14 918 5 949 17 484 12 332 4 005 658 490Under 65 years 64 594......................... 1 526 4 735 20 928 14 523 5 804 17 077 12 091 3 868 640 479
18 to 24 years 9 890........................ 119 1 431 3 072 3 748 517 1 003 965 22 7 1025 to 34 years 15 646........................ 296 927 4 436 3 341 1 571 5 075 3 896 907 205 67
25 to 29 years 7 714...................... 121 424 2 077 1 801 784 2 507 1 986 401 85 3630 to 34 years 7 932...................... 175 503 2 359 1 539 787 2 568 1 910 506 120 31
35 to 44 years 18 058........................ 438 1 074 5 943 3 507 1 946 5 150 3 632 1 127 229 16235 to 39 years 9 042...................... 208 584 2 939 1 738 981 2 592 1 914 505 114 6040 to 44 years 9 016...................... 230 490 3 004 1 770 965 2 558 1 719 622 115 103
45 to 54 years 14 187........................ 419 742 4 782 2 628 1 319 4 298 2 624 1 341 160 17345 to 49 years 7 890...................... 230 382 2 613 1 437 734 2 494 1 565 748 104 7750 to 54 years 6 297...................... 189 360 2 169 1 191 584 1 804 1 059 594 56 96
55 to 64 years 6 813........................ 254 562 2 695 1 300 451 1 550 973 471 40 6755 to 59 years 4 334...................... 146 331 1 688 853 293 1 023 635 307 36 4660 to 64 years 2 478...................... 108 231 1 007 447 158 527 338 164 4 21
65 years and over 2 247....................... 164 231 904 395 145 407 241 137 18 1165 to 74 years 1 848........................ 112 184 792 298 131 332 195 111 15 11
65 to 69 years 1 191...................... 58 106 540 191 98 199 118 62 11 870 to 74 years 658...................... 54 78 252 108 33 133 77 49 4 3
75 years and over 398..................... 52 48 112 96 14 76 46 27 3 –
Mean Earnings (dollars)
Total 22 818................................ 13 042 10 778 17 898 19 327 25 390 35 431 31 452 40 429 65 351 54 552Under 65 years 23 088......................... 12 430 10 869 18 079 19 443 25 633 35 801 31 674 41 261 66 377 55 053
18 to 24 years 10 303........................ 7 516 5 776 10 873 9 216 13 453 17 779 17 558 (B) (B) (B)25 to 34 years 22 343........................ 10 878 10 844 16 538 19 396 22 448 32 094 30 026 37 969 40 320 (B)
25 to 29 years 21 095...................... 10 372 9 920 16 317 17 672 21 106 29 915 29 057 31 838 35 648 (B)30 to 34 years 23 557...................... 11 228 11 622 16 732 21 413 23 783 34 222 31 034 42 821 43 631 (B)
35 to 44 years 26 614........................ 13 550 14 086 19 305 23 373 27 593 40 608 36 018 42 143 93 652 57 90235 to 39 years 26 342...................... 14 383 13 275 19 066 22 419 26 423 41 092 36 537 40 114 115 731 (B)40 to 44 years 26 888...................... 12 797 15 052 19 540 24 311 28 783 40 118 35 440 43 789 71 624 61 058
45 to 54 years 28 112........................ 13 861 14 382 21 150 26 619 31 116 39 610 34 091 44 265 66 185 62 69045 to 49 years 27 830...................... 14 270 14 438 20 583 26 040 29 856 39 164 33 808 42 686 65 340 78 58450 to 54 years 28 466...................... 13 365 14 322 21 834 27 318 32 700 40 226 34 510 46 255 (B) 49 953
55 to 64 years 23 545........................ 12 260 13 097 20 677 23 935 26 204 33 067 29 544 37 426 (B) (B)55 to 59 years 24 637...................... 11 673 13 855 21 224 24 245 27 411 35 136 31 475 39 523 (B) (B)60 to 64 years 21 637...................... 13 052 12 013 19 760 23 345 23 961 29 054 25 915 33 507 (B) (B)
65 years and over 15 076....................... 18 744 8 919 13 716 15 051 15 674 19 930 20 332 17 023 (B) (B)65 to 74 years 15 672........................ 21 293 9 912 13 766 15 916 15 742 21 272 22 245 16 797 (B) (B)
65 to 69 years 18 361...................... (B) 12 131 16 027 17 456 18 211 23 992 23 505 (B) (B) (B)70 to 74 years 10 805...................... (B) 6 912 8 926 13 188 (B) 17 188 20 316 (B) (B) (B)
75 years and over 12 308..................... (B) (B) 13 365 12 376 (B) 14 063 (B) (B) (B) (B)
Standard Error of Mean (dollars)
Total 180................................ 1 413 239 237 228 769 468 467 917 5 632 4 067Under 65 years 178......................... 916 243 213 230 785 476 473 938 5 766 4 143
18 to 24 years 160........................ 925 297 289 215 627 722 732 (B) (B) (B)25 to 34 years 280........................ 747 432 393 422 972 612 544 2 313 2 779 (B)
25 to 29 years 342...................... 1 166 605 686 428 716 707 816 1 248 3 955 (B)30 to 34 years 440...................... 971 605 426 760 1 801 989 712 3 992 3 762 (B)
35 to 44 years 423........................ 2 180 677 320 498 1 446 1 202 1 170 2 095 14 715 7 46635 to 39 years 672...................... 4 333 628 386 728 1 458 2 073 1 993 3 415 26 988 (B)40 to 44 years 513...................... 1 373 1 278 507 678 2 511 1 201 1 089 2 587 10 875 11 081
45 to 54 years 407........................ 2 284 563 382 640 2 341 868 1 054 1 185 6 226 8 13545 to 49 years 468...................... 4 093 743 426 964 1 965 982 893 1 315 8 186 17 18750 to 54 years 704...................... 924 851 667 801 4 667 1 560 2 255 2 096 (B) 3 964
55 to 64 years 533........................ 926 645 1 077 828 1 646 964 1 173 1 604 (B) (B)55 to 59 years 746...................... 878 854 1 609 971 2 095 1 170 1 429 1 855 (B) (B)60 to 64 years 663...................... 1 819 970 1 012 1 537 2 619 1 665 2 011 2 965 (B) (B)
65 years and over 1 548....................... 11 806 1 278 2 936 1 599 2 190 1 999 2 743 2 668 (B) (B)65 to 74 years 1 861........................ 17 175 1 559 3 335 1 940 2 137 2 338 3 267 2 913 (B) (B)
65 to 69 years 2 846...................... (B) 2 537 4 867 2 734 2 578 3 386 4 723 (B) (B) (B)70 to 74 years 824...................... (B) 1 090 918 2 277 (B) 2 798 3 990 (B) (B) (B)
75 years and over 1 245..................... (B) (B) 2 362 2 566 (B) 3 075 (B) (B) (B) (B)
36 INCOMEU.S. Census Bureau

Table 9. Educational Attainment mTotal Money Earnings in 1998 of People 18 Years Old andOver by Age, Work Experience in 1998, and Sex mCon.
[People 18 years old and over as of March of the following year. For meaning of symbols, see text]
Age
Educational attainment
CollegeHigh school
Bachelor’s degree or more
TotalLess than9th grade
9th to12th grade
(nodiploma)
High schoolgraduate(includes
equiv~alency)
Somecollege,
no degreeAssociate
degree TotalBachelor’s
degreeMaster’s
degree
Profes~sional
degreeDoctorate
degree
FEMALEmCon.
Full ~Time, Year ~Round Workers
Number With Earnings (thousands)
Total 38 762................................ 852 2 078 12 853 8 036 3 768 11 176 7 720 2 652 474 329Under 65 years 38 187......................... 814 2 032 12 597 7 953 3 725 11 066 7 653 2 625 465 323
18 to 24 years 3 159........................ 38 202 1 247 969 240 463 444 13 6 –25 to 34 years 9 658........................ 143 421 2 555 2 027 1 068 3 444 2 622 625 146 51
25 to 29 years 4 744...................... 58 185 1 207 1 028 537 1 729 1 362 279 62 2730 to 34 years 4 915...................... 86 236 1 348 999 532 1 715 1 260 346 85 24
35 to 44 years 11 582........................ 258 645 3 813 2 283 1 236 3 347 2 339 747 161 10135 to 39 years 5 742...................... 117 341 1 903 1 094 628 1 659 1 209 321 89 4140 to 44 years 5 840...................... 140 304 1 909 1 189 608 1 688 1 130 426 72 60
45 to 54 years 9 681........................ 249 468 3 286 1 850 917 2 911 1 726 931 119 13545 to 49 years 5 367...................... 124 252 1 780 991 523 1 698 1 032 526 79 6150 to 54 years 4 314...................... 125 216 1 507 859 394 1 213 694 405 40 74
55 to 64 years 4 107........................ 127 297 1 696 824 263 901 523 309 33 3655 to 59 years 2 784...................... 67 190 1 129 562 187 648 386 210 29 2360 to 64 years 1 323...................... 60 107 566 262 75 253 137 99 4 13
65 years and over 575....................... 38 46 256 83 43 110 67 27 9 665 to 74 years 481........................ 26 39 220 65 41 90 54 21 9 6
65 to 69 years 336...................... 17 25 156 44 37 56 30 14 9 470 to 74 years 145...................... 9 13 64 21 3 34 23 7 – 3
75 years and over 94..................... 12 7 36 18 2 20 14 6 – –
Mean Earnings (dollars)
Total 30 671................................ 17 335 17 218 23 841 27 610 31 959 43 810 39 655 47 263 77 103 65 488Under 65 years 30 730......................... 17 153 17 159 23 881 27 599 31 978 43 849 39 668 47 366 77 543 65 858
18 to 24 years 18 395........................ (B) 15 729 17 162 17 553 19 171 24 653 24 275 (B) (B) (B)25 to 34 years 28 634........................ 15 362 16 309 22 519 25 267 27 279 37 628 35 982 41 022 46 403 (B)
25 to 29 years 27 290...................... (B) 15 280 22 191 23 379 25 523 35 413 34 865 35 862 (B) (B)30 to 34 years 29 931...................... 15 488 17 117 22 812 27 212 29 053 39 861 37 189 45 179 50 781 (B)
35 to 44 years 33 579........................ 18 289 17 291 24 569 29 692 34 128 50 606 44 912 51 762 116 525 69 12235 to 39 years 33 657...................... 20 246 17 592 24 189 29 003 32 275 52 359 46 251 50 186 141 221 (B)40 to 44 years 33 503...................... 16 652 16 953 24 948 30 325 36 040 48 883 43 479 52 947 (B) (B)
45 to 54 years 33 535........................ 18 114 17 766 25 381 31 498 37 153 46 749 41 959 48 871 71 655 71 36245 to 49 years 33 278...................... 20 627 16 861 25 062 31 398 35 028 45 810 40 921 47 010 67 377 (B)50 to 54 years 33 855...................... 15 606 18 822 25 757 31 614 39 973 48 062 43 504 51 289 (B) (B)
55 to 64 years 30 502........................ 16 140 18 089 26 419 30 590 34 618 43 023 40 206 45 361 (B) (B)55 to 59 years 31 104...................... (B) 18 336 26 961 30 780 33 537 43 383 40 464 45 765 (B) (B)60 to 64 years 29 235...................... (B) 17 650 25 338 30 185 37 305 42 098 39 481 44 500 (B) (B)
65 years and over 26 714....................... (B) (B) 21 858 28 685 (B) 39 840 (B) (B) (B) (B)65 to 74 years 26 596........................ (B) (B) 21 134 (B) (B) 43 348 (B) (B) (B) (B)
65 to 69 years 28 481...................... (B) (B) 22 890 (B) (B) (B) (B) (B) (B) (B)70 to 74 years 22 226...................... (B) (B) (B) (B) (B) (B) (B) (B) (B) (B)
75 years and over 27 316..................... (B) (B) (B) (B) (B) (B) (B) (B) (B) (B)
Standard Error of Mean (dollars)
Total 261................................ 1 586 325 300 320 1 150 645 660 1 078 7 418 5 610Under 65 years 264......................... 1 647 314 305 320 1 162 650 663 1 087 7 549 5 710
18 to 24 years 285........................ (B) 1 277 475 370 791 880 878 (B) (B) (B)25 to 34 years 351........................ 1 056 612 585 561 1 335 627 669 1 636 3 316 (B)
25 to 29 years 473...................... (B) 864 1 070 513 778 894 1 044 1 384 (B) (B)30 to 34 years 516...................... 1 320 848 556 999 2 560 870 811 2 686 4 364 (B)
35 to 44 years 610........................ 3 612 557 405 623 2 162 1 733 1 665 2 945 20 084 11 11135 to 39 years 1 003...................... 7 536 808 451 966 2 023 3 115 3 011 5 070 33 536 (B)40 to 44 years 702...................... 2 031 757 673 800 3 861 1 559 1 222 3 475 (B) (B)
45 to 54 years 541........................ 3 738 625 456 765 3 256 1 139 1 452 1 468 6 059 10 04545 to 49 years 595...................... 7 411 737 498 1 193 2 517 1 210 1 050 1 526 7 109 (B)50 to 54 years 961...................... 916 1 036 803 905 6 794 2 145 3 256 2 720 (B) (B)
55 to 64 years 775........................ 1 492 801 1 599 985 2 329 1 133 1 441 1 681 (B) (B)55 to 59 years 1 072...................... (B) 959 2 339 1 156 2 833 1 361 1 724 1 906 (B) (B)60 to 64 years 829...................... (B) 1 428 1 077 1 856 3 996 2 029 2 583 3 342 (B) (B)
65 years and over 1 486....................... (B) (B) 1 382 4 309 (B) 4 947 (B) (B) (B) (B)65 to 74 years 1 657........................ (B) (B) 1 342 (B) (B) 5 791 (B) (B) (B) (B)
65 to 69 years 2 149...................... (B) (B) 1 475 (B) (B) (B) (B) (B) (B) (B)70 to 74 years 2 221...................... (B) (B) (B) (B) (B) (B) (B) (B) (B) (B)
75 years and over 3 274..................... (B) (B) (B) (B) (B) (B) (B) (B) (B) (B)
INCOME 37U.S. Census Bureau

Table 10. Work Experience in 1998 mTotal Money Earnings in 1998 of People 15 Years Old andOver by Race, Hispanic Origin, and Sex
[Numbers in thousands. People 15 years old and over as of March of the following year. For meaning of symbols, see text]
Total money earnings
Worked
Worked at full~time jobs Worked at part~time jobs
Total Total Total50 weeks
or more27 to 49
weeks26 weeks
or less Total50 weeks
or more27 to 49
weeks26 weeks
or lessDid not
work
MALE
All Races
Total .............................. 102 048......... 77 323 67 305 56 957 6 208 4 141 10 018 4 248 2 123 3 648 24 725Without earnings....................... 24 753......... 28 9 6 1 3 19 12 3 4 24 725With earnings ......................... 77 295......... 77 295 67 296 56 951 6 207 4 138 9 999 4 236 2 120 3 644 –
$1 to $2,499 or loss .................. 4 923......... 4 923 1 738 642 134 962 3 186 431 323 2 431 –$2,500 to $4,999 .................... 3 094......... 3 094 1 390 297 153 940 1 703 549 492 663 –$5,000 to $7,499 .................... 3 230......... 3 230 1 688 616 438 634 1 542 840 487 215 –$7,500 to $9,999 .................... 2 259......... 2 259 1 448 653 434 361 811 505 215 91 –$10,000 to $12,499 .................. 3 745......... 3 745 2 927 2 012 647 268 818 572 176 71 –$12,500 to $14,999 .................. 2 562......... 2 562 2 271 1 681 438 152 291 181 88 23 –$15,000 to $17,499 .................. 3 879......... 3 879 3 506 2 820 524 162 373 255 86 32 –$17,500 to $19,999 .................. 2 659......... 2 659 2 466 2 050 329 87 193 132 46 14 –$20,000 to $22,499 .................. 4 329......... 4 329 4 137 3 618 409 110 192 144 34 14 –$22,500 to $24,999 .................. 2 559......... 2 559 2 487 2 236 226 25 72 52 14 6 –
$25,000 to $29,999 .................. 6 570......... 6 570 6 379 5 792 462 125 191 133 41 17 –$30,000 to $34,999 .................. 6 347......... 6 347 6 151 5 576 491 84 197 145 21 30 –$35,000 to $39,999 .................. 5 405......... 5 405 5 353 4 938 364 51 53 35 14 4 –$40,000 to $44,999 .................. 4 923......... 4 923 4 840 4 527 282 31 83 59 21 3 –$45,000 to $49,999 .................. 3 423......... 3 423 3 388 3 186 165 37 35 26 7 2 –$50,000 to $54,999 .................. 3 617......... 3 617 3 577 3 406 146 25 40 18 19 2 –$55,000 to $64,999 .................. 4 229......... 4 229 4 190 3 990 165 35 39 33 2 4 –$65,000 to $74,999 .................. 2 590......... 2 590 2 547 2 446 93 8 43 22 15 6 –$75,000 to $84,999 .................. 1 969......... 1 969 1 938 1 829 97 12 31 27 3 1 –$85,000 to $99,999 .................. 1 408......... 1 408 1 385 1 277 92 15 24 19 – 4 –$100,000 and over ................... 3 573......... 3 573 3 492 3 361 115 16 82 58 15 8 –
Median earnings dollars.......................... 28 755 28 755 31 750 35 345 20 027 5 658 5 179 8 972 6 258 1 874 (B)Standard error dollars.......................... 233 233 111 133 419 199 127 252 185 49 (B)
Mean earnings dollars........................... 37 180 37 180 41 268 44 866 28 745 10 542 9 665 14 812 9 934 3 525 (B)Standard error dollars.......................... 295 295 328 361 1 069 611 330 682 519 235 (B)
Gini ratio.............................. .465......... .465 .421 .389 .461 .575 .605 .533 .523 .602 (B)Standard error....................... .0049......... .0049 .0052 .0057 .0203 .0242 .0171 .0266 .0356 .0354 (B)
White
Total .............................. 85 750......... 65 999 57 597 48 911 5 331 3 355 8 402 3 631 1 832 2 940 19 751Without earnings....................... 19 775......... 24 8 4 1 3 16 10 3 4 19 751With earnings ......................... 65 975......... 65 975 57 589 48 907 5 330 3 352 8 386 3 621 1 829 2 936 –
$1 to $2,499 or loss .................. 3 994......... 3 994 1 391 565 105 720 2 604 392 277 1 934 –$2,500 to $4,999 .................... 2 511......... 2 511 1 112 237 116 759 1 399 448 412 539 –$5,000 to $7,499 .................... 2 692......... 2 692 1 376 478 361 537 1 316 706 428 182 –$7,500 to $9,999 .................... 1 850......... 1 850 1 183 541 358 284 668 418 175 75 –$10,000 to $12,499 .................. 3 158......... 3 158 2 426 1 665 553 209 731 514 152 66 –$12,500 to $14,999 .................. 2 128......... 2 128 1 875 1 377 364 134 252 155 76 22 –$15,000 to $17,499 .................. 3 164......... 3 164 2 869 2 284 434 151 295 197 78 19 –$17,500 to $19,999 .................. 2 148......... 2 148 1 992 1 650 271 72 156 110 32 14 –$20,000 to $22,499 .................. 3 562......... 3 562 3 394 2 931 367 96 169 120 34 14 –$22,500 to $24,999 .................. 2 025......... 2 025 1 967 1 735 211 21 59 39 14 6 –
$25,000 to $29,999 .................. 5 465......... 5 465 5 291 4 779 406 106 174 119 38 17 –$30,000 to $34,999 .................. 5 481......... 5 481 5 304 4 835 415 54 177 134 21 21 –$35,000 to $39,999 .................. 4 653......... 4 653 4 600 4 234 318 48 53 35 14 4 –$40,000 to $44,999 .................. 4 327......... 4 327 4 250 3 980 243 27 76 54 21 1 –$45,000 to $49,999 .................. 3 061......... 3 061 3 031 2 855 145 31 30 20 7 2 –$50,000 to $54,999 .................. 3 206......... 3 206 3 172 3 012 138 22 34 16 15 2 –$55,000 to $64,999 .................. 3 798......... 3 798 3 767 3 580 156 31 31 24 2 4 –$65,000 to $74,999 .................. 2 330......... 2 330 2 296 2 200 88 8 34 16 15 3 –$75,000 to $84,999 .................. 1 843......... 1 843 1 813 1 710 91 11 31 27 3 1 –$85,000 to $99,999 .................. 1 277......... 1 277 1 254 1 152 88 14 24 19 – 4 –$100,000 and over ................... 3 302......... 3 302 3 226 3 109 102 15 76 56 15 5 –
Median earnings dollars.......................... 30 178 30 178 32 491 36 172 20 698 5 914 5 362 9 076 6 318 1 898 (B)Standard error dollars.......................... 124 124 223 147 390 211 136 282 196 55 (B)
Mean earnings dollars........................... 38 638 38 638 42 802 46 449 29 440 10 837 10 038 15 192 10 340 3 495 (B)Standard error dollars.......................... 334 334 370 411 1 115 579 379 778 591 237 (B)
Gini ratio.............................. .465......... .465 .421 .391 .456 .568 .607 .542 .532 .591 (B)Standard error....................... .0053......... .0053 .0057 .0061 .0214 .0256 .0187 .0288 .0384 .0421 (B)
See footnotes at end of table.
38 INCOMEU.S. Census Bureau

Table 10. Work Experience in 1998 mTotal Money Earnings in 1998 of People 15 Years Old andOver by Race, Hispanic Origin, and Sex mCon.
[Numbers in thousands. People 15 years old and over as of March of the following year. For meaning of symbols, see text]
Total money earnings
Worked
Worked at full~time jobs Worked at part~time jobs
Total Total Total50 weeks
or more27 to 49
weeks26 weeks
or less Total50 weeks
or more27 to 49
weeks26 weeks
or lessDid not
work
MALEmCon.
Black
Total .............................. 11 483......... 7 695 6 586 5 400 627 560 1 110 394 240 475 3 787Without earnings....................... 3 787......... – – – – – – – – – 3 787With earnings ......................... 7 695......... 7 695 6 586 5 400 627 560 1 110 394 240 475 –
$1 to $2,499 or loss .................. 639......... 639 247 31 27 190 392 23 36 333 –$2,500 to $4,999 .................... 460......... 460 216 42 35 139 244 75 70 99 –$5,000 to $7,499 .................... 377......... 377 223 93 62 68 154 93 46 15 –$7,500 to $9,999 .................... 294......... 294 182 75 58 49 112 62 37 13 –$10,000 to $12,499 .................. 413......... 413 366 244 84 39 47 28 16 3 –$12,500 to $14,999 .................. 309......... 309 284 219 51 13 24 14 10 – –$15,000 to $17,499 .................. 468......... 468 439 381 51 6 29 24 3 3 –$17,500 to $19,999 .................. 381......... 381 347 296 40 11 34 20 15 – –$20,000 to $22,499 .................. 540......... 540 526 492 27 8 14 14 – – –$22,500 to $24,999 .................. 381......... 381 370 363 6 – 11 11 1 – –
$25,000 to $29,999 .................. 843......... 843 829 773 49 7 14 11 3 – –$30,000 to $34,999 .................. 589......... 589 577 503 52 21 13 6 – 7 –$35,000 to $39,999 .................. 536......... 536 536 496 38 2 – – – – –$40,000 to $44,999 .................. 391......... 391 388 370 18 – 2 2 – – –$45,000 to $49,999 .................. 244......... 244 241 232 6 2 4 4 – – –$50,000 to $54,999 .................. 250......... 250 246 242 4 – 4 – 4 – –$55,000 to $64,999 .................. 258......... 258 254 245 5 4 4 4 – – –$65,000 to $74,999 .................. 137......... 137 130 125 5 – 8 5 – 3 –$75,000 to $84,999 .................. 39......... 39 39 35 3 – – – – – –$85,000 to $99,999 .................. 53......... 53 53 50 2 – – – – – –$100,000 and over ................... 94......... 94 94 92 2 – – – – – –
Median earnings dollars.......................... 22 351 22 351 25 389 27 050 14 849 4 116 4 168 7 767 5 743 1 782 (B)Standard error dollars.......................... 380 380 284 272 1 026 356 286 602 705 137 (B)
Mean earnings dollars........................... 25 437 25 437 28 569 31 968 18 660 6 865 6 849 11 424 7 433 2 762 (B)Standard error dollars.......................... 438 438 476 530 1 010 654 482 950 851 507 (B)
Gini ratio.............................. .412......... .412 .358 .308 .389 .546 .549 .438 .418 .540 (B)Standard error....................... .0139......... .0139 .0151 .0168 .0483 .0672 .0510 .0745 .1028 .1454 (B)
Hispanic Origin 1
Total .............................. 10 937......... 8 444 7 545 6 148 915 482 899 389 171 339 2 493Without earnings....................... 2 494......... 1 1 1 – – – – – – 2 493With earnings ......................... 8 443......... 8 443 7 544 6 147 915 482 899 389 171 339 –
$1 to $2,499 or loss .................. 473......... 473 201 74 19 107 272 34 22 215 –$2,500 to $4,999 .................... 315......... 315 177 53 34 90 138 34 35 69 –$5,000 to $7,499 .................... 588......... 588 401 163 105 132 187 104 55 28 –$7,500 to $9,999 .................... 394......... 394 335 187 103 45 58 32 19 7 –$10,000 to $12,499 .................. 902......... 902 808 593 182 33 95 72 13 10 –$12,500 to $14,999 .................. 560......... 560 533 426 90 16 28 20 5 3 –$15,000 to $17,499 .................. 820......... 820 789 681 96 12 31 18 9 4 –$17,500 to $19,999 .................. 456......... 456 434 371 57 6 22 19 4 – –$20,000 to $22,499 .................. 647......... 647 630 574 47 9 17 15 2 – –$22,500 to $24,999 .................. 342......... 342 331 309 20 3 11 7 4 – –
$25,000 to $29,999 .................. 692......... 692 683 617 54 12 9 7 – 2 –$30,000 to $34,999 .................. 557......... 557 548 510 35 4 9 6 1 1 –$35,000 to $39,999 .................. 374......... 374 373 365 6 2 1 1 – – –$40,000 to $44,999 .................. 340......... 340 335 316 19 – 5 5 – – –$45,000 to $49,999 .................. 196......... 196 192 186 5 1 4 4 – – –$50,000 to $54,999 .................. 203......... 203 202 188 10 4 1 – 1 – –$55,000 to $64,999 .................. 216......... 216 214 203 10 1 1 1 – – –$65,000 to $74,999 .................. 113......... 113 106 104 2 – 7 7 – – –$75,000 to $84,999 .................. 74......... 74 73 65 8 – 2 2 – – –$85,000 to $99,999 .................. 60......... 60 58 54 5 – 1 1 – – –$100,000 and over ................... 122......... 122 120 109 7 4 2 1 1 – –
Median earnings dollars.......................... 18 430 18 430 20 374 22 285 12 865 5 832 5 535 9 292 6 277 1 966 (B)Standard error dollars.......................... 422 422 289 317 617 349 335 1 128 500 179 (B)
Mean earnings dollars........................... 25 125 25 125 27 163 29 711 19 788 8 680 8 023 12 429 8 275 2 829 (B)Standard error dollars.......................... 763 763 841 917 2 984 1 180 629 1 159 1 388 342 (B)
Gini ratio.............................. .451......... .451 .423 .389 .469 .538 .530 .434 .439 .487 (B)Standard error....................... .0176......... .0176 .0187 .0200 .0867 .0919 .0540 .0832 .1351 .1028 (B)
See footnotes at end of table.
INCOME 39U.S. Census Bureau

Table 10. Work Experience in 1998 mTotal Money Earnings in 1998 of People 15 Years Old andOver by Race, Hispanic Origin, and Sex mCon.
[Numbers in thousands. People 15 years old and over as of March of the following year. For meaning of symbols, see text]
Total money earnings
Worked
Worked at full~time jobs Worked at part~time jobs
Total Total Total50 weeks
or more27 to 49
weeks26 weeks
or less Total50 weeks
or more27 to 49
weeks26 weeks
or lessDid not
work
FEMALE
All Races
Total .............................. 109 628......... 68 950 49 184 38 819 5 948 4 417 19 765 9 362 4 416 5 988 40 678Without earnings....................... 40 782......... 104 45 34 7 4 59 34 14 11 40 678With earnings ......................... 68 846......... 68 846 49 139 38 785 5 941 4 413 19 706 9 327 4 402 5 977 –
$1 to $2,499 or loss .................. 6 970......... 6 970 1 750 378 122 1 251 5 220 715 650 3 855 –$2,500 to $4,999 .................... 4 746......... 4 746 1 502 194 229 1 079 3 244 1 078 1 068 1 098 –$5,000 to $7,499 .................... 5 028......... 5 028 1 884 626 485 774 3 144 1 667 941 535 –$7,500 to $9,999 .................... 3 837......... 3 837 1 943 888 632 423 1 894 1 205 541 148 –$10,000 to $12,499 .................. 5 535......... 5 535 3 518 2 547 770 201 2 017 1 417 497 103 –$12,500 to $14,999 .................. 3 662......... 3 662 2 895 2 281 520 94 767 586 144 37 –$15,000 to $17,499 .................. 4 368......... 4 368 3 563 2 985 472 106 805 603 142 59 –$17,500 to $19,999 .................. 3 198......... 3 198 2 807 2 410 328 69 391 303 75 13 –$20,000 to $22,499 .................. 4 713......... 4 713 4 147 3 673 381 94 566 434 110 22 –$22,500 to $24,999 .................. 2 767......... 2 767 2 559 2 287 225 48 208 170 27 11 –
$25,000 to $29,999 .................. 5 983......... 5 983 5 508 4 968 438 102 475 388 55 33 –$30,000 to $34,999 .................. 4 861......... 4 861 4 554 4 096 400 58 306 250 48 8 –$35,000 to $39,999 .................. 3 549......... 3 549 3 351 3 089 233 29 198 144 49 5 –$40,000 to $44,999 .................. 2 617......... 2 617 2 495 2 245 221 29 122 104 11 7 –$45,000 to $49,999 .................. 1 539......... 1 539 1 457 1 293 151 13 82 67 7 8 –$50,000 to $54,999 .................. 1 549......... 1 549 1 482 1 339 136 6 68 60 7 – –$55,000 to $64,999 .................. 1 627......... 1 627 1 542 1 430 94 18 85 63 15 8 –$65,000 to $74,999 .................. 894......... 894 861 824 37 1 33 14 5 14 –$75,000 to $84,999 .................. 535......... 535 506 474 23 9 29 16 3 10 –$85,000 to $99,999 .................. 239......... 239 227 218 8 1 11 11 – – –$100,000 and over ................... 629......... 629 587 541 36 10 42 32 7 3 –
Median earnings dollars.......................... 17 716 17 716 23 047 25 862 16 129 4 715 6 105 9 995 6 284 1 938 (B)Standard error dollars.......................... 161 161 170 118 320 121 87 146 138 39 (B)
Mean earnings dollars........................... 22 225 22 225 27 394 30 660 20 752 7 629 9 337 13 300 8 867 3 498 (B)Standard error dollars.......................... 176 176 217 261 351 259 234 362 485 353 (B)
Gini ratio.............................. .457......... .457 .379 .335 .385 .541 .536 .441 .481 .585 (B)Standard error....................... .0048......... .0048 .0057 .0065 .0152 .0216 .0106 .0145 .0325 .0277 (B)
White
Total .............................. 90 463......... 56 824 39 870 31 507 4 909 3 454 16 955 8 158 3 787 5 009 33 638Without earnings....................... 33 735......... 96 40 32 5 4 56 34 14 8 33 638With earnings ......................... 56 728......... 56 728 39 830 31 475 4 904 3 450 16 899 8 124 3 773 5 001 –
$1 to $2,499 or loss .................. 5 808......... 5 808 1 356 303 103 949 4 452 621 573 3 257 –$2,500 to $4,999 .................... 3 966......... 3 966 1 202 137 184 881 2 764 932 925 906 –$5,000 to $7,499 .................... 4 085......... 4 085 1 442 480 371 591 2 643 1 410 795 439 –$7,500 to $9,999 .................... 3 064......... 3 064 1 490 653 512 325 1 574 1 020 433 121 –$10,000 to $12,499 .................. 4 498......... 4 498 2 762 1 974 623 165 1 736 1 216 436 84 –$12,500 to $14,999 .................. 2 930......... 2 930 2 280 1 780 421 80 650 493 129 29 –$15,000 to $17,499 .................. 3 568......... 3 568 2 865 2 383 390 92 703 542 114 48 –$17,500 to $19,999 .................. 2 473......... 2 473 2 127 1 812 267 48 346 269 68 10 –$20,000 to $22,499 .................. 3 860......... 3 860 3 343 2 954 319 69 517 396 99 22 –$22,500 to $24,999 .................. 2 298......... 2 298 2 107 1 894 173 40 191 153 27 11 –
$25,000 to $29,999 .................. 5 063......... 5 063 4 635 4 206 360 69 428 363 42 23 –$30,000 to $34,999 .................. 4 056......... 4 056 3 781 3 395 347 39 275 230 37 8 –$35,000 to $39,999 .................. 2 905......... 2 905 2 725 2 495 206 24 180 132 43 5 –$40,000 to $44,999 .................. 2 223......... 2 223 2 108 1 885 198 24 115 101 11 2 –$45,000 to $49,999 .................. 1 335......... 1 335 1 254 1 100 141 12 81 66 7 8 –$50,000 to $54,999 .................. 1 283......... 1 283 1 218 1 093 118 6 66 58 7 – –$55,000 to $64,999 .................. 1 347......... 1 347 1 280 1 190 72 17 68 51 13 4 –$65,000 to $74,999 .................. 730......... 730 701 663 37 1 30 14 4 11 –$75,000 to $84,999 .................. 460......... 460 431 401 21 9 29 16 3 10 –$85,000 to $99,999 .................. 214......... 214 202 194 8 1 11 11 – – –$100,000 and over ................... 564......... 564 522 483 31 8 42 32 7 3 –
Median earnings dollars.......................... 17 951 17 951 23 744 26 243 16 522 4 703 6 167 10 162 6 221 1 919 (B)Standard error dollars.......................... 189 189 186 126 352 131 96 145 151 42 (B)
Mean earnings dollars........................... 22 583 22 583 28 077 31 378 21 246 7 678 9 634 13 711 8 991 3 498 (B)Standard error dollars.......................... 206 206 258 312 386 284 270 411 560 417 (B)
Gini ratio.............................. .462......... .462 .380 .338 .386 .540 .542 .447 .490 .590 (B)Standard error....................... .0054......... .0054 .0064 .0074 .0166 .0247 .0119 .0157 .0368 .0310 (B)
See footnotes at end of table.
40 INCOMEU.S. Census Bureau

Table 10. Work Experience in 1998 mTotal Money Earnings in 1998 of People 15 Years Old andOver by Race, Hispanic Origin, and Sex mCon.
[Numbers in thousands. People 15 years old and over as of March of the following year. For meaning of symbols, see text]
Total money earnings
Worked
Worked at full~time jobs Worked at part~time jobs
Total Total Total50 weeks
or more27 to 49
weeks26 weeks
or less Total50 weeks
or more27 to 49
weeks26 weeks
or lessDid not
work
FEMALEmCon.
Black
Total .............................. 13 964......... 8 916 6 903 5 459 726 717 2 014 827 473 714 5 047Without earnings....................... 5 047......... – – – – – – – – – 5 047With earnings ......................... 8 916......... 8 916 6 903 5 459 726 717 2 014 827 473 714 –
$1 to $2,499 or loss .................. 865......... 865 306 47 6 253 558 60 59 439 –$2,500 to $4,999 .................... 608......... 608 242 54 36 152 366 109 109 147 –$5,000 to $7,499 .................... 698......... 698 327 114 82 131 370 193 112 65 –$7,500 to $9,999 .................... 578......... 578 350 197 86 67 228 139 72 17 –$10,000 to $12,499 .................. 780......... 780 582 451 113 18 198 138 44 15 –$12,500 to $14,999 .................. 571......... 571 489 403 81 5 81 60 15 6 –$15,000 to $17,499 .................. 623......... 623 547 480 57 10 76 42 28 7 –$17,500 to $19,999 .................. 524......... 524 498 447 38 12 26 22 4 – –$20,000 to $22,499 .................. 613......... 613 586 517 49 20 27 21 6 – –$22,500 to $24,999 .................. 357......... 357 352 308 37 7 5 5 – – –
$25,000 to $29,999 .................. 681......... 681 653 574 53 26 28 13 9 6 –$30,000 to $34,999 .................. 580......... 580 560 517 31 11 20 11 9 – –$35,000 to $39,999 .................. 494......... 494 484 466 17 – 10 5 5 – –$40,000 to $44,999 .................. 271......... 271 266 256 9 2 4 – – 4 –$45,000 to $49,999 .................. 160......... 160 159 153 5 – 1 1 – – –$50,000 to $54,999 .................. 172......... 172 172 166 6 – – – – – –$55,000 to $64,999 .................. 173......... 173 162 144 17 1 11 8 – 4 –$65,000 to $74,999 .................. 100......... 100 98 98 – – 2 – – 2 –$75,000 to $84,999 .................. 38......... 38 38 38 – – – – – – –$85,000 to $99,999 .................. 10......... 10 10 10 – – – – – – –$100,000 and over ................... 21......... 21 21 17 2 2 – – – – –
Median earnings dollars.......................... 16 440 16 440 20 463 22 648 13 702 4 240 5 560 8 433 6 505 2 035 (B)Standard error dollars.......................... 318 318 297 431 695 369 254 434 407 128 (B)
Mean earnings dollars........................... 19 648 19 648 23 289 26 207 17 462 6 981 7 165 9 821 8 011 3 530 (B)Standard error dollars.......................... 296 296 339 356 1 071 811 297 461 531 457 (B)
Gini ratio.............................. .424......... .424 .360 .306 .363 .565 .478 .358 .406 .569 (B)Standard error....................... .0125......... .0125 .0141 .0157 .0492 .0711 .0339 .0492 .0634 .0933 (B)
Hispanic Origin 1
Total .............................. 11 058......... 6 246 4 691 3 480 585 626 1 555 743 268 543 4 813Without earnings....................... 4 818......... 5 3 3 – – 2 2 – – 4 813With earnings ......................... 6 240......... 6 240 4 687 3 476 585 626 1 553 741 268 543 –
$1 to $2,499 or loss .................. 648......... 648 231 32 8 191 417 56 18 343 –$2,500 to $4,999 .................... 524......... 524 220 21 37 163 304 97 77 130 –$5,000 to $7,499 .................... 621......... 621 330 104 68 158 291 164 79 47 –$7,500 to $9,999 .................... 477......... 477 332 185 106 41 145 104 36 6 –$10,000 to $12,499 .................. 773......... 773 605 478 108 19 168 132 29 7 –$12,500 to $14,999 .................. 467......... 467 415 352 51 12 53 45 5 3 –$15,000 to $17,499 .................. 503......... 503 456 403 39 13 47 40 4 3 –$17,500 to $19,999 .................. 305......... 305 266 239 26 1 39 30 9 – –$20,000 to $22,499 .................. 366......... 366 337 310 20 7 29 23 5 1 –$22,500 to $24,999 .................. 200......... 200 185 166 19 – 15 13 2 – –
$25,000 to $29,999 .................. 398......... 398 380 343 34 4 17 16 1 – –$30,000 to $34,999 .................. 317......... 317 309 278 27 4 8 8 – – –$35,000 to $39,999 .................. 199......... 199 191 169 21 2 8 6 2 1 –$40,000 to $44,999 .................. 137......... 137 135 124 7 4 1 1 – – –$45,000 to $49,999 .................. 80......... 80 79 74 2 3 1 1 – – –$50,000 to $54,999 .................. 65......... 65 62 55 6 2 3 3 – – –$55,000 to $64,999 .................. 85......... 85 84 78 4 1 1 – 1 – –$65,000 to $74,999 .................. 28......... 28 26 24 2 – 2 – – 2 –$75,000 to $84,999 .................. 17......... 17 17 17 – – – – – – –$85,000 to $99,999 .................. 6......... 6 4 4 – – 1 1 – – –$100,000 and over ................... 25......... 25 24 22 – 2 1 – – 1 –
Median earnings dollars.......................... 12 910 12 910 16 158 19 221 11 698 4 377 5 479 8 776 6 247 1 981 (B)Standard error dollars.......................... 354 354 315 517 468 322 284 549 432 142 (B)
Mean earnings dollars........................... 17 087 17 087 20 115 23 500 15 044 6 052 7 947 10 151 7 523 5 151 (B)Standard error dollars.......................... 545 545 546 688 748 600 1 370 491 640 3 834 (B)
Gini ratio.............................. .452......... .452 .393 .338 .353 .507 .529 .366 .365 .723 (B)Standard error....................... .0181......... .0181 .0196 .0236 .0531 .0678 .1110 .0482 .0869 .4129 (B)
1Hispanics may be of any race.
INCOME 41U.S. Census Bureau

Table 11. Source of Income in 1998 mNumber With Income and Mean Income of Specified Typein 1998 of People 15 Years Old and Over by Age
[Numbers in thousands. People 15 years old and over as of March of the following year. For meaning of symbols, see text]
Source of income
All races White Black Hispanic origin1
Number withincome
Mean income(dollars)
Number withincome
Mean income(dollars)
Number withincome
Mean income(dollars)
Number withincome
Mean income(dollars)
TOTAL, 15 YEARS AND OVER
Total 193 642.......................... 28 236 162 959 29 314 22 048 20 609 18 022 20 105
Earnings 146 141................................ 30 135 122 703 31 215 16 612 22 330 14 683 21 709Wages and salary 137 209...................... 29 849 114 717 30 914 16 110 22 375 14 058 21 660Nonfarm self~employment 12 110............... 24 081 10 787 24 818 771 13 114 790 17 559Farm self~employment 2 019.................. 8 267 1 868 8 634 101 3 563 58 (B)
Unemployment compensation 5 911............. 2 664 4 888 2 644 743 2 718 665 2 694State or local only 5 621...................... 2 601 4 669 2 575 681 2 683 646 2 532Combinations 290.......................... 3 875 219 4 116 62 (B) 19 (B)
Workers’ compensation 1 876................... 5 573 1 607 5 738 190 4 532 234 5 749State payments 804........................ 5 238 672 5 197 91 5 905 113 4 700Employment insurance 950.................. 5 978 826 6 371 96 3 360 110 6 529Own insurance 74......................... (B) 66 (B) – (B) 6 (B)Other 51................................. (B) 45 (B) 4 (B) 5 (B)
Social security 37 511........................... 8 534 32 854 8 686 3 810 7 433 2 079 7 184
SSI (supplemental security income) 4 899........ 4 554 3 241 4 408 1 373 4 714 667 4 530
Public assistance, total 3 150.................... 3 276 1 844 3 224 1 110 3 250 629 3 632AFDC only 2 238............................ 3 454 1 248 3 399 867 3 416 440 3 837Other assistance only 821................... 2 709 534 2 742 218 2 416 159 2 995Both 91.................................. 4 040 62 (B) 25 (B) 31 (B)
Veterans’ benefits 2 429........................ 7 766 2 097 7 639 273 9 236 97 8 637Disability only 1 255.......................... 5 635 1 093 5 119 126 10 188 43 (B)Survivors only 330......................... 6 733 285 7 101 42 (B) 17 (B)Pension only 515.......................... 11 215 429 11 128 74 (B) 18 (B)Education only 81......................... 3 026 66 (B) 15 (B) 5 (B)Other only 100............................. 8 288 92 8 479 4 (B) 3 (B)Combinations 146.......................... 18 236 130 19 735 12 (B) 11 (B)Means~tested 420.......................... 6 702 349 6 903 60 (B) 14 (B)Nonmeans~tested 2 009...................... 7 988 1 748 7 786 212 10 134 83 8 408
Survivors benefits 2 540........................ 10 543 2 333 10 650 164 10 101 59 (B)Company or union 1 131...................... 6 305 1 036 6 007 86 10 111 24 (B)Federal government 278.................... 11 633 242 12 040 26 (B) 1 (B)Military retirement 119...................... 8 363 103 8 181 10 (B) 4 (B)State or local government 213............... 8 086 189 8 329 20 (B) 11 (B)Railroad retirement 62..................... (B) 62 (B) – (B) 4 (B)Workers’ compensation 25................. (B) 22 (B) – (B) 1 (B)Black Lung 46............................ (B) 46 (B) – (B) – (B)Estates or trusts 307....................... 22 072 287 23 186 17 (B) 5 (B)Annuities 240.............................. 11 772 231 11 460 7 (B) 2 (B)Other or Don’t Know 240.................... 13 363 221 14 048 11 (B) 7 (B)
Disability benefits 1 594........................ 10 113 1 298 10 725 258 6 786 137 7 216Workers’ compensation 60................. (B) 52 (B) 7 (B) 9 (B)Company or union 485...................... 9 340 398 9 781 83 7 244 29 (B)Federal government 163.................... 10 575 133 10 372 25 (B) 18 (B)Military retirement 26...................... (B) 20 (B) 4 (B) 4 (B)State or local government 277............... 8 831 249 9 211 21 (B) 33 (B)Railroad retirement 29..................... (B) 26 (B) 3 (B) 2 (B)Accident insurance 215..................... 15 378 188 16 547 27 (B) 13 (B)Black Lung 13............................ (B) 5 (B) 8 (B) – (B)Temporary insurance 8................... (B) 8 (B) – (B) – (B)Other or Don’t Know 364.................... 7 471 259 7 598 86 6 626 33 (B)
Pensions 15 315................................ 12 975 13 745 13 120 1 229 11 305 433 11 412Company or union 9 592...................... 9 876 8 737 9 988 700 8 614 274 8 459Federal government 1 383.................... 21 141 1 220 21 496 111 17 458 53 (B)Military retirement 904...................... 18 520 752 19 229 109 14 008 36 (B)State or local government 2 855............... 14 765 2 531 15 029 249 12 741 54 (B)Railroad retirement 285..................... 12 044 250 12 505 34 (B) 5 (B)Annuities 267.............................. 10 068 248 10 244 14 (B) – (B)IRA, KEOGH, or 401(k) 446................. 12 101 409 12 019 29 (B) 3 (B)Other or Don’t Know 358.................... 11 356 329 10 769 11 (B) 14 (B)
Interest 104 563................................. 1 775 94 162 1 826 6 195 1 163 4 996 919
Dividends 39 396............................... 2 956 36 461 2 953 1 493 3 392 966 2 552
Rents, royalties, estates or trusts 12 633........... 4 109 11 436 4 126 642 3 915 579 2 102
Education 7 801............................... 4 121 6 160 4 055 1 171 3 759 560 3 695Pell grant only 1 418......................... 1 987 1 027 1 904 315 2 050 177 1 732Other government only 1 212................. 4 514 937 4 497 212 4 460 101 3 654Scholarships only 2 002...................... 4 787 1 684 4 737 210 3 596 130 4 801Other only 1 576............................. 3 126 1 346 2 881 144 4 582 55 (B)Combinations 1 593.......................... 5 869 1 166 5 967 290 4 812 96 5 802
Child support 5 206............................ 3 675 4 281 3 938 763 2 384 442 3 088
Alimony 424................................. 9 675 397 10 054 15 (B) 21 (B)
Financial assistance 2 022...................... 5 195 1 518 5 117 242 3 193 174 5 058
Other income 1 412............................ 3 114 1 210 2 915 105 5 134 80 3 811Combinations of income types:
Government transfer payments 55 296.......... 9 112 46 312 9 441 7 214 7 327 4 180 6 476Public assistance or SSI 7 664................ 4 257 4 846 4 175 2 348 4 292 1 239 4 282Social security or railroad retirement 37 786...... 8 591 33 104 8 746 3 835 7 468 2 085 7 221Company or union pension2 10 997............. 9 675 9 979 9 758 849 8 837 326 8 191Military retirement2 1 045..................... 17 154 871 17 765 124 13 474 44 (B)Federal government retirement2 1 785.......... 19 157 1 559 19 572 158 14 650 71 (B)State or local retirement2 3 307................ 14 012 2 934 14 284 286 11 951 98 10 218Property income3 109 630...................... 3 288 98 612 3 380 6 534 2 281 5 245 1 598Child support or alimony 5 485................ 4 236 4 541 4 591 778 2 397 452 3 279Rents, royalties, estates, or trusts3 12 859....... 4 563 11 645 4 622 659 3 994 584 2 268
See footnotes at end of table.
42 INCOMEU.S. Census Bureau

Table 11. Source of Income in 1998 mNumber With Income and Mean Income of Specified Typein 1998 of People 15 Years Old and Over by Age mCon.
[Numbers in thousands. People 15 years old and over as of March of the following year. For meaning of symbols, see text]
Source of income
All races White Black Hispanic origin1
Number withincome
Mean income(dollars)
Number withincome
Mean income(dollars)
Number withincome
Mean income(dollars)
Number withincome
Mean income(dollars)
UNDER 65
Total 161 948.......................... 29 695 134 689 30 949 19 445 21 565 16 454 20 770
Earnings 140 989................................ 30 387 118 036 31 505 16 263 22 518 14 464 21 702Wages and salary 132 977...................... 30 058 110 936 31 150 15 783 22 548 13 863 21 623Nonfarm self~employment 11 235............... 24 216 9 950 24 969 746 13 384 762 18 052Farm self~employment 1 831.................. 8 266 1 684 8 698 101 3 563 58 (B)
Unemployment compensation 5 767............. 2 647 4 768 2 631 731 2 671 653 2 672State or local only 5 489...................... 2 593 4 555 2 560 671 2 689 636 2 514Combinations 278.......................... 3 730 213 4 132 60 (B) 17 (B)
Workers’ compensation 1 793................... 5 450 1 529 5 604 186 4 501 232 5 790State payments 766........................ 5 101 636 5 049 88 5 787 111 4 765Employment insurance 908.................. 5 869 786 6 251 94 3 424 110 6 529Own insurance 74......................... (B) 66 (B) – (B) 6 (B)Other 48................................. (B) 42 (B) 4 (B) 5 (B)
Social security 8 540........................... 7 399 6 816 7 567 1 474 6 821 775 6 843
SSI (supplemental security income) 3 666........ 4 938 2 421 4 792 1 085 5 183 418 5 167
Public assistance, total 3 076.................... 3 285 1 798 3 242 1 090 3 248 616 3 666AFDC only 2 212............................ 3 446 1 239 3 397 854 3 417 440 3 837Other assistance only 773................... 2 734 496 2 779 211 2 385 145 3 080Both 91.................................. 4 040 62 (B) 25 (B) 31 (B)
Veterans’ benefits 1 336........................ 8 120 1 106 7 708 188 11 145 65 (B)Disability only 732.......................... 5 799 613 4 786 88 13 152 31 (B)Survivors only 132......................... 6 141 114 6 329 17 (B) 7 (B)Pension only 227.......................... 13 061 162 13 242 55 (B) 10 (B)Education only 81......................... 3 026 66 (B) 15 (B) 5 (B)Other only 60............................. (B) 56 (B) 4 (B) 2 (B)Combinations 102.......................... 19 544 92 20 908 10 (B) 9 (B)Means~tested 239.......................... 6 567 192 6 602 38 (B) 10 (B)Nonmeans~tested 1 097...................... 8 459 914 7 940 150 12 179 55 (B)
Survivors benefits 918........................ 15 641 803 16 848 96 7 521 28 (B)Company or union 306...................... 9 247 257 9 871 46 (B) 11 (B)Federal government 72.................... (B) 57 (B) 11 (B) 1 (B)Military retirement 29...................... (B) 25 (B) 2 (B) 4 (B)State or local government 67............... (B) 53 (B) 13 (B) – (B)Railroad retirement 13..................... (B) 13 (B) – (B) – (B)Workers’ compensation 12................. (B) 10 (B) – (B) 1 (B)Black Lung –............................ (B) – (B) – (B) – (B)Estates or trusts 243....................... 21 612 226 22 639 15 (B) 5 (B)Annuities 83.............................. 21 503 79 21 048 3 (B) 2 (B)Other or Don’t Know 127.................... 21 053 112 23 102 9 (B) 5 (B)
Disability benefits 1 363........................ 10 049 1 109 10 742 218 6 590 119 7 235Workers’ compensation 45................. (B) 38 (B) 7 (B) 7 (B)Company or union 417...................... 9 287 344 9 649 69 (B) 26 (B)Federal government 122.................... 9 023 99 9 164 19 (B) 14 (B)Military retirement 19...................... (B) 14 (B) 4 (B) 4 (B)State or local government 245............... 8 949 216 9 401 21 (B) 29 (B)Railroad retirement 26..................... (B) 23 (B) 3 (B) 2 (B)Accident insurance 201..................... 15 561 176 16 760 25 (B) 12 (B)Black Lung –............................ (B) – (B) – (B) – (B)Temporary insurance 8................... (B) 8 (B) – (B) – (B)Other or Don’t Know 314.................... 7 577 221 7 944 75 5 992 27 (B)
Pensions 4 874................................ 16 020 4 157 16 416 579 13 077 168 14 685Company or union 2 571...................... 13 130 2 224 13 440 293 10 289 92 11 290Federal government 413.................... 22 553 351 23 154 50 (B) 22 (B)Military retirement 586...................... 17 755 459 18 655 90 12 763 26 (B)State or local government 1 028............... 17 681 898 18 162 109 14 621 21 (B)Railroad retirement 27..................... (B) 21 (B) 6 (B) – (B)Annuities 59.............................. (B) 57 (B) – (B) – (B)IRA, KEOGH, or 401(k) 185................. 17 043 150 17 798 27 (B) 3 (B)Other or Don’t Know 138.................... 14 564 121 13 087 8 (B) 8 (B)
Interest 84 727................................. 1 275 75 383 1 297 5 539 1 015 4 507 742
Dividends 32 362............................... 2 532 29 658 2 501 1 416 3 227 902 2 210
Rents, royalties, estates or trusts 9 610........... 3 489 8 580 3 554 536 2 934 475 1 745
Education 7 766............................... 4 118 6 125 4 051 1 171 3 759 560 3 695Pell grant only 1 417......................... 1 988 1 026 1 904 315 2 050 177 1 732Other government only 1 192................. 4 485 916 4 459 212 4 460 101 3 654Scholarships only 1 996...................... 4 791 1 678 4 741 210 3 596 130 4 801Other only 1 571............................. 3 132 1 341 2 888 144 4 582 55 (B)Combinations 1 591.......................... 5 870 1 164 5 969 290 4 812 96 5 802
Child support 5 196............................ 3 680 4 272 3 944 762 2 384 442 3 088
Alimony 374................................. 9 388 346 9 800 15 (B) 21 (B)
Financial assistance 1 885...................... 5 273 1 420 5 202 239 3 206 156 5 355
Other income 1 103............................ 3 076 927 2 806 90 5 390 74 (B)Combinations of income types:
Government transfer payments 25 109.......... 6 931 19 310 7 154 4 741 6 253 2 735 5 466Public assistance or SSI 6 390................ 4 415 4 003 4 354 2 047 4 475 987 4 475Social security or railroad retirement 8 604...... 7 449 6 870 7 623 1 483 6 854 777 6 872Company or union pension2 3 239............. 12 491 2 782 12 849 396 9 604 128 10 001Military retirement2 634..................... 17 041 497 17 926 96 12 242 33 (B)Federal government retirement2 600.......... 18 445 504 19 104 77 15 141 37 (B)State or local retirement2 1 326................ 15 908 1 158 16 374 139 12 976 50 (B)Property income3 88 960...................... 2 570 79 064 2 623 5 833 2 037 4 726 1 327Child support or alimony 5 425................ 4 171 4 482 4 517 777 2 398 452 3 279Rents, royalties, estates, or trusts3 9 792....... 3 960 8 746 4 072 551 3 065 480 1 950
See footnotes at end of table.
INCOME 43U.S. Census Bureau

Table 11. Source of Income in 1998 mNumber With Income and Mean Income of Specified Typein 1998 of People 15 Years Old and Over by Age mCon.
[Numbers in thousands. People 15 years old and over as of March of the following year. For meaning of symbols, see text]
Source of income
All races White Black Hispanic origin1
Number withincome
Mean income(dollars)
Number withincome
Mean income(dollars)
Number withincome
Mean income(dollars)
Number withincome
Mean income(dollars)
UNDER 65mCon.
15 to 24 YearsTotal 27 954.......................... 10 818 22 977 11 111 3 587 8 945 3 516 11 925
Earnings 24 563................................ 10 666 20 428 10 938 2 978 8 889 3 120 12 283Wages and salary 24 237...................... 10 609 20 166 10 875 2 942 8 899 3 082 12 278Nonfarm self~employment 622............... 7 076 529 7 038 65 (B) 73 (B)Farm self~employment 136.................. 3 265 127 3 383 6 (B) 15 (B)
Unemployment compensation 513............. 1 775 405 1 572 87 2 566 85 2 052State or local only 497...................... 1 773 389 1 562 87 2 566 80 1 901Combinations 15.......................... (B) 15 (B) – (B) 5 (B)
Workers’ compensation 117................... 1 488 108 1 450 3 (B) 11 (B)State payments 59........................ (B) 56 (B) – (B) 5 (B)Employment insurance 57.................. (B) 50 (B) 3 (B) 5 (B)Own insurance 1......................... (B) 1 (B) – (B) 1 (B)Other –................................. (B) – (B) – (B) – (B)
Social security 880........................... 4 441 646 4 703 197 3 685 108 4 865
SSI (supplemental security income) 445........ 4 627 296 4 586 132 4 570 62 (B)
Public assistance, total 813.................... 2 551 457 2 615 307 2 397 151 2 946AFDC only 604............................ 2 767 348 2 860 230 2 489 107 3 220Other assistance only 184................... 1 766 93 1 629 72 (B) 32 (B)Both 26.................................. (B) 17 (B) 5 (B) 11 (B)
Veterans’ benefits 27........................ (B) 24 (B) 1 (B) 4 (B)Disability only 6.......................... (B) 4 (B) – (B) 4 (B)Survivors only 4......................... (B) 3 (B) – (B) – (B)Pension only –.......................... (B) – (B) – (B) – (B)Education only 11......................... (B) 11 (B) – (B) – (B)Other only 4............................. (B) 4 (B) – (B) – (B)Combinations 2.......................... (B) 1 (B) 1 (B) – (B)Means~tested 7.......................... (B) 6 (B) 1 (B) 2 (B)Nonmeans~tested 20...................... (B) 18 (B) – (B) 2 (B)
Survivors benefits 64........................ (B) 47 (B) 12 (B) 3 (B)Company or union 9...................... (B) 9 (B) – (B) 2 (B)Federal government 6.................... (B) 4 (B) 2 (B) 1 (B)Military retirement –...................... (B) – (B) – (B) – (B)State or local government –............... (B) – (B) – (B) – (B)Railroad retirement 5..................... (B) 5 (B) – (B) – (B)Workers’ compensation 4................. (B) 4 (B) – (B) – (B)Black Lung –............................ (B) – (B) – (B) – (B)Estates or trusts 25....................... (B) 16 (B) 9 (B) – (B)Annuities 5.............................. (B) 4 (B) 1 (B) – (B)Other or Don’t Know 10.................... (B) 5 (B) – (B) – (B)
Disability benefits 41........................ (B) 35 (B) 4 (B) 14 (B)Workers’ compensation –................. (B) – (B) – (B) – (B)Company or union 7...................... (B) 7 (B) – (B) 2 (B)Federal government –.................... (B) – (B) – (B) – (B)Military retirement 1...................... (B) – (B) – (B) – (B)State or local government 3............... (B) – (B) 3 (B) – (B)Railroad retirement –..................... (B) – (B) – (B) – (B)Accident insurance 3..................... (B) 3 (B) – (B) – (B)Black Lung –............................ (B) – (B) – (B) – (B)Temporary insurance –................... (B) – (B) – (B) – (B)Other or Don’t Know 27.................... (B) 25 (B) 2 (B) 11 (B)
Pensions 22................................ (B) 11 (B) 10 (B) 4 (B)Company or union 14...................... (B) 4 (B) 10 (B) – (B)Federal government –.................... (B) – (B) – (B) – (B)Military retirement –...................... (B) – (B) – (B) – (B)State or local government –............... (B) – (B) – (B) – (B)Railroad retirement –..................... (B) – (B) – (B) – (B)Annuities –.............................. (B) – (B) – (B) – (B)IRA, KEOGH, or 401(k) –................. (B) – (B) – (B) – (B)Other or Don’t Know 7.................... (B) 7 (B) – (B) 4 (B)
Interest 8 676................................. 393 7 787 392 466 512 509 173
Dividends 1 848............................... 1 284 1 711 1 327 64 (B) 56 (B)
Rents, royalties, estates or trusts 211........... 2 242 203 2 359 8 (B) 10 (B)
Education 4 267............................... 4 240 3 403 4 231 604 3 842 361 3 801Pell grant only 871......................... 2 038 585 1 998 220 2 125 112 1 721Other government only 515................. 4 020 409 3 954 77 4 900 58 (B)Scholarships only 1 499...................... 4 537 1 330 4 650 113 3 246 101 5 000Other only 334............................. 4 038 294 3 489 22 (B) 19 (B)Combinations 1 047.......................... 5 818 785 5 610 173 5 464 71 (B)
Child support 531............................ 2 006 414 2 131 102 1 518 63 (B)
Alimony 1................................. (B) 1 (B) – (B) 1 (B)
Financial assistance 792...................... 5 023 608 4 665 88 3 250 64 (B)
Other income 156............................ 1 311 119 1 316 15 (B) 20 (B)Combinations of income types:
Government transfer payments 3 838.......... 3 390 2 695 3 411 929 3 404 555 3 370Public assistance or SSI 1 213................ 3 406 731 3 493 417 3 212 210 3 534Social security or railroad retirement 885...... 4 428 650 4 683 197 3 685 108 4 865Company or union pension2 30............. (B) 20 (B) 10 (B) 4 (B)Military retirement2 1..................... (B) – (B) – (B) – (B)Federal government retirement2 6.......... (B) 4 (B) 2 (B) 1 (B)State or local retirement2 3................ (B) – (B) 3 (B) – (B)Property income3 9 170...................... 736 8 233 757 493 660 524 279Child support or alimony 533................ 2 002 415 2 125 102 1 518 64 (B)Rents, royalties, estates, or trusts3 237....... 4 106 219 4 158 17 (B) 10 (B)
See footnotes at end of table.
44 INCOMEU.S. Census Bureau

Table 11. Source of Income in 1998 mNumber With Income and Mean Income of Specified Typein 1998 of People 15 Years Old and Over by Age mCon.
[Numbers in thousands. People 15 years old and over as of March of the following year. For meaning of symbols, see text]
Source of income
All races White Black Hispanic origin1
Number withincome
Mean income(dollars)
Number withincome
Mean income(dollars)
Number withincome
Mean income(dollars)
Number withincome
Mean income(dollars)
UNDER 65mCon.
25 to 44 YearsTotal 78 612.......................... 31 557 64 337 32 841 10 168 23 524 8 893 22 587
Earnings 71 917................................ 32 209 59 194 33 387 9 058 24 261 8 170 23 159Wages and salary 68 067...................... 31 893 55 789 33 016 8 800 24 378 7 816 23 102Nonfarm self~employment 5 663............... 24 582 5 025 25 541 381 13 066 445 18 802Farm self~employment 789.................. 8 047 708 8 533 51 (B) 28 (B)
Unemployment compensation 3 308............. 2 509 2 711 2 484 451 2 652 385 2 584State or local only 3 137...................... 2 488 2 590 2 446 406 2 733 377 2 495Combinations 171.......................... 2 889 121 3 296 45 (B) 8 (B)
Workers’ compensation 998................... 5 264 839 5 459 115 4 354 145 5 336State payments 469........................ 5 278 389 5 308 57 (B) 74 (B)Employment insurance 463.................. 5 295 397 5 760 54 (B) 65 (B)Own insurance 48......................... (B) 39 (B) – (B) 2 (B)Other 21................................. (B) 16 (B) 4 (B) 4 (B)
Social security 1 706........................... 6 742 1 300 6 917 359 6 333 186 7 025
SSI (supplemental security income) 1 588........ 4 927 998 4 808 536 5 159 172 5 175
Public assistance, total 1 776.................... 3 616 1 021 3 551 660 3 660 377 3 983AFDC only 1 361............................ 3 738 743 3 692 553 3 828 288 4 091Other assistance only 364................... 3 028 244 3 016 92 2 392 73 (B)Both 51.................................. (B) 35 (B) 16 (B) 16 (B)
Veterans’ benefits 342........................ 5 715 281 6 292 54 (B) 25 (B)Disability only 195.......................... 4 474 173 4 601 19 (B) 9 (B)Survivors only 14......................... (B) 12 (B) 3 (B) 6 (B)Pension only 38.......................... (B) 20 (B) 13 (B) 1 (B)Education only 57......................... (B) 43 (B) 14 (B) 5 (B)Other only 9............................. (B) 7 (B) 2 (B) 2 (B)Combinations 26.......................... (B) 23 (B) 3 (B) 2 (B)Means~tested 44.......................... (B) 28 (B) 16 (B) 2 (B)Nonmeans~tested 298...................... 6 045 253 6 620 37 (B) 23 (B)
Survivors benefits 239........................ 16 496 200 18 849 33 (B) 9 (B)Company or union 41...................... (B) 30 (B) 11 (B) 3 (B)Federal government 28.................... (B) 18 (B) 7 (B) – (B)Military retirement 2...................... (B) 1 (B) – (B) – (B)State or local government 2............... (B) 2 (B) – (B) – (B)Railroad retirement –..................... (B) – (B) – (B) – (B)Workers’ compensation 2................. (B) 2 (B) – (B) – (B)Black Lung –............................ (B) – (B) – (B) – (B)Estates or trusts 93....................... 20 351 85 21 437 6 (B) 2 (B)Annuities 21.............................. (B) 18 (B) 2 (B) – (B)Other or Don’t Know 52.................... (B) 46 (B) 6 (B) 4 (B)
Disability benefits 503........................ 9 042 391 9 429 95 7 305 46 (B)Workers’ compensation 22................. (B) 17 (B) 5 (B) 5 (B)Company or union 116...................... 8 941 96 8 265 17 (B) 5 (B)Federal government 48.................... (B) 34 (B) 11 (B) 6 (B)Military retirement 7...................... (B) 6 (B) 2 (B) – (B)State or local government 106............... 5 888 100 5 961 – (B) 18 (B)Railroad retirement 3..................... (B) – (B) 3 (B) – (B)Accident insurance 79..................... 16 848 67 (B) 12 (B) 6 (B)Black Lung –............................ (B) – (B) – (B) – (B)Temporary insurance 4................... (B) 4 (B) – (B) – (B)Other or Don’t Know 137.................... 6 579 83 6 515 47 (B) 8 (B)
Pensions 581................................ 10 732 444 11 116 114 9 167 44 (B)Company or union 267...................... 8 163 216 8 521 42 (B) 24 (B)Federal government 15.................... (B) 15 (B) – (B) 6 (B)Military retirement 119...................... 13 147 78 13 863 32 (B) 9 (B)State or local government 70............... (B) 54 (B) 16 (B) 4 (B)Railroad retirement –..................... (B) – (B) – (B) – (B)Annuities 7.............................. (B) 7 (B) – (B) – (B)IRA, KEOGH, or 401(k) 71................. (B) 46 (B) 22 (B) 1 (B)Other or Don’t Know 43.................... (B) 39 (B) – (B) 2 (B)
Interest 41 464................................. 820 36 309 828 3 066 696 2 569 603
Dividends 15 328............................... 1 864 13 832 1 869 795 2 153 509 1 565
Rents, royalties, estates or trusts 3 698........... 3 029 3 231 3 046 244 1 875 208 1 410
Education 3 017............................... 4 136 2 319 4 011 509 3 565 188 3 552Pell grant only 495......................... 1 872 397 1 738 89 1 811 61 (B)Other government only 554................. 5 287 421 5 344 112 4 116 43 (B)Scholarships only 446...................... 5 629 303 5 095 93 4 025 28 (B)Other only 1 024............................. 2 960 857 2 802 103 3 904 35 (B)Combinations 498.......................... 6 188 341 7 087 113 3 709 22 (B)
Child support 3 926............................ 3 786 3 243 4 047 569 2 520 343 3 201
Alimony 180................................. 6 011 164 6 070 8 (B) 9 (B)
Financial assistance 819...................... 5 540 601 5 589 123 3 560 58 (B)
Other income 515............................ 3 159 430 2 690 44 (B) 39 (B)Combinations of income types:
Government transfer payments 9 410.......... 4 960 6 990 4 939 2 035 5 067 1 219 4 904Public assistance or SSI 3 159................ 4 510 1 898 4 439 1 116 4 645 512 4 674Social security or railroad retirement 1 709...... 6 738 1 300 6 917 363 6 319 186 7 025Company or union pension2 424............. 8 011 342 8 185 70 (B) 33 (B)Military retirement2 128..................... 12 698 85 13 324 34 (B) 9 (B)Federal government retirement2 90.......... 14 884 66 (B) 18 (B) 10 (B)State or local retirement2 178................ 6 298 156 6 778 16 (B) 21 (B)Property income3 43 452...................... 1 738 38 016 1 774 3 215 1 354 2 691 999Child support or alimony 4 001................ 3 985 3 307 4 270 577 2 544 346 3 232Rents, royalties, estates, or trusts3 3 772....... 3 469 3 299 3 538 251 2 031 210 1 633
See footnotes at end of table.
INCOME 45U.S. Census Bureau

Table 11. Source of Income in 1998 mNumber With Income and Mean Income of Specified Typein 1998 of People 15 Years Old and Over by Age mCon.
[Numbers in thousands. People 15 years old and over as of March of the following year. For meaning of symbols, see text]
Source of income
All races White Black Hispanic origin1
Number withincome
Mean income(dollars)
Number withincome
Mean income(dollars)
Number withincome
Mean income(dollars)
Number withincome
Mean income(dollars)
UNDER 65mCon.
45 to 64 YearsTotal 55 382.......................... 36 581 47 375 38 001 5 691 26 018 4 045 24 466
Earnings 44 509................................ 38 325 38 414 39 541 4 227 28 383 3 173 27 213Wages and salary 40 674...................... 38 576 34 981 39 862 4 041 28 496 2 965 27 437Nonfarm self~employment 4 950............... 25 951 4 396 26 472 300 15 702 245 20 252Farm self~employment 906.................. 9 207 849 9 632 44 (B) 14 (B)
Unemployment compensation 1 946............. 3 113 1 652 3 131 193 2 762 183 3 144State or local only 1 854...................... 2 989 1 576 2 996 178 2 647 178 2 829Combinations 92.......................... 5 613 77 5 912 15 (B) 5 (B)
Workers’ compensation 678................... 6 408 582 6 580 68 (B) 77 7 120State payments 238........................ 5 771 191 5 711 31 (B) 32 (B)Employment insurance 388.................. 7 118 339 7 462 37 (B) 41 (B)Own insurance 25......................... (B) 25 (B) – (B) 2 (B)Other 26................................. (B) 26 (B) – (B) 2 (B)
Social security 5 954........................... 8 024 4 870 8 120 918 7 683 481 7 216
SSI (supplemental security income) 1 633........ 5 033 1 127 4 832 416 5 409 183 5 295
Public assistance, total 487.................... 3 304 319 3 151 122 3 163 87 3 537AFDC only 248............................ 3 501 149 3 184 71 (B) 45 (B)Other assistance only 224................... 3 050 160 3 083 47 (B) 40 (B)Both 15.................................. (B) 10 (B) 4 (B) 3 (B)
Veterans’ benefits 967........................ 9 106 801 8 340 134 14 603 36 (B)Disability only 531.......................... 6 341 435 4 892 69 (B) 18 (B)Survivors only 114......................... 5 860 99 6 036 14 (B) 1 (B)Pension only 189.......................... 14 222 142 13 588 41 (B) 8 (B)Education only 13......................... (B) 12 (B) 1 (B) – (B)Other only 46............................. (B) 45 (B) 2 (B) – (B)Combinations 74.......................... (B) 68 (B) 6 (B) 8 (B)Means~tested 189.......................... 7 398 158 7 344 21 (B) 6 (B)Nonmeans~tested 778...................... 9 520 643 8 586 112 15 569 30 (B)
Survivors benefits 614........................ 15 049 556 15 872 51 (B) 16 (B)Company or union 255...................... 10 266 218 10 773 34 (B) 6 (B)Federal government 38.................... (B) 35 (B) 2 (B) – (B)Military retirement 27...................... (B) 24 (B) 1 (B) 4 (B)State or local government 65............... (B) 51 (B) 13 (B) – (B)Railroad retirement 8..................... (B) 8 (B) – (B) – (B)Workers’ compensation 7................. (B) 4 (B) – (B) 1 (B)Black Lung –............................ (B) – (B) – (B) – (B)Estates or trusts 125....................... 22 918 125 22 918 – (B) 2 (B)Annuities 57.............................. (B) 57 (B) – (B) 2 (B)Other or Don’t Know 65.................... (B) 61 (B) 3 (B) 1 (B)
Disability benefits 818........................ 10 855 683 11 694 119 6 138 59 (B)Workers’ compensation 24................. (B) 22 (B) 2 (B) 3 (B)Company or union 294...................... 9 615 241 10 447 52 (B) 19 (B)Federal government 74.................... (B) 65 (B) 8 (B) 9 (B)Military retirement 11...................... (B) 8 (B) 3 (B) 4 (B)State or local government 137............... 11 383 117 12 348 18 (B) 11 (B)Railroad retirement 23..................... (B) 23 (B) – (B) 2 (B)Accident insurance 119..................... 15 101 106 16 251 13 (B) 6 (B)Black Lung –............................ (B) – (B) – (B) – (B)Temporary insurance 4................... (B) 4 (B) – (B) – (B)Other or Don’t Know 150.................... 8 304 113 8 721 26 (B) 7 (B)
Pensions 4 271................................ 16 774 3 702 17 066 454 14 223 120 14 379Company or union 2 290...................... 13 749 2 004 13 978 241 11 110 68 (B)Federal government 398.................... 21 588 336 22 040 50 (B) 16 (B)Military retirement 467...................... 18 931 381 19 634 58 (B) 17 (B)State or local government 957............... 18 492 843 18 817 92 16 785 17 (B)Railroad retirement 27..................... (B) 21 (B) 6 (B) – (B)Annuities 52.............................. (B) 49 (B) – (B) – (B)IRA, KEOGH, or 401(k) 114................. 22 575 105 23 473 5 (B) 2 (B)Other or Don’t Know 88.................... 14 396 75 11 489 7 (B) 2 (B)
Interest 34 587................................. 2 043 31 287 2 065 2 008 1 620 1 428 1 194
Dividends 15 186............................... 3 359 14 115 3 262 557 5 084 337 3 460
Rents, royalties, estates or trusts 5 700........... 3 834 5 146 3 921 284 3 943 257 1 979
Education 482............................... 2 925 404 2 766 58 (B) 10 (B)Pell grant only 51......................... (B) 44 (B) 6 (B) 4 (B)Other government only 122................. 2 811 86 2 545 24 (B) – (B)Scholarships only 50...................... (B) 45 (B) 4 (B) 1 (B)Other only 212............................. 2 537 191 2 344 19 (B) 2 (B)Combinations 46.......................... (B) 38 (B) 4 (B) 3 (B)
Child support 739............................ 4 316 615 4 621 90 2 509 36 (B)
Alimony 193................................. 12 595 181 13 243 7 (B) 11 (B)
Financial assistance 274...................... 5 197 211 5 646 28 (B) 34 (B)
Other income 433............................ 3 613 377 3 411 30 (B) 14 (B)Combinations of income types:
Government transfer payments 11 862.......... 9 639 9 626 9 810 1 777 9 101 961 7 390Public assistance or SSI 2 017................ 4 871 1 374 4 695 514 5 130 265 4 837Social security or railroad retirement 6 010...... 8 095 4 919 8 198 924 7 739 483 7 261Company or union pension2 2 785............. 13 263 2 420 13 587 316 10 207 91 10 991Military retirement2 504..................... 18 183 412 18 877 62 (B) 24 (B)Federal government retirement2 504.......... 19 263 434 19 404 57 (B) 25 (B)State or local retirement2 1 145................ 17 429 1 002 17 870 120 14 600 29 (B)Property income3 36 338...................... 4 028 32 815 4 074 2 126 3 388 1 512 2 275Child support or alimony 891................ 6 302 760 6 895 98 2 455 42 (B)Rents, royalties, estates, or trusts3 5 783....... 4 273 5 229 4 405 284 3 943 260 2 177
See footnotes at end of table.
46 INCOMEU.S. Census Bureau

Table 11. Source of Income in 1998 mNumber With Income and Mean Income of Specified Typein 1998 of People 15 Years Old and Over by Age mCon.
[Numbers in thousands. People 15 years old and over as of March of the following year. For meaning of symbols, see text]
Source of income
All races White Black Hispanic origin1
Number withincome
Mean income(dollars)
Number withincome
Mean income(dollars)
Number withincome
Mean income(dollars)
Number withincome
Mean income(dollars)
65 YEARS AND OVER
Total 31 694.......................... 20 777 28 271 21 526 2 603 13 474 1 568 13 127
Earnings 5 151................................ 23 245 4 667 23 897 348 13 546 220 22 122Wages and salary 4 232...................... 23 308 3 781 24 006 327 14 043 195 24 336Nonfarm self~employment 875............... 22 343 837 23 030 25 (B) 28 (B)Farm self~employment 188.................. 8 274 184 8 047 – (B) – (B)
Unemployment compensation 144............. 3 309 120 3 186 12 (B) 12 (B)State or local only 132...................... 2 952 114 3 165 10 (B) 11 (B)Combinations 12.......................... (B) 6 (B) 1 (B) 2 (B)
Workers’ compensation 83................... 8 219 78 8 366 5 (B) 2 (B)State payments 38........................ (B) 35 (B) 3 (B) 2 (B)Employment insurance 42.................. (B) 40 (B) 2 (B) – (B)Own insurance –......................... (B) – (B) – (B) – (B)Other 3................................. (B) 3 (B) – (B) – (B)
Social security 28 971........................... 8 869 26 038 8 979 2 336 7 819 1 304 7 386
SSI (supplemental security income) 1 233........ 3 411 820 3 275 288 2 951 249 3 460
Public assistance, total 74.................... (B) 47 (B) 20 (B) 13 (B)AFDC only 25............................ (B) 9 (B) 13 (B) – (B)Other assistance only 49................... (B) 38 (B) 7 (B) 13 (B)Both –.................................. (B) – (B) – (B) – (B)
Veterans’ benefits 1 093........................ 7 333 992 7 562 85 4 993 32 (B)Disability only 523.......................... 5 405 479 5 544 38 (B) 12 (B)Survivors only 199......................... 7 126 171 7 616 25 (B) 10 (B)Pension only 288.......................... 9 756 266 9 840 19 (B) 8 (B)Education only –......................... (B) – (B) – (B) – (B)Other only 40............................. (B) 37 (B) – (B) 1 (B)Combinations 44.......................... (B) 38 (B) 2 (B) 1 (B)Means~tested 181.......................... 6 880 157 7 270 22 (B) 5 (B)Nonmeans~tested 912...................... 7 422 834 7 617 63 (B) 28 (B)
Survivors benefits 1 623........................ 7 660 1 530 7 401 68 (B) 30 (B)Company or union 826...................... 5 216 779 4 729 40 (B) 13 (B)Federal government 206.................... 12 525 185 12 640 15 (B) – (B)Military retirement 90...................... 8 391 78 8 046 9 (B) 1 (B)State or local government 146............... 6 760 136 6 980 7 (B) 11 (B)Railroad retirement 49..................... (B) 49 (B) – (B) 4 (B)Workers’ compensation 12................. (B) 12 (B) – (B) – (B)Black Lung 46............................ (B) 46 (B) – (B) – (B)Estates or trusts 64....................... (B) 61 (B) 2 (B) – (B)Annuities 157.............................. 6 642 152 6 478 4 (B) – (B)Other or Don’t Know 112.................... 4 626 109 4 727 2 (B) 1 (B)
Disability benefits 231........................ 10 492 189 10 620 40 (B) 18 (B)Workers’ compensation 14................. (B) 14 (B) – (B) 2 (B)Company or union 68...................... (B) 54 (B) 15 (B) 2 (B)Federal government 41.................... (B) 34 (B) 5 (B) 3 (B)Military retirement 6...................... (B) 6 (B) – (B) – (B)State or local government 32............... (B) 32 (B) – (B) 4 (B)Railroad retirement 3..................... (B) 3 (B) – (B) – (B)Accident insurance 14..................... (B) 12 (B) 2 (B) 1 (B)Black Lung 13............................ (B) 5 (B) 8 (B) – (B)Temporary insurance –................... (B) – (B) – (B) – (B)Other or Don’t Know 49.................... (B) 38 (B) 11 (B) 6 (B)
Pensions 10 441................................ 11 554 9 588 11 691 649 9 723 265 9 329Company or union 7 021...................... 8 684 6 513 8 810 407 7 406 182 7 035Federal government 970.................... 20 540 869 20 825 61 (B) 31 (B)Military retirement 318...................... 19 929 294 20 126 20 (B) 10 (B)State or local government 1 828............... 13 125 1 633 13 308 140 11 286 33 (B)Railroad retirement 258..................... 11 648 230 12 193 28 (B) 5 (B)Annuities 208.............................. 9 326 191 9 412 14 (B) – (B)IRA, KEOGH, or 401(k) 261................. 8 598 258 8 657 3 (B) – (B)Other or Don’t Know 219.................... 9 338 208 9 425 3 (B) 6 (B)
Interest 19 836................................. 3 907 18 779 3 951 656 2 416 489 2 553
Dividends 7 034............................... 4 903 6 803 4 925 77 6 422 63 (B)
Rents, royalties, estates or trusts 3 023........... 6 080 2 856 5 842 106 8 866 104 3 728
Education 35............................... (B) 35 (B) – (B) – (B)Pell grant only 1......................... (B) 1 (B) – (B) – (B)Other government only 21................. (B) 21 (B) – (B) – (B)Scholarships only 6...................... (B) 6 (B) – (B) – (B)Other only 5............................. (B) 5 (B) – (B) – (B)Combinations 2.......................... (B) 2 (B) – (B) – (B)
Child support 10............................ (B) 9 (B) 1 (B) – (B)
Alimony 50................................. (B) 50 (B) – (B) – (B)
Financial assistance 137...................... 4 123 98 3 894 3 (B) 18 (B)
Other income 309............................ 3 250 284 3 269 15 (B) 6 (B)Combinations of income types:
Government transfer payments 30 187.......... 10 926 27 002 11 077 2 474 9 384 1 446 8 386Public assistance or SSI 1 275................ 3 470 843 3 324 301 3 049 252 3 525Social security or railroad retirement 29 182...... 8 927 26 234 9 040 2 351 7 854 1 308 7 428Company or union pension2 7 758............. 8 500 7 197 8 563 453 8 166 198 7 021Military retirement2 412..................... 17 328 374 17 552 28 (B) 11 (B)Federal government retirement2 1 185.......... 19 518 1 056 19 796 81 14 182 34 (B)State or local retirement2 1 980................ 12 742 1 775 12 920 147 10 985 48 (B)Property income3 20 670...................... 6 380 19 548 6 441 700 4 312 519 4 066Child support or alimony 60................ (B) 60 (B) 1 (B) – (B)Rents, royalties, estates, or trusts3 3 067....... 6 491 2 898 6 284 108 8 746 104 3 728
1Hispanics may be of any race.2Includes payments reported as survivor, disability, or retirement benefits.3Includes estates and trusts reported as survivor benefits.
INCOME 47U.S. Census Bureau

Table 12. Income Distribution Measures by Definition of Income: 1998[Numbers in thousands. Households as of March of the following year. For meaning of symbols, see text]
Characteristic
Money incomem Before taxes After taxes
Money incomemDefinition 1 less taxesplus capital gains (losses)
Excludingcapitalgains
(currentofficial
measure)
Withoutearnedincome
credit(EIC) With EIC
Definition 1less
governmenttransfers
Definition 2plus
capitalgains
(losses)
Definition 3plus
healthinsurance
supplementsto wage or
salaryincome
Definition 4less
socialsecuritypayroll taxes
Definition 5less
federalincome
taxes
Definition 6plusEIC
1 1a 1b 2 3 4 5 6 7
ALL HOUSEHOLDS
Total ................................ 103 874.......... 103 874 103 874 103 874 103 874 103 874 103 874 103 874 103 874
Recipiency Status
With income as defined .................. 103 084.......... 103 084 103 084 96 923 96 925 96 925 96 925 96 930 96 930With addition or deduction................ (X).......... (X) (X) 40 738 26 466 58 595 79 150 75 799 15 111
Mean addition or deduction dollars................. (X) (X) (X) 9 940 12 808 3 513 3 686 9 942 1 490Standard error dollars.......................... (X) (X) (X) 57 334 12 15 128 15
Mean total income dollars........................ (X) (X) (X) 27 550 94 505 74 666 61 121 56 534 23 620Standard error dollars.......................... (X) (X) (X) 334 1 113 503 420 310 296
Income Levels
Percent ............................ 100.0.......... 100.0 100.0 100.0 100.0 100.0 100.0 100.0 100.0Under $5,000........................... 3.2.......... 3.4 3.2 14.9 14.8 14.7 15.0 15.0 14.7$5,000 to $9,999 ........................ 7.1.......... 7.6 7.2 5.3 5.3 5.3 5.6 5.8 5.5$10,000 to $14,999...................... 7.8.......... 8.7 8.1 6.0 6.0 5.6 6.0 6.4 6.0$15,000 to $19,999...................... 7.0.......... 8.5 8.8 5.5 5.5 5.3 5.7 6.3 6.5$20,000 to $24,999...................... 7.0.......... 8.5 8.9 5.8 5.7 5.3 5.8 6.5 6.9$25,000 to $29,999...................... 6.8.......... 8.1 8.4 5.8 5.7 5.5 5.7 6.5 6.8$30,000 to $34,999...................... 6.4.......... 7.2 7.3 5.7 5.8 5.5 5.7 6.1 6.2$35,000 to $39,999...................... 5.8.......... 6.9 6.9 5.2 5.0 5.0 5.1 5.4 5.5$40,000 to $44,999...................... 5.3.......... 6.4 6.5 4.9 4.7 4.5 4.5 5.3 5.3$45,000 to $49,999...................... 5.0.......... 5.1 5.2 4.4 4.4 4.2 4.6 5.0 5.0$50,000 to $59,999...................... 8.7.......... 8.9 9.0 8.0 7.9 8.1 7.8 8.2 8.2$60,000 to $74,999...................... 9.9.......... 8.8 8.8 9.3 9.0 9.2 9.0 9.4 9.4$75,000 to $99,999...................... 9.6.......... 6.2 6.2 9.0 9.5 10.2 9.2 7.2 7.2$100,000 and over ...................... 10.5.......... 5.5 5.5 10.0 10.7 11.7 10.1 6.8 6.8
Summary Measures
Median dollars.................................... 38 885 33 442 33 594 35 712 36 011 37 673 35 369 32 656 32 801Standard error dollars............................ 230 169 167 188 200 242 221 195 196
Mean dollars...................................... 51 855 43 131 43 348 47 956 51 220 53 201 50 393 43 138 43 354Standard error dollars............................ 280 221 221 285 345 351 341 249 249
Gini ratio ............................... .446.......... .429 .425 .500 .513 .509 .514 .493 .489Standard error ........................ .0038.......... .0039 .0039 .0037 .0039 .0038 .0039 .0038 .0038
Quintile Measures
Lowest quintile:Upper limit dollars............................... 16 315 15 156 15 858 9 713 9 882 10 043 9 437 9 260 9 782Percent of households ................. 20.0.......... 20.0 20.0 20.0 20.0 20.0 20.0 20.0 20.0
With type of addition or deduction ..... (X).......... (X) (X) 17 194 1 728 707 5 343 1 179 3 087Mean amount dollars......................... (X) (X) (X) 10 695 617 1 469 423 311 755
Standard error dollars...................... (X) (X) (X) 79 52 53 7 35 22
Second quintile:Upper limit dollars............................... 30 728 26 884 27 101 26 774 27 050 28 385 26 637 24 938 25 313Percent of households ................. 20.0.......... 20.0 20.0 20.0 20.0 20.0 20.0 20.0 20.0
With type of addition or deduction ..... (X).......... (X) (X) 9 252 2 656 7 739 16 359 13 671 7 020Mean amount dollars......................... (X) (X) (X) 10 424 1 699 1 922 1 431 1 325 2 019
Standard error dollars...................... (X) (X) (X) 125 71 18 8 11 21
Third quintile:Upper limit dollars............................... 48 468 40 670 40 787 45 789 46 550 48 934 45 818 41 693 41 793Percent of households ................. 20.0.......... 20.0 20.0 20.0 20.0 20.0 20.0 20.0 20.0
With type of addition or deduction ..... (X).......... (X) (X) 6 182 4 018 14 469 18 326 19 460 3 452Mean amount dollars......................... (X) (X) (X) 8 790 2 314 2 635 2 658 2 988 1 136
Standard error dollars...................... (X) (X) (X) 150 64 16 12 17 28
Fourth quintile:Upper limit dollars............................... 75 144 60 522 60 568 73 006 75 208 78 478 73 676 64 649 64 696Percent of households ................. 20.0.......... 20.0 20.0 20.0 20.0 20.0 20.0 20.0 20.0
With type of addition or deduction ..... (X).......... (X) (X) 4 492 6 507 17 478 19 435 20 702 1 063Mean amount dollars......................... (X) (X) (X) 8 148 3 891 3 512 4 172 6 151 1 367
Standard error dollars...................... (X) (X) (X) 184 71 17 16 31 55
Fifth quintile:Percent of households ................. 20.0.......... 20.0 20.0 20.0 20.0 20.0 20.0 20.0 20.0
With type of deduction ............... (X).......... (X) (X) 3 618 11 557 18 202 19 687 20 787 489Mean amount dollars......................... (X) (X) (X) 9 302 25 852 4 968 6 920 26 443 1 301
Standard error dollars...................... (X) (X) (X) 226 722 25 35 420 75
48 EXPERIMENTAL ESTIMATES OF INCOMEU.S. Census Bureau

Table 12. Income Distribution Measures by Definition of Income: 1998 mCon.[Numbers in thousands. Households as of March of the following year. For meaning of symbols, see text]
Characteristic
After taxesmcon.
Definition 13 plus othermeans~tested governmentm
Definition 7less
stateincome
taxes
Definition 8plus
nonmeans~tested
governmentcash
transfers
Definition 9plus
medicare
Definition 10plus
regular~priceschool
lunches
Definition 11plus
means~testedgovernment
cashtransfers
Definition 12plus
medicaidNoncashtransfers
Noncashtransfers
less medicalprograms
Definition 14plusnet
imputedreturn
on equityin ownhome
8 9 10 11 12 13 14 14a 15
ALL HOUSEHOLDS
Total ................................ 103 874.......... 103 874 103 874 103 874 103 874 103 874 103 874 103 874 103 874
Recipiency Status
With income as defined .................. 96 934.......... 101 824 102 000 102 044 103 110 103 110 103 332 103 332 103 574With addition or deduction................ 68 924.......... 36 850 23 816 14 126 6 874 9 734 13 800 29 931 69 228
Mean addition or deduction dollars................. 2 898 10 082 5 938 94 4 858 2 673 1 918 5 594 2 736Standard error dollars.......................... 31 61 31 1 73 39 25 30 29
Mean total income dollars........................ 50 710 35 845 40 770 63 861 21 617 35 438 22 905 17 016 57 854Standard error dollars.......................... 294 303 392 680 480 554 235 418 309
Income Levels
Percent ............................ 100.0.......... 100.0 100.0 100.0 100.0 100.0 100.0 100.0 100.0Under $5,000........................... 14.7.......... 5.0 4.9 4.9 3.2 3.2 2.5 2.5 2.2$5,000 to $9,999 ........................ 5.7.......... 6.2 5.4 5.4 6.2 6.0 5.3 6.2 4.7$10,000 to $14,999...................... 6.1.......... 7.4 6.0 6.0 6.3 6.2 6.5 8.4 6.3$15,000 to $19,999...................... 6.7.......... 7.9 7.2 7.2 7.4 7.1 7.4 8.2 7.2$20,000 to $24,999...................... 7.2.......... 8.2 8.1 8.1 8.2 8.2 8.4 8.6 7.9$25,000 to $29,999...................... 7.2.......... 8.0 8.1 8.1 8.1 8.1 8.3 8.2 8.0$30,000 to $34,999...................... 6.3.......... 7.0 7.5 7.5 7.6 7.7 7.8 7.1 7.6$35,000 to $39,999...................... 5.8.......... 6.5 6.9 6.9 6.9 7.0 7.1 6.6 7.1$40,000 to $44,999...................... 5.4.......... 6.2 6.5 6.5 6.5 6.5 6.6 6.2 6.8$45,000 to $49,999...................... 5.1.......... 5.6 6.0 6.0 6.0 6.2 6.2 5.7 6.0$50,000 to $59,999...................... 8.3.......... 8.9 9.5 9.5 9.5 9.6 9.7 9.0 10.1$60,000 to $74,999...................... 9.0.......... 9.7 10.0 10.0 10.1 10.2 10.2 9.8 10.5$75,000 to $99,999...................... 6.6.......... 7.1 7.4 7.4 7.4 7.5 7.5 7.1 8.4$100,000 and over ...................... 5.9.......... 6.3 6.5 6.5 6.5 6.5 6.5 6.3 7.3
Summary Measures
Median dollars.................................... 31 816 35 183 37 001 37 012 37 195 37 530 37 673 35 524 39 308Standard error dollars............................ 176 180 167 167 165 165 164 174 166
Mean dollars...................................... 41 431 45 008 46 370 46 382 46 704 46 954 47 209 45 597 49 033Standard error dollars............................ 231 227 227 227 226 226 225 226 228
Gini ratio ............................... .484.......... .431 .419 .419 .413 .411 .405 .419 .399Standard error ........................ .0038.......... .0038 .0038 .0038 .0038 .0038 .0038 .0038 .0038
Quintile Measures
Lowest quintile:Upper limit dollars............................... 9 671 15 881 17 667 17 670 18 027 18 379 18 830 16 754 19 805Percent of households ................. 20.0.......... 20.0 20.0 20.0 20.0 20.0 20.0 20.0 20.0
With type of addition or deduction ..... 3 455.......... 10 676 4 961 515 4 134 2 801 6 554 8 310 8 101Mean amount dollars......................... 114 7 685 2 314 83 4 255 1 200 2 329 3 122 1 189
Standard error dollars...................... 4 52 30 3 70 30 37 31 112
Second quintile:Upper limit dollars............................... 24 672 28 292 30 202 30 211 30 427 30 803 30 986 28 687 32 475Percent of households ................. 20.0.......... 20.0 20.0 20.0 20.0 20.0 20.0 20.0 20.0
With type of addition or deduction ..... 14 272.......... 8 714 6 175 1 423 1 130 2 682 4 036 8 734 11 289Mean amount dollars......................... 511 10 893 5 500 89 5 557 2 623 1 688 5 951 2 083
Standard error dollars...................... 5 101 31 2 198 53 44 50 41
Third quintile:Upper limit dollars............................... 40 302 42 976 44 489 44 504 44 666 44 986 45 063 43 209 46 840Percent of households ................. 20.0.......... 20.0 20.0 20.0 20.0 20.0 20.0 20.0 20.0
With type of addition or deduction ..... 16 642.......... 7 282 5 429 3 003 799 1 902 2 113 5 906 14 497Mean amount dollars......................... 1 285 10 724 7 344 91 5 652 3 660 1 378 6 910 2 339
Standard error dollars...................... 9 133 56 1 245 99 51 70 40
Fourth quintile:Upper limit dollars............................... 61 950 64 001 65 045 65 072 65 180 65 336 65 349 64 138 67 802Percent of households ................. 20.0.......... 20.0 20.0 20.0 20.0 20.0 20.0 20.0 20.0
With type of addition or deduction ..... 17 236.......... 5 428 3 905 4 412 500 1 398 911 3 804 16 686Mean amount dollars......................... 2 479 10 692 7 710 96 6 043 3 780 1 406 6 859 2 644
Standard error dollars...................... 14 196 72 1 395 134 87 93 52
Fifth quintile:Percent of households ................. 20.0.......... 20.0 20.0 20.0 20.0 20.0 20.0 20.0 20.0
With type of deduction ............... 17 319.......... 4 750 3 345 4 772 312 952 186 3 178 18 655Mean amount dollars......................... 7 387 12 303 7 774 98 6 392 3 548 1 074 7 118 4 195
Standard error dollars...................... 107 272 84 1 538 158 120 98 69
EXPERIMENTAL ESTIMATES OF INCOME 49U.S. Census Bureau

Table 12. Income Distribution Measures by Definition of Income: 1998 mCon.[Numbers in thousands. Households as of March of the following year. For meaning of symbols, see text]
Characteristic
Money incomem Before taxes After taxes
Money incomemDefinition 1 less taxesplus capital gains (losses)
Excludingcapitalgains
(currentofficial
measure)
Withoutearnedincome
credit(EIC) With EIC
Definition 1less
governmenttransfers
Definition 2plus
capitalgains
(losses)
Definition 3plus
healthinsurance
supplementsto wage or
salaryincome
Definition 4less
socialsecuritypayroll taxes
Definition 5less
federalincome
taxes
Definition 6plusEIC
1 1a 1b 2 3 4 5 6 7
HOUSEHOLDS WITH FEMALEHOUSEHOLDER, NO HUSBANDPRESENT, WITH RELATEDCHILDREN UNDER 18
Total ................................ 8 928.......... 8 928 8 928 8 928 8 928 8 928 8 928 8 928 8 928
Recipiency Status
With income as defined .................. 8 812.......... 8 812 8 812 8 131 8 131 8 131 8 131 8 133 8 133With addition or deduction................ (X).......... (X) (X) 3 690 1 147 3 947 7 321 4 208 5 210
Mean addition or deduction dollars................. (X) (X) (X) 6 248 4 173 3 103 1 904 3 568 1 989Standard error dollars.......................... (X) (X) (X) 146 502 38 30 238 24
Mean total income dollars........................ (X) (X) (X) 15 708 57 956 42 818 29 174 40 259 22 735Standard error dollars.......................... (X) (X) (X) 552 3 011 758 605 707 476
Income Levels
Percent ............................ 100.0.......... 100.0 100.0 100.0 100.0 100.0 100.0 100.0 100.0Under $5,000........................... 9.3.......... 9.9 8.6 21.3 21.3 20.9 22.1 22.1 19.7$5,000 to $9,999 ........................ 14.0.......... 15.0 12.8 9.4 9.2 9.1 9.5 9.6 8.3$10,000 to $14,999...................... 13.6.......... 15.1 11.5 11.9 11.9 10.7 11.3 11.7 9.6$15,000 to $19,999...................... 11.6.......... 12.9 15.5 9.8 9.8 9.3 9.7 10.0 11.9$20,000 to $24,999...................... 9.1.......... 9.4 11.7 8.6 8.4 8.5 8.4 9.0 11.0$25,000 to $29,999...................... 8.1.......... 8.8 9.9 7.7 7.5 7.3 7.8 7.8 8.7$30,000 to $34,999...................... 6.7.......... 7.3 7.4 6.0 6.3 6.3 5.7 6.8 6.8$35,000 to $39,999...................... 5.8.......... 4.6 4.5 5.6 5.3 5.5 5.0 5.1 5.5$40,000 to $44,999...................... 4.0.......... 4.7 5.2 3.5 3.7 4.2 4.1 3.4 3.7$45,000 to $49,999...................... 3.8.......... 3.2 3.3 3.5 3.6 3.0 3.2 3.4 3.6$50,000 to $59,999...................... 5.0.......... 3.8 4.0 4.6 4.6 5.5 4.8 4.6 4.8$60,000 to $74,999...................... 4.3.......... 2.7 2.8 3.9 3.7 4.1 3.5 3.0 3.1$75,000 to $99,999...................... 2.5.......... 1.8 1.8 2.3 2.6 3.2 2.8 2.1 2.1$100,000 and over ...................... 2.0.......... 1.0 1.0 2.0 2.1 2.3 2.0 1.2 1.2
Summary Measures
Median dollars.................................... 20 692 18 884 20 619 18 775 18 810 19 969 18 574 18 223 20 231Standard error dollars............................ 392 311 321 420 426 447 420 405 350
Mean dollars...................................... 27 689 24 391 25 552 25 106 25 642 27 014 25 453 23 771 24 932Standard error dollars............................ 481 379 376 488 531 547 525 427 425
Gini ratio ............................... .450.......... .430 .408 .503 .509 .509 .512 .494 .470Standard error ........................ .0128.......... .0126 .0126 .0126 .0129 .0128 .0130 .0124 .0124
Quintile Measures
Lowest quintile:Upper limit dollars............................... 16 315 15 156 15 858 9 713 9 882 10 043 9 437 9 260 9 782Percent of households ................. 40.9.......... 40.5 35.3 30.3 30.4 30.8 30.7 30.5 27.7
With type of addition or deduction ..... (X).......... (X) (X) 1 990 45 143 1 517 42 965Mean amount dollars......................... (X) (X) (X) 6 510 (B) 1 878 353 (B) 1 394
Standard error dollars...................... (X) (X) (X) 190 (B) 114 9 (B) 35
Second quintile:Upper limit dollars............................... 30 728 26 884 27 101 26 774 27 050 28 385 26 637 24 938 25 313Percent of households ................. 26.4.......... 26.1 29.6 34.1 34.3 33.1 32.9 31.9 33.5
With type of addition or deduction ..... (X).......... (X) (X) 963 175 1 268 2 766 1 038 2 650Mean amount dollars......................... (X) (X) (X) 5 721 1 237 2 310 1 262 830 2 414
Standard error dollars...................... (X) (X) (X) 270 258 43 14 32 30
Third quintile:Upper limit dollars............................... 48 468 40 670 40 787 45 789 46 550 48 934 45 818 41 693 41 793Percent of households ................. 17.8.......... 16.9 18.0 20.2 20.0 20.5 20.7 20.9 21.6
With type of addition or deduction ..... (X).......... (X) (X) 457 385 1 344 1 706 1 661 1 093Mean amount dollars......................... (X) (X) (X) 6 359 2 530 2 961 2 358 1 777 1 590
Standard error dollars...................... (X) (X) (X) 528 180 48 29 43 55
Fourth quintile:Upper limit dollars............................... 75 144 60 522 60 568 73 006 75 208 78 478 73 676 64 649 64 696Percent of households ................. 10.4.......... 11.2 11.7 10.8 10.7 10.8 10.9 11.5 11.8
With type of addition or deduction ..... (X).......... (X) (X) 185 309 814 923 1 007 381Mean amount dollars......................... (X) (X) (X) 5 870 3 279 3 825 3 659 4 068 1 811
Standard error dollars...................... (X) (X) (X) 654 277 87 71 101 101
Fifth quintile:Percent of households ................. 4.5.......... 5.3 5.4 4.6 4.7 4.8 4.8 5.2 5.3
With type of deduction ............... (X).......... (X) (X) 96 234 377 409 460 121Mean amount dollars......................... (X) (X) (X) 6 292 11 175 5 180 6 134 15 396 1 607
Standard error dollars...................... (X) (X) (X) 731 2 280 162 204 1 954 162
50 EXPERIMENTAL ESTIMATES OF INCOMEU.S. Census Bureau

Table 12. Income Distribution Measures by Definition of Income: 1998 mCon.[Numbers in thousands. Households as of March of the following year. For meaning of symbols, see text]
Characteristic
After taxesmcon.
Definition 13 plus othermeans~tested governmentm
Definition 7less
stateincome
taxes
Definition 8plus
nonmeans~tested
governmentcash
transfers
Definition 9plus
medicare
Definition 10plus
regular~priceschool
lunches
Definition 11plus
means~testedgovernment
cashtransfers
Definition 12plus
medicaidNoncashtransfers
Noncashtransfers
less medicalprograms
Definition 14plusnet
imputedreturn
on equityin ownhome
8 9 10 11 12 13 14 14a 15
HOUSEHOLDS WITH FEMALEHOUSEHOLDER, NO HUSBANDPRESENT, WITH RELATEDCHILDREN UNDER 18
Total ................................ 8 928.......... 8 928 8 928 8 928 8 928 8 928 8 928 8 928 8 928
Recipiency Status
With income as defined .................. 8 135.......... 8 380 8 382 8 418 8 830 8 830 8 904 8 904 8 909With addition or deduction................ 4 661.......... 2 113 538 2 110 2 196 2 215 4 852 2 473 3 337
Mean addition or deduction dollars................. 1 132 6 229 4 880 88 4 504 2 667 2 617 3 451 1 851Standard error dollars.......................... 58 209 166 1 113 78 53 94 100
Mean total income dollars........................ 34 044 27 733 39 996 41 034 14 610 26 722 20 793 13 760 40 735Standard error dollars.......................... 599 783 1 899 865 386 576 274 909 813
Income Levels
Percent ............................ 100.0.......... 100.0 100.0 100.0 100.0 100.0 100.0 100.0 100.0Under $5,000........................... 19.7.......... 15.4 15.3 15.3 8.5 8.4 3.6 3.6 3.2$5,000 to $9,999 ........................ 8.3.......... 9.5 9.5 9.5 12.3 11.3 8.3 8.4 7.9$10,000 to $14,999...................... 9.7.......... 10.0 9.8 9.7 10.8 10.3 12.4 14.2 12.6$15,000 to $19,999...................... 12.1.......... 12.3 11.9 11.9 13.2 12.2 14.3 15.1 14.3$20,000 to $24,999...................... 11.2.......... 11.0 11.0 11.0 11.6 12.1 13.7 14.0 13.1$25,000 to $29,999...................... 9.0.......... 9.4 9.0 9.0 9.3 9.9 10.5 10.5 10.5$30,000 to $34,999...................... 6.7.......... 7.4 7.8 7.8 8.0 8.2 8.8 7.9 8.6$35,000 to $39,999...................... 5.6.......... 5.6 5.7 5.7 5.8 6.4 6.4 6.1 6.5$40,000 to $44,999...................... 3.6.......... 4.1 4.1 4.1 4.2 4.4 4.7 4.3 5.2$45,000 to $49,999...................... 3.8.......... 4.0 4.1 4.1 4.3 4.5 4.4 4.4 3.8$50,000 to $59,999...................... 4.3.......... 4.9 5.0 5.0 5.2 5.4 5.8 5.0 6.4$60,000 to $74,999...................... 2.9.......... 3.1 3.3 3.3 3.3 3.4 3.5 3.2 3.9$75,000 to $99,999...................... 1.8.......... 2.2 2.2 2.2 2.2 2.3 2.3 2.2 2.4$100,000 and over ...................... 1.1.......... 1.1 1.2 1.2 1.2 1.2 1.2 1.1 1.5
Summary Measures
Median dollars.................................... 20 074 21 220 21 527 21 528 22 100 23 019 24 103 23 046 24 581Standard error dollars............................ 330 343 349 349 322 364 308 296 315
Mean dollars...................................... 24 341 25 816 26 110 26 131 27 239 27 901 29 323 28 367 30 015Standard error dollars............................ 400 402 406 406 396 397 386 381 393
Gini ratio ............................... .464.......... .444 .445 .445 .413 .406 .369 .371 .369Standard error ........................ .0122.......... .0123 .0122 .0122 .0124 .0123 .0123 .0125 .0123
Quintile Measures
Lowest quintile:Upper limit dollars............................... 9 671 15 881 17 667 17 670 18 027 18 379 18 830 16 754 19 805Percent of households ................. 27.6.......... 36.7 40.9 40.8 39.8 38.4 35.1 31.7 37.3
With type of addition or deduction ..... 208.......... 766 90 266 1 603 802 2 464 593 608Mean amount dollars......................... 89 4 459 1 395 80 4 191 1 515 3 144 1 651 987
Standard error dollars...................... 11 177 189 4 115 56 78 76 199
Second quintile:Upper limit dollars............................... 24 672 28 292 30 202 30 211 30 427 30 803 30 986 28 687 32 475Percent of households ................. 33.0.......... 27.9 26.0 26.0 26.6 27.0 29.4 31.3 28.8
With type of addition or deduction ..... 1 687.......... 526 121 482 363 787 1 609 1 111 855Mean amount dollars......................... 337 5 985 4 684 86 5 415 2 700 2 128 3 196 1 289
Standard error dollars...................... 10 394 264 3 356 96 84 116 101
Third quintile:Upper limit dollars............................... 40 302 42 976 44 489 44 504 44 666 44 986 45 063 43 209 46 840Percent of households ................. 22.0.......... 18.4 16.8 17.0 17.1 17.7 18.2 19.5 17.3
With type of addition or deduction ..... 1 513.......... 421 163 596 153 368 523 451 831Mean amount dollars......................... 869 7 151 5 411 84 5 168 4 238 1 914 5 088 1 626
Standard error dollars...................... 23 501 208 2 490 269 134 274 160
Fourth quintile:Upper limit dollars............................... 61 950 64 001 65 045 65 072 65 180 65 336 65 349 64 138 67 802Percent of households ................. 11.9.......... 11.5 10.8 10.8 11.0 11.3 11.6 12.0 11.5
With type of addition or deduction ..... 856.......... 257 101 492 67 199 224 225 682Mean amount dollars......................... 1 673 8 420 6 629 92 (B) 4 063 2 157 5 494 2 616
Standard error dollars...................... 44 720 422 3 (B) 379 242 413 244
Fifth quintile:Percent of households ................. 5.5.......... 5.5 5.5 5.5 5.5 5.5 5.5 5.5 5.1
With type of deduction ............... 397.......... 144 64 274 10 60 32 93 361Mean amount dollars......................... 4 891 9 930 (B) 100 (B) (B) (B) 5 092 3 711
Standard error dollars...................... 582 1 427 (B) 5 (B) (B) (B) 442 547
EXPERIMENTAL ESTIMATES OF INCOME 51U.S. Census Bureau

Table 12. Income Distribution Measures by Definition of Income: 1998 mCon.[Numbers in thousands. Households as of March of the following year. For meaning of symbols, see text]
Characteristic
Money incomem Before taxes After taxes
Money incomemDefinition 1 less taxesplus capital gains (losses)
Excludingcapitalgains
(currentofficial
measure)
Withoutearnedincome
credit(EIC) With EIC
Definition 1less
governmenttransfers
Definition 2plus
capitalgains
(losses)
Definition 3plus
healthinsurance
supplementsto wage or
salaryincome
Definition 4less
socialsecuritypayroll taxes
Definition 5less
federalincome
taxes
Definition 6plusEIC
1 1a 1b 2 3 4 5 6 7
HOUSEHOLDS WITH MEMBERS 65YEARS OLD AND OVER
Total ................................ 24 046.......... 24 046 24 046 24 046 24 046 24 046 24 046 24 046 24 046
Recipiency Status
With income as defined .................. 23 902.......... 23 902 23 902 20 128 20 130 20 130 20 130 20 135 20 135With addition or deduction................ (X).......... (X) (X) 22 481 6 402 4 242 7 881 10 778 1 134
Mean addition or deduction dollars................. (X) (X) (X) 12 791 9 488 2 823 2 581 8 868 938Standard error dollars.......................... (X) (X) (X) 73 574 44 46 347 49
Mean total income dollars........................ (X) (X) (X) 22 296 60 902 70 860 52 721 45 456 23 868Standard error dollars.......................... (X) (X) (X) 415 1 886 2 069 1 444 807 1 060
Income Levels
Percent ............................ 100.0.......... 100.0 100.0 100.0 100.0 100.0 100.0 100.0 100.0Under $5,000........................... 2.7.......... 2.8 2.8 38.3 37.8 37.8 38.0 38.0 37.9$5,000 to $9,999 ........................ 13.6.......... 13.6 13.5 11.7 11.7 11.6 11.8 12.1 12.1$10,000 to $14,999...................... 15.0.......... 15.0 14.9 8.8 8.9 8.7 8.9 9.2 9.2$15,000 to $19,999...................... 11.9.......... 12.4 12.4 6.8 6.5 6.5 6.6 7.4 7.5$20,000 to $24,999...................... 9.8.......... 10.4 10.4 5.2 5.3 5.2 5.3 5.4 5.4$25,000 to $29,999...................... 7.9.......... 8.7 8.7 4.2 3.9 3.8 4.0 4.8 4.8$30,000 to $34,999...................... 6.1.......... 6.8 6.7 3.7 3.9 4.0 3.7 3.9 4.0$35,000 to $39,999...................... 5.4.......... 5.7 5.8 3.0 3.0 2.8 3.2 2.8 2.8$40,000 to $44,999...................... 4.0.......... 4.5 4.5 2.4 2.3 2.6 2.2 2.3 2.4$45,000 to $49,999...................... 3.4.......... 3.2 3.3 1.8 1.8 1.8 1.8 1.8 1.8$50,000 to $59,999...................... 5.1.......... 4.8 4.9 3.2 3.2 3.1 2.9 3.0 3.0$60,000 to $74,999...................... 5.0.......... 4.9 4.9 3.4 3.2 3.4 3.3 3.4 3.4$75,000 to $99,999...................... 4.5.......... 3.6 3.6 3.3 3.6 3.7 3.6 2.6 2.6$100,000 and over ...................... 5.7.......... 3.7 3.7 4.3 4.8 5.0 4.7 3.2 3.2
Summary Measures
Median dollars.................................... 23 369 22 950 23 014 9 995 10 251 10 337 10 105 9 936 9 998Standard error dollars............................ 264 242 243 232 244 248 245 222 225
Mean dollars...................................... 36 301 33 014 33 059 24 343 26 869 27 367 26 521 22 547 22 591Standard error dollars............................ 466 384 384 460 575 581 568 415 415
Gini ratio ............................... .483.......... .457 .456 .662 .678 .675 .678 .651 .650Standard error ........................ .0087.......... .0087 .0087 .0087 .0091 .0091 .0092 .0090 .0090
Quintile Measures
Lowest quintile:Upper limit dollars............................... 16 315 15 156 15 858 9 713 9 882 10 043 9 437 9 260 9 782Percent of households ................. 34.5.......... 31.8 33.6 49.5 49.3 49.6 48.5 48.4 49.5
With type of addition or deduction ..... (X).......... (X) (X) 11 517 1 340 123 1 084 357 353Mean amount dollars......................... (X) (X) (X) 12 068 676 1 258 386 189 367
Standard error dollars...................... (X) (X) (X) 93 51 127 14 24 45
Second quintile:Upper limit dollars............................... 30 728 26 884 27 101 26 774 27 050 28 385 26 637 24 938 25 313Percent of households ................. 27.3.......... 25.9 24.3 23.0 22.7 22.8 23.3 23.7 22.8
With type of addition or deduction ..... (X).......... (X) (X) 5 249 1 362 896 2 269 3 805 390Mean amount dollars......................... (X) (X) (X) 13 507 1 684 1 822 1 155 1 174 1 297
Standard error dollars...................... (X) (X) (X) 157 74 52 24 18 84
Third quintile:Upper limit dollars............................... 48 468 40 670 40 787 45 789 46 550 48 934 45 818 41 693 41 793Percent of households ................. 16.9.......... 18.2 18.0 11.9 11.9 11.9 12.1 12.3 12.1
With type of addition or deduction ..... (X).......... (X) (X) 2 541 1 169 1 115 1 759 2 876 233Mean amount dollars......................... (X) (X) (X) 13 284 2 929 2 250 2 201 3 615 1 120
Standard error dollars...................... (X) (X) (X) 212 116 50 43 46 120
Fourth quintile:Upper limit dollars............................... 75 144 60 522 60 568 73 006 75 208 78 478 73 676 64 649 64 696Percent of households ................. 11.1.......... 12.1 12.1 7.6 7.6 7.5 7.6 7.6 7.6
With type of addition or deduction ..... (X).......... (X) (X) 1 611 1 023 973 1 283 1 817 97Mean amount dollars......................... (X) (X) (X) 13 549 5 011 2 951 3 468 7 965 982
Standard error dollars...................... (X) (X) (X) 338 194 72 79 128 161
Fifth quintile:Percent of households ................. 10.2.......... 12.0 12.0 8.0 8.5 8.1 8.5 8.0 8.0
With type of deduction ............... (X).......... (X) (X) 1 561 1 508 1 135 1 486 1 923 61Mean amount dollars......................... (X) (X) (X) 14 129 32 493 4 235 6 044 34 409 (B)
Standard error dollars...................... (X) (X) (X) 336 2 208 111 148 1 672 (B)
52 EXPERIMENTAL ESTIMATES OF INCOMEU.S. Census Bureau

Table 12. Income Distribution Measures by Definition of Income: 1998 mCon.[Numbers in thousands. Households as of March of the following year. For meaning of symbols, see text]
Characteristic
After taxesmcon.
Definition 13 plus othermeans~tested governmentm
Definition 7less
stateincome
taxes
Definition 8plus
nonmeans~tested
governmentcash
transfers
Definition 9plus
medicare
Definition 10plus
regular~priceschool
lunches
Definition 11plus
means~testedgovernment
cashtransfers
Definition 12plus
medicaidNoncashtransfers
Noncashtransfers
less medicalprograms
Definition 14plusnet
imputedreturn
on equityin ownhome
8 9 10 11 12 13 14 14a 15
HOUSEHOLDS WITH MEMBERS 65YEARS OLD AND OVER
Total ................................ 24 046.......... 24 046 24 046 24 046 24 046 24 046 24 046 24 046 24 046
Recipiency Status
With income as defined .................. 20 136.......... 23 705 23 809 23 809 23 902 23 902 23 922 23 922 24 012With addition or deduction................ 11 248.......... 22 133 20 996 532 1 700 2 541 2 203 21 023 19 296
Mean addition or deduction dollars................. 2 122 12 634 6 070 90 4 658 2 162 1 631 6 323 3 835Standard error dollars.......................... 75 74 33 3 167 63 40 34 54
Mean total income dollars........................ 36 635 32 576 41 345 71 200 27 095 39 236 20 706 17 373 46 550Standard error dollars.......................... 699 371 418 3 136 1 337 1 340 809 524 481
Income Levels
Percent ............................ 100.0.......... 100.0 100.0 100.0 100.0 100.0 100.0 100.0 100.0Under $5,000........................... 38.0.......... 4.4 4.2 4.2 2.7 2.7 2.5 2.5 1.7$5,000 to $9,999 ........................ 12.3.......... 12.8 9.7 9.7 10.3 10.0 9.2 12.1 7.3$10,000 to $14,999...................... 9.3.......... 14.6 8.8 8.8 9.0 9.1 9.4 16.2 8.7$15,000 to $19,999...................... 7.7.......... 12.1 9.4 9.4 9.6 9.5 10.0 12.3 9.0$20,000 to $24,999...................... 5.5.......... 10.1 9.6 9.6 9.7 9.6 9.7 10.3 9.3$25,000 to $29,999...................... 5.0.......... 8.5 8.6 8.6 8.7 8.6 8.6 8.6 8.5$30,000 to $34,999...................... 3.9.......... 6.5 8.7 8.7 8.6 8.5 8.5 6.6 8.6$35,000 to $39,999...................... 2.7.......... 5.6 7.2 7.2 7.4 7.4 7.4 5.7 7.4$40,000 to $44,999...................... 2.4.......... 4.6 6.0 6.0 6.1 6.1 6.1 4.6 6.8$45,000 to $49,999...................... 1.7.......... 3.3 4.8 4.8 4.8 5.0 5.0 3.4 5.6$50,000 to $59,999...................... 3.0.......... 4.8 7.1 7.1 7.2 7.3 7.3 4.9 8.2$60,000 to $74,999...................... 3.2.......... 4.9 6.0 6.0 6.0 6.1 6.1 5.0 7.1$75,000 to $99,999...................... 2.4.......... 3.8 5.1 5.0 5.1 5.1 5.1 3.8 6.1$100,000 and over ...................... 2.9.......... 4.0 4.8 4.8 4.8 4.9 4.9 4.0 5.7
Summary Measures
Median dollars.................................... 9 890 22 885 29 781 29 781 30 013 30 266 30 314 23 237 33 261Standard error dollars............................ 214 255 290 290 287 285 284 245 273
Mean dollars...................................... 21 598 33 227 38 527 38 529 38 858 39 087 39 236 33 708 42 314Standard error dollars............................ 384 391 402 402 402 402 401 390 411
Gini ratio ............................... .644.......... .466 .436 .436 .430 .429 .426 .455 .411Standard error ........................ .0090.......... .0086 .0082 .0082 .0082 .0081 .0082 .0086 .0080
Quintile Measures
Lowest quintile:Upper limit dollars............................... 9 671 15 881 17 667 17 670 18 027 18 379 18 830 16 754 19 805Percent of households ................. 49.6.......... 34.1 27.3 27.3 27.5 27.9 28.5 35.3 26.3
With type of addition or deduction ..... 1 869.......... 7 448 4 188 15 898 866 1 476 6 140 3 770Mean amount dollars......................... 98 8 623 2 361 (B) 3 529 682 1 827 3 407 1 742
Standard error dollars...................... 4 54 31 (B) 145 27 47 34 137
Second quintile:Upper limit dollars............................... 24 672 28 292 30 202 30 211 30 427 30 803 30 986 28 687 32 475Percent of households ................. 22.8.......... 25.4 23.5 23.5 23.3 23.0 22.7 24.4 22.4
With type of addition or deduction ..... 3 953.......... 5 856 5 505 51 252 464 309 5 733 4 257Mean amount dollars......................... 444 13 224 5 520 (B) 5 463 1 966 1 337 7 070 3 221
Standard error dollars...................... 9 99 32 (B) 403 63 92 53 68
Third quintile:Upper limit dollars............................... 40 302 42 976 44 489 44 504 44 666 44 986 45 063 43 209 46 840Percent of households ................. 12.0.......... 18.0 20.9 20.9 20.9 20.6 20.4 17.7 20.7
With type of addition or deduction ..... 2 338.......... 4 047 4 846 85 257 471 218 4 078 4 399Mean amount dollars......................... 1 377 14 631 7 495 69 5 922 2 983 1 159 7 783 3 792
Standard error dollars...................... 28 150 60 4 498 136 136 74 78
Fourth quintile:Upper limit dollars............................... 61 950 64 001 65 045 65 072 65 180 65 336 65 349 64 138 67 802Percent of households ................. 7.5.......... 11.4 14.8 14.8 14.7 14.7 14.7 11.4 15.9
With type of addition or deduction ..... 1 485.......... 2 491 3 411 127 160 391 160 2 600 3 516Mean amount dollars......................... 2 790 15 822 7 880 91 6 403 3 659 1 247 7 827 4 674
Standard error dollars...................... 58 280 78 6 866 212 178 97 114
Fifth quintile:Percent of households ................. 8.0.......... 11.1 13.6 13.6 13.7 13.8 13.7 11.1 14.8
With type of deduction ............... 1 601.......... 2 291 3 045 255 133 350 40 2 473 3 354Mean amount dollars......................... 9 098 17 171 7 870 100 6 209 3 313 (B) 7 844 6 145
Standard error dollars...................... 433 397 87 5 831 204 (B) 103 180
EXPERIMENTAL ESTIMATES OF INCOME 53U.S. Census Bureau

Appendix A.Definitions and Explanations
FAMILY
The term ‘‘family’’ refers to a group of two or morepeople related by birth, marriage, or adoption whoreside together; the Census Bureau considers all suchpeople as members of one family. For example, if theson of the person who maintains the household and theson’s wife are members of the household, the CensusBureau treats them as members of the parent’s family.Every family must include a reference person. Two ormore people living in the same household who arerelated to one another, but are not related to the house-holder, form an ‘‘unrelated subfamily.’’ Beginning withthe 1980 Current Population Survey (CPS), the CensusBureau excluded unrelated subfamilies from the countof families and unrelated subfamily members from thecount of family members.
FAMILY HOUSEHOLDS
Family households are households maintained by afamily (as defined above). Members of family house-holds include any unrelated people (unrelated subfam-ily members and/or secondary individuals) who may beresiding there. The number of family households willnot equal the number of families since families living ingroup quarters are included in the count of families. Inaddition, the count of family household members dif-fers from the count of family members in that the fam-ily household members include all people living in thehousehold; whereas, family members include onlyhouseholders and their relatives. (See the definition offamily.)
GINI RATIO
The Gini ratio (or index of income concentration) is astatistical measure of income equality ranging from 0 to1. A measure of 1 indicates perfect inequality; i.e., oneperson has all the income and the rest have none. Ameasure of 0 indicates perfect equality; i.e., all peoplehave equal shares of income. The Census Bureau usedgrouped data to compute all Gini ratios appearing inthis report. For a more detailed discussion, see CurrentPopulation Reports, Series P-60, No. 123.
HOUSEHOLDER
The householder refers to the person (or one of thepeople) who owns or rents (maintains) the housing unit.If a married couple owns the housing unit jointly, the
interviewer may list either as the householder. The per-son listed first is the householder and is the ‘‘referenceperson’’ to whom the Census Bureau designates therelationship of all other household members. The num-ber of householders is equal to the number of house-holds. Also, the number of family householders is equalto the number of families.
HOUSEHOLDS
Households consist of all people who occupy a hous-ing unit. The Census Bureau regards a house, an apart-ment or other group of rooms, or a single room as ahousing unit when it is occupied or intended for occu-pancy as separate living quarters: the occupants do notlive and eat with any other people in the structure andthere is direct access from the outside or through acommon hall.
A household includes the related family membersand all the unrelated people, if any, such as lodgers,foster children, wards, or employees who share thehousing unit. The Census Bureau also counts a personliving alone in a housing unit or a group of unrelatedpeople sharing a housing unit as partners as a house-hold. The count of households excludes group quar-ters.
INCOME
Official Definition of Income
For each person in the sample 15 years old and over,the CPS asks questions on the amount of moneyincome received in the preceding calendar year fromeach of the following sources:
1. Earnings.
2. Unemployment compensation.
3. Workers’ compensation.
4. Social security.
5. Supplemental security income.
6. Public assistance.
7. Veterans’ payments.
8. Survivor benefits.
9. Disability benefits.
APPENDIX A A–1
U.S. Census Bureau

10. Pension or retirement income.
11. Interest.
12. Dividends.
13. Rents, royalties, and estates and trusts.
14. Educational assistance.
15. Alimony.
16. Child support.
17. Financial assistance from outside of the household.
18. Other income.
Alternative measures of income (definitions 1through 15 shown in table 12) are shown on page A–4.
It should be noted that although the income statis-tics refer to receipts during the preceding calendar year,the demographic characteristics, such as age, laborforce status, and family or household composition, areas of the survey date. The income of the family/household does not include amounts received bypeople who were members during all or part of theincome year if these people no longer resided in thefamily/household at the time of interview. However, theCPS collects income data for people who are currentresidents but did not reside in the household during theincome year.
Data on consumer income collected in the CPS by theCensus Bureau cover money income received (exclusiveof certain money receipts such as capital gains) beforepayments for personal income taxes, social security,union dues, medicare deductions, etc. Therefore,money income does not reflect the fact that some fami-lies may receive noncash benefits, such as food stamps,health benefits, rent-free housing, and goods producedand consumed on the farm. In addition, money incomedoes not reflect the fact that noncash benefits are alsoreceived by some nonfarm residents which often takethe form of the use of business transportation andfacilities, full or partial payments by business for retire-ment programs, medical and educational expenses, etc.Data users should consider these elements when com-paring income levels. Moreover, readers should beaware that for many different reasons there is a ten-dency in household surveys for respondents to underreport their income. Based on an analysis of indepen-dently derived income estimates, the Census Bureaudetermined that respondents report income earnedfrom wages or salaries much better than other sourcesof income and that the reported wage and salaryincome is nearly equal to independent estimates ofaggregate income.
The Census Bureau collects data for the followingincome sources.
Earnings. The Census Bureau classifies earnings fromlongest job (or self-employment) and other employmentearnings into three types:
1. Money wage or salary income is the total incomepeople receive for work performed as an employeeduring the income year. This category includeswages, salary, armed forces pay, commissions, tips,piece-rate payments, and cash bonuses earned,before deductions are made for items such astaxes, bonds, pensions, and union dues.
2. Net income from nonfarm self-employment is thenet money income (gross receipts minus expenses)from one’s own business, professional enterprise,or partnership. Gross receipts include the value ofall goods sold and services rendered. Expensesinclude items such as costs of goods purchased,rent, heat, power, depreciation charges, wages andsalaries paid, and business taxes (not personalincome taxes). In general, the Census Bureau con-siders inventory changes in determining net incomefrom nonfarm self-employment; replies based onincome tax returns or other official records doreflect inventory changes. However, when respon-dents do not report values of inventory changes,interviewers will accept net income figures exclu-sive of inventory changes. The Census Bureau doesnot include the value of saleable merchandise con-sumed by the proprietors of retail stores as part ofnet income.
3. Net income from farm self-employment is the netmoney income (gross receipts minus operatingexpenses) from the operation of a farm by a personon their own account as an owner, renter, or share-cropper. Gross receipts include the value of allproducts sold, payments from government farmprograms, money received from the rental of farmequipment to others, rent received from farm prop-erty if payment is made based on a percentage ofcrops produced, and incidental receipts from thesale of items such as wood, sand, and gravel. Oper-ating expenses include items such as cost of feed,fertilizer, seed, and other farming supplies; cashwages paid to farmhands; depreciation charges;cash rent; interest on farm mortgages; farm build-ing repairs; and farm taxes (not state and federalpersonal income taxes). The Census Bureau doesnot include the value of fuel, food, or other farmproducts used for family living as part of netincome. In determining farm self-employmentincome, the Census Bureau considers inventorychanges in determining net income only when theyare accounted for in replies based on income taxreturns or other official records which reflect inven-tory changes; otherwise, the Census Bureau doesnot take inventory changes into account.
A–2 APPENDIX A
U.S. Census Bureau

Unemployment compensation includes paymentsthe respondent received from government unemploy-ment agencies or private companies during periods ofunemployment and any strike benefits the respondentreceived from union funds.
Workers’ compensation includes payments peoplereceive periodically from public or private insurancecompanies for injuries received at work.
Social security includes social security pensions andsurvivors’ benefits and permanent disability insurancepayments made by the Social Security Administrationprior to deductions for medical insurance. The CensusBureau does not include medicare reimbursements forhealth services as social security benefits.
Supplemental security income includes federal,state, and local welfare agency payments to low-incomepeople who are 65 years old or over or people of anyage who are blind or disabled.
Public assistance or welfare payments includecash public assistance payments low-income peoplereceive, such as aid to families with dependent children(AFDC, ADC), temporary assistance to needy families(TANF), general assistance, and emergency assistance.
Veterans’ payments include payments disabled mem-bers of the armed forces or survivors of deceased veter-ans receive periodically from the Department of Veter-ans Affairs for education and on-the-job training, andmeans-tested assistance to veterans.
Survivor benefits include payments people receivefrom survivors’ or widows’ pensions, estates, trusts,annuities, or any other types of survivor benefits.Respondents can report payments from ten differentsources: private companies or unions; federal govern-ment (Civil Service); military; state or local govern-ments; railroad retirement; workers’ compensation;Black lung payments; estates and trusts; annuities orpaid-up insurance policies; and other survivor pay-ments.
Disability benefits include payments people receiveas a result of a health problem or disability (other thanthose from social security). Respondents can reportpayments from ten sources: workers’ compensation;companies or unions; federal government (Civil Ser-vice); military; state or local governments; railroadretirement; accident or disability insurance; Black lungpayments; state temporary sickness; or other disabilitypayments.
Pension or retirement income includes paymentspeople receive from eight sources: companies orunions; federal government (Civil Service); military;
state or local governments; railroad retirement; annu-ities or paid-up insurance policies; individual retirementaccounts (IRAs), Keogh, or 401(k) payments; or otherretirement income.
Interest income includes payments people receive (orhave credited to accounts) from bonds, treasury notes,IRAs, certificates of deposit, interest-bearing savingsand checking accounts, and all other investments thatpay interest.
Dividends include income people receive from stockholdings and mutual fund shares. The CPS does notinclude capital gains from the sale of stock holdings asincome.
Rents, royalties, and estates and trusts includethe net income people receive from the rental of ahouse, store, or other property, receipts from boardersor lodgers, net royalty income, and periodic paymentsfrom estate or trust funds.
Educational assistance includes Pell Grants; othergovernment educational assistance; any scholarships orgrants; or financial assistance students receive fromemployers, friends, or relatives not residing in the stu-dent’s household.
Child support includes all periodic payments a parentreceives from an absent parent for the support of chil-dren, even if these payments are made through a stateor local government office.
Alimony includes all periodic payments people receivefrom ex-spouses. Alimony excludes one-time propertysettlements.
Financial assistance from outside of the house-hold includes periodic payments people receive fromnonhousehold members. This type of assistanceexcludes gifts or sporadic assistance.
Other income includes all other payments peoplereceive regularly that are not included elsewhere on thequestionnaire. Some examples are state programs suchas foster child payments, military family allotments,and income received from foreign government pen-sions.
Government transfers include payments peoplereceive from the following sources: (1) unemploymentcompensation, (2) state workers’ compensation, (3)social security, (4) supplemental security income (SSI),(5) public assistance, (6) veterans’ benefits, (7) govern-ment survivor benefits, (8) government disability ben-efits, (9) government pensions, and (10) governmenteducational assistance.
The Census Bureau does not count the followingreceipts as income: (1) capital gains people receive (orlosses they incur) from the sale of property, including
APPENDIX A A–3
U.S. Census Bureau

stocks, bonds, a house, or a car (unless the person wasengaged in the business of selling such property, inwhich case the CPS counts the net proceeds as incomefrom self-employment); (2) withdrawals of bank depos-its; (3) money borrowed; (4) tax refunds; (5) gifts; and(6) lump-sum inheritances or insurance payments.
The Census Bureau combines all sources of incomeinto two major types:
1. Total money earnings is the algebraic sum ofmoney wages and salary and net income from farmand nonfarm self-employment.
2. Income other than earnings is the algebraic sum ofall sources of money income except wages andsalaries and income from self-employment.
Alternative Measures of Income
Table 12 shows data for the following 15 definitionsof income.1. Money income excluding capital gains before
taxes. This is the official definition used in CensusBureau reports.
a. Money income after taxes (without earnedincome credit (EIC)). This is definition 1 minusfederal and state income taxes exclusive of theEIC, minus payroll taxes, plus capital gains, andminus capital losses.
b. Money income after taxes (including EIC). Thisis definition 1a plus the EIC.
2. Definition 1 less government cash transfers. Gov-ernment cash transfers include nonmeans-testedtransfers such as social security payments, unem-ployment compensation, and government educa-tional assistance (e.g., Pell Grants), as well asmeans-tested transfers such as aid to families withdependent children (AFDC, ADC), temporary assis-tance to needy families (TANF), and supplementalsecurity income (SSI). (For a complete listing oftransfer income, see definitions 9 and 12.)
3. Definition 2 plus capital gains. Realized capitalgains and losses are simulated as part of the Cen-sus Bureau’s federal individual income tax estima-tion procedure.
4. Definition 3 plus imputed health insurance supple-ments to wage or salary income. Employer-paidhealth insurance coverage is treated as part oftotal worker compensation.
5. Definition 4 less payroll taxes. Payroll taxes arepayments for social security old age, survivors,and disability insurance, and for hospital insurance(medicare).
6. Definition 5 less federal income taxes. Definition 7shows the effect of the earned income credit (tar-geted to low-income workers) separately.
7. Definition 6 plus the earned income credit.
8. Definition 7 less state income taxes.
9. Definition 8 plus nonmeans-tested governmentcash transfers. Nonmeans-tested government cashtransfers include social security payments, unem-ployment compensation, workers’ compensation,nonmeans-tested veterans’ payments, U.S. railroadretirement, Black lung payments, Pell Grants, andother government educational assistance. (PellGrants are income-tested but are included herebecause they are very different from the assistanceprograms included in the means-tested category.)
10. Definition 9 plus the value of medicare. Medicare iscounted at its fungible value.1
11. Definition 10 plus the value of regular-price schoollunches.
12. Definition 11 plus means-tested government cashtransfers. Means-tested government cash trans-fers include AFDC, ADC, TANF, SSI, other publicassistance programs, and means-tested veterans’payments.
13. Definition 12 plus the value of medicaid. This defi-nition counts medicaid at its fungible value.
14. Definition 13 plus the value of other means-testedgovernment noncash transfers, including foodstamps, rent subsidies, and free and reduced-priceschool lunches.
a. Definition 14 less medical programs. This iscash income plus all noncash income exceptimputed income from own home, minus thefungible values of medicaid and medicare.
15. Definition 14 plus net imputed return on equity inone’s own home. This definition includes the esti-mated annual benefit of converting one’s homeequity into an annuity, net of property taxes.
MEAN INCOME
Mean income is the amount obtained by dividing thetotal aggregate income of a group by the number ofunits in that group. The means for households, families,and unrelated individuals are based on all households,
1The fungible approach for valuing medical coverage assignsincome to the extent that having the insurance would free upresources that would have been spent on medical care. Theestimated fungible value depends on family income, the cost offood and housing needs, and the market value of the medicalbenefits. If family income is not sufficient to cover the family’sbasic food and housing requirements, the fungible value meth-odology treats medicare and medicaid as having no incomevalue. If family income exceeds the cost of food and housingrequirements, the fungible value of medicare and medicaid isequal to the amount which exceeds the value assigned for foodand housing requirements (up to the amount of the market valueof an equivalent insurance policy (total cost divided by thenumber of participants in each risk class)).
A–4 APPENDIX A
U.S. Census Bureau

families, and unrelated individuals. The means forpeople are based on people 15 years old and over withincome.
MEDIAN INCOME
Median income is the amount which divides theincome distribution into two equal groups, half havingincomes above the median, half having incomes belowthe median. The medians for households, families, andunrelated individuals are based on all households, fami-lies, and unrelated individuals. The medians for peopleare based on people 15 years old and over withincome.
PER CAPITA INCOME
Per capita income is the mean income computed forevery man, woman, and child in a particular group. TheCensus Bureau derived per capita income by dividingthe total income of a particular group by the total popu-lation in that group (excluding patients or inmates ininstitutional quarters).
POPULATION COVERAGE
This report includes the civilian noninstitutionalpopulation of the United States and members of thearmed forces in the United States living off post or withtheir families on post, but excludes all other membersof the armed forces.
The Census Bureau collected the information on theHispanic population shown in this report in the 50states and the District of Columbia. Therefore, the His-panic population does not include residents of outlyingareas or U.S. territories such as Guam, Puerto Rico, andthe Virgin Islands.
ROUNDING
The Census Bureau rounds percentages to the near-est tenth of a percent; therefore, the percentages in adistribution do not always add to exactly 100.0 per-cent.
SYMBOLS
The Census Bureau uses the following abbreviationsand symbols in this publication:
– Represents zero or rounds to zero.B The base for the derived figure is less than
75,000.NA Not available.r Revised.X Not applicable.
UNRELATED INDIVIDUALS
The term ‘‘unrelated individuals’’ refers to people 15years and over (other than inmates of institutions) whoare not living with any relatives. An unrelated individualmay either:
• Constitute a one-person household,
• Be part of a household including one or more otherunrelated individuals or families,
or
• Reside in group quarters, such as a rooming house.
Thus, a widow living by herself or with one or moreother people not related to her, a lodger not related tothe householder or to anyone else in the household,and a servant living in an employer’s household with norelatives are examples of unrelated individuals.
WORK EXPERIENCE
A person with work experience is one who, duringthe preceding calendar year, did any work for pay orprofit or worked without pay on a family-operated farmor business at any time during the year, on a part-timeor full-time basis. A full-time worker is one who worked35 hours or more per week during a majority of theweeks worked during the preceding calendar year. Ayear-round worker is one who worked for 50 weeks ormore during the preceding calendar year. A full-time,year-round worker is a person who worked full time (35or more hours per week) and 50 or more weeks duringthe previous calendar year.
APPENDIX A A–5
U.S. Census Bureau
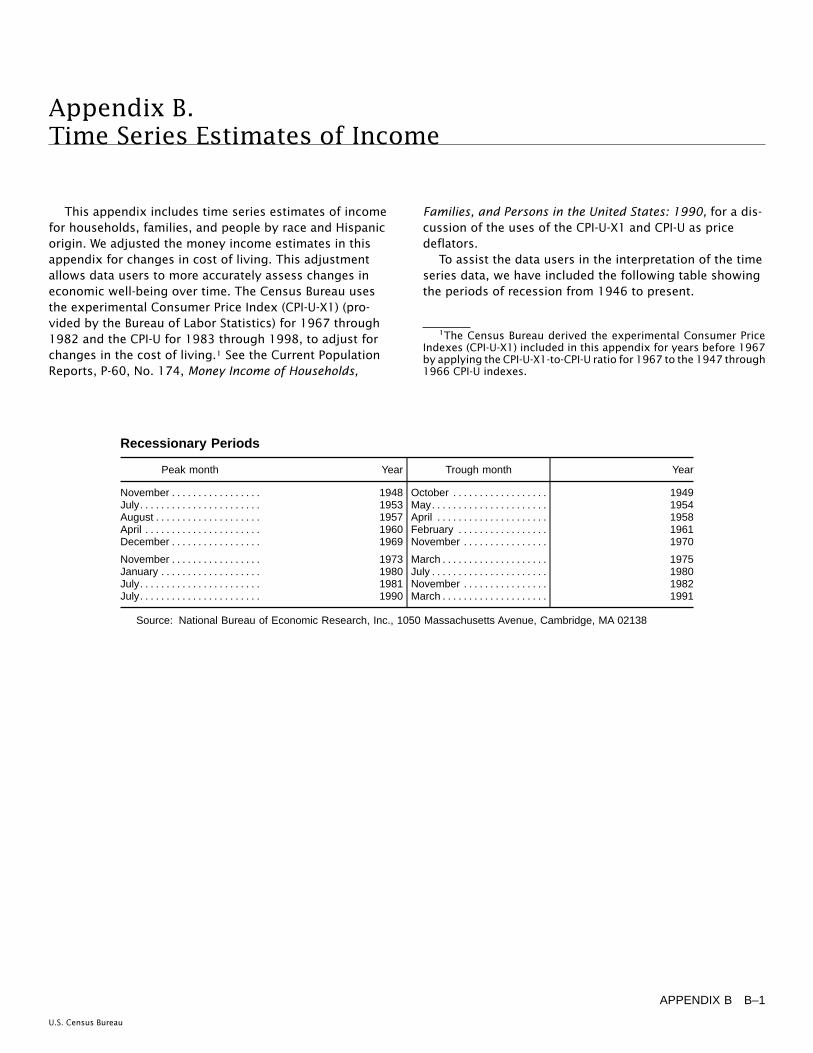
Appendix B.Time Series Estimates of Income
This appendix includes time series estimates of incomefor households, families, and people by race and Hispanicorigin. We adjusted the money income estimates in thisappendix for changes in cost of living. This adjustmentallows data users to more accurately assess changes ineconomic well-being over time. The Census Bureau usesthe experimental Consumer Price Index (CPI-U-X1) (pro-vided by the Bureau of Labor Statistics) for 1967 through1982 and the CPI-U for 1983 through 1998, to adjust forchanges in the cost of living.1 See the Current PopulationReports, P-60, No. 174, Money Income of Households,
Families, and Persons in the United States: 1990, for a dis-cussion of the uses of the CPI-U-X1 and CPI-U as pricedeflators.
To assist the data users in the interpretation of the timeseries data, we have included the following table showingthe periods of recession from 1946 to present.
Recessionary Periods
Peak month Year Trough month Year
November . . . . . . . . . . . . . . . . . 1948 October . . . . . . . . . . . . . . . . . . 1949July. . . . . . . . . . . . . . . . . . . . . . . 1953 May. . . . . . . . . . . . . . . . . . . . . . 1954August . . . . . . . . . . . . . . . . . . . . 1957 April . . . . . . . . . . . . . . . . . . . . . 1958April . . . . . . . . . . . . . . . . . . . . . . 1960 February . . . . . . . . . . . . . . . . . 1961December . . . . . . . . . . . . . . . . . 1969 November . . . . . . . . . . . . . . . . 1970
November . . . . . . . . . . . . . . . . . 1973 March . . . . . . . . . . . . . . . . . . . . 1975January . . . . . . . . . . . . . . . . . . . 1980 July . . . . . . . . . . . . . . . . . . . . . . 1980July. . . . . . . . . . . . . . . . . . . . . . . 1981 November . . . . . . . . . . . . . . . . 1982July. . . . . . . . . . . . . . . . . . . . . . . 1990 March . . . . . . . . . . . . . . . . . . . . 1991
Source: National Bureau of Economic Research, Inc., 1050 Massachusetts Avenue, Cambridge, MA 02138
1The Census Bureau derived the experimental Consumer PriceIndexes (CPI-U-X1) included in this appendix for years before 1967by applying the CPI-U-X1-to-CPI-U ratio for 1967 to the 1947 through1966 CPI-U indexes.
APPENDIX B B–1
U.S. Census Bureau

Table B–1. Annual Average Consumer Price Index (CPI-U): 1947 to 1998
Year CPI-U1
1947. . . . . . . . . . . . . . . . . . . . . . . . . . . . . . . . . . . . . . . . . . . . . 24.21948. . . . . . . . . . . . . . . . . . . . . . . . . . . . . . . . . . . . . . . . . . . . . 26.21949. . . . . . . . . . . . . . . . . . . . . . . . . . . . . . . . . . . . . . . . . . . . . 25.91950. . . . . . . . . . . . . . . . . . . . . . . . . . . . . . . . . . . . . . . . . . . . . 26.21951. . . . . . . . . . . . . . . . . . . . . . . . . . . . . . . . . . . . . . . . . . . . . 28.3
1952. . . . . . . . . . . . . . . . . . . . . . . . . . . . . . . . . . . . . . . . . . . . . 28.81953. . . . . . . . . . . . . . . . . . . . . . . . . . . . . . . . . . . . . . . . . . . . . 29.01954. . . . . . . . . . . . . . . . . . . . . . . . . . . . . . . . . . . . . . . . . . . . . 29.21955. . . . . . . . . . . . . . . . . . . . . . . . . . . . . . . . . . . . . . . . . . . . . 29.11956. . . . . . . . . . . . . . . . . . . . . . . . . . . . . . . . . . . . . . . . . . . . . 29.6
1957. . . . . . . . . . . . . . . . . . . . . . . . . . . . . . . . . . . . . . . . . . . . . 30.51958. . . . . . . . . . . . . . . . . . . . . . . . . . . . . . . . . . . . . . . . . . . . . 31.41959. . . . . . . . . . . . . . . . . . . . . . . . . . . . . . . . . . . . . . . . . . . . . 31.61960. . . . . . . . . . . . . . . . . . . . . . . . . . . . . . . . . . . . . . . . . . . . . 32.21961. . . . . . . . . . . . . . . . . . . . . . . . . . . . . . . . . . . . . . . . . . . . . 32.5
1962. . . . . . . . . . . . . . . . . . . . . . . . . . . . . . . . . . . . . . . . . . . . . 32.81963. . . . . . . . . . . . . . . . . . . . . . . . . . . . . . . . . . . . . . . . . . . . . 33.31964. . . . . . . . . . . . . . . . . . . . . . . . . . . . . . . . . . . . . . . . . . . . . 33.71965. . . . . . . . . . . . . . . . . . . . . . . . . . . . . . . . . . . . . . . . . . . . . 34.21966. . . . . . . . . . . . . . . . . . . . . . . . . . . . . . . . . . . . . . . . . . . . . 35.2
1967. . . . . . . . . . . . . . . . . . . . . . . . . . . . . . . . . . . . . . . . . . . . . 36.31968. . . . . . . . . . . . . . . . . . . . . . . . . . . . . . . . . . . . . . . . . . . . . 37.71969. . . . . . . . . . . . . . . . . . . . . . . . . . . . . . . . . . . . . . . . . . . . . 39.41970. . . . . . . . . . . . . . . . . . . . . . . . . . . . . . . . . . . . . . . . . . . . . 41.31971. . . . . . . . . . . . . . . . . . . . . . . . . . . . . . . . . . . . . . . . . . . . . 43.11972. . . . . . . . . . . . . . . . . . . . . . . . . . . . . . . . . . . . . . . . . . . . . 44.4
Year CPI-U1
1973. . . . . . . . . . . . . . . . . . . . . . . . . . . . . . . . . . . . . . . . . . . . . 47.21974. . . . . . . . . . . . . . . . . . . . . . . . . . . . . . . . . . . . . . . . . . . . . 51.91975. . . . . . . . . . . . . . . . . . . . . . . . . . . . . . . . . . . . . . . . . . . . . 56.21976. . . . . . . . . . . . . . . . . . . . . . . . . . . . . . . . . . . . . . . . . . . . . 59.4
1977. . . . . . . . . . . . . . . . . . . . . . . . . . . . . . . . . . . . . . . . . . . . . 63.21978. . . . . . . . . . . . . . . . . . . . . . . . . . . . . . . . . . . . . . . . . . . . . 67.51979. . . . . . . . . . . . . . . . . . . . . . . . . . . . . . . . . . . . . . . . . . . . . 74.01980. . . . . . . . . . . . . . . . . . . . . . . . . . . . . . . . . . . . . . . . . . . . . 82.31981. . . . . . . . . . . . . . . . . . . . . . . . . . . . . . . . . . . . . . . . . . . . . 90.1
1982. . . . . . . . . . . . . . . . . . . . . . . . . . . . . . . . . . . . . . . . . . . . . 95.61983. . . . . . . . . . . . . . . . . . . . . . . . . . . . . . . . . . . . . . . . . . . . . 99.61984. . . . . . . . . . . . . . . . . . . . . . . . . . . . . . . . . . . . . . . . . . . . . 103.91985. . . . . . . . . . . . . . . . . . . . . . . . . . . . . . . . . . . . . . . . . . . . . 107.61986. . . . . . . . . . . . . . . . . . . . . . . . . . . . . . . . . . . . . . . . . . . . . 109.6
1987. . . . . . . . . . . . . . . . . . . . . . . . . . . . . . . . . . . . . . . . . . . . . 113.61988. . . . . . . . . . . . . . . . . . . . . . . . . . . . . . . . . . . . . . . . . . . . . 118.31989. . . . . . . . . . . . . . . . . . . . . . . . . . . . . . . . . . . . . . . . . . . . . 124.01990. . . . . . . . . . . . . . . . . . . . . . . . . . . . . . . . . . . . . . . . . . . . . 130.71991. . . . . . . . . . . . . . . . . . . . . . . . . . . . . . . . . . . . . . . . . . . . . 136.2
1992. . . . . . . . . . . . . . . . . . . . . . . . . . . . . . . . . . . . . . . . . . . . . 140.31993. . . . . . . . . . . . . . . . . . . . . . . . . . . . . . . . . . . . . . . . . . . . . 144.51994. . . . . . . . . . . . . . . . . . . . . . . . . . . . . . . . . . . . . . . . . . . . . 148.21995. . . . . . . . . . . . . . . . . . . . . . . . . . . . . . . . . . . . . . . . . . . . . 152.41996. . . . . . . . . . . . . . . . . . . . . . . . . . . . . . . . . . . . . . . . . . . . . 156.91997. . . . . . . . . . . . . . . . . . . . . . . . . . . . . . . . . . . . . . . . . . . . . 160.51998. . . . . . . . . . . . . . . . . . . . . . . . . . . . . . . . . . . . . . . . . . . . . 163.0
1The Census Bureau uses the Bureau of Labor Statistics’ experimental Consumer Price Index (CPI-U-X1) for 1967 through 1982 and the CPI-U for1983 through 1998. The Census Bureau derived the CPI-U indexes for years before 1967 by applying the 1967 CPI-U-X1-to-CPI-U ratio to the 1947to 1966 CPI-U indexes.
Note: Data users can compute the percentage changes in prices between earlier years’ data and 1998 by dividing the annual average ConsumerPrice Index (CPI-U) for 1998 by the annual average for the earlier year(s).
U.S. Census Bureau
B–2 APPENDIX B

Table B–2. Households by Total Money Income, Race, and Hispanic Origin of Householder:1967 to 1998
[Income in 1998 CPI~U~X1 adjusted dollars. Households as of March of the following year. For meaning of symbols, see text]
Race and Hispanicorigin of house~holder and year
Percent distribution Median income Mean income
Number(1,000) Total
Under$5,000
$5,000to
$9,999
$10,000to
$14,999
$15,000to
$24,999
$25,000to
$34,999
$35,000to
$49,999
$50,000to
$74,999
$75,000to
$99,999
$100,000and
overValue
(dollars)
Standarderror
(dollars)Value
(dollars)
Standarderror
(dollars)
ALL RACES
1998 103 874.............. 100.0 3.2 7.1 7.8 14.0 13.2 16.0 18.6 9.6 10.5 38 885 230 51 855 2801997 102 528.............. 100.0 3.4 7.4 8.0 14.8 13.2 16.3 18.0 9.1 9.8 37 581 167 50 464 2741996 101 018.............. 100.0 3.3 8.0 8.2 15.1 13.4 16.2 18.1 8.7 9.0 36 872 186 48 955 2741995 99 627.............. 100.0 3.3 7.8 8.4 15.1 13.8 16.7 17.8 8.5 8.5 36 446 211 48 064 26319941 98 990............. 100.0 3.6 8.4 8.3 15.3 13.6 16.5 17.3 8.3 8.5 35 486 162 47 440 25519932 97 107............. 100.0 3.8 8.5 8.4 15.3 13.9 16.2 17.5 8.2 8.1 35 241 165 46 732 25319923 96 426............. 100.0 3.8 8.5 8.3 15.3 13.9 16.6 18.0 8.2 7.5 35 593 168 45 124 1891991 95 669.............. 100.0 3.5 8.5 7.9 14.9 14.1 17.0 18.1 8.5 7.6 36 054 174 45 384 1871990 94 312.............. 100.0 3.4 8.0 7.7 14.5 13.8 17.6 18.3 8.7 8.0 37 343 191 46 646 197
1989 93 347.............. 100.0 3.1 7.9 7.5 14.6 13.4 17.0 18.8 9.0 8.6 37 997 209 48 006 2091988 92 830.............. 100.0 3.3 8.4 7.3 14.8 13.2 17.0 19.0 8.9 8.1 37 512 183 46 870 20919874 91 124............. 100.0 3.3 8.3 7.7 14.5 13.3 16.9 19.1 9.0 7.8 37 394 178 46 504 1911986 89 479.............. 100.0 3.6 8.4 7.6 14.6 13.4 17.4 18.8 8.7 7.5 37 027 192 45 746 1861985 88 458.............. 100.0 3.6 8.6 7.8 15.3 13.9 17.7 18.1 8.5 6.5 35 778 194 44 031 1741984 86 789.............. 100.0 3.5 8.7 8.0 15.6 14.2 17.6 18.3 8.0 6.2 35 165 160 43 086 15819835 85 290............. 100.0 3.8 8.9 8.0 16.1 14.4 17.9 17.8 7.5 5.6 34 397 155 41 910 1551982 83 918.............. 100.0 3.6 9.0 8.3 15.9 14.6 18.1 17.8 7.3 5.4 34 392 155 41 447 1531981 83 527.............. 100.0 3.4 9.0 8.2 16.1 14.1 18.2 18.5 7.4 5.0 34 507 181 41 224 1501980 82 368.............. 100.0 3.1 9.0 8.2 15.6 14.0 19.0 18.6 7.5 5.1 35 076 180 41 717 153
19796 80 776............. 100.0 3.0 8.7 7.6 15.3 13.8 18.5 19.7 7.6 5.6 36 259 172 43 072 1631978 77 330.............. 100.0 2.8 8.7 8.1 15.2 13.7 18.8 19.8 7.7 5.3 36 377 147 42 815 1641977 76 030.............. 100.0 2.9 8.9 8.5 15.5 14.2 18.9 19.3 7.1 4.7 35 004 132 41 524 1261976 74 142.............. 100.0 3.0 9.0 8.3 15.8 14.3 19.6 19.0 6.8 4.3 34 812 129 40 948 1261975 72 867.............. 100.0 3.1 9.2 8.6 15.8 15.0 19.4 18.6 6.3 4.0 34 224 139 39 964 12519747 71 163............. 100.0 3.0 8.8 7.8 15.2 15.4 19.5 19.1 6.9 4.4 35 166 135 41 124 1291973 69 859.............. 100.0 3.5 8.0 8.1 14.7 14.6 19.5 19.7 7.1 4.8 36 302 138 41 983 1281972 68 251.............. 100.0 3.9 8.4 7.9 14.5 14.7 20.2 19.1 6.6 4.6 35 599 136 41 433 1281971 66 676.............. 100.0 4.5 8.8 7.5 15.4 15.5 20.9 17.8 5.8 3.7 34 143 132 39 267 1251970 64 778.............. 100.0 4.6 8.6 7.5 14.9 15.4 21.5 18.1 5.7 3.7 34 471 126 39 471 126
1969 63 401.............. 100.0 4.6 8.5 7.2 14.8 15.8 21.7 18.3 5.6 3.5 34 706 128 39 484 1241968 62 214.............. 100.0 4.9 8.4 7.6 15.1 17.2 21.6 17.4 4.8 2.9 33 478 121 37 875 1211967 60 813.............. 100.0 5.7 8.9 7.7 15.9 17.0 22.1 15.3 4.4 2.9 32 075 117 35 873 117
WHITE
1998 87 212.............. 100.0 2.6 6.1 7.4 13.7 13.2 16.3 19.3 10.0 11.3 40 912 205 54 207 3191997 86 106.............. 100.0 2.8 6.5 7.7 14.4 13.1 16.5 18.7 9.7 10.5 39 579 240 52 708 3051996 85 059.............. 100.0 2.5 7.1 7.8 14.8 13.5 16.6 18.9 9.1 9.7 38 606 199 50 899 3011995 84 511.............. 100.0 2.6 6.9 8.0 14.9 13.8 17.0 18.6 9.0 9.2 38 254 200 49 979 29019941 83 737............. 100.0 2.9 7.4 8.0 15.1 13.7 17.0 18.0 8.9 9.1 37 426 210 49 531 28819932 82 387............. 100.0 3.0 7.3 8.0 15.1 14.0 16.8 18.4 8.7 8.7 37 180 217 48 827 28219923 81 795............. 100.0 2.9 7.4 7.8 15.1 13.9 17.0 18.9 8.8 8.1 37 420 181 47 162 2101991 81 675.............. 100.0 2.6 7.3 7.6 14.6 14.2 17.4 18.9 9.1 8.1 37 781 183 47 300 2061990 80 968.............. 100.0 2.6 7.0 7.3 14.3 14.0 17.9 19.2 9.2 8.6 38 949 178 48 528 217
1989 80 163.............. 100.0 2.4 6.8 7.1 14.3 13.5 17.4 19.8 9.5 9.2 39 969 195 50 006 2311988 79 734.............. 100.0 2.7 7.1 6.8 14.5 13.2 17.7 19.9 9.4 8.7 39 656 234 48 870 23019874 78 519............. 100.0 2.7 7.1 7.2 14.2 13.3 17.5 20.0 9.6 8.4 39 398 199 48 491 2091986 77 284.............. 100.0 2.9 7.4 7.2 14.2 13.5 17.9 19.7 9.2 8.0 38 928 189 47 651 2041985 76 576.............. 100.0 3.0 7.5 7.4 14.9 14.0 18.2 18.9 9.0 7.1 37 732 201 45 838 1921984 75 328.............. 100.0 2.9 7.6 7.5 15.2 14.3 18.1 19.3 8.5 6.7 37 098 187 44 863 17419835 74 170............. 100.0 3.1 7.7 7.5 15.8 14.6 18.5 18.6 8.0 6.1 36 061 162 43 661 1691982 73 182.............. 100.0 3.0 8.0 7.8 15.5 14.8 18.6 18.6 7.9 5.9 36 005 164 43 156 1691981 72 845.............. 100.0 2.8 7.9 7.7 15.7 14.2 18.8 19.4 8.0 5.4 36 459 168 42 952 1631980 71 872.............. 100.0 2.6 8.0 7.7 15.2 14.1 19.5 19.6 7.9 5.5 37 005 190 43 400 166
19796 70 766............. 100.0 2.5 7.8 7.1 14.8 13.9 19.0 20.7 8.1 6.0 38 016 181 44 770 1781978 68 028.............. 100.0 2.5 7.7 7.6 14.8 13.6 19.3 20.8 8.1 5.7 37 816 167 44 401 1791977 66 934.............. 100.0 2.6 7.9 8.0 14.9 14.2 19.5 20.4 7.5 5.1 36 809 155 43 146 1391976 65 353.............. 100.0 2.6 8.0 7.7 15.4 14.3 20.1 20.0 7.2 4.7 36 466 151 42 523 1371975 64 392.............. 100.0 2.7 8.2 8.1 15.5 14.9 19.9 19.6 6.7 4.4 35 790 131 41 440 13619747 62 984............. 100.0 2.6 7.9 7.3 14.6 15.4 20.1 20.0 7.3 4.7 36 777 138 42 647 1381973 61 965.............. 100.0 3.1 7.3 7.5 14.1 14.5 20.0 20.8 7.6 5.1 38 046 145 43 606 1381972 60 618.............. 100.0 3.4 7.7 7.3 13.9 14.7 20.9 20.0 7.1 5.0 37 347 143 43 044 1401971 59 463.............. 100.0 4.0 8.0 7.0 14.8 15.4 21.7 18.8 6.2 4.0 35 713 136 40 689 1321970 57 575.............. 100.0 4.1 7.9 7.0 14.3 15.4 22.2 19.0 6.1 4.0 35 903 138 40 853 134
1969 56 248.............. 100.0 4.1 7.9 6.7 14.0 15.8 22.4 19.4 5.9 3.9 36 220 132 40 949 1371968 55 394.............. 100.0 4.4 7.8 7.0 14.4 17.4 22.4 18.4 5.1 3.2 34 857 130 39 237 1301967 54 188.............. 100.0 5.2 8.3 7.1 15.2 17.1 23.1 16.3 4.6 3.2 33 449 121 37 185 126
See footnotes at end of table.
APPENDIX B B–3U.S. Census Bureau
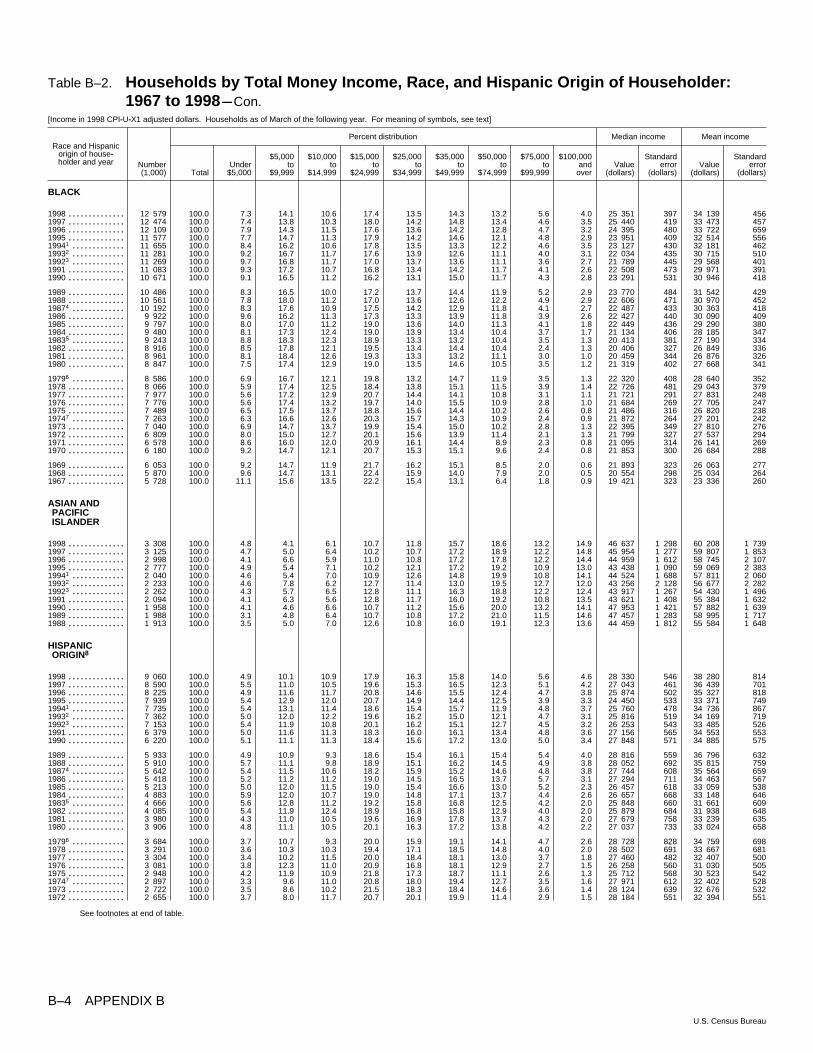
Table B–2. Households by Total Money Income, Race, and Hispanic Origin of Householder:1967 to 1998mCon.
[Income in 1998 CPI~U~X1 adjusted dollars. Households as of March of the following year. For meaning of symbols, see text]
Race and Hispanicorigin of house~holder and year
Percent distribution Median income Mean income
Number(1,000) Total
Under$5,000
$5,000to
$9,999
$10,000to
$14,999
$15,000to
$24,999
$25,000to
$34,999
$35,000to
$49,999
$50,000to
$74,999
$75,000to
$99,999
$100,000and
overValue
(dollars)
Standarderror
(dollars)Value
(dollars)
Standarderror
(dollars)
BLACK
1998 12 579.............. 100.0 7.3 14.1 10.6 17.4 13.5 14.3 13.2 5.6 4.0 25 351 397 34 139 4561997 12 474.............. 100.0 7.4 13.8 10.3 18.0 14.2 14.8 13.4 4.6 3.5 25 440 419 33 473 4571996 12 109.............. 100.0 7.9 14.3 11.5 17.6 13.6 14.2 12.8 4.7 3.2 24 395 480 33 722 6591995 11 577.............. 100.0 7.7 14.7 11.3 17.9 14.2 14.6 12.1 4.8 2.9 23 951 409 32 514 55619941 11 655............. 100.0 8.4 16.2 10.6 17.8 13.5 13.3 12.2 4.6 3.5 23 127 430 32 181 46219932 11 281............. 100.0 9.2 16.7 11.7 17.6 13.9 12.6 11.1 4.0 3.1 22 034 435 30 715 51019923 11 269............. 100.0 9.7 16.8 11.7 17.0 13.7 13.6 11.1 3.6 2.7 21 789 445 29 568 4011991 11 083.............. 100.0 9.3 17.2 10.7 16.8 13.4 14.2 11.7 4.1 2.6 22 508 473 29 971 3911990 10 671.............. 100.0 9.1 16.5 11.2 16.2 13.1 15.0 11.7 4.3 2.8 23 291 531 30 946 418
1989 10 486.............. 100.0 8.3 16.5 10.0 17.2 13.7 14.4 11.9 5.2 2.9 23 770 484 31 542 4291988 10 561.............. 100.0 7.8 18.0 11.2 17.0 13.6 12.6 12.2 4.9 2.9 22 606 471 30 970 45219874 10 192............. 100.0 8.3 17.6 10.9 17.5 14.2 12.9 11.8 4.1 2.7 22 487 433 30 363 4181986 9 922.............. 100.0 9.6 16.2 11.3 17.3 13.3 13.9 11.8 3.9 2.6 22 427 440 30 090 4091985 9 797.............. 100.0 8.0 17.0 11.2 19.0 13.6 14.0 11.3 4.1 1.8 22 449 436 29 290 3801984 9 480.............. 100.0 8.1 17.3 12.4 19.0 13.9 13.4 10.4 3.7 1.7 21 134 406 28 185 34719835 9 243............. 100.0 8.8 18.3 12.3 18.9 13.3 13.2 10.4 3.5 1.3 20 413 381 27 190 3341982 8 916.............. 100.0 8.5 17.8 12.1 19.5 13.4 14.4 10.4 2.4 1.3 20 406 327 26 849 3361981 8 961.............. 100.0 8.1 18.4 12.6 19.3 13.3 13.2 11.1 3.0 1.0 20 459 344 26 876 3261980 8 847.............. 100.0 7.5 17.4 12.9 19.0 13.5 14.6 10.5 3.5 1.2 21 319 402 27 668 341
19796 8 586............. 100.0 6.9 16.7 12.1 19.8 13.2 14.7 11.9 3.5 1.3 22 320 408 28 640 3521978 8 066.............. 100.0 5.9 17.4 12.5 18.4 13.8 15.1 11.5 3.9 1.4 22 726 481 29 043 3791977 7 977.............. 100.0 5.6 17.2 12.9 20.7 14.4 14.1 10.8 3.1 1.1 21 721 291 27 831 2481976 7 776.............. 100.0 5.6 17.4 13.2 19.7 14.0 15.5 10.9 2.8 1.0 21 684 269 27 705 2471975 7 489.............. 100.0 6.5 17.5 13.7 18.8 15.6 14.4 10.2 2.6 0.8 21 486 316 26 820 23819747 7 263............. 100.0 6.3 16.6 12.6 20.3 15.7 14.3 10.9 2.4 0.9 21 872 264 27 201 2421973 7 040.............. 100.0 6.9 14.7 13.7 19.9 15.4 15.0 10.2 2.8 1.3 22 395 349 27 810 2761972 6 809.............. 100.0 8.0 15.0 12.7 20.1 15.6 13.9 11.4 2.1 1.3 21 799 327 27 537 2941971 6 578.............. 100.0 8.6 16.0 12.0 20.9 16.1 14.4 8.9 2.3 0.8 21 095 314 26 141 2691970 6 180.............. 100.0 9.2 14.7 12.1 20.7 15.3 15.1 9.6 2.4 0.8 21 853 300 26 684 288
1969 6 053.............. 100.0 9.2 14.7 11.9 21.7 16.2 15.1 8.5 2.0 0.6 21 893 323 26 063 2771968 5 870.............. 100.0 9.6 14.7 13.1 22.4 15.9 14.0 7.9 2.0 0.5 20 554 298 25 034 2641967 5 728.............. 100.0 11.1 15.6 13.5 22.2 15.4 13.1 6.4 1.8 0.9 19 421 323 23 336 260
ASIAN ANDPACIFICISLANDER
1998 3 308.............. 100.0 4.8 4.1 6.1 10.7 11.8 15.7 18.6 13.2 14.9 46 637 1 298 60 208 1 7391997 3 125.............. 100.0 4.7 5.0 6.4 10.2 10.7 17.2 18.9 12.2 14.8 45 954 1 277 59 807 1 8531996 2 998.............. 100.0 4.1 6.6 5.9 11.0 10.8 17.2 17.8 12.2 14.4 44 959 1 612 58 745 2 1071995 2 777.............. 100.0 4.9 5.4 7.1 10.2 12.1 17.2 19.2 10.9 13.0 43 438 1 090 59 069 2 38319941 2 040............. 100.0 4.6 5.4 7.0 10.9 12.6 14.8 19.9 10.8 14.1 44 524 1 688 57 811 2 06019932 2 233............. 100.0 4.6 7.8 6.2 12.7 11.4 13.0 19.5 12.7 12.0 43 256 2 128 56 677 2 28219923 2 262............. 100.0 4.3 5.7 6.5 12.8 11.1 16.3 18.8 12.2 12.4 43 917 1 267 54 430 1 4961991 2 094.............. 100.0 4.1 6.3 5.6 12.8 11.7 16.0 19.2 10.8 13.5 43 621 1 408 55 384 1 6321990 1 958.............. 100.0 4.1 4.6 6.6 10.7 11.2 15.6 20.0 13.2 14.1 47 953 1 421 57 882 1 6391989 1 988.............. 100.0 3.1 4.8 6.4 10.7 10.8 17.2 21.0 11.5 14.6 47 457 1 283 58 995 1 7171988 1 913.............. 100.0 3.5 5.0 7.0 12.6 10.8 16.0 19.1 12.3 13.6 44 459 1 812 55 584 1 648
HISPANICORIGIN8
1998 9 060.............. 100.0 4.9 10.1 10.9 17.9 16.3 15.8 14.0 5.6 4.6 28 330 546 38 280 8141997 8 590.............. 100.0 5.5 11.0 10.5 19.6 15.3 16.5 12.3 5.1 4.2 27 043 461 36 439 7011996 8 225.............. 100.0 4.9 11.6 11.7 20.8 14.6 15.5 12.4 4.7 3.8 25 874 502 35 327 8181995 7 939.............. 100.0 5.4 12.9 12.0 20.7 14.9 14.4 12.5 3.9 3.3 24 450 533 33 371 74919941 7 735............. 100.0 5.4 13.1 11.4 18.6 15.4 15.7 11.9 4.8 3.7 25 760 478 34 736 86719932 7 362............. 100.0 5.0 12.0 12.2 19.6 16.2 15.0 12.1 4.7 3.1 25 816 519 34 169 71919923 7 153............. 100.0 5.4 11.9 10.8 20.1 16.2 15.1 12.7 4.5 3.2 26 253 543 33 485 5261991 6 379.............. 100.0 5.0 11.6 11.3 18.3 16.0 16.1 13.4 4.8 3.6 27 156 565 34 553 5531990 6 220.............. 100.0 5.1 11.1 11.3 18.4 15.6 17.2 13.0 5.0 3.4 27 848 571 34 885 575
1989 5 933.............. 100.0 4.9 10.9 9.3 18.6 15.4 16.1 15.4 5.4 4.0 28 816 559 36 796 6321988 5 910.............. 100.0 5.7 11.1 9.8 18.9 15.1 16.2 14.5 4.9 3.8 28 052 692 35 815 75919874 5 642............. 100.0 5.4 11.5 10.6 18.2 15.9 15.2 14.6 4.8 3.8 27 744 608 35 564 6591986 5 418.............. 100.0 5.2 11.2 11.2 19.0 14.5 16.5 13.7 5.7 3.1 27 294 711 34 463 5671985 5 213.............. 100.0 5.0 12.0 11.5 19.0 15.4 16.6 13.0 5.2 2.3 26 457 618 33 059 5381984 4 883.............. 100.0 5.9 12.0 10.7 19.0 14.8 17.1 13.7 4.4 2.6 26 657 668 33 148 64619835 4 666............. 100.0 5.6 12.8 11.2 19.2 15.8 16.8 12.5 4.2 2.0 25 848 660 31 661 6091982 4 085.............. 100.0 5.4 11.9 12.4 18.9 16.8 15.8 12.9 4.0 2.0 25 879 684 31 938 6481981 3 980.............. 100.0 4.3 11.0 10.5 19.6 16.9 17.8 13.7 4.3 2.0 27 679 758 33 239 6351980 3 906.............. 100.0 4.8 11.1 10.5 20.1 16.3 17.2 13.8 4.2 2.2 27 037 733 33 024 658
19796 3 684............. 100.0 3.7 10.7 9.3 20.0 15.9 19.1 14.1 4.7 2.6 28 728 828 34 759 6981978 3 291.............. 100.0 3.6 10.3 10.3 19.4 17.1 18.5 14.8 4.0 2.0 28 502 691 33 667 6811977 3 304.............. 100.0 3.4 10.2 11.5 20.0 18.4 18.1 13.0 3.7 1.8 27 460 482 32 407 5001976 3 081.............. 100.0 3.8 12.3 11.0 20.9 16.8 18.1 12.9 2.7 1.5 26 258 560 31 030 5051975 2 948.............. 100.0 4.2 11.9 10.9 21.8 17.3 18.7 11.1 2.6 1.3 25 712 568 30 523 54219747 2 897............. 100.0 3.3 9.6 11.0 20.8 18.0 19.4 12.7 3.5 1.6 27 971 612 32 402 5281973 2 722.............. 100.0 3.5 8.6 10.2 21.5 18.3 18.4 14.6 3.6 1.4 28 124 639 32 676 5321972 2 655.............. 100.0 3.7 8.0 11.7 20.7 20.1 19.9 11.4 2.9 1.5 28 184 551 32 394 551
See footnotes at end of table.
B–4 APPENDIX BU.S. Census Bureau

Table B–2. Households by Total Money Income, Race, and Hispanic Origin of Householder:1967 to 1998mCon.
[Income in 1998 CPI~U~X1 adjusted dollars. Households as of March of the following year. For meaning of symbols, see text]
Race and Hispanicorigin of house~holder and year
Percent distribution Median income Mean income
Number(1,000) Total
Under$5,000
$5,000to
$9,999
$10,000to
$14,999
$15,000to
$24,999
$25,000to
$34,999
$35,000to
$49,999
$50,000to
$74,999
$75,000to
$99,999
$100,000and
overValue
(dollars)
Standarderror
(dollars)Value
(dollars)
Standarderror
(dollars)
NON~HISPANICWHITE
1998 78 577.............. 100.0 2.4 5.7 7.0 13.2 12.8 16.4 19.9 10.5 12.1 42 439 244 55 943 3421997 77 936.............. 100.0 2.5 6.1 7.4 13.9 12.8 16.5 19.4 10.2 11.2 41 209 206 54 404 3351996 77 240.............. 100.0 2.3 6.6 7.4 14.2 13.3 16.6 19.6 9.6 10.2 40 295 276 52 438 3181995 76 932.............. 100.0 2.4 6.3 7.6 14.3 13.6 17.3 19.2 9.5 9.8 39 764 207 51 609 30919941 77 004............. 100.0 2.7 6.9 7.7 14.8 13.5 17.1 18.6 9.2 9.6 38 634 205 50 793 30119932 75 697............. 100.0 2.9 6.9 7.6 14.6 13.8 17.0 19.0 9.0 9.2 38 548 226 50 114 29919923 75 107............. 100.0 2.7 7.0 7.5 14.7 13.7 17.2 19.4 9.2 8.6 38 676 239 48 360 2231991 75 625.............. 100.0 2.5 7.0 7.3 14.3 14.1 17.5 19.4 9.4 8.5 38 683 190 48 315 2171990 75 035.............. 100.0 2.5 6.7 7.0 14.0 13.8 18.0 19.7 9.5 9.0 39 840 186 49 603 229
1989 74 495.............. 100.0 2.2 6.5 7.0 14.0 13.3 17.5 20.1 9.8 9.6 40 829 200 51 007 2431988 74 067.............. 100.0 2.4 6.8 6.6 14.2 13.1 17.8 20.3 9.8 9.1 40 749 229 49 867 22919874 73 120............. 100.0 2.5 6.8 7.0 13.9 13.1 17.6 20.4 10.0 8.7 40 482 235 49 440 2271986 72 067.............. 100.0 2.7 7.2 6.9 13.9 13.4 17.9 20.2 9.5 8.4 39 813 205 48 597 2231985 71 540.............. 100.0 2.8 7.2 7.1 14.6 13.9 18.3 19.4 9.3 7.4 38 581 197 46 731 2111984 70 586.............. 100.0 2.7 7.3 7.3 14.9 14.3 18.2 19.6 8.8 7.0 37 868 210 45 643 19819835 69 648............. 100.0 3.0 7.4 7.2 15.6 14.6 18.6 19.0 8.3 6.4 36 765 196 44 434 1931982 69 214.............. 100.0 2.9 7.8 7.5 15.3 14.6 18.7 19.0 8.1 6.1 36 609 184 43 790 1911981 68 996.............. 100.0 2.7 7.8 7.5 15.5 14.1 18.9 19.7 8.2 5.6 36 985 188 43 493 1851980 68 106.............. 100.0 2.4 7.8 7.5 14.9 14.0 19.6 19.9 8.1 5.7 37 660 214 43 970 190
19796 67 203............. 100.0 2.5 7.7 7.0 14.5 13.8 19.0 21.0 8.3 6.2 38 552 214 45 288 2001978 64 836.............. 100.0 2.4 7.6 7.5 14.6 13.5 19.3 21.1 8.3 5.9 38 528 203 44 925 2001977 63 721.............. 100.0 2.5 7.8 7.8 14.6 14.0 19.5 20.8 7.7 5.3 37 539 211 43 680 2011976 62 365.............. 100.0 2.6 7.8 7.5 15.1 14.2 20.1 20.3 7.5 4.8 37 210 217 43 069 1981975 61 533.............. 100.0 2.6 8.1 7.9 15.2 14.8 20.0 20.0 6.9 4.5 36 060 191 41 948 19419747 60 164............. 100.0 2.6 7.8 7.1 14.3 15.3 20.1 20.4 7.5 4.9 37 091 182 43 127 1981973 59 236.............. 100.0 3.0 7.2 7.4 13.8 14.3 20.1 21.1 7.8 5.3 38 381 180 44 093 1861972 58 005.............. 100.0 3.4 7.6 7.1 13.6 14.4 21.0 20.4 7.3 5.1 37 879 180 43 544 195
1Introduction of new 1990 census sample design.2Data collection method changed from paper and pencil to computer~assisted interviewing; earnings limits increased to $999,999; social security limits increased to $49,999; SSI and public
assistance limits increased to $24,999; veterans’ benefits limits increased to $99,999; child support and alimony limits decreased to $49,999.3Based on 1990 census adjusted population controls.4Implementation of a new March CPS processing system.5Implementation of Hispanic population weighting controls.6Implementation of 1980 census population controls.7Implementation of a new March CPS processing system.8Hispanics may be of any race. Income data for Hispanic origin households are not available prior to 1972.
APPENDIX B B–5U.S. Census Bureau

Table B–3. Share of Aggregate Income Received by Each Fifth and Top 5 Percent ofHouseholds by Race and Hispanic Origin of Householder: 1967 to 1998
[Households as of March of the following year. Income in 1998 CPI~U adjusted dollars. Before 1983, constant dollar entries are based on the CPI~U~X1]
Year and race
Upper limit of each fifth(dollars) Share of aggregate income
Number(1,000) Lowest Second Third Fourth
Lowerlimit of
top 5percent
(dollars) Lowest Second Third Fourth HighestTop 5
percent
Meanincome
(dollars) Gini ratio
ALL RACES
1998 103 874....................................... 16 116 30 408 48 337 75 000 132 199 3.6 9.0 15.0 23.2 49.2 21.4 51 855 0.4561997 102 528....................................... 15 640 29 655 46 716 72 614 128 521 3.6 8.9 15.0 23.2 49.4 21.7 50 466 0.4591996 101 018....................................... 15 342 28 839 45 717 70 659 124 187 3.7 9.0 15.1 23.3 49.0 21.4 48 955 0.45519951 99 627...................................... 15 402 28 786 44 923 69 654 120 860 3.7 9.1 15.2 23.3 48.7 21.0 48 064 0.45019942 98 990...................................... 14 767 27 717 44 105 69 117 120 788 3.6 8.9 15.0 23.4 49.1 21.2 47 440 0.45619933 97 107...................................... 14 627 27 839 43 760 68 020 118 036 3.6 9.0 15.1 23.5 48.9 21.0 46 732 0.45419924 96 426...................................... 14 639 28 046 44 032 67 392 115 041 3.8 9.4 15.8 24.2 46.9 18.6 45 124 0.4341991 95 699....................................... 15 065 28 722 44 364 67 929 115 369 3.8 9.6 15.9 24.2 46.5 18.1 45 384 0.4281990 94 312....................................... 15 589 29 510 45 146 68 848 118 163 3.9 9.6 15.9 24.0 46.6 18.6 46 646 0.4281989 93 347....................................... 15 900 30 234 46 468 70 603 120 607 3.8 9.5 15.8 24.0 46.8 18.9 48 006 0.431
1988 92 830....................................... 15 683 29 624 46 166 69 710 117 999 3.8 9.6 16.0 24.3 46.3 18.3 46 870 0.42719875 91 124...................................... 15 496 29 415 45 915 69 394 116 120 3.8 9.6 16.1 24.3 46.2 18.2 46 504 0.4261986 89 479....................................... 15 405 29 422 45 442 68 591 116 340 3.9 9.7 16.2 24.5 45.7 17.5 45 746 0.42519856 88 458...................................... 15 149 28 558 43 965 66 365 110 984 4.0 9.7 16.3 24.6 45.3 17.0 44 031 0.4191984 86 789....................................... 15 061 28 088 43 152 65 263 109 174 4.1 9.9 16.4 24.7 44.9 16.5 43 086 0.41519837 85 290...................................... 14 729 27 450 42 089 63 658 105 721 4.1 10.0 16.5 24.7 44.7 16.4 41 570 0.4141982 83 918....................................... 14 527 27 297 41 875 62 523 104 189 4.1 10.1 16.6 24.7 44.5 16.2 41 447 0.4121981 83 527....................................... 14 762 27 198 42 326 62 595 101 852 4.2 10.2 16.8 25.0 43.8 15.6 41 224 0.4061980 82 368....................................... 14 965 27 926 42 800 62 784 101 999 4.3 10.3 16.9 24.9 43.7 15.8 41 717 0.40319798 80 776...................................... 15 439 28 712 44 109 64 092 104 551 4.2 10.3 16.9 24.7 44.0 16.4 43 072 0.404
1978 77 330....................................... 15 416 28 978 43 819 63 811 102 804 4.3 10.3 16.9 24.8 43.7 16.2 42 815 0.4021977 76 030....................................... 14 992 28 112 42 635 62 157 100 485 4.4 10.3 17.0 24.8 43.6 16.1 41 524 0.40219769 74 142...................................... 15 035 27 806 42 322 60 897 97 092 4.4 10.4 17.1 24.8 43.3 16.0 40 948 0.398197510 72 867..................................... 14 574 27 408 41 318 59 446 94 787 4.4 10.5 17.1 24.8 43.2 15.9 39 964 0.397197410 11 71 163................................... 15 461 28 561 42 085 61 095 97 627 4.4 10.6 17.1 24.7 43.1 15.9 41 124 0.3951973 69 859....................................... 15 257 28 984 42 995 62 109 98 453 4.2 10.5 17.1 24.6 43.6 16.6 41 983 0.397197212 68 251..................................... 14 868 28 635 42 329 60 574 97 506 4.1 10.5 17.1 24.5 43.9 17.0 41 433 0.401197113 66 676..................................... 14 371 27 396 40 315 57 485 91 288 4.1 10.6 17.3 24.5 43.5 16.7 39 267 0.3961970 64 778....................................... 14 552 27 880 40 557 57 863 91 477 4.1 10.8 17.4 24.5 43.3 16.6 39 471 0.3941969 63 401....................................... 14 786 28 380 41 040 57 505 90 188 4.1 10.9 17.5 24.5 43.0 16.6 39 484 0.3911968 62 214....................................... 14 367 27 239 39 042 54 858 85 824 4.2 11.1 17.5 24.4 42.8 16.6 37 875 0.388196714 60 813..................................... 13 471 26 269 37 297 53 170 85 317 4.0 10.8 17.3 24.2 43.8 17.5 35 873 0.399
WHITE
1998 87 212....................................... 17 779 32 250 50 258 77 330 136 377 3.8 9.2 15.1 23.1 48.8 21.5 54 207 0.4501997 86 106....................................... 16 982 31 239 48 870 75 364 132 407 3.8 9.1 15.0 23.0 49.1 21.7 52 710 0.4531996 85 059....................................... 16 622 30 585 47 788 72 929 127 415 3.9 9.2 15.2 23.2 48.4 21.1 50 899 0.44619951 84 511...................................... 16 557 30 435 46 953 71 805 125 024 4.0 9.3 15.3 23.3 48.1 20.7 49 979 0.44219942 83 737...................................... 16 148 29 696 46 082 71 488 124 374 3.8 9.2 15.1 23.2 48.6 21.1 49 531 0.44819933 82 387...................................... 16 113 29 497 45 685 70 222 121 150 3.9 9.3 15.3 23.3 48.2 20.7 48 827 0.44419924 81 795...................................... 16 265 29 857 46 112 69 708 117 714 4.1 9.7 15.9 24.1 46.2 18.4 47 162 0.4231991 81 675....................................... 16 630 30 199 46 439 70 060 118 370 4.1 9.9 16.0 24.1 45.8 17.9 47 300 0.4181990 80 968....................................... 17 205 31 178 47 064 71 055 121 346 4.2 10.0 16.0 23.9 46.0 18.3 48 528 0.4191989 80 163....................................... 17 382 32 066 48 637 72 570 123 618 4.1 9.8 16.0 23.8 46.3 18.7 50 006 0.422
1988 79 734....................................... 17 304 31 714 48 255 71 746 120 838 4.1 10.0 16.2 24.1 45.6 18.0 48 870 0.41619875 78 519...................................... 17 218 31 567 47 924 71 736 118 697 4.1 10.0 16.3 24.2 45.5 17.9 48 491 0.4151986 77 284....................................... 17 002 31 189 47 538 70 898 119 350 4.1 10.1 16.4 24.3 45.1 17.2 47 651 0.41519856 76 576...................................... 16 571 30 297 45 751 68 430 113 952 4.2 10.2 16.5 24.4 44.7 16.8 45 838 0.4111984 75 328....................................... 16 408 29 825 45 056 67 167 111 941 4.3 10.3 16.6 24.6 44.2 16.2 44 863 0.40519837 74 170...................................... 16 365 29 288 43 876 65 485 109 567 4.4 10.4 16.6 24.6 44.1 16.1 43 295 0.4041982 73 182....................................... 16 027 29 028 43 505 64 770 107 079 4.4 10.4 16.8 24.6 43.9 15.9 43 156 0.4031981 72 845....................................... 16 287 29 092 44 142 64 404 104 928 4.5 10.5 17.0 24.8 43.2 15.3 42 952 0.3971980 71 872....................................... 16 439 29 738 44 574 64 487 104 494 4.5 10.6 17.1 24.7 43.1 15.5 43 400 0.39419798 70 766...................................... 16 871 30 723 45 816 65 971 107 763 4.4 10.6 17.0 24.6 43.4 16.2 44 770 0.396
1978 68 028....................................... 16 846 30 427 45 857 65 321 106 010 4.5 10.6 17.1 24.6 43.2 16.1 44 401 0.3941977 66 934....................................... 16 248 29 918 44 289 64 091 103 165 4.5 10.6 17.2 24.7 43.0 15.8 43 146 0.39419769 65 353...................................... 16 333 29 538 43 906 62 599 99 611 4.6 10.7 17.3 24.7 42.8 15.9 42 523 0.391197510 64 392..................................... 15 790 29 004 42 925 61 137 97 350 4.6 10.8 17.2 24.7 42.7 15.7 41 440 0.390197410 11 62 984................................... 16 545 30 336 43 875 62 813 100 338 4.6 11.0 17.2 24.6 42.6 15.7 42 647 0.3871973 61 965....................................... 16 524 30 759 44 884 63 515 100 735 4.4 10.8 17.3 24.5 43.1 16.4 43 606 0.389197212 60 618..................................... 16 197 30 155 44 054 62 410 99 856 4.3 10.8 17.2 24.3 43.4 16.8 43 044 0.393197113 59 463..................................... 15 566 29 106 41 646 58 922 93 806 4.3 11.0 17.4 24.4 43.0 16.5 40 689 0.3891970 57 575....................................... 15 779 29 600 41 863 59 201 93 561 4.2 11.1 17.5 24.3 42.9 16.5 40 853 0.3871969 56 248....................................... 15 981 29 977 42 169 58 928 92 401 4.3 11.3 17.6 24.3 42.5 16.4 40 949 0.3831968 55 394....................................... 15 565 28 860 40 629 56 207 87 337 4.4 11.4 17.6 24.3 42.3 16.5 39 237 0.381196714 54 188..................................... 14 477 27 391 38 702 53 974 87 113 4.1 11.2 17.4 24.0 43.3 17.3 37 185 0.391
BLACK
1998 12 579....................................... 9 160 19 125 32 016 53 208 94 390 3.1 8.2 14.8 24.4 49.5 19.1 34 139 0.4661997 12 474....................................... 9 404 19 296 31 788 51 913 88 558 3.2 8.5 15.1 24.5 48.7 19.1 33 476 0.4581996 12 109....................................... 9 132 18 409 31 166 51 427 88 305 3.1 8.0 14.5 23.7 50.7 21.7 33 722 0.47919951 11 577...................................... 8 984 18 075 30 684 49 516 85 384 3.2 8.2 14.8 24.2 49.6 20.2 32 514 0.46819942 11 655...................................... 8 307 17 373 29 499 50 312 88 832 3.0 7.9 14.3 24.3 50.5 20.1 32 181 0.47719933 11 281...................................... 8 077 16 435 28 201 47 377 85 230 3.0 7.7 14.3 23.7 51.3 21.1 30 715 0.48419924 11 269...................................... 7 610 15 996 28 220 46 809 81 781 3.1 7.8 14.7 24.8 49.7 19.1 29 568 0.4701991 11 083....................................... 7 839 16 712 29 272 47 975 82 153 3.1 7.8 15.0 25.2 48.9 18.3 29 971 0.4641990 10 671....................................... 8 051 17 126 29 931 48 763 86 383 3.1 7.9 15.0 25.1 49.0 18.5 30 946 0.4641989 10 486....................................... 8 289 17 457 30 254 49 952 86 232 3.2 8.0 15.0 24.9 48.9 18.2 31 542 0.461
1988 10 561....................................... 8 186 16 534 29 205 49 698 84 945 3.3 7.7 14.6 24.7 49.7 18.7 30 970 0.46819875 10 192...................................... 8 055 16 644 28 697 48 023 83 941 3.3 7.9 14.8 24.4 49.7 19.3 30 363 0.4681986 9 922....................................... 7 870 16 770 29 056 48 298 82 870 3.2 8.0 15.0 25.1 48.8 18.2 30 090 0.46419856 9 797...................................... 8 308 16 664 28 161 46 594 78 797 3.5 8.3 15.2 25.0 48.0 17.5 29 290 0.4501984 9 480....................................... 8 170 16 002 26 893 39 534 77 531 3.6 8.4 15.0 24.7 48.3 17.4 28 185 0.45019837 9 243...................................... 7 855 15 402 26 185 44 003 74 514 3.6 8.3 15.2 25.2 47.8 16.9 27 054 0.4481982 8 916....................................... 7 964 15 780 26 571 42 788 69 538 3.6 8.6 15.3 25.5 47.0 16.9 26 849 0.4421981 8 961....................................... 8 163 15 634 26 060 43 766 72 364 3.8 8.6 15.3 25.4 46.9 16.1 26 876 0.4401980 8 847....................................... 8 356 16 225 26 738 43 830 73 665 3.7 8.7 15.4 25.3 46.9 16.6 27 668 0.439
See footnotes at end of table.
B–6 APPENDIX BU.S. Census Bureau

Table B–3. Share of Aggregate Income Received by Each Fifth and Top 5 Percent ofHouseholds by Race and Hispanic Origin of Householder: 1967 to 1998 mCon.
[Households as of March of the following year. Income in 1998 CPI~U adjusted dollars. Before 1983, constant dollar entries are based on the CPI~U~X1]
Year and race
Upper limit of each fifth(dollars) Share of aggregate income
Number(1,000) Lowest Second Third Fourth
Lowerlimit of
top 5percent
(dollars) Lowest Second Third Fourth HighestTop 5
percent
Meanincome
(dollars) Gini ratio
BLACKmCon.
19798 8 586...................................... 8 833 17 102 27 974 46 257 74 892 3.9 8.8 15.5 25.4 46.3 16.1 28 640 0.4331978 8 066....................................... 8 954 17 145 28 978 45 881 76 419 4.0 8.7 15.6 25.3 46.4 16.3 29 043 0.4311977 7 977....................................... 9 027 16 506 27 081 43 845 72 538 4.2 9.2 15.5 24.9 46.3 16.7 27 831 0.42519769 7 776...................................... 9 152 16 574 27 578 43 906 71 347 4.3 9.2 15.8 25.5 45.2 15.7 27 705 0.421197510 7 489..................................... 8 785 16 242 27 350 42 769 67 999 4.2 9.1 16.0 25.5 45.3 15.9 26 820 0.419197410 11 7 263.................................. 9 190 17 154 27 352 42 399 68 466 4.2 9.4 16.2 25.2 45.0 15.7 27 201 0.4141973 7 040....................................... 9 386 17 267 27 627 43 468 71 247 4.1 9.4 16.0 25.1 45.5 16.6 27 810 0.419197212 6 809..................................... 9 016 16 931 27 075 43 320 69 018 3.9 9.2 15.8 24.9 46.2 16.9 27 537 0.427197113 6 578..................................... 8 668 16 361 26 473 40 996 65 805 4.0 9.4 16.1 25.1 45.4 16.4 26 141 0.4191970 6 180....................................... 8 387 16 892 26 798 41 449 67 284 3.7 9.3 16.3 25.2 45.5 16.4 26 684 0.4221969 6 053....................................... 8 518 16 689 26 308 40 063 64 588 3.9 9.7 16.5 25.1 44.7 15.9 26 063 0.4111968 5 870....................................... 8 561 16 079 25 142 38 912 62 260 4.0 9.8 16.3 25.1 44.9 15.9 25 034 0.412196714 5 728..................................... 7 975 14 818 23 574 36 260 60 485 3.8 9.3 15.9 24.3 46.7 18.2 23 336 0.432
HISPANIC ORIGIN15
1998 9 060....................................... 12 000 22 500 34 944 55 000 97 998 3.6 8.9 14.8 22.9 49.7 21.9 38 280 0.4601997 8 590....................................... 11 401 21 327 33 514 52 197 94 564 3.6 8.9 14.9 23.1 49.5 21.5 36 442 0.4581996 8 225....................................... 11 428 20 570 32 205 51 487 89 344 3.8 9.0 14.7 23.1 49.5 21.5 35 327 0.45719951 7 939...................................... 10 696 19 316 30 910 49 520 85 885 3.8 8.9 14.8 23.3 49.3 20.8 33 371 0.45519942 7 735...................................... 10 694 19 908 31 929 51 102 90 464 3.7 8.7 14.8 23.3 49.6 21.0 34 736 0.45919933 7 362...................................... 11 235 20 305 31 675 49 981 86 294 3.9 9.1 15.1 23.1 48.7 20.4 34 169 0.44719924 7 153...................................... 11 153 20 680 32 301 50 794 86 147 4.0 9.4 15.7 24.1 46.9 18.1 33 485 0.4301991 6 379....................................... 11 513 21 542 33 581 52 335 89 758 4.0 9.4 15.8 24.3 46.5 17.7 34 553 0.4271990 6 220....................................... 11 953 21 825 33 966 52 380 90 055 4.0 9.5 15.9 24.3 46.3 17.9 34 885 0.4251989 5 933....................................... 12 320 23 007 35 860 56 056 93 331 3.8 9.5 15.7 24.4 46.6 18.1 36 796 0.430
1988 5 910....................................... 11 320 21 770 34 474 53 538 91 145 3.7 9.3 15.6 24.2 47.2 19.0 35 815 0.43719875 5 642...................................... 11 262 21 523 33 855 53 360 90 878 3.7 9.1 15.5 24.1 47.6 19.2 35 564 0.4411986 5 418....................................... 11 600 21 416 34 206 53 612 89 112 4.0 9.5 15.9 24.8 45.8 16.5 34 463 0.42419856 5 213...................................... 11 059 20 451 32 939 50 748 84 457 4.1 9.5 16.1 24.8 45.6 16.5 33 059 0.4181984 4 883....................................... 11 010 20 865 33 717 50 605 83 392 3.9 9.5 16.2 25.0 45.3 16.6 33 148 0.42019837 4 666...................................... 10 638 20 457 32 037 48 835 80 325 4.2 9.7 16.3 24.9 44.9 16.0 31 698 0.4131982 4 085....................................... 11 124 20 460 31 930 48 636 79 239 4.2 9.6 16.2 24.7 45.3 16.7 31 938 0.4171981 3 980....................................... 12 439 21 890 33 899 50 655 81 386 4.5 10.3 16.7 24.8 43.6 15.3 33 239 0.3981980 3 906....................................... 12 196 21 644 33 317 50 512 81 639 4.4 10.2 16.4 24.9 44.1 16.0 33 024 0.40519798 3 684...................................... 13 216 23 261 35 243 51 808 84 804 4.6 10.5 16.6 24.6 43.7 15.9 34 759 0.396
1978 3 291....................................... 13 040 23 424 34 534 50 902 79 624 4.7 10.7 16.9 24.9 42.8 15.4 33 667 0.3851977 3 304....................................... 12 896 22 258 32 644 48 874 77 350 4.9 10.8 16.9 24.7 42.8 15.4 32 407 0.38319769 3 081...................................... 11 608 21 058 31 854 47 248 71 827 4.7 10.5 16.9 25.1 42.8 15.2 31 030 0.387197510 2 948..................................... 11 877 20 566 30 935 45 260 71 120 4.8 10.7 16.9 24.9 42.9 15.8 30 523 0.388197410 11 2 897.................................. 13 310 22 459 33 313 47 738 75 690 5.2 10.9 17.2 24.7 42.0 15.1 32 402 0.3761973 2 722....................................... 13 814 23 138 34 251 49 539 74 939 5.1 11.1 17.1 24.7 42.0 15.0 32 676 0.371197212 2 655..................................... 13 462 22 780 32 762 45 673 72 322 5.3 11.2 17.2 24.0 42.3 16.2 32 394 0.373
1Full implementation of the 1990 census~based sample design and metropolitan definitions, 7,000 household sample reduction, and revised race edits.2Introduction of 1990 census~based sample design.3Data collection method changed from paper and pencil to computer~assisted interviewing. In addition, the March 1994 income supplement was revised to allow for the coding of different income
amounts on selected questionnaire items. Limits either increased or decreased in the following categories: earnings increased to $999,999; social security increased to $49,999; supplemental securityincome and public assistance increased to $24,999; veterans’ benefits increased to $99,999; child support and alimony decreased to $49,999.
4Implementation of 1990 census population controls.5Implementation of a new March CPS processing system.6Recording of amounts for earnings from longest job increased to $299,999. Full implementation of 1980 census~based sample design.7Implementation of Hispanic population weighting controls and introduction of 1980 census~based sample design.8Implementation of 1980 census population controls. Questionnaire expanded to show 27 possible values from 51 possible sources of income.9First year medians are derived using both Pareto and linear interpolation. Prior to this year all medians were derived using linear interpolation.10These estimates were derived using Pareto interpolation and may differ from published data which were derived using linear interpolation.11Implementation of a new March CPS processing system. Questionnaire expanded to ask 11 income questions.12Full implementation of 1970 census~based sample design.13Introduction of 1970 census~based sample design and population controls.14Implementation of a new March CPS processing system.15Hispanics may be of any race.
B–7 APPENDIX BU.S. Census Bureau

Table B–4. Families by Total Money Income, Race, and Hispanic Origin of Householder: 1967to 1998
[Income in 1998 CPI~U~X1 adjusted dollars. Families as of March of the following year. For meaning of symbols, see text]
Race and Hispanicorigin of house~holder and year
Percent distribution Median income Mean income
Number(1,000) Total
Under$5,000
$5,000to
$9,999
$10,000to
$14,999
$15,000to
$24,999
$25,000to
$34,999
$35,000to
$49,999
$50,000to
$74,999
$75,000to
$99,999
$100,000and
overValue
(dollars)
Standarderror
(dollars)Value
(dollars)
Standarderror
(dollars)
ALL RACES
1998 71 551.............. 100.0 2.7 3.8 5.3 12.3 12.7 16.8 21.6 11.7 13.3 46 737 241 59 589 3691997 70 884.............. 100.0 2.7 4.0 5.6 12.9 12.7 17.5 21.2 11.3 12.2 45 262 260 57 786 3451996 70 241.............. 100.0 2.7 4.6 5.8 13.1 13.2 17.5 21.4 10.6 11.2 43 945 217 55 763 3511995 69 597.............. 100.0 2.5 4.3 6.1 13.3 13.5 17.9 21.1 10.5 10.8 43 436 227 54 925 33219941 69 313............. 100.0 2.7 4.9 6.0 13.4 13.5 17.8 20.6 10.3 10.7 42 655 256 54 267 31819932 68 506............. 100.0 3.1 5.1 6.2 13.8 13.6 17.4 20.6 10.1 10.1 41 691 217 53 267 32919923 68 216............. 100.0 3.2 4.9 6.0 13.4 13.4 18.0 21.4 10.2 9.5 42 490 217 51 376 2371991 67 173.............. 100.0 2.9 4.8 5.6 12.9 14.0 18.2 21.4 10.6 9.5 43 011 214 51 745 2351990 66 322.............. 100.0 2.6 4.3 5.7 12.5 13.4 18.8 21.6 10.9 10.1 44 090 211 53 193 246
1989 66 090.............. 100.0 2.4 4.3 5.4 12.9 12.9 18.2 22.1 11.1 10.8 44 974 256 54 560 2621988 65 837.............. 100.0 2.5 4.5 5.3 13.1 13.0 18.1 22.2 11.2 10.0 44 354 231 53 196 26019874 65 204............. 100.0 2.6 4.5 5.5 12.7 13.1 18.2 22.5 11.3 9.7 44 438 205 52 923 2371986 64 491.............. 100.0 2.6 4.6 5.6 13.0 13.2 18.8 22.3 10.6 9.3 43 811 235 51 940 2281985 63 558.............. 100.0 2.7 4.8 5.8 13.8 13.8 19.1 21.5 10.4 8.1 42 015 227 49 906 2171984 62 706.............. 100.0 2.7 4.8 6.0 13.9 14.0 19.2 21.9 9.9 7.6 41 469 184 48 715 19319835 62 015............. 100.0 2.9 5.1 6.1 14.3 14.5 19.8 21.2 9.2 6.9 40 380 (NA) 47 165 (NA)1982 61 393.............. 100.0 2.7 5.0 6.3 14.5 14.6 20.1 21.2 8.9 6.7 39 954 198 46 702 1861981 61 019.............. 100.0 2.4 4.5 6.2 14.7 14.1 20.3 22.2 9.3 6.2 40 502 174 46 744 1791980 60 309.............. 100.0 2.1 4.4 6.1 14.0 14.1 21.1 22.5 9.3 6.3 41 637 178 47 482 184
19796 59 550............. 100.0 1.9 4.1 5.6 13.6 13.8 20.6 24.0 9.5 7.0 43 144 200 49 156 1961978 57 804.............. 100.0 1.9 4.1 6.0 13.5 13.8 20.9 23.8 9.5 6.5 42 597 196 48 516 1931977 57 215.............. 100.0 1.9 4.0 6.5 14.2 14.3 21.0 23.5 8.8 5.8 41 289 147 47 105 1501976 56 710.............. 100.0 1.7 4.2 6.3 14.6 14.6 22.1 22.9 8.3 5.2 41 046 148 46 293 1481975 56 245.............. 100.0 1.7 4.3 6.8 14.8 15.5 22.0 22.4 7.7 4.9 39 790 151 45 089 14519747 55 698............. 100.0 1.8 3.9 6.0 14.0 15.8 22.0 22.9 8.3 5.2 40 521 (NA) 46 202 (NA)1973 55 053.............. 100.0 1.7 4.0 6.1 13.7 15.0 22.0 23.3 8.5 5.7 41 617 (NA) 47 042 (NA)1972 54 373.............. 100.0 1.9 4.2 6.2 13.7 15.3 22.7 22.7 7.9 5.4 40 809 (NA) 46 349 (NA)1971 53 296.............. 100.0 2.0 4.8 6.1 14.9 16.2 23.8 21.0 6.9 4.3 38 897 (NA) 43 806 (NA)1970 52 227.............. 100.0 2.3 4.6 6.1 14.3 16.2 24.4 21.1 6.8 4.3 38 942 (NA) 43 832 (NA)
1969 51 586.............. 100.0 2.1 4.8 5.9 14.0 16.7 24.7 21.3 6.5 4.1 39 025 (NA) 43 758 (NA)1968 50 823.............. 100.0 2.3 4.7 6.4 14.7 18.5 24.4 20.2 5.5 3.4 37 321 (NA) 41 809 (NA)1967 50 111.............. 100.0 2.5 5.7 6.7 15.6 18.3 25.2 17.8 5.0 3.3 35 622 (NA) 39 520 (NA)
WHITE
1998 60 077.............. 100.0 2.0 2.9 4.7 11.6 12.6 17.1 22.4 12.2 14.3 49 023 283 62 384 4201997 59 515.............. 100.0 2.1 3.1 5.0 12.3 12.6 17.7 22.0 12.0 13.2 47 482 252 60 518 3961996 58 934.............. 100.0 1.9 3.6 5.0 12.5 13.2 18.0 22.4 11.2 12.1 46 496 276 58 382 3921995 58 872.............. 100.0 1.8 3.3 5.4 12.8 13.5 18.2 22.1 11.1 11.7 45 612 274 57 324 36419941 58 444............. 100.0 2.0 3.9 5.3 13.0 13.4 18.3 21.5 10.9 11.6 44 967 232 56 873 36019932 57 881............. 100.0 2.2 3.9 5.4 13.4 13.7 18.0 21.8 10.7 10.9 44 331 273 55 913 36819923 57 669............. 100.0 2.3 3.7 5.3 13.0 13.4 18.6 22.6 10.9 10.2 44 927 252 53 946 2631991 57 224.............. 100.0 2.0 3.6 5.0 12.5 14.1 18.7 22.5 11.3 10.3 45 218 251 54 183 2571990 56 803.............. 100.0 1.9 3.3 4.9 12.1 13.5 19.2 22.7 11.5 10.9 46 038 222 55 537 271
1989 56 590.............. 100.0 1.8 3.2 4.7 12.2 12.9 18.7 23.2 11.7 11.6 47 290 238 57 054 2891988 56 492.............. 100.0 1.9 3.4 4.6 12.6 12.9 18.8 23.3 11.8 10.7 46 730 287 55 544 28719874 56 086............. 100.0 1.9 3.4 4.8 12.1 13.0 18.8 23.6 12.0 10.4 46 468 221 55 284 2601986 55 676.............. 100.0 2.0 3.6 4.9 12.4 13.2 19.3 23.4 11.3 10.0 45 820 213 54 159 2501985 54 991.............. 100.0 2.1 3.7 5.1 13.2 13.8 19.6 22.5 11.1 8.9 44 161 238 52 074 2361984 54 400.............. 100.0 2.1 3.7 5.2 13.3 13.9 19.8 23.1 10.5 8.3 43 434 226 50 864 21019835 53 890............. 100.0 2.4 3.9 5.3 13.8 14.6 20.4 22.3 9.7 7.5 42 283 (NA) 49 206 (NA)1982 53 407.............. 100.0 2.3 3.8 5.5 13.9 14.8 20.6 22.3 9.6 7.3 41 949 208 48 769 2031981 53 269.............. 100.0 2.0 3.4 5.5 14.1 14.1 21.0 23.3 9.9 6.7 42 545 221 48 726 1951980 52 710.............. 100.0 1.7 3.5 5.3 13.3 14.2 21.7 23.7 9.9 6.9 43 382 186 49 393 200
19796 52 243............. 100.0 1.5 3.1 4.8 12.8 13.8 21.1 25.2 10.1 7.5 45 021 196 51 173 2111978 50 910.............. 100.0 1.6 3.1 5.3 12.9 13.8 21.3 25.0 10.0 7.0 44 355 198 50 373 2101977 50 530.............. 100.0 1.6 3.1 5.7 13.5 14.2 21.7 24.7 9.3 6.3 43 174 160 48 995 1621976 50 083.............. 100.0 1.5 3.2 5.5 13.9 14.6 22.7 24.1 8.8 5.7 42 635 140 48 090 1591975 49 873.............. 100.0 1.5 3.5 6.0 14.2 15.3 22.7 23.4 8.1 5.3 41 382 151 46 728 15719747 49 440............. 100.0 1.6 3.0 5.2 13.3 15.8 22.7 23.9 8.9 5.6 42 110 (NA) 47 901 (NA)1973 48 919.............. 100.0 1.4 3.2 5.3 12.8 14.9 22.6 24.6 9.1 6.1 43 495 (NA) 48 910 (NA)1972 48 477.............. 100.0 1.6 3.4 5.5 12.8 15.2 23.5 23.7 8.5 5.8 42 398 (NA) 48 114 (NA)1971 47 641.............. 100.0 1.7 3.9 5.4 14.1 16.1 24.6 22.1 7.3 4.7 40 360 (NA) 45 371 (NA)1970 46 535.............. 100.0 1.9 3.8 5.4 13.5 16.2 25.3 22.2 7.2 4.6 40 399 (NA) 45 368 (NA)
1969 46 022.............. 100.0 1.8 4.1 5.2 13.0 16.6 25.6 22.5 6.9 4.4 40 518 (NA) 45 313 (NA)1968 45 437.............. 100.0 1.9 4.0 5.7 13.7 18.6 25.2 21.3 5.8 3.6 38 640 (NA) 43 245 (NA)1967 44 814.............. 100.0 2.1 4.9 5.9 14.7 18.4 26.3 18.8 5.3 3.6 36 974 (NA) 40 934 (NA)
See footnotes at end of table.
B–8 APPENDIX BU.S. Census Bureau

Table B–4. Families by Total Money Income, Race, and Hispanic Origin of Householder: 1967to 1998mCon.
[Income in 1998 CPI~U~X1 adjusted dollars. Families as of March of the following year. For meaning of symbols, see text]
Race and Hispanicorigin of house~holder and year
Percent distribution Median income Mean income
Number(1,000) Total
Under$5,000
$5,000to
$9,999
$10,000to
$14,999
$15,000to
$24,999
$25,000to
$34,999
$35,000to
$49,999
$50,000to
$74,999
$75,000to
$99,999
$100,000and
overValue
(dollars)
Standarderror
(dollars)Value
(dollars)
Standarderror
(dollars)
BLACK
1998 8 452.............. 100.0 6.5 9.5 9.5 17.9 13.6 14.7 16.0 7.1 5.3 29 404 713 38 563 5861997 8 408.............. 100.0 6.8 9.9 9.4 17.9 14.0 15.5 16.1 5.8 4.4 29 048 612 37 069 5281996 8 455.............. 100.0 7.4 11.0 10.4 17.6 13.9 15.4 14.9 5.7 3.9 27 553 489 36 293 6831995 8 055.............. 100.0 7.1 10.9 10.4 17.7 14.4 15.9 14.0 6.1 3.6 27 776 661 36 377 74719941 8 093............. 100.0 7.4 11.9 10.3 16.9 14.1 14.7 14.4 5.8 4.4 27 164 532 36 104 58219932 7 993............. 100.0 9.1 13.6 11.4 17.2 13.6 13.3 12.6 5.1 4.0 24 300 494 33 881 67119923 7 982............. 100.0 9.6 13.2 11.2 17.0 13.7 14.4 13.0 4.6 3.3 24 517 518 32 507 5091991 7 716.............. 100.0 8.7 13.5 10.3 16.2 14.1 15.2 13.7 5.3 3.1 25 788 533 32 996 4871990 7 471.............. 100.0 8.1 11.9 11.7 15.9 13.2 16.5 13.8 5.5 3.5 26 717 475 34 363 523
1989 7 470.............. 100.0 7.4 12.1 9.7 18.4 13.2 15.5 13.8 6.3 3.5 26 565 585 34 723 5221988 7 409.............. 100.0 7.1 13.3 10.4 16.6 14.5 13.7 14.6 6.2 3.7 26 633 597 34 882 57319874 7 202............. 100.0 7.5 12.5 10.8 17.1 14.8 14.3 14.5 5.1 3.4 26 410 561 34 109 5181986 7 096.............. 100.0 7.6 12.4 10.9 17.8 13.2 15.6 14.3 5.0 3.3 26 181 616 33 876 5131985 6 921.............. 100.0 6.7 13.0 10.9 19.2 14.3 15.3 13.5 5.0 2.1 25 429 464 32 356 4761984 6 778.............. 100.0 7.4 13.3 12.2 18.4 14.8 14.9 12.2 4.6 2.2 24 208 500 31 028 42819835 6 681............. 100.0 7.5 14.2 12.3 18.2 14.0 15.8 12.0 4.3 1.6 23 830 (NA) 30 108 (NA)1982 6 530.............. 100.0 6.7 14.7 12.4 19.2 13.6 16.4 12.5 3.0 1.6 23 185 564 29 427 4041981 6 413.............. 100.0 6.1 13.7 12.7 19.2 14.5 15.3 13.5 3.9 1.2 24 000 552 30 205 4001980 6 317.............. 100.0 5.4 11.8 13.2 19.6 14.4 16.6 13.1 4.5 1.5 25 102 539 31 305 418
19796 6 184............. 100.0 5.2 12.0 12.2 20.5 13.7 16.0 14.3 4.3 1.7 25 494 465 31 957 4361978 5 906.............. 100.0 4.6 12.3 11.9 19.3 14.5 16.9 13.9 4.9 1.7 26 271 526 32 380 4641977 5 806.............. 100.0 4.4 12.3 12.9 21.4 15.2 15.2 13.4 3.9 1.4 24 664 333 30 851 3041976 5 804.............. 100.0 3.7 12.2 13.3 20.5 14.4 17.9 13.2 3.5 1.2 25 361 379 30 943 2961975 5 586.............. 100.0 4.0 11.7 14.0 20.0 17.1 16.4 12.7 3.2 1.0 25 462 365 30 167 28119747 5 491............. 100.0 4.2 11.8 13.3 20.5 16.1 16.7 13.5 2.8 1.1 25 144 (NA) 30 298 (NA)1973 5 440.............. 100.0 4.5 11.1 13.5 21.5 16.0 16.8 11.8 3.4 1.5 25 103 (NA) 30 414 (NA)1972 5 265.............. 100.0 4.8 11.2 13.0 20.9 16.3 15.7 14.0 2.7 1.5 25 199 (NA) 30 640 (NA)1971 5 157.............. 100.0 4.4 12.4 12.2 22.4 17.7 16.3 10.9 2.8 0.9 24 355 (NA) 29 102 (NA)1970 4 928.............. 100.0 5.5 11.4 12.0 22.0 16.9 17.1 11.5 2.8 0.9 24 782 (NA) 29 372 (NA)
1969 4 774.............. 100.0 5.0 11.3 12.2 22.8 17.9 17.5 10.1 2.4 0.7 24 818 (NA) 28 839 (NA)1968 4 646.............. 100.0 5.4 11.3 13.6 24.0 17.3 15.9 9.5 2.3 0.6 23 175 (NA) 27 636 (NA)1967 4 589.............. 100.0 6.5 13.0 14.1 23.8 17.3 14.8 7.4 2.1 0.9 21 890 (NA) 26 578 (NA)
ASIAN ANDPACIFICISLANDER
1998 2 459.............. 100.0 3.9 3.5 4.1 9.5 10.6 15.8 20.1 14.6 18.1 52 826 1 798 67 404 2 2141997 2 381.............. 100.0 2.9 2.7 5.3 8.9 9.9 17.7 21.3 13.8 17.4 52 657 1 825 66 627 2 2841996 2 247.............. 100.0 3.9 3.7 5.2 10.2 10.7 15.9 19.1 14.2 17.1 51 014 1 981 64 405 2 4341995 2 125.............. 100.0 2.7 4.5 6.3 9.5 11.5 16.5 21.5 12.7 14.8 49 580 1 150 64 591 2 81419941 1 589............. 100.0 3.3 4.8 5.7 9.2 11.4 14.8 22.2 13.1 15.5 50 728 1 759 63 076 2 46619932 1 737............. 100.0 3.5 5.4 6.3 11.1 9.4 13.8 21.9 14.8 13.7 50 147 2 595 62 108 2 74619923 1 760............. 100.0 3.2 4.5 5.2 10.6 10.8 16.4 20.9 13.9 14.5 49 092 1 707 59 655 1 7641991 1 624.............. 100.0 3.8 5.3 4.7 11.0 11.0 15.3 21.5 12.2 15.2 49 036 2 040 59 098 1 8751990 1 536.............. 100.0 3.5 3.1 4.7 10.2 10.9 14.4 21.6 15.1 16.3 52 687 1 959 62 302 1 8571989 1 531.............. 100.0 2.4 3.6 5.6 10.1 10.2 15.0 22.8 13.1 17.2 53 042 1 842 64 555 2 0761988 1 481.............. 100.0 1.9 4.7 5.8 12.2 10.6 14.4 19.9 13.7 16.9 50 374 1 639 60 898 1 979
HISPANICORIGIN8
1998 7 273.............. 100.0 4.8 7.1 10.4 18.9 17.1 16.1 15.0 5.7 5.0 29 608 568 39 727 9241997 6 961.............. 100.0 5.0 8.4 10.8 19.9 15.6 17.1 12.9 5.6 4.7 28 580 638 38 368 8331996 6 631.............. 100.0 4.7 9.2 11.3 21.3 15.1 16.0 13.0 5.3 4.1 27 197 515 36 976 9101995 6 287.............. 100.0 5.0 9.6 11.7 22.0 15.6 14.8 13.5 4.4 3.5 26 279 594 34 925 80919941 6 202............. 100.0 5.4 10.2 12.1 19.0 15.3 16.3 12.5 5.2 4.0 26 747 519 35 580 71519932 5 946............. 100.0 4.9 10.0 12.1 20.2 16.3 15.6 12.7 5.1 3.1 26 682 567 35 092 82019923 5 733............. 100.0 5.1 9.9 10.6 21.1 16.2 15.3 13.6 4.8 3.4 27 366 647 34 826 6041991 5 177.............. 100.0 5.1 9.4 11.3 18.0 16.6 16.4 14.0 5.2 3.9 28 597 602 35 901 6321990 4 981.............. 100.0 4.7 8.7 11.2 18.9 15.3 17.8 14.0 5.6 3.7 29 222 706 36 555 656
1989 4 840.............. 100.0 4.4 8.5 9.2 18.7 15.6 16.8 17.0 5.5 4.3 30 820 824 38 380 7021988 4 823.............. 100.0 5.4 8.4 9.5 19.1 15.0 17.3 16.0 5.5 3.9 29 994 770 37 651 86019874 4 576............. 100.0 4.7 9.4 10.4 18.8 15.9 15.8 15.8 5.4 3.8 29 128 614 37 091 7461986 4 403.............. 100.0 4.4 8.8 10.9 19.4 14.5 17.6 14.7 6.3 3.4 29 737 741 36 346 6421985 4 206.............. 100.0 4.1 9.4 11.4 19.2 15.7 17.4 14.5 5.6 2.7 28 823 742 35 072 6151984 3 939.............. 100.0 5.0 9.3 9.8 19.0 15.4 18.2 15.3 4.9 3.0 29 544 1 117 35 405 73719835 3 788............. 100.0 5.2 9.4 11.0 19.4 16.8 17.9 13.5 4.5 2.3 27 707 (NA) 33 422 (NA)1982 3 369.............. 100.0 4.4 9.3 12.2 19.1 17.6 16.9 14.0 4.3 2.2 27 667 706 33 652 7211981 3 305.............. 100.0 3.5 8.7 9.9 19.8 17.6 18.5 14.9 4.9 2.2 29 671 763 35 042 7001980 3 235.............. 100.0 3.7 8.3 10.5 20.0 17.3 18.5 15.1 4.3 2.4 29 146 778 34 888 731
19796 3 029............. 100.0 3.0 8.0 8.9 19.8 16.1 20.5 15.7 5.1 3.0 31 210 908 36 946 7861978 2 741.............. 100.0 2.6 7.8 10.2 19.4 17.7 19.9 16.0 4.3 2.2 30 345 768 35 394 7511977 2 764.............. 100.0 2.7 7.1 11.3 20.0 19.0 19.6 14.2 4.2 2.0 29 456 647 34 284 5441976 2 583.............. 100.0 2.9 8.6 10.8 21.9 17.6 19.4 14.0 3.1 1.8 28 152 620 33 094 5631975 2 499.............. 100.0 3.1 9.4 10.8 21.8 18.0 20.5 12.1 2.9 1.4 27 701 664 32 182 59719747 2 475............. 100.0 2.4 7.0 10.8 20.5 19.1 21.4 13.7 3.6 1.7 29 962 (NA) 34 086 (NA)1973 2 365.............. 100.0 2.5 6.2 9.1 21.9 19.5 20.1 15.4 3.9 1.5 30 096 (NA) 34 271 (NA)1972 2 312.............. 100.0 2.6 6.2 10.7 20.6 20.8 22.0 12.5 3.1 1.6 30 041 (NA) 33 767 (NA)
See footnotes at end of table.
APPENDIX B B–9U.S. Census Bureau

Table B–4. Families by Total Money Income, Race, and Hispanic Origin of Householder: 1967to 1998mCon.
[Income in 1998 CPI~U~X1 adjusted dollars. Families as of March of the following year. For meaning of symbols, see text]
Race and Hispanicorigin of house~holder and year
Percent distribution Median income Mean income
Number(1,000) Total
Under$5,000
$5,000to
$9,999
$10,000to
$14,999
$15,000to
$24,999
$25,000to
$34,999
$35,000to
$49,999
$50,000to
$74,999
$75,000to
$99,999
$100,000and
overValue
(dollars)
Standarderror
(dollars)Value
(dollars)
Standarderror
(dollars)
NON~HISPANICWHITE
1998 53 107.............. 100.0 1.7 2.4 4.0 10.7 12.0 17.2 23.4 13.1 15.5 51 607 260 65 338 4561997 52 875.............. 100.0 1.8 2.5 4.3 11.3 12.2 17.8 23.2 12.8 14.3 50 409 314 63 281 4271996 52 625.............. 100.0 1.6 3.0 4.3 11.4 12.9 18.2 23.6 11.9 13.1 48 851 262 60 899 4221995 52 861.............. 100.0 1.5 2.6 4.7 11.7 13.3 18.6 23.1 11.9 12.6 48 149 271 59 864 39019941 53 029............. 100.0 1.7 3.3 4.7 12.4 13.2 18.6 22.4 11.5 12.3 46 798 266 59 011 38619932 52 470............. 100.0 1.9 3.3 4.7 12.6 13.4 18.3 22.7 11.2 11.8 46 373 243 58 056 39419923 52 302............. 100.0 2.0 3.1 4.7 12.1 13.1 18.9 23.5 11.6 10.9 46 860 242 55 881 2801991 52 288.............. 100.0 1.7 3.1 4.4 12.0 13.8 19.0 23.3 11.9 10.9 46 961 257 55 907 2731990 52 038.............. 100.0 1.6 2.8 4.3 11.5 13.3 19.4 23.5 12.1 11.5 47 689 273 57 278 287
1989 51 955.............. 100.0 1.5 2.7 4.3 11.6 12.6 18.8 23.8 12.2 12.3 48 719 245 58 722 3061988 51 850.............. 100.0 1.6 2.9 4.1 12.0 12.7 19.0 24.0 12.4 11.3 48 385 247 57 144 28719874 51 702............. 100.0 1.6 2.9 4.3 11.6 12.7 19.0 24.2 12.6 11.0 48 081 275 56 818 2831986 51 426.............. 100.0 1.8 3.2 4.4 11.8 13.1 19.4 24.1 11.7 10.5 47 099 228 55 630 2741985 50 912.............. 100.0 2.0 3.3 4.6 12.7 13.7 19.8 23.1 11.5 9.4 45 532 242 53 437 2611984 50 563.............. 100.0 1.9 3.3 4.9 12.9 13.8 19.9 23.7 11.0 8.7 44 636 254 52 031 24219835 50 208............. 100.0 2.2 3.6 4.8 13.4 14.5 20.6 23.0 10.1 7.9 43 382 219 50 350 2321982 50 123.............. 100.0 2.1 3.5 5.0 13.6 14.6 20.9 22.8 10.0 7.6 42 922 220 49 753 2301981 50 066.............. 100.0 1.9 3.1 5.2 13.8 13.9 21.1 23.8 10.2 7.0 43 512 246 49 604 2211980 49 584.............. 100.0 1.5 3.2 4.9 12.9 13.9 21.9 24.3 10.2 7.2 44 238 208 50 304 226
19796 49 309............. 100.0 1.4 2.8 4.5 12.4 13.7 21.2 25.7 10.4 7.8 45 810 220 52 001 2401978 48 245.............. 100.0 1.5 2.9 5.0 12.5 13.6 21.4 25.5 10.3 7.2 45 249 239 51 194 2371977 47 828.............. 100.0 1.5 2.8 5.4 13.1 13.9 21.9 25.3 9.6 6.6 43 969 214 49 826 2351976 47 569.............. 100.0 1.4 2.9 5.3 13.5 14.4 22.8 24.6 9.1 5.9 43 423 203 48 878 2281975 47 447.............. 100.0 1.4 3.2 5.7 13.8 15.2 22.8 24.0 8.4 5.5 42 093 215 47 470 22619747 47 026............. 100.0 1.5 2.8 4.9 12.9 15.6 22.8 24.4 9.2 5.8 42 864 226 48 614 2261973 46 550.............. 100.0 1.4 3.0 5.1 12.3 14.7 22.7 25.1 9.4 6.4 43 716 211 49 632 2111972 46 213.............. 100.0 1.5 3.3 5.2 12.5 14.9 23.6 24.3 8.8 6.0 42 931 184 48 819 217
1Introduction of new 1990 census sample design.2Data collection method changed from paper and pencil to computer~assisted interviewing; earnings limits increased to $999,999; social security limits increased to $49,999; SSI and public
assistance limits increased to $24,999; veterans’ benefits limits increased to $99,999; child support and alimony limits decreased to $49,999.3Based on 1990 census adjusted population controls.4Implementation of a new March CPS processing system.5Implementation of Hispanic population weighting controls.6Implementation of 1980 census population controls.7Implementation of a new March CPS processing system.8Hispanics may be of any race. Income data for Hispanic origin households are not available prior to 1972.
B–10 APPENDIX BU.S. Census Bureau

Table B–5. Total Money Income of People by Race, Hispanic Origin, and Sex: 1967 to 1998
[Income in 1998 CPI~U~X1 adjusted dollars. People 15 years old and over beginning with March 1980, and people 14 years old and over as of March of the following year for previous years. For meaningof symbols, see text]
Race, Hispanic origin, sex,and year
With income
Percent distribution Median income Mean income
Number(1,000)
Numberwith
income(1,000) Total
$1 to$2,499or loss
$2,500to
$4,999
$5,000to
$9,999
$10,000to
$14,999
$15,000to
$24,999
$25,000to
$49,999
$50,000to
$74,999
$75,000and
overValue
(dollars)
Standarderror
(dollars)Value
(dollars)
Standarderror
(dollars)
ALL RACES
Male
1998 102 048................... 94 948 100.0 5.3 3.5 9.6 10.1 18.6 31.5 12.4 9.0 26 492 128 36 315 2571997 101 123................... 94 168 100.0 5.4 3.6 10.1 11.2 19.0 31.0 11.6 8.1 25 605 120 35 332 2541996 100 159................... 93 439 100.0 5.7 3.8 10.7 11.5 19.2 30.6 11.1 7.4 24 761 163 34 075 2571995 98 593................... 92 066 100.0 5.8 4.2 10.3 11.5 19.6 30.3 11.1 7.3 24 131 156 33 642 24819941 97 704.................. 91 254 100.0 6.2 4.0 10.9 11.5 19.4 30.1 10.6 7.3 23 889 121 33 400 23519932 96 768.................. 90 194 100.0 6.6 4.3 10.7 11.7 19.6 29.6 10.8 6.7 23 804 120 32 644 23119923 95 652.................. 90 175 100.0 6.5 4.6 11.1 11.0 19.7 30.1 10.5 6.5 23 765 124 31 148 1611991 93 760................... 88 653 100.0 6.0 4.4 10.8 11.2 19.0 31.0 11.0 6.4 24 497 126 31 558 1601990 92 840................... 88 220 100.0 5.9 4.2 10.8 10.4 19.3 31.3 11.4 6.8 25 308 127 32 477 171
1989 91 955................... 87 454 100.0 5.6 4.3 10.2 9.9 18.8 31.4 12.5 7.2 26 150 162 33 844 1851988 91 034................... 86 584 100.0 5.9 4.4 10.3 9.5 18.9 31.9 12.2 6.8 26 052 180 33 143 18219874 90 256.................. 85 713 100.0 6.3 4.5 10.0 10.5 18.1 30.9 13.1 6.7 25 520 176 32 712 1651986 89 368................... 84 471 100.0 6.6 4.5 10.0 10.5 17.7 31.6 12.4 6.7 25 452 137 32 454 1611985 88 474................... 83 631 100.0 6.8 4.8 10.5 9.7 19.4 30.9 11.6 6.4 24 709 138 31 285 1511984 87 034................... 82 183 100.0 7.1 4.9 11.1 9.7 18.4 31.5 11.3 6.0 24 474 141 30 495 13519835 86 014.................. 80 795 100.0 7.7 5.1 11.0 9.9 19.0 31.3 10.5 5.5 23 993 (NA) 29 756 (NA)1982 84 955................... 79 722 100.0 7.5 4.7 10.9 10.1 19.1 31.5 10.7 5.5 23 785 155 29 635 1331981 83 958................... 79 688 100.0 7.0 4.8 11.0 10.1 18.2 32.8 11.2 5.0 24 374 165 29 877 1321980 82 949................... 78 661 100.0 6.8 4.4 10.9 9.5 18.8 33.4 11.0 5.2 24 816 154 30 382 135
19796 81 947.................. 78 129 100.0 6.3 4.7 10.4 9.4 17.9 33.6 12.1 5.6 25 946 132 31 523 1431978 80 969................... 75 609 100.0 6.9 4.4 10.6 9.3 17.2 33.7 12.3 5.5 26 406 152 31 665 1471977 79 863................... 74 015 100.0 7.0 4.5 10.5 9.6 17.0 34.2 11.9 5.4 26 108 121 31 112 1341976 78 782................... 72 775 100.0 7.1 4.6 10.5 9.5 17.9 34.3 11.3 4.9 25 866 145 30 638 1321975 77 560................... 71 234 100.0 6.9 4.4 10.8 9.7 17.6 35.2 10.8 4.6 25 677 133 30 248 13319747 76 363.................. 70 863 100.0 7.0 4.6 10.2 8.7 16.9 35.9 11.4 5.3 26 545 (NA) 30 970 (NA)1973 75 040................... 69 387 100.0 7.1 4.7 9.6 8.6 16.4 35.3 12.4 5.9 27 821 (NA) 32 079 (NA)1972 73 572................... 67 474 100.0 6.9 4.9 9.6 8.8 16.2 36.9 11.3 5.3 27 350 (NA) 31 701 (NA)1971 72 469................... 66 486 100.0 7.6 5.0 10.2 8.5 17.5 37.1 9.6 4.5 26 106 (NA) 29 847 (NA)1970 70 592................... 65 008 100.0 7.6 5.4 10.0 8.5 16.9 37.6 9.7 4.4 26 325 (NA) 29 747 (NA)
1969 69 027................... 63 882 100.0 7.5 5.6 10.0 8.4 16.7 37.9 9.5 4.3 26 597 (NA) 29 795 (NA)1968 67 611................... 62 501 100.0 7.4 5.9 9.9 8.2 17.7 38.7 8.5 3.7 25 855 (NA) 28 648 (NA)1967 66 519................... 61 444 100.0 7.8 6.3 10.4 8.6 18.7 37.6 7.1 3.5 24 935 (NA) 27 185 (NA)
Female
1998 109 628................... 98 694 100.0 11.3 7.1 18.7 14.3 19.3 21.9 5.2 2.2 14 430 102 20 462 1391997 108 168................... 97 447 100.0 11.0 7.8 19.4 14.5 20.1 20.7 4.5 2.1 13 916 105 19 814 1221996 107 076................... 96 558 100.0 11.4 8.3 20.2 14.4 19.9 20.0 4.1 1.8 13 313 110 19 083 1301995 106 031................... 96 007 100.0 12.3 8.4 20.3 14.4 19.5 19.6 4.0 1.6 12 974 80 18 466 11819941 105 028.................. 95 147 100.0 13.0 8.7 20.6 14.4 18.8 19.3 3.7 1.5 12 611 78 18 124 11919932 104 032.................. 94 417 100.0 13.3 9.3 20.3 14.5 18.9 18.8 3.7 1.2 12 460 80 17 779 11819923 102 954.................. 93 517 100.0 13.5 9.4 20.1 14.1 18.8 19.4 3.3 1.2 12 447 81 17 336 911991 101 483................... 92 569 100.0 13.4 9.2 20.5 14.3 19.0 19.2 3.3 1.2 12 537 84 17 292 891990 100 680................... 92 245 100.0 13.8 9.8 19.5 14.1 19.1 19.1 3.5 1.2 12 559 89 17 351 91
1989 99 838................... 91 399 100.0 13.8 9.6 19.5 13.6 19.5 19.3 3.6 1.1 12 651 91 17 386 911988 99 019................... 90 593 100.0 14.6 9.7 20.1 13.0 19.4 19.1 3.1 1.0 12 241 105 16 963 9519874 98 225.................. 89 661 100.0 15.0 9.9 19.6 14.2 18.9 18.5 3.0 1.0 11 902 96 16 555 861986 97 320................... 87 822 100.0 16.1 10.0 20.2 13.7 18.3 18.2 2.6 0.9 11 318 82 15 974 821985 96 354................... 86 531 100.0 16.6 10.6 20.3 13.1 19.2 17.2 2.3 0.8 10 933 82 15 411 791984 95 282................... 85 555 100.0 17.2 10.1 20.7 13.5 18.9 16.8 2.0 0.7 10 775 71 15 036 7419835 94 269.................. 83 781 100.0 17.8 10.8 20.8 13.3 19.2 15.7 1.9 0.6 10 482 (NA) 14 564 (NA)1982 93 145................... 82 505 100.0 18.4 10.3 21.4 13.9 18.9 15.0 1.6 0.5 10 037 65 13 973 701981 92 228................... 82 139 100.0 18.5 10.8 21.9 13.8 18.9 14.3 1.5 0.3 9 874 69 13 460 651980 91 133................... 80 826 100.0 19.1 11.1 21.6 13.6 19.1 13.9 1.3 0.4 9 744 65 13 412 67
19796 89 914.................. 79 921 100.0 19.9 11.3 20.9 13.2 19.2 13.8 1.3 0.4 9 586 77 13 273 681978 88 617................... 71 864 100.0 17.2 12.2 22.1 13.9 19.1 13.9 1.3 0.4 9 823 87 13 521 701977 87 399................... 65 407 100.0 14.4 12.5 22.9 14.9 19.4 14.3 1.1 0.4 10 164 72 13 646 641976 86 153................... 63 170 100.0 15.2 12.9 23.0 14.5 19.7 13.2 1.1 0.3 9 813 77 13 378 661975 84 982................... 60 807 100.0 15.2 13.0 22.8 15.3 19.4 13.1 1.0 0.2 9 818 61 13 089 6119747 83 599.................. 59 642 100.0 15.9 13.2 23.0 13.9 19.2 13.5 1.1 0.3 9 679 (NA) 13 068 (NA)1973 82 244................... 57 029 100.0 16.5 14.0 21.3 14.7 18.9 13.3 1.1 0.3 9 656 (NA) 13 119 (NA)1972 80 896................... 54 487 100.0 16.8 14.2 21.0 14.4 18.6 13.7 1.1 0.3 9 541 (NA) 13 132 (NA)1971 79 565................... 52 603 100.0 17.4 15.3 20.5 13.2 20.2 12.1 0.9 0.3 9 107 (NA) 12 605 (NA)1970 77 649................... 51 647 100.0 19.0 15.1 20.3 13.0 19.4 12.0 0.8 0.3 8 829 (NA) 12 385 (NA)
1969 76 277................... 50 224 100.0 19.1 15.9 19.4 13.6 20.0 10.9 0.8 0.3 8 820 (NA) 12 184 (NA)1968 74 889................... 48 544 100.0 19.3 16.0 19.9 13.6 19.4 10.8 0.7 0.2 8 729 (NA) 11 812 (NA)1967 73 584................... 46 843 100.0 21.3 16.8 19.1 13.9 18.5 9.2 0.7 0.4 8 087 (NA) 11 150 (NA)
See footnotes at end of table.
APPENDIX B B–11U.S. Census Bureau

Table B–5. Total Money Income of People by Race, Hispanic Origin, and Sex: 1967 to 1998 m
Con.[Income in 1998 CPI~U~X1 adjusted dollars. People 15 years old and over beginning with March 1980, and people 14 years old and over as of March of the following year for previous years. For meaningof symbols, see text]
Race, Hispanic origin, sex,and year
With income
Percent distribution Median income Mean income
Number(1,000)
Numberwith
income(1,000) Total
$1 to$2,499or loss
$2,500to
$4,999
$5,000to
$9,999
$10,000to
$14,999
$15,000to
$24,999
$25,000to
$49,999
$50,000to
$74,999
$75,000and
overValue
(dollars)
Standarderror
(dollars)Value
(dollars)
Standarderror
(dollars)
WHITE
Male
1998 85 750................... 80 896 100.0 4.9 3.2 8.7 9.9 18.2 32.2 13.0 9.8 27 646 206 37 920 2911997 85 219................... 80 400 100.0 5.2 3.4 9.2 11.0 18.7 31.5 12.2 8.8 26 522 131 36 845 2841996 84 540................... 80 041 100.0 5.3 3.5 9.9 11.2 19.2 31.2 11.7 8.0 25 919 162 35 375 2831995 83 463................... 79 022 100.0 5.3 3.8 9.6 11.2 19.4 31.1 11.8 7.9 25 557 189 34 939 27119941 82 566.................. 78 220 100.0 5.9 3.7 9.9 11.2 19.4 30.9 11.1 8.0 24 933 191 34 847 26519932 82 026.................. 77 650 100.0 6.1 4.0 9.9 11.4 19.4 30.4 11.5 7.3 24 795 130 34 034 25719923 81 179.................. 77 467 100.0 6.1 4.1 10.3 10.6 19.6 31.1 11.3 7.0 24 869 135 32 497 1791991 80 049................... 76 578 100.0 5.4 3.9 10.0 10.9 18.9 32.1 11.7 7.0 25 605 134 32 910 1771990 79 555................... 76 480 100.0 5.4 3.8 9.8 10.1 19.2 32.3 12.1 7.3 26 402 135 33 850 190
1989 78 908................... 75 858 100.0 5.2 3.9 9.2 9.7 18.6 32.3 13.3 7.9 27 425 146 35 359 2051988 78 230................... 75 247 100.0 5.4 4.0 9.4 9.2 18.7 32.8 13.1 7.3 27 501 179 34 493 20019874 77 743.................. 74 647 100.0 5.8 4.1 9.0 10.2 18.0 31.7 14.0 7.2 27 126 185 34 111 1811986 77 212................... 73 827 100.0 6.3 4.0 9.3 10.0 17.5 32.4 13.2 7.3 26 859 190 33 828 1771985 76 617................... 73 222 100.0 6.5 4.3 9.8 9.3 19.1 31.6 12.5 6.9 25 921 150 32 605 1671984 75 487................... 72 162 100.0 6.6 4.5 10.2 9.5 18.0 32.7 12.0 6.5 25 834 151 31 783 14719835 74 805.................. 71 231 100.0 7.2 4.7 10.2 9.7 18.8 32.3 11.1 6.0 25 242 (NA) 30 932 (NA)1982 74 043................... 70 477 100.0 7.2 4.3 10.1 9.8 18.7 32.5 11.4 6.0 25 146 165 30 811 1451981 73 285................... 70 351 100.0 6.7 4.4 10.2 9.6 17.9 33.7 12.0 5.5 25 863 175 31 107 1451980 72 449................... 69 420 100.0 6.4 3.9 10.1 9.2 18.6 34.5 11.8 5.6 26 397 182 31 624 147
19796 71 887.................. 69 247 100.0 6.0 4.3 9.7 9.1 17.5 34.4 12.9 6.2 27 104 141 32 763 1561978 71 308................... 67 273 100.0 6.7 4.1 9.9 8.9 16.9 34.5 13.0 5.9 27 657 174 32 863 1621977 70 407................... 65 974 100.0 6.6 4.2 10.0 9.0 16.6 35.1 12.7 5.8 27 346 142 32 334 1471976 69 555................... 64 946 100.0 6.7 4.3 9.8 9.2 17.3 35.3 12.2 5.3 27 268 156 31 843 1431975 68 573................... 63 629 100.0 6.7 4.1 10.0 9.3 17.2 36.0 11.7 5.0 26 973 157 31 417 14519747 67 667.................. 63 388 100.0 6.7 4.4 9.4 8.5 16.4 36.8 12.1 5.7 27 807 (NA) 32 107 (NA)1973 66 550................... 62 082 100.0 6.8 4.4 9.1 8.3 15.8 36.0 13.2 6.4 29 192 (NA) 33 332 (NA)1972 65 385................... 60 565 100.0 6.5 4.5 9.1 8.4 15.8 37.7 12.2 5.8 28 687 (NA) 32 967 (NA)1971 64 611................... 59 729 100.0 7.3 4.6 9.7 8.1 16.8 38.3 10.4 5.0 27 370 (NA) 31 023 (NA)1970 63 002................... 58 447 100.0 7.2 4.9 9.6 8.0 16.2 38.9 10.4 4.8 27 671 (NA) 30 942 (NA)
1969 61 645................... 57 343 100.0 7.2 5.1 9.6 7.9 15.9 39.2 10.3 4.7 27 987 (NA) 31 061 (NA)1968 60 498................... 56 219 100.0 7.0 5.5 9.5 7.7 16.9 40.2 9.2 4.0 27 096 (NA) 29 811 (NA)1967 59 524................... 55 270 100.0 7.3 5.9 10.0 7.9 17.9 39.5 7.7 3.8 26 251 (NA) 28 321 (NA)
Female
1998 90 463................... 82 063 100.0 11.6 6.9 18.1 14.3 19.1 22.3 5.3 2.4 14 617 113 20 831 1601997 89 489................... 81 352 100.0 11.3 7.6 19.0 14.6 19.8 20.8 4.7 2.2 14 007 114 20 098 1421996 88 756................... 80 741 100.0 11.6 8.0 19.7 14.6 19.7 20.2 4.3 1.9 13 465 118 19 244 1311995 88 134................... 80 608 100.0 12.6 8.1 19.7 14.4 19.6 19.8 4.1 1.7 13 173 88 18 802 13319941 87 484.................. 80 045 100.0 13.3 8.4 20.0 14.4 18.8 19.6 3.8 1.6 12 791 85 18 399 13419932 86 765.................. 79 484 100.0 13.4 8.8 19.8 14.6 19.0 19.2 3.8 1.3 12 708 87 18 065 13019923 86 098.................. 78 885 100.0 13.6 9.0 19.5 14.3 19.1 19.8 3.4 1.3 12 737 88 17 652 1001991 85 510................... 78 721 100.0 13.7 8.8 19.8 14.4 19.1 19.6 3.5 1.3 12 831 90 17 559 971990 85 012................... 78 566 100.0 14.1 9.3 18.7 14.1 19.4 19.5 3.6 1.3 12 867 96 17 632 100
1989 84 508................... 77 933 100.0 14.1 9.3 18.7 13.8 19.6 19.7 3.6 1.2 12 898 97 17 587 991988 84 035................... 77 493 100.0 15.0 9.3 19.4 12.9 19.7 19.4 3.2 1.1 12 543 113 17 238 10519874 83 552.................. 76 940 100.0 15.3 9.4 18.9 14.3 19.0 18.9 3.1 1.1 12 206 102 16 842 961986 83 003................... 75 587 100.0 16.5 9.6 19.5 13.7 18.5 18.6 2.7 0.9 11 541 89 16 162 891985 82 345................... 74 640 100.0 17.1 10.1 19.6 13.2 19.3 17.4 2.4 0.9 11 145 89 15 629 861984 81 603................... 73 977 100.0 17.8 9.8 20.0 13.4 19.1 16.9 2.1 0.8 10 902 75 15 189 8219835 80 901.................. 72 643 100.0 18.3 10.3 20.1 13.3 19.4 15.9 2.0 0.7 10 665 (NA) 14 753 (NA)1982 80 066................... 71 624 100.0 19.0 9.8 20.7 14.0 19.0 15.2 1.7 0.6 10 174 72 14 143 771981 79 591................... 71 566 100.0 19.1 10.4 21.2 13.7 19.1 14.5 1.5 0.4 9 984 76 13 603 711980 78 766................... 70 573 100.0 19.9 10.7 20.8 13.5 19.2 14.1 1.4 0.4 9 798 71 13 501 73
19796 77 882.................. 69 839 100.0 20.7 10.8 20.3 13.2 19.3 14.0 1.3 0.4 9 676 84 13 355 751978 77 091................... 62 695 100.0 18.0 11.8 21.3 13.8 19.2 14.1 1.4 0.4 9 942 92 13 598 771977 76 194................... 56 813 100.0 14.7 12.4 22.2 14.9 19.6 14.6 1.2 0.4 10 319 80 13 796 721976 75 239................... 55 026 100.0 15.7 12.7 22.3 14.4 19.8 13.5 1.2 0.4 9 895 85 13 498 711975 74 351................... 52 936 100.0 15.6 12.8 22.1 15.3 19.6 13.3 1.0 0.3 9 919 64 13 197 6719747 73 312.................. 52 038 100.0 16.2 13.0 22.4 14.0 19.3 13.7 1.1 0.3 9 789 (NA) 13 200 (NA)1973 72 248................... 49 741 100.0 16.8 13.8 20.9 14.4 19.0 13.6 1.2 0.3 9 749 (NA) 13 306 (NA)1972 71 226................... 47 519 100.0 17.2 13.8 20.7 14.1 18.7 14.0 1.1 0.3 9 604 (NA) 13 249 (NA)1971 70 293................... 45 941 100.0 17.7 14.8 20.1 13.1 20.6 12.5 0.9 0.4 9 258 (NA) 12 798 (NA)1970 68 793................... 45 288 100.0 19.2 14.8 19.9 12.7 19.7 12.4 0.9 0.3 8 943 (NA) 12 570 (NA)
1969 67 680................... 44 025 100.0 19.1 15.6 18.9 13.3 20.5 11.4 0.8 0.3 9 027 (NA) 12 448 (NA)1968 66 543................... 42 482 100.0 19.3 15.5 19.5 13.3 19.9 11.5 0.8 0.3 8 989 (NA) 12 110 (NA)1967 66 240................... 41 045 100.0 21.1 16.5 18.6 13.6 19.3 9.7 0.8 0.5 8 330 (NA) 11 432 (NA)
See footnotes at end of table.
B–12 APPENDIX BU.S. Census Bureau

Table B–5. Total Money Income of People by Race, Hispanic Origin, and Sex: 1967 to 1998 m
Con.[Income in 1998 CPI~U~X1 adjusted dollars. People 15 years old and over beginning with March 1980, and people 14 years old and over as of March of the following year for previous years. For meaningof symbols, see text]
Race, Hispanic origin, sex,and year
With income
Percent distribution Median income Mean income
Number(1,000)
Numberwith
income(1,000) Total
$1 to$2,499or loss
$2,500to
$4,999
$5,000to
$9,999
$10,000to
$14,999
$15,000to
$24,999
$25,000to
$49,999
$50,000to
$74,999
$75,000and
overValue
(dollars)
Standarderror
(dollars)Value
(dollars)
Standarderror
(dollars)
BLACK
Male
1998 11 483................... 9 776 100.0 7.1 5.9 16.4 11.5 20.7 28.2 7.3 2.8 19 321 451 23 971 4111997 11 283................... 9 671 100.0 7.4 5.4 16.6 12.9 21.4 27.3 6.7 2.3 18 378 463 23 135 3551996 11 113................... 9 410 100.0 8.3 6.4 17.5 13.2 20.0 26.7 5.6 2.3 17 132 343 23 384 6531995 10 922................... 9 339 100.0 8.9 7.1 16.3 12.9 22.4 24.4 5.6 2.3 17 119 305 22 805 60819941 10 825.................. 9 199 100.0 8.4 6.3 18.3 13.9 20.3 24.4 6.1 2.3 16 478 344 22 232 41419932 10 639.................. 8 947 100.0 10.6 6.5 16.9 14.1 21.0 23.8 5.3 1.8 16 475 506 21 534 48319923 10 453.................. 9 104 100.0 9.9 8.7 18.0 12.9 20.6 23.7 4.6 1.7 15 178 451 20 308 3471991 10 252................... 8 943 100.0 9.9 8.0 17.4 13.7 20.4 23.6 5.4 1.6 15 513 401 20 418 3231990 10 074................... 8 820 100.0 9.4 6.7 19.1 12.9 20.8 23.6 6.0 1.5 16 048 471 21 183 347
1989 9 948................... 8 806 100.0 8.1 7.4 18.1 12.1 22.2 24.8 5.9 1.4 16 575 401 21 225 3461988 9 809................... 8 610 100.0 9.2 7.5 17.6 12.1 20.9 25.1 5.4 2.1 16 595 375 21 806 40519874 9 668.................. 8 488 100.0 9.2 7.3 17.9 13.5 20.6 24.7 5.4 1.4 16 092 298 20 910 3471986 9 472................... 8 285 100.0 8.9 8.7 16.8 14.6 19.5 24.9 5.2 1.5 16 095 318 20 614 3291985 9 309................... 8 127 100.0 9.3 8.8 16.6 12.4 22.4 24.8 4.3 1.4 16 312 358 20 263 3301984 9 141................... 7 851 100.0 10.5 8.5 18.9 12.5 22.0 22.2 4.3 1.1 14 822 417 19 012 28619835 8 986.................. 7 587 100.0 11.5 9.1 17.7 12.7 21.3 22.9 4.0 0.9 14 762 (NA) 18 909 (NA)1982 8 757................... 7 290 100.0 10.1 8.0 17.8 13.4 22.5 24.0 3.5 0.8 15 069 396 18 840 2951981 8 614................... 7 459 100.0 9.9 8.0 18.1 13.2 21.2 25.4 3.8 0.5 15 379 351 19 052 2701980 8 448................... 7 387 100.0 10.2 8.4 17.9 12.0 21.5 25.1 4.0 0.9 15 862 358 19 495 289
19796 8 292.................. 7 288 100.0 8.4 7.8 17.9 12.0 21.8 26.5 4.7 0.9 16 778 339 20 408 3021978 8 148................... 6 971 100.0 9.4 7.9 17.3 12.9 19.4 27.1 5.2 0.9 16 568 348 20 625 3141977 8 057................... 6 777 100.0 9.9 7.1 15.5 15.1 20.9 26.4 4.0 1.1 16 228 279 19 970 2481976 7 914................... 6 651 100.0 10.0 7.4 17.4 12.6 22.3 26.0 3.6 0.8 16 418 329 19 703 2521975 7 720................... 6 485 100.0 9.1 7.2 18.3 13.7 20.9 27.5 2.7 0.5 16 126 307 19 238 22319747 7 507.................. 6 409 100.0 9.3 7.2 17.2 11.3 22.1 28.0 4.4 0.5 17 230 (NA) 19 843 (NA)1973 7 415................... 6 394 100.0 9.8 7.6 14.7 11.4 22.7 28.9 4.1 0.8 17 657 (NA) 20 251 (NA)1972 7 200................... 6 043 100.0 10.2 8.3 13.8 13.2 21.0 29.5 3.2 0.6 17 376 (NA) 19 997 (NA)1971 7 041................... 6 024 100.0 10.7 8.8 15.1 12.3 24.3 26.3 2.1 0.5 16 326 (NA) 18 486 (NA)1970 6 796................... 5 844 100.0 11.0 9.3 13.8 13.1 24.2 26.1 2.0 0.6 16 414 (NA) 18 483 (NA)
1969 6 637................... 5 870 100.0 11.0 9.9 13.8 12.6 24.8 25.8 1.8 0.3 16 279 (NA) 18 042 (NA)1968 6 456................... 5 715 100.0 11.6 9.8 13.7 13.1 25.1 25.0 1.4 0.4 16 075 (NA) 17 372 (NA)1967 6 318................... 5 572 100.0 12.4 10.8 13.9 15.1 25.9 20.1 1.3 0.5 15 025 (NA) 16 596 (NA)
Female
1998 13 964................... 12 272 100.0 8.7 8.5 23.1 14.8 19.9 20.1 3.9 1.0 13 137 284 17 931 2611997 13 715................... 11 961 100.0 7.6 9.4 23.1 13.6 22.8 19.1 3.5 0.9 13 251 344 17 580 2441996 13 514................... 11 817 100.0 9.0 10.3 24.2 13.5 21.5 18.2 2.6 0.7 12 230 256 17 174 4451995 13 292................... 11 607 100.0 9.6 10.3 25.1 14.8 19.5 17.6 2.6 0.5 11 723 244 15 944 23719941 13 097.................. 11 450 100.0 10.0 10.9 24.8 14.4 19.2 16.8 2.9 1.0 11 597 240 16 441 28219932 12 872.................. 11 267 100.0 10.7 12.7 24.8 14.8 18.0 15.8 2.7 0.6 10 725 234 15 526 30119923 12 677.................. 11 076 100.0 11.5 12.5 25.9 13.5 16.9 17.0 2.5 0.2 10 325 252 14 835 2131991 12 288................... 10 727 100.0 10.1 12.3 26.6 14.4 17.9 16.2 1.8 0.7 10 551 233 15 139 2291990 12 124................... 10 687 100.0 10.8 13.5 25.4 14.2 17.5 15.9 2.3 0.4 10 386 257 15 027 231
1989 11 966................... 10 577 100.0 11.1 12.1 26.0 12.6 18.2 16.9 2.6 0.4 10 352 314 15 367 2371988 11 786................... 10 380 100.0 11.2 12.5 26.5 13.1 17.7 16.8 1.8 0.4 10 126 200 14 744 23419874 11 663.................. 10 164 100.0 10.9 13.6 26.0 14.3 17.9 15.2 1.9 0.3 9 971 197 14 285 2071986 11 447................... 9 819 100.0 12.0 13.4 26.4 14.4 16.9 14.9 1.7 0.4 9 765 187 14 185 2331985 11 263................... 9 611 100.0 11.3 14.7 26.9 12.9 17.8 15.0 1.3 0.2 9 509 206 13 635 1971984 11 092................... 9 460 100.0 12.3 12.9 26.9 14.6 17.2 14.6 1.3 0.2 9 670 216 13 526 18719835 10 911.................. 9 107 100.0 13.1 14.5 26.6 13.6 17.7 13.2 1.1 0.2 9 114 (NA) 12 945 (NA)1982 10 687................... 8 921 100.0 12.7 13.9 27.6 14.2 18.0 12.8 0.7 0.1 8 974 215 12 530 1761981 10 511................... 8 829 100.0 13.3 14.2 27.9 15.1 16.8 11.8 0.9 0.1 8 870 186 12 172 1701980 10 317................... 8 596 100.0 12.2 14.1 28.3 14.2 18.6 11.9 0.7 0.1 9 071 218 12 531 176
19796 10 108.................. 8 533 100.0 13.6 15.1 26.6 13.1 18.8 11.8 0.8 0.1 8 806 194 12 434 1811978 9 902................... 7 959 100.0 11.2 14.9 28.7 14.4 17.9 12.2 0.6 0.1 8 952 203 12 586 1841977 9 684................... 7 562 100.0 11.8 13.5 28.9 15.3 18.1 11.7 0.6 0.1 8 911 137 12 387 1551976 9 484................... 7 188 100.0 10.4 14.6 28.5 15.6 19.1 11.1 0.7 0.1 9 324 143 12 472 1481975 9 269................... 6 969 100.0 11.9 14.6 28.0 16.2 17.5 11.2 0.5 (B) 9 011 160 11 990 14219747 9 047.................. 6 779 100.0 13.3 14.6 28.2 13.7 18.7 10.9 0.5 0.1 8 838 (NA) 11 806 (NA)1973 8 839................... 6 513 100.0 13.9 16.4 23.9 17.2 17.9 10.1 0.4 0.1 8 799 (NA) 11 590 (NA)1972 8 616................... 6 274 100.0 13.3 17.4 23.5 16.7 17.4 10.9 0.6 0.1 8 972 (NA) 11 946 (NA)1971 8 428................... 6 151 100.0 15.9 18.7 24.2 14.3 17.6 8.9 0.3 (B) 8 112 (NA) 10 952 (NA)1970 8 041................... 5 844 100.0 16.8 17.6 24.2 15.4 17.0 8.5 0.4 (B) 8 142 (NA) 10 826 (NA)
1969 7 841................... 5 728 100.0 19.2 18.7 22.6 15.8 16.6 6.9 0.3 (B) 7 612 (NA) 10 128 (NA)1968 7 636................... 5 629 100.0 19.8 19.6 23.2 15.3 15.7 6.3 0.1 (B) 7 130 (NA) 9 547 (NA)1967 7 461................... 5 397 100.0 22.5 19.9 22.9 15.7 13.1 5.3 0.4 0.3 6 556 (NA) 9 304 (NA)
See footnotes at end of table.
APPENDIX B B–13U.S. Census Bureau

Table B–5. Total Money Income of People by Race, Hispanic Origin, and Sex: 1967 to 1998 m
Con.[Income in 1998 CPI~U~X1 adjusted dollars. People 15 years old and over beginning with March 1980, and people 14 years old and over as of March of the following year for previous years. For meaningof symbols, see text]
Race, Hispanic origin, sex,and year
With income
Percent distribution Median income Mean income
Number(1,000)
Numberwith
income(1,000) Total
$1 to$2,499or loss
$2,500to
$4,999
$5,000to
$9,999
$10,000to
$14,999
$15,000to
$24,999
$25,000to
$49,999
$50,000to
$74,999
$75,000and
overValue
(dollars)
Standarderror
(dollars)Value
(dollars)
Standarderror
(dollars)
ASIAN AND PACIFICISLANDER
Male
1998 3 962................... 3 500 100.0 7.6 4.0 9.7 9.0 19.5 27.3 12.5 10.4 25 124 899 36 386 1 4781997 3 765................... 3 330 100.0 6.5 3.4 10.8 10.5 18.7 29.4 11.5 9.2 25 436 904 36 177 1 6081996 3 703................... 3 277 100.0 6.5 4.5 10.6 12.6 16.9 28.0 11.8 9.1 24 283 1 096 34 842 1 4101995 3 496................... 3 095 100.0 9.1 4.7 9.6 11.5 17.7 29.5 10.1 7.9 23 704 793 35 500 2 00319941 2 520.................. 2 218 100.0 7.7 4.2 10.8 11.2 15.5 30.3 12.6 7.7 25 176 1 122 35 901 1 79619932 2 689.................. 2 330 100.0 7.8 4.3 10.3 10.9 18.7 28.5 11.0 8.5 24 412 716 34 469 1 82919923 2 821.................. 2 558 100.0 7.3 5.2 11.1 13.5 17.3 27.0 10.3 8.3 23 108 1 028 32 272 1 1281991 2 621................... 2 358 100.0 8.1 5.2 11.4 10.4 19.2 26.4 12.0 7.2 23 490 992 32 021 1 1631990 2 484................... 2 235 100.0 7.6 4.1 9.8 11.9 19.4 28.7 10.6 7.9 24 187 994 32 196 1 139
1989 2 366................... 2 112 100.0 5.7 5.3 11.3 9.4 14.8 30.9 14.4 8.2 27 092 797 35 442 1 3081988 2 334................... 2 123 100.0 7.4 4.9 10.9 9.9 16.4 29.4 11.1 9.9 25 382 1 520 33 445 1 201
Female
1998 4 336................... 3 591 100.0 15.1 6.1 16.0 12.4 19.1 20.5 7.8 3.0 15 228 719 21 303 6181997 4 119................... 3 415 100.0 14.7 7.4 15.3 13.8 16.4 23.2 5.7 3.5 14 535 693 21 600 7081996 3 876................... 3 226 100.0 14.0 8.0 16.5 11.5 18.8 23.3 5.1 2.8 15 203 710 22 727 1 4991995 3 726................... 3 025 100.0 14.6 9.4 15.4 13.1 17.9 22.4 4.8 2.4 13 757 814 20 232 80619941 2 715.................. 2 258 100.0 15.7 7.3 17.9 12.1 17.4 22.8 4.4 2.2 13 597 747 19 535 71219932 3 005.................. 2 509 100.0 18.4 6.6 15.6 11.6 18.9 21.0 5.8 2.1 13 948 818 20 505 1 20619923 3 079.................. 2 605 100.0 18.8 8.2 14.4 11.5 18.5 20.5 5.5 2.6 13 792 578 19 873 7251991 2 850................... 2 393 100.0 18.0 8.8 15.4 13.3 19.8 18.0 4.2 2.4 13 196 572 19 133 8271990 2 764................... 2 333 100.0 16.3 7.3 16.3 14.1 18.0 21.2 4.7 2.1 13 826 591 19 535 721
1989 2 599................... 2 235 100.0 14.9 8.4 15.5 11.7 20.8 20.1 6.2 2.5 14 734 646 20 688 8061988 2 476................... 2 093 100.0 15.7 10.9 16.7 12.8 17.4 18.4 5.7 2.4 12 736 723 18 872 756
See footnotes at end of table.
B–14 APPENDIX BU.S. Census Bureau
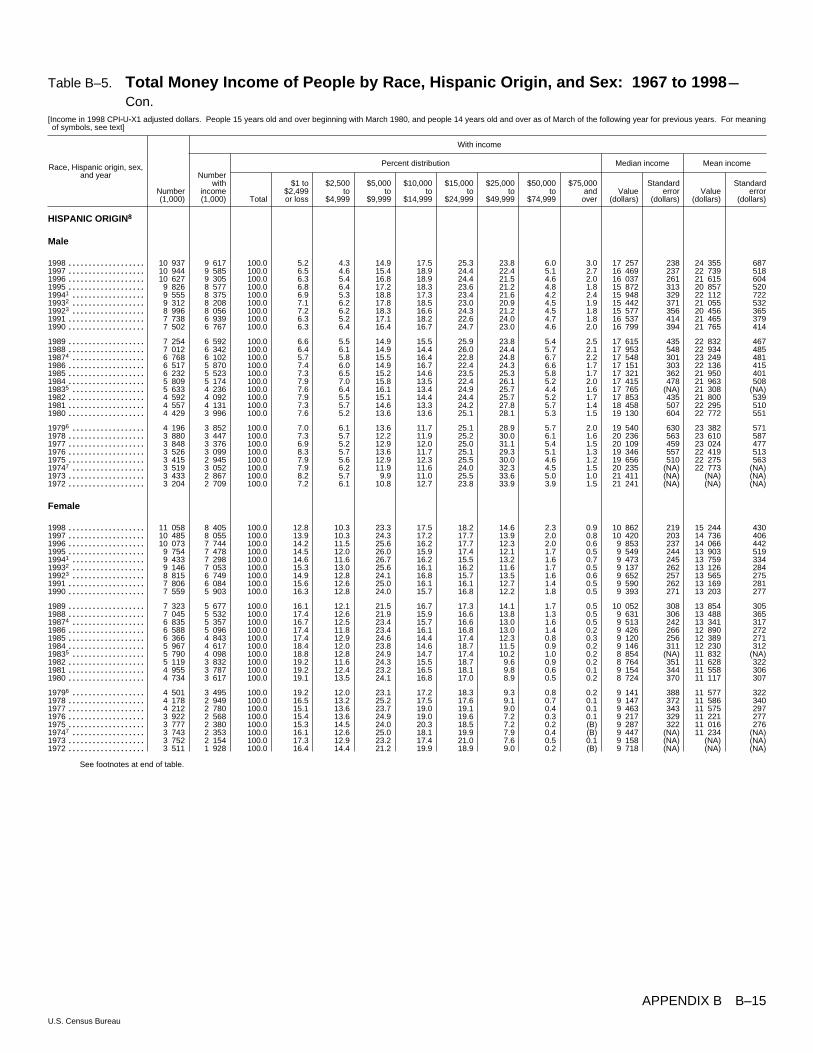
Table B–5. Total Money Income of People by Race, Hispanic Origin, and Sex: 1967 to 1998 m
Con.[Income in 1998 CPI~U~X1 adjusted dollars. People 15 years old and over beginning with March 1980, and people 14 years old and over as of March of the following year for previous years. For meaningof symbols, see text]
Race, Hispanic origin, sex,and year
With income
Percent distribution Median income Mean income
Number(1,000)
Numberwith
income(1,000) Total
$1 to$2,499or loss
$2,500to
$4,999
$5,000to
$9,999
$10,000to
$14,999
$15,000to
$24,999
$25,000to
$49,999
$50,000to
$74,999
$75,000and
overValue
(dollars)
Standarderror
(dollars)Value
(dollars)
Standarderror
(dollars)
HISPANIC ORIGIN8
Male
1998 10 937................... 9 617 100.0 5.2 4.3 14.9 17.5 25.3 23.8 6.0 3.0 17 257 238 24 355 6871997 10 944................... 9 585 100.0 6.5 4.6 15.4 18.9 24.4 22.4 5.1 2.7 16 469 237 22 739 5181996 10 627................... 9 305 100.0 6.3 5.4 16.8 18.9 24.4 21.5 4.6 2.0 16 037 261 21 615 6041995 9 826................... 8 577 100.0 6.8 6.4 17.2 18.3 23.6 21.2 4.8 1.8 15 872 313 20 857 52019941 9 555.................. 8 375 100.0 6.9 5.3 18.8 17.3 23.4 21.6 4.2 2.4 15 948 329 22 112 72219932 9 312.................. 8 208 100.0 7.1 6.2 17.8 18.5 23.0 20.9 4.5 1.9 15 442 371 21 055 53219923 8 996.................. 8 056 100.0 7.2 6.2 18.3 16.6 24.3 21.2 4.5 1.8 15 577 356 20 456 3651991 7 738................... 6 939 100.0 6.3 5.2 17.1 18.2 22.6 24.0 4.7 1.8 16 537 414 21 465 3791990 7 502................... 6 767 100.0 6.3 6.4 16.4 16.7 24.7 23.0 4.6 2.0 16 799 394 21 765 414
1989 7 254................... 6 592 100.0 6.6 5.5 14.9 15.5 25.9 23.8 5.4 2.5 17 615 435 22 832 4671988 7 012................... 6 342 100.0 6.4 6.1 14.9 14.4 26.0 24.4 5.7 2.1 17 953 548 22 934 48519874 6 768.................. 6 102 100.0 5.7 5.8 15.5 16.4 22.8 24.8 6.7 2.2 17 548 301 23 249 4811986 6 517................... 5 870 100.0 7.4 6.0 14.9 16.7 22.4 24.3 6.6 1.7 17 151 303 22 136 4151985 6 232................... 5 523 100.0 7.3 6.5 15.2 14.6 23.5 25.3 5.8 1.7 17 321 362 21 950 4011984 5 809................... 5 174 100.0 7.9 7.0 15.8 13.5 22.4 26.1 5.2 2.0 17 415 478 21 963 50819835 5 633.................. 4 236 100.0 7.6 6.4 16.1 13.4 24.9 25.7 4.4 1.6 17 765 (NA) 21 308 (NA)1982 4 592................... 4 092 100.0 7.9 5.5 15.1 14.4 24.4 25.7 5.2 1.7 17 853 435 21 800 5391981 4 557................... 4 131 100.0 7.3 5.7 14.6 13.3 24.2 27.8 5.7 1.4 18 458 507 22 295 5101980 4 429................... 3 996 100.0 7.6 5.2 13.6 13.6 25.1 28.1 5.3 1.5 19 130 604 22 772 551
19796 4 196.................. 3 852 100.0 7.0 6.1 13.6 11.7 25.1 28.9 5.7 2.0 19 540 630 23 382 5711978 3 880................... 3 447 100.0 7.3 5.7 12.2 11.9 25.2 30.0 6.1 1.6 20 236 563 23 610 5871977 3 848................... 3 376 100.0 6.9 5.2 12.9 12.0 25.0 31.1 5.4 1.5 20 109 459 23 024 4771976 3 526................... 3 099 100.0 8.3 5.7 13.6 11.7 25.1 29.3 5.1 1.3 19 346 557 22 419 5131975 3 415................... 2 945 100.0 7.9 5.6 12.9 12.3 25.5 30.0 4.6 1.2 19 656 510 22 275 56319747 3 519.................. 3 052 100.0 7.9 6.2 11.9 11.6 24.0 32.3 4.5 1.5 20 235 (NA) 22 773 (NA)1973 3 433................... 2 867 100.0 8.2 5.7 9.9 11.0 25.5 33.6 5.0 1.0 21 411 (NA) (NA) (NA)1972 3 204................... 2 709 100.0 7.2 6.1 10.8 12.7 23.8 33.9 3.9 1.5 21 241 (NA) (NA) (NA)
Female
1998 11 058................... 8 405 100.0 12.8 10.3 23.3 17.5 18.2 14.6 2.3 0.9 10 862 219 15 244 4301997 10 485................... 8 055 100.0 13.9 10.3 24.3 17.2 17.7 13.9 2.0 0.8 10 420 203 14 736 4061996 10 073................... 7 744 100.0 14.2 11.5 25.6 16.2 17.7 12.3 2.0 0.6 9 853 237 14 066 4421995 9 754................... 7 478 100.0 14.5 12.0 26.0 15.9 17.4 12.1 1.7 0.5 9 549 244 13 903 51919941 9 433.................. 7 298 100.0 14.6 11.6 26.7 16.2 15.5 13.2 1.6 0.7 9 473 245 13 759 33419932 9 146.................. 7 053 100.0 15.3 13.0 25.6 16.1 16.2 11.6 1.7 0.5 9 137 262 13 126 28419923 8 815.................. 6 749 100.0 14.9 12.8 24.1 16.8 15.7 13.5 1.6 0.6 9 652 257 13 565 2751991 7 806................... 6 084 100.0 15.6 12.6 25.0 16.1 16.1 12.7 1.4 0.5 9 590 262 13 169 2811990 7 559................... 5 903 100.0 16.3 12.8 24.0 15.7 16.8 12.2 1.8 0.5 9 393 271 13 203 277
1989 7 323................... 5 677 100.0 16.1 12.1 21.5 16.7 17.3 14.1 1.7 0.5 10 052 308 13 854 3051988 7 045................... 5 532 100.0 17.4 12.6 21.9 15.9 16.6 13.8 1.3 0.5 9 631 306 13 488 36519874 6 835.................. 5 357 100.0 16.7 12.5 23.4 15.7 16.6 13.0 1.6 0.5 9 513 242 13 341 3171986 6 588................... 5 096 100.0 17.4 11.8 23.4 16.1 16.8 13.0 1.4 0.2 9 426 266 12 890 2721985 6 366................... 4 843 100.0 17.4 12.9 24.6 14.4 17.4 12.3 0.8 0.3 9 120 256 12 389 2711984 5 967................... 4 617 100.0 18.4 12.0 23.8 14.6 18.7 11.5 0.9 0.2 9 146 311 12 230 31219835 5 790.................. 4 098 100.0 18.8 12.8 24.9 14.7 17.4 10.2 1.0 0.2 8 854 (NA) 11 832 (NA)1982 5 119................... 3 832 100.0 19.2 11.6 24.3 15.5 18.7 9.6 0.9 0.2 8 764 351 11 628 3221981 4 955................... 3 787 100.0 19.2 12.4 23.2 16.5 18.1 9.8 0.6 0.1 9 154 344 11 558 3061980 4 734................... 3 617 100.0 19.1 13.5 24.1 16.8 17.0 8.9 0.5 0.2 8 724 370 11 117 307
19796 4 501.................. 3 495 100.0 19.2 12.0 23.1 17.2 18.3 9.3 0.8 0.2 9 141 388 11 577 3221978 4 178................... 2 949 100.0 16.5 13.2 25.2 17.5 17.6 9.1 0.7 0.1 9 147 372 11 586 3401977 4 212................... 2 780 100.0 15.1 13.6 23.7 19.0 19.1 9.0 0.4 0.1 9 463 343 11 575 2971976 3 922................... 2 568 100.0 15.4 13.6 24.9 19.0 19.6 7.2 0.3 0.1 9 217 329 11 221 2771975 3 777................... 2 380 100.0 15.3 14.5 24.0 20.3 18.5 7.2 0.2 (B) 9 287 322 11 016 27619747 3 743.................. 2 353 100.0 16.1 12.6 25.0 18.1 19.9 7.9 0.4 (B) 9 447 (NA) 11 234 (NA)1973 3 752................... 2 154 100.0 17.3 12.9 23.2 17.4 21.0 7.6 0.5 0.1 9 158 (NA) (NA) (NA)1972 3 511................... 1 928 100.0 16.4 14.4 21.2 19.9 18.9 9.0 0.2 (B) 9 718 (NA) (NA) (NA)
See footnotes at end of table.
APPENDIX B B–15U.S. Census Bureau
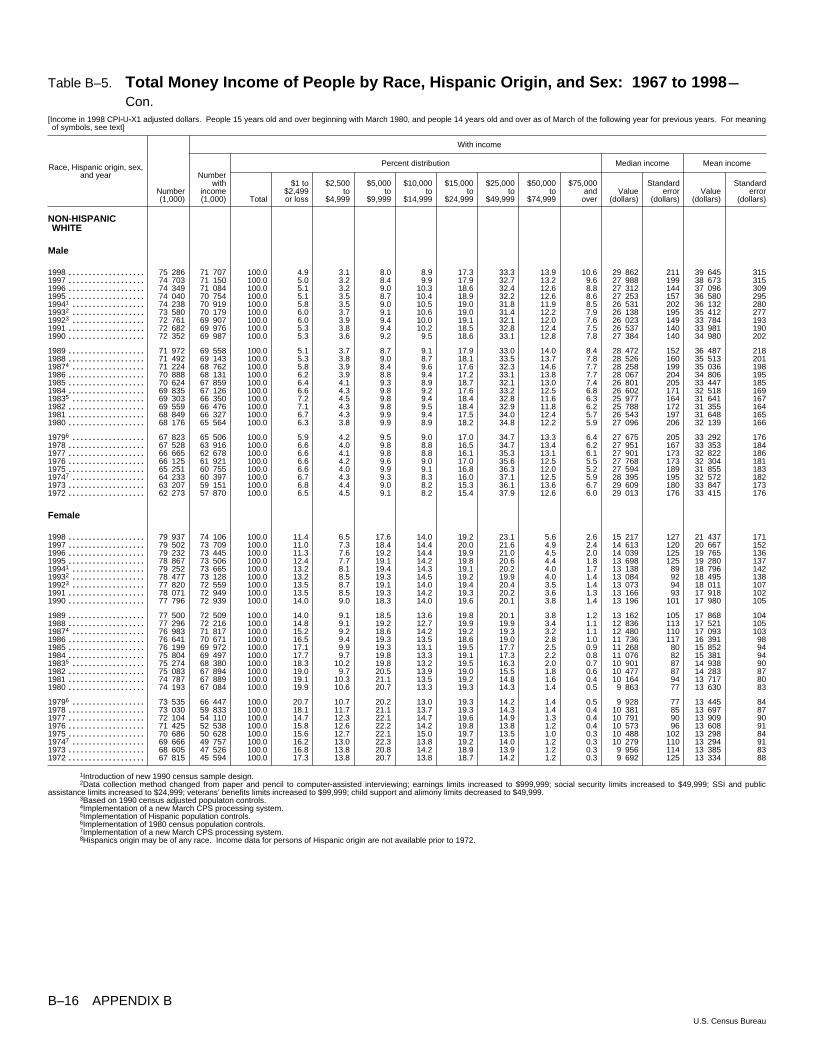
Table B–5. Total Money Income of People by Race, Hispanic Origin, and Sex: 1967 to 1998 m
Con.[Income in 1998 CPI~U~X1 adjusted dollars. People 15 years old and over beginning with March 1980, and people 14 years old and over as of March of the following year for previous years. For meaningof symbols, see text]
Race, Hispanic origin, sex,and year
With income
Percent distribution Median income Mean income
Number(1,000)
Numberwith
income(1,000) Total
$1 to$2,499or loss
$2,500to
$4,999
$5,000to
$9,999
$10,000to
$14,999
$15,000to
$24,999
$25,000to
$49,999
$50,000to
$74,999
$75,000and
overValue
(dollars)
Standarderror
(dollars)Value
(dollars)
Standarderror
(dollars)
NON~HISPANICWHITE
Male
1998 75 286................... 71 707 100.0 4.9 3.1 8.0 8.9 17.3 33.3 13.9 10.6 29 862 211 39 645 3151997 74 703................... 71 150 100.0 5.0 3.2 8.4 9.9 17.9 32.7 13.2 9.6 27 988 199 38 673 3151996 74 349................... 71 084 100.0 5.1 3.2 9.0 10.3 18.6 32.4 12.6 8.8 27 312 144 37 096 3091995 74 040................... 70 754 100.0 5.1 3.5 8.7 10.4 18.9 32.2 12.6 8.6 27 253 157 36 580 29519941 74 238.................. 70 919 100.0 5.8 3.5 9.0 10.5 19.0 31.8 11.9 8.5 26 531 202 36 132 28019932 73 580.................. 70 179 100.0 6.0 3.7 9.1 10.6 19.0 31.4 12.2 7.9 26 138 195 35 412 27719923 72 761.................. 69 907 100.0 6.0 3.9 9.4 10.0 19.1 32.1 12.0 7.6 26 023 149 33 784 1931991 72 682................... 69 976 100.0 5.3 3.8 9.4 10.2 18.5 32.8 12.4 7.5 26 537 140 33 981 1901990 72 352................... 69 987 100.0 5.3 3.6 9.2 9.5 18.6 33.1 12.8 7.8 27 384 140 34 980 202
1989 71 972................... 69 558 100.0 5.1 3.7 8.7 9.1 17.9 33.0 14.0 8.4 28 472 152 36 487 2181988 71 492................... 69 143 100.0 5.3 3.8 9.0 8.7 18.1 33.5 13.7 7.8 28 526 160 35 513 20119874 71 224.................. 68 762 100.0 5.8 3.9 8.4 9.6 17.6 32.3 14.6 7.7 28 258 199 35 036 1981986 70 888................... 68 131 100.0 6.2 3.9 8.8 9.4 17.2 33.1 13.8 7.7 28 067 204 34 806 1951985 70 624................... 67 859 100.0 6.4 4.1 9.3 8.9 18.7 32.1 13.0 7.4 26 801 205 33 447 1851984 69 835................... 67 126 100.0 6.6 4.3 9.8 9.2 17.6 33.2 12.5 6.8 26 602 171 32 518 16919835 69 303.................. 66 350 100.0 7.2 4.5 9.8 9.4 18.4 32.8 11.6 6.3 25 977 164 31 641 1671982 69 559................... 66 476 100.0 7.1 4.3 9.8 9.5 18.4 32.9 11.8 6.2 25 788 172 31 355 1641981 68 849................... 66 327 100.0 6.7 4.3 9.9 9.4 17.5 34.0 12.4 5.7 26 543 197 31 648 1651980 68 176................... 65 564 100.0 6.3 3.8 9.9 8.9 18.2 34.8 12.2 5.9 27 096 206 32 139 166
19796 67 823.................. 65 506 100.0 5.9 4.2 9.5 9.0 17.0 34.7 13.3 6.4 27 675 205 33 292 1761978 67 528................... 63 916 100.0 6.6 4.0 9.8 8.8 16.5 34.7 13.4 6.2 27 951 167 33 353 1841977 66 665................... 62 678 100.0 6.6 4.1 9.8 8.8 16.1 35.3 13.1 6.1 27 901 173 32 822 1861976 66 125................... 61 921 100.0 6.6 4.2 9.6 9.0 17.0 35.6 12.5 5.5 27 768 173 32 304 1811975 65 251................... 60 755 100.0 6.6 4.0 9.9 9.1 16.8 36.3 12.0 5.2 27 594 189 31 855 18319747 64 233.................. 60 397 100.0 6.7 4.3 9.3 8.3 16.0 37.1 12.5 5.9 28 395 195 32 572 1821973 63 207................... 59 151 100.0 6.8 4.4 9.0 8.2 15.3 36.1 13.6 6.7 29 609 180 33 847 1731972 62 273................... 57 870 100.0 6.5 4.5 9.1 8.2 15.4 37.9 12.6 6.0 29 013 176 33 415 176
Female
1998 79 937................... 74 106 100.0 11.4 6.5 17.6 14.0 19.2 23.1 5.6 2.6 15 217 127 21 437 1711997 79 502................... 73 709 100.0 11.0 7.3 18.4 14.4 20.0 21.6 4.9 2.4 14 613 120 20 667 1521996 79 232................... 73 445 100.0 11.3 7.6 19.2 14.4 19.9 21.0 4.5 2.0 14 039 125 19 765 1361995 78 867................... 73 506 100.0 12.4 7.7 19.1 14.2 19.8 20.6 4.4 1.8 13 698 125 19 280 13719941 79 252.................. 73 665 100.0 13.2 8.1 19.4 14.3 19.1 20.2 4.0 1.7 13 138 89 18 796 14219932 78 477.................. 73 128 100.0 13.2 8.5 19.3 14.5 19.2 19.9 4.0 1.4 13 084 92 18 495 13819923 77 820.................. 72 559 100.0 13.5 8.7 19.1 14.0 19.4 20.4 3.5 1.4 13 073 94 18 011 1071991 78 071................... 72 949 100.0 13.5 8.5 19.3 14.2 19.3 20.2 3.6 1.3 13 166 93 17 918 1021990 77 796................... 72 939 100.0 14.0 9.0 18.3 14.0 19.6 20.1 3.8 1.4 13 196 101 17 980 105
1989 77 500................... 72 509 100.0 14.0 9.1 18.5 13.6 19.8 20.1 3.8 1.2 13 162 105 17 868 1041988 77 296................... 72 216 100.0 14.8 9.1 19.2 12.7 19.9 19.9 3.4 1.1 12 836 113 17 521 10519874 76 983.................. 71 817 100.0 15.2 9.2 18.6 14.2 19.2 19.3 3.2 1.1 12 480 110 17 093 1031986 76 641................... 70 671 100.0 16.5 9.4 19.3 13.5 18.6 19.0 2.8 1.0 11 736 117 16 391 981985 76 199................... 69 972 100.0 17.1 9.9 19.3 13.1 19.5 17.7 2.5 0.9 11 268 80 15 852 941984 75 804................... 69 497 100.0 17.7 9.7 19.8 13.3 19.1 17.3 2.2 0.8 11 076 82 15 381 9419835 75 274.................. 68 380 100.0 18.3 10.2 19.8 13.2 19.5 16.3 2.0 0.7 10 901 87 14 938 901982 75 083................... 67 894 100.0 19.0 9.7 20.5 13.9 19.0 15.5 1.8 0.6 10 477 87 14 283 871981 74 787................... 67 889 100.0 19.1 10.3 21.1 13.5 19.2 14.8 1.6 0.4 10 164 94 13 717 801980 74 193................... 67 084 100.0 19.9 10.6 20.7 13.3 19.3 14.3 1.4 0.5 9 863 77 13 630 83
19796 73 535.................. 66 447 100.0 20.7 10.7 20.2 13.0 19.3 14.2 1.4 0.5 9 928 77 13 445 841978 73 030................... 59 833 100.0 18.1 11.7 21.1 13.7 19.3 14.3 1.4 0.4 10 381 85 13 697 871977 72 104................... 54 110 100.0 14.7 12.3 22.1 14.7 19.6 14.9 1.3 0.4 10 791 90 13 909 901976 71 425................... 52 538 100.0 15.8 12.6 22.2 14.2 19.8 13.8 1.2 0.4 10 573 96 13 608 911975 70 686................... 50 628 100.0 15.6 12.7 22.1 15.0 19.7 13.5 1.0 0.3 10 488 102 13 298 8419747 69 666.................. 49 757 100.0 16.2 13.0 22.3 13.8 19.2 14.0 1.2 0.3 10 279 110 13 294 911973 68 605................... 47 526 100.0 16.8 13.8 20.8 14.2 18.9 13.9 1.2 0.3 9 956 114 13 385 831972 67 815................... 45 594 100.0 17.3 13.8 20.7 13.8 18.7 14.2 1.2 0.3 9 692 125 13 334 88
1Introduction of new 1990 census sample design.2Data collection method changed from paper and pencil to computer~assisted interviewing; earnings limits increased to $999,999; social security limits increased to $49,999; SSI and public
assistance limits increased to $24,999; veterans’ benefits limits increased to $99,999; child support and alimony limits decreased to $49,999.3Based on 1990 census adjusted populaton controls.4Implementation of a new March CPS processing system.5Implementation of Hispanic population controls.6Implementation of 1980 census population controls.7Implementation of a new March CPS processing system.8Hispanics origin may be of any race. Income data for persons of Hispanic origin are not available prior to 1972.
B–16 APPENDIX BU.S. Census Bureau

Appendix C.The Bureau of Labor Statistics’ Statementon the Use of the CPI-U-RS
The Bureau of Labor Statistics (BLS) has made numerousimprovements to the Consumer Price Index (CPI) over thepast quarter-century. While these improvements make thepresent and future CPI more accurate, historical priceindex series are not adjusted to reflect the improvements.Many researchers, however, expressed an interest in hav-ing a historical series that was measured consistently overthe entire period. Accordingly, the Consumer Price Indexresearch series using current methods (CPI-U-RS) presentsan estimate of the CPI for all urban consumers (CPI-U)from 1978 to 1998 that incorporates most of the improve-ments made over that time span into the entire series.The CPI-U-RS is, in some ways, an extension of the CPI-
U-X1, an experimental series that shows what the inflationrate in the CPI-U might have been, if the current rental-equivalence method of measuring the cost of homeowner-ship had been in place prior to 1983.The CPI-U-RS has some limitations. First, most estimates
are based on BLS research covering a short period of timeand extrapolated to a longer period. Therefore, there is
considerable uncertainty surrounding the magnitude ofthe adjustments. Second, there have been severalimprovements in the CPI not incorporated into the CPI-U-RS, either because they do not represent changes in meth-odology, because they had negligible impacts on the CPI’sgrowth rate, or because it was impossible to systemati-cally estimate the impacts of the new methods in pastyears.
Nonetheless, the CPI-U-RS can serve as a valuable proxyfor researchers needing a historical estimate of inflationusing current (1999) methods. The direct adjustment ofindividual CPI index series makes this the most detailedand systematic estimate available of a consistent CPIseries.
Bureau of Labor StatisticsU.S. Department of LaborAugust 1999
APPENDIX C C–1
U.S. Census Bureau

Appendix D.Trends in Income Using the CPI-U-X1 Versus the CPI-U-RS
In order to accurately assess changes in economic well-being, an adjustment for cost-of-living changes isrequired. Incomes from different years need to be com-pared in dollars with the same purchasing power. In orderto adjust for cost-of-living changes, the Census Bureauuses the Consumer Price Index (CPI-U) provided by theBureau of Labor Statistics (BLS). This is an index of thecost of a market basket of goods and services represent-ing the average consumption of the urban population.
In 1983, the BLS began using a revised method to cal-culate the CPI-U. This method uses estimates of the cost ofrenting equivalent housing to measure homeownershipcosts. As a result, it is less affected than the earlier mea-sure by changes in housing prices and mortgage rates.The official CPI-U time series is based on the old method-ology prior to 1983 and on the new methodology for theyears 1983 to the present.
In order to create a consistent series over time, the BLSalso created an experimental series (the CPI-U-X1) basedon the new methodology for the 1967 to 1982 period. The
Census Bureau currently uses the CPI-U-X1 for the histori-cal series of income from 1967 to the present, and foryears prior to 1967, extrapolates the X1 based on its ratioto the CPI-U observed in 1967.
The BLS recently released a new series, the ConsumerPrice Index research series using current methods (CPI-U-RS).1 The CPI-U-RS is an index of inflation from 1978 to1998 that incorporates most of the improvements inmethodology made to the CPI-U over that time span intothe entire series. Among other improvements, the CPI-U-RSmakes quality adjustments for the aging of housing unitsand for the prices of used cars, personal computers, andtelevisions, and it employs a geometric mean formula toaccount for consumer substitution within CPI item catego-ries. Although the research series has some limitations,including being subject to annual revisions, the BLS states
1See Kenneth J. Stewart and Stephen B. Reed, ‘‘CPI ResearchSeries Using Current Methods, 1978-98,’’ Monthly Labor Review,June 1999.
Figure D-1.Median Household Income by Inflation Index: 1967 to 1998
Source: U.S. Census Bureau, Current Population Survey, March 1968-1999.
Note: For years previous to 1978, the CPI-U-RS is extrapolated based on the ratio of the CPI-U-RS to the CPI-U-X1 in 1978.
0
30
31
32
33
34
35
36
37
38
39
40
1998199019851980197519701967
Income in thousands of 1998 dollars
CPI-U-X1
CPI-U-RS
Recessionary periods
1995
APPENDIX D D–1
U.S. Census Bureau

that it is the most detailed and systematic estimate avail-able of a consistent CPI series. (See Appendix C.)
Table D-1 and Figure D-1 show the effect of using theCPI-U-RS in the historical series of median householdincome from 1967 to 1998. The CPI-U-RS shows a lowerrise in prices than the CPI-U-X1 over this period, and thuslowers the factors used to convert historical figures into1998 dollars. This creates a greater increase in ‘‘real’’income over the 1967 to 1998 period than is evident withthe CPI-U-X1. In fact, with the CPI-U-RS, the all-time highlevel of median household income reached in 1989 mayhave been reached again in 1996, 1 year earlier thanstated in the Census Bureau’s 1997 income report. Withthe CPI-U-RS, 1998 income was 27.2 percent higher than1967 levels. With the CPI-U-X1, income was only 21.2 per-cent higher. Similarly, 1998 income was 5.5 percent higherthan in 1989 with the CPI-U-RS series, while this is only2.6 percent higher with the CPI-U-X1 series.
In order to understand income trends properly, we arevery interested in receiving opinion and evidence on therelative technical merits of income series deflated by thetwo indexes, as input into a decision about whichconstant-dollar income series will appear in future reports.If you have comments, please write to:
Edward J. WelniakChief, Income Statistics BranchHousing and Household Economic Statistics DivisionU.S. Census BureauWashington, DC 20233-8500or electronically to:[email protected]
Table D–1. Median Household Income by Inflation Index: 1967 to 1998
Year
Consumer Price Index(1982-1984 = 100.0)
Median household income
Current dollars
1998 dollars
CPI-U-X1 CPI-U-RS CPI-U-X1 CPI-U-RS
1998. . . . . . . . . . . . . . . . . . . . . . . . . . . . . . . . . . . . . 163.0 156.7 38,885 38,885 38,8851997. . . . . . . . . . . . . . . . . . . . . . . . . . . . . . . . . . . . . 160.5 154.6 37,005 37,581 37,5081996. . . . . . . . . . . . . . . . . . . . . . . . . . . . . . . . . . . . . 156.9 151.3 35,492 36,872 36,7591995. . . . . . . . . . . . . . . . . . . . . . . . . . . . . . . . . . . . . 152.4 147.3 34,076 36,446 36,2511994. . . . . . . . . . . . . . . . . . . . . . . . . . . . . . . . . . . . . 148.2 143.4 32,264 35,486 35,256
1993. . . . . . . . . . . . . . . . . . . . . . . . . . . . . . . . . . . . . 144.5 140.4 31,241 35,241 34,8681992. . . . . . . . . . . . . . . . . . . . . . . . . . . . . . . . . . . . . 140.3 136.9 30,636 35,593 35,0671991. . . . . . . . . . . . . . . . . . . . . . . . . . . . . . . . . . . . . 136.2 133.4 30,126 36,054 35,3881990. . . . . . . . . . . . . . . . . . . . . . . . . . . . . . . . . . . . . 130.7 128.6 29,943 37,343 36,4861989. . . . . . . . . . . . . . . . . . . . . . . . . . . . . . . . . . . . . 124.0 122.5 28,820 37,884 36,866
1988. . . . . . . . . . . . . . . . . . . . . . . . . . . . . . . . . . . . . 118.3 117.4 27,225 37,512 36,3391987. . . . . . . . . . . . . . . . . . . . . . . . . . . . . . . . . . . . . 113.6 113.3 26,061 37,394 36,0441986. . . . . . . . . . . . . . . . . . . . . . . . . . . . . . . . . . . . . 109.6 109.5 24,897 37,027 35,6291985. . . . . . . . . . . . . . . . . . . . . . . . . . . . . . . . . . . . . 107.6 107.5 23,618 35,778 34,4271984. . . . . . . . . . . . . . . . . . . . . . . . . . . . . . . . . . . . . 103.9 104.0 22,415 35,165 33,773
1983. . . . . . . . . . . . . . . . . . . . . . . . . . . . . . . . . . . . . 99.6 100.0 21,018 34,397 32,9351982. . . . . . . . . . . . . . . . . . . . . . . . . . . . . . . . . . . . . 95.6 96.0 20,171 34,392 32,9251981. . . . . . . . . . . . . . . . . . . . . . . . . . . . . . . . . . . . . 90.1 90.6 19,074 34,507 32,9901980. . . . . . . . . . . . . . . . . . . . . . . . . . . . . . . . . . . . . 82.3 82.8 17,710 35,076 33,5161979. . . . . . . . . . . . . . . . . . . . . . . . . . . . . . . . . . . . . 74.0 74.5 16,461 36,259 34,623
1978. . . . . . . . . . . . . . . . . . . . . . . . . . . . . . . . . . . . . 67.5 68.1 15,064 36,377 34,66319771 . . . . . . . . . . . . . . . . . . . . . . . . . . . . . . . . . . . . 63.2 63.8 13,572 35,004 33,3341976. . . . . . . . . . . . . . . . . . . . . . . . . . . . . . . . . . . . . 59.4 59.9 12,686 34,812 33,1871975. . . . . . . . . . . . . . . . . . . . . . . . . . . . . . . . . . . . . 56.2 56.7 11,800 34,224 32,6111974. . . . . . . . . . . . . . . . . . . . . . . . . . . . . . . . . . . . . 51.9 52.4 11,197 35,166 33,484
1973. . . . . . . . . . . . . . . . . . . . . . . . . . . . . . . . . . . . . 47.2 47.6 10,512 36,302 34,6061972. . . . . . . . . . . . . . . . . . . . . . . . . . . . . . . . . . . . . 44.4 44.8 9,697 35,599 33,9181971. . . . . . . . . . . . . . . . . . . . . . . . . . . . . . . . . . . . . 43.1 43.5 9,028 34,143 32,5221970. . . . . . . . . . . . . . . . . . . . . . . . . . . . . . . . . . . . . 41.3 41.7 8,734 34,471 32,8211969. . . . . . . . . . . . . . . . . . . . . . . . . . . . . . . . . . . . . 39.4 39.8 8,389 34,706 33,0291968. . . . . . . . . . . . . . . . . . . . . . . . . . . . . . . . . . . . . 37.7 38.0 7,743 33,478 31,9301967. . . . . . . . . . . . . . . . . . . . . . . . . . . . . . . . . . . . . 36.3 36.6 7,143 32,075 30,582
1For years previous to 1978, the CPI-U-RS is extrapolated based on the ratio of the CPI-U-RS to the CPI-U-X1 in 1978.
Source: U.S. Census Bureau, Current Population Survey, March 1968-1999.
D–2 APPENDIX D
U.S. Census Bureau

Appendix E.Source and Accuracy of Estimates
SOURCES OF DATA
Most estimates in this report come from dataobtained in March of years 1968 through 1999 in theCurrent Population Survey (CPS). The Census Bureauconducts the survey every month, although this reportuses only March data for its estimates. The March sur-vey uses two sets of questions, the basic CPS and thesupplement.
The Census Bureau used data from various sourcesin developing alternative measures of income and pov-erty for 1998. Specifically, we combined data from theAmerican Housing Survey (AHS), the Income SurveyDevelopment Program (ISDP), and the Internal RevenueService (IRS) with CPS data to create simulations oftaxes paid, number of tax filing units, adjusted grossincome, and other tax characteristics for the March1999 CPS.
In addition, this report uses the State Tax Handbookfrom Commerce Clearing House as an informationsource for tax data. For noncash valuation estimates,this report uses data from the U.S. Department of Agri-culture (USDA), the Health Care Financing Administra-tion (HCFA), and the Department of Housing and UrbanDevelopment (HUD).
A description of the sources of data we used toderive these estimates follows. Except for the CPS,these descriptions are brief. See Current PopulationReports, Series P60-186RD, Measuring the Effect of Ben-efits and Taxes on Income and Poverty: 1992, and publi-cations on the appropriate surveys for more details.
American Housing Survey. The Census Bureau col-lects housing data for the Department of Housing andUrban Development. The population covered by thesample for the AHS (called the Annual Housing Surveybefore 1984) includes all housing units in the UnitedStates. For a more detailed description of the sampledesign, see the report Current Housing Reports, SeriesH150-89, The American Housing Survey for the UnitedStates in 1989, U.S. Department of Commerce.
The AHS is no longer conducted in even-numberedyears, so we based the property tax estimates in thisreport on the 1995 AHS. Also, for the noncash esti-mates, we used the 1985 AHS data in a model to esti-mate the value of public housing. For more details onthe AHS model used to estimate public and subsidized
housing values, please see Appendix B of Current Popu-lation Reports, Series P60-186RD, Measuring the Effectof Benefits and Taxes on Income and Poverty: 1992.
Income Survey Development Program. The ISDPwas the research and development phase for the Surveyof Income and Program Participation (SIPP). The CensusBureau used the ISDP to examine and resolve design,operational, and technical issues for SIPP. The house-hold sample for the 1979 ISDP was a nationwide,multiple-frame sample. The majority of sample house-holds in the ISDP came from addresses contacted in the1976 Survey of Income and Education. Statisticiansselected the remainder of sample households from areserve file of sample cases maintained by the CensusBureau. For a more detailed description of this sampledesign, see the report Wage and Salary Data From theIncome Survey Development Program: 1979 (Prelimi-nary Data From Interview Period One), Current Popula-tion Reports, Special Studies, Series P-23, No. 118.
Internal Revenue Service data. Much of the IRS datain this report come from the Statistics of Income (SOI)series, in particular the SOI Bulletin Individual IncomeTax Returns, Preliminary Data: 1997, Spring 1999. Thisreport, based on a sample drawn from all tax returnsfiled in 1998, presents information on taxpayers’incomes, exemptions, deductions, credits, and taxes.
Data from other sources. The State Tax Handbook,October 1, 1991, from the Commerce Clearing House,includes information on state tax systems. We updatedthese data to reflect changes in state income tax rates.
Much of the data on cash and noncash benefits arefrom administrative records. Values of school lunchesand food stamps are from USDA unpublished data.Medicaid and medicare data come from HCFA unpub-lished records. Also, USDA and HUD data are used tocompute medicaid and medicare values. For moredetails, see Appendix B of Current Population Reports,Series P60-186RD, Measuring the Effect of Benefits andTaxes on Income and Poverty: 1992.
Basic CPS. The basic CPS collects primarily labor forcedata about the civilian noninstitutional population. Fieldrepresentatives ask questions concerning labor forceparticipation about each member 15 years old and overin every sample household.
APPENDIX E E–1
U.S. Census Bureau

The CPS sample includes coverage in all 50 statesand the District of Columbia. The Census Bureau con-tinually updates the sample to account for new residen-tial construction. The Census Bureau divides the UnitedStates into 2,007 geographic areas. In most states, ageographic area consists of a county or several contigu-ous counties. In some areas of New England andHawaii, the Census Bureau uses minor civil divisionsinstead of counties. We select a total of 754 geographicareas for sample. About 50,000 occupied householdsare eligible for interview every month. Field representa-tives are unable to obtain interviews at about 3,200 ofthese units. This occurs when the occupants are notfound at home after repeated calls or are unavailablefor some other reason.
Since the introduction of the CPS, the Census Bureauhas redesigned the CPS sample several times. Theseredesigns have improved the quality and accuracy ofthe data and have satisfied changing data needs. TheCensus Bureau completely implemented the mostrecent changes due to the 1990 census-based redesignin July 1995.
Table E–1 summarizes changes in the CPS designsfor the years for which data appear in this report.
CPS March supplement. In addition to the basic CPSquestions, field representatives asked supplementaryquestions in March about money income received theprevious calendar year.
To obtain more reliable data for the Hispanic-originpopulation, the Census Bureau increased the March CPSsample by about 2,500 eligible housing units, inter-viewed the previous November, that contained at least
one sample person of Hispanic origin.1 In addition, thesample included persons in the armed forces living offpost or with their families on post.
CPS estimation procedure. This survey’s estimationprocedure adjusts weighted sample results to agreewith independent estimates of the civilian noninstitu-tional population of the United States by state, age,gender, race, and Hispanic/non-Hispanic categories.
The independent estimates are based on:
• The 1990 Decennial Census of Population and Hous-ing.
• An adjustment for undercoverage in the 1990 cen-sus.
• Statistics on births, deaths, immigration, and emigra-tion.
• Statistics on the size of the armed forces.
The independent population estimates used for 1994(1993 for income estimates) and later are based onupdates to controls established by the 1990 decennialcensus. Data previous to 1994 are based on indepen-dent population estimates from the latest availabledecennial census data. The estimation procedure forthe March supplement included a further adjustment sohusband and wife of a household received the sameweight.
The estimates in this report for 1983 (from March1984 CPS) and later also employ a revised surveyweighting procedure for persons of Hispanic origin. Inprevious years, we inflated weighted sample results toindependent estimates of the noninstitutional popula-tion by age, gender, and race. There was no specificcontrol of the survey estimates for the Hispanic popula-tion. Since then, the Census Bureau developed indepen-dent population controls for the Hispanic population bygender and detailed age groups. Revised weighting pro-cedures incorporate these new controls. The indepen-dent population estimates include some, but not all,undocumented immigrants.
ACCURACY OF ESTIMATES
Since the CPS estimates come from a sample, theymay differ from figures from a complete census usingthe same questionnaires, instructions, and enumera-tors. A sample survey estimate has two possible typesof error: nonsampling and sampling. The accuracy of anestimate depends on both types of error, but the full
1Hispanics may be of any race. This report shows informationon the Hispanic population collected in the 50 states and theDistrict of Columbia, and therefore, does not include residents ofPuerto Rico.
Table E–1. Description of the March CurrentPopulation Survey
Time periodNumber of
sampleareas
Housing units eligible1
InterviewedNot
interviewed
1996 to 1999 . . . . . 754 46,800 3,2001995. . . . . . . . . . . . . 792 56,700 3,3001990 to 1994 . . . . . 729 57,400 2,6001989. . . . . . . . . . . . . 729 53,600 2,5001986 to 1988 . . . . . 729 57,000 2,5001985. . . . . . . . . . . . . 2629/729 57,000 2,5001982 to 1984 . . . . . 629 59,000 2,5001980 to 1981 . . . . . 629 65,500 3,0001977 to 1979 . . . . . 614 55,000 3,0001973 to 1976 . . . . . 461 46,500 2,5001972. . . . . . . . . . . . . 449 45,000 2,0001968 to 1971 . . . . . 449 48,000 2,000
1Excludes about 2,500 Hispanic households added from the pre-vious November sample. (See ‘‘CPS March Supplement.’’)
2The Census Bureau redesigned the CPS following the 1980Decennial Census of Population and Housing. During phase-in ofthe new design, housing units from the new and old designs were inthe sample.
E–2 APPENDIX E
U.S. Census Bureau

extent of the nonsampling error is unknown. Conse-quently, one should be particularly careful when inter-preting results based on a relatively small number ofcases or on small differences between estimates. Thestandard errors for CPS estimates primarily indicate themagnitude of sampling error. They also partially mea-sure the effect of some nonsampling errors inresponses and enumeration, but do not measure sys-tematic biases in the data. (Bias is the average over allpossible samples of the differences between the sampleestimates and the desired value.)
Nonsampling variability. We can attribute nonsam-pling errors to several sources including the following:
• Inability to obtain information about all cases in thesample.
• Definitional difficulties.
• Differences in the interpretation of questions.
• Respondents’ inability or unwillingness to providecorrect information.
• Respondents’ inability to recall information.
• Errors made in data collection, such as in recordingor coding the data.
• Errors made in processing the data.
• Errors made in estimating values for missing data.
• Failure to represent all units with the sample (under-coverage).
CPS undercoverage results from missed housingunits and missed persons within sample households.Compared with the level of the 1990 decennial census,overall CPS undercoverage is about 8 percent. Under-coverage varies with age, gender, and race. Generally,undercoverage is larger for males than for females andlarger for Blacks and other races combined than for
Whites. As described previously, ratio estimation toindependent age-gender-race-Hispanic population con-trols partially corrects for the bias due to undercover-age. However, biases exist in the estimates to theextent that missed people in missed households ormissed people in interviewed households have differentcharacteristics from those of interviewed people in thesame age-gender-race-Hispanic group.
A common measure of survey coverage is the cover-age ratio, the estimated population before ratio adjust-ment divided by the independent population control.Table E–2 shows CPS coverage ratios for age-gender-race groups for a typical month. The CPS coverageratios can exhibit some variability from month tomonth, but these are a typical set of coverage ratios.
Answers to questions about money income oftendepend on the memory or knowledge of one person ina household. Recall problems can cause underestimatesof income in survey data, because it is easy to forgetminor or irregular sources of income. Respondents mayalso misunderstand what the Census Bureau considersmoney income or may simply be unwilling to answerthese questions correctly because the questions areconsidered too personal. See Appendix C, CurrentPopulation Reports, Series P60-184, Money Income ofHouseholds, Families, and Persons in the United States:1992 for more details.
For additional information on nonsampling errorincluding the possible impact on CPS data when known,refer to Statistical Policy Working Paper 3, An Error Pro-file: Employment as Measured by the Current Popula-tion Survey, Office of Federal Statistical Policy and Stan-dards, U.S. Department of Commerce, 1978 andTechnical Paper 40, The Current Population Survey:Design and Methodology, U.S. Census Bureau, U.S.Department of Commerce.
Comparability of data. Data obtained from the CPSand other sources are not entirely comparable. Thisresults from differences in field representative training
Table E–2. March CPS Coverage Ratios
AgeNon-Black Black All races
Male Female Male Female Male Female Total
0 to 14 years . . . . . . . . . . . . . . . . . . . . . . . . . . 0.942 0.951 0.880 0.904 0.932 0.943 0.93715 to 19 years . . . . . . . . . . . . . . . . . . . . . . . . . 0.864 0.910 0.885 0.751 0.867 0.884 0.87620 to 24 years . . . . . . . . . . . . . . . . . . . . . . . . . 0.823 0.877 0.707 0.757 0.808 0.859 0.83425 to 29 years . . . . . . . . . . . . . . . . . . . . . . . . . 0.863 0.919 0.755 0.810 0.850 0.903 0.87730 to 34 years . . . . . . . . . . . . . . . . . . . . . . . . . 0.880 0.950 0.671 0.833 0.855 0.934 0.89535 to 44 years . . . . . . . . . . . . . . . . . . . . . . . . . 0.899 0.940 0.684 0.863 0.875 0.930 0.90345 to 54 years . . . . . . . . . . . . . . . . . . . . . . . . . 0.938 0.961 0.778 0.953 0.923 0.960 0.94255 to 64 years . . . . . . . . . . . . . . . . . . . . . . . . . 0.932 0.953 0.834 0.929 0.923 0.951 0.93865 to 74 years . . . . . . . . . . . . . . . . . . . . . . . . . 0.932 0.977 0.939 0.958 0.932 0.975 0.956
75 years and older . . . . . . . . . . . . . . . . . . . . . 1.019 1.008 0.910 0.961 1.011 1.004 1.00715 years and older . . . . . . . . . . . . . . . . . . . . . 0.902 0.945 0.767 0.858 0.887 0.934 0.9120 years and older . . . . . . . . . . . . . . . . . . . . . . 0.911 0.946 0.802 0.871 0.898 0.936 0.917
APPENDIX E E–3
U.S. Census Bureau

and experience and in differing survey processes. Thisis an example of nonsampling variability not reflectedin the standard errors. Use caution when comparingresults from different sources.
A number of changes were made in data collectionand estimation procedures beginning with the January1994 CPS. The major change was the use of a newquestionnaire. The Bureau of Labor Statistics rede-signed the questionnaire to measure the official laborforce concepts more precisely, to expand the amount ofdata available, to implement several definitionalchanges, and to adapt to a computer-assisted interview-ing environment. The Census Bureau modified theMarch supplemental income questions for adaptation tocomputer-assisted interviewing, but did not changedefinitions and concepts. Because of these and other
changes, one should use caution when comparing esti-mates from data collected in 1994 or later years withestimates from earlier years.
Data users should also use caution when comparingCPS estimates in this report, which reflect 1990 census-based population controls, with estimates for 1992(from March 1993 CPS) and earlier years, which reflect1980 census-based population controls. This change inpopulation controls had relatively little impact on sum-mary measures such as means, medians, and percent-age distributions, but did have a significant impact onlevels. For example, 1990-based population controlscaused a 1-percent increase in the civilian noninstitu-tional population and in the number of families andhouseholds. Thus, estimates of levels for data collectedin 1994 and later years will differ from those publishedfor earlier years by more than what could be attributed
Table E–3. CPS Standard Error Parameters for Income and Nonincome Characteristics: 1998
CharacteristicsTotal or White Black Hispanic
a b a b a b
ALL INCOME LEVELS
People
Total . . . . . . . . . . . . . . . . . . . . . . . . . . . . . . . . . . . . . . -0.000012 2,454 -0.000111 2,810 -0.000128 2,810Male . . . . . . . . . . . . . . . . . . . . . . . . . . . . . . . . . . . . . . -0.000024 2,454 -0.000247 2,810 -0.000252 2,810Female. . . . . . . . . . . . . . . . . . . . . . . . . . . . . . . . . . . . −0.000022 2,454 -0.000201 2,810 -0.000248 2,810
Age
15 to 24 . . . . . . . . . . . . . . . . . . . . . . . . . . . . . . . . . . . -0.000065 2,454 -0.000494 2,810 -0.000343 2,81025 to 44 . . . . . . . . . . . . . . . . . . . . . . . . . . . . . . . . . . . -0.000030 2,454 -0.000260 2,810 -0.000195 2,81045 to 64 . . . . . . . . . . . . . . . . . . . . . . . . . . . . . . . . . . . -0.000042 2,454 -0.000458 2,810 -0.000204 2,81065 and over . . . . . . . . . . . . . . . . . . . . . . . . . . . . . . . -0.000076 2,454 -0.001031 2,810 -0.000598 2,810
Households, Families, and UnrelatedIndividuals
Total . . . . . . . . . . . . . . . . . . . . . . . . . . . . . . . . . . . . . . -0.000013 2,241 -0.000117 2,447 -0.000204 2,447Households with children under age 18 . . . . . . . -0.000013 2,241 -0.000117 2,447 -0.000204 2,447
NONINCOME CHARACTERISTICS
People
Employment status . . . . . . . . . . . . . . . . . . . . . . . . . -0.000014 2,985 -0.000127 3,139 -0.000147 3,139Educational attainment . . . . . . . . . . . . . . . . . . . . . . -0.000011 2,369 -0.000106 2,680 -0.000082 1,811
Marital Status, Household and FamilyCharacteristics
Some household members . . . . . . . . . . . . . . . . . . -0.000019 5,211 -0.000213 7,486 -0.000238 7,486All household members . . . . . . . . . . . . . . . . . . . . . -0.000024 6,332 -0.000314 11,039 -0.000350 11,039
Households, Families, and UnrelatedIndividuals
Total . . . . . . . . . . . . . . . . . . . . . . . . . . . . . . . . . . . . . . -0.000012 2,068 -0.000076 1,871 -0.000151 1,871
Notes: To obtain parameters prior to 1998, multiply by the appropriate factor in Table E–4.
For nonmetropolitan residence categories multiply the a and b parameters by 1.5.
For foreign-born and noncitizen characteristics for Total and White, multiply the a and b parameters by 1.3. No adjustment is nec-essary for foreign-born and noncitizen characteristics for Blacks and Hispanics.
For regional estimates, multiply the a and b parameters by 0.85, 1.03, 1.08, and 1.09 for Northeast, Midwest, South, and West,respectively.
E–4 APPENDIX E
U.S. Census Bureau

to actual changes in the population. These differencescould be disproportionately greater for certain sub-population groups than for the total population.
Since the Census Bureau did not use independentpopulation control totals for people of Hispanic originbefore 1983, compare Hispanic estimates over timecautiously.
Based on the results of each decennial census, theCensus Bureau gradually introduces a new sampledesign for the CPS. During this phase-in period, theCensus Bureau collects CPS data from sample designsbased on different censuses. While most CPS estimateshave been unaffected by this mixed sample, geographicestimates are subject to greater error and variability.Users should exercise caution when comparing esti-mates across years for metropolitan/nonmetropolitancategories. For more information, see Appendix C, Cur-rent Population Reports, Series P60-193, Money Incomein the United States: 1995 (With Separate Data on Valu-ation of Noncash Benefits).
Note when using small estimates. The CensusBureau shows summary measures (such as medians,means, and percentage distributions) only when thebase is 75,000 or greater. Because of the large standarderrors involved, summary measures would probably notreveal useful information when computed on a smallerbase. However, we display estimated numbers eventhough the relative standard errors of these numbersare larger than those for corresponding percentages.These smaller estimates permit combinations of thecategories to suit data users’ needs. Take care in theinterpretation of small differences. For instance, even asmall amount of nonsampling error can cause a border-line difference to appear significant or not, thus distort-ing a seemingly valid hypothesis test.
Estimation of median incomes. The Census Bureauhas changed the methodology for computing medianincome over the past few years. The Census Bureau hascomputed medians using either Pareto interpolation orlinear interpolation. Currently, we are using linear inter-polation to estimate all medians. Pareto interpolationassumes a decreasing density of population within anincome interval; whereas, linear interpolation assumesa constant density of population within an income inter-val. The Census Bureau calculates estimates of medianincome for 1979 through 1987 and associated standarderrors using Pareto interpolation if the estimate is largerthan $20,000 for people or $40,000 for families andhouseholds. This is because the width of the incomeinterval containing the estimate is greater than $2,500.
We calculated estimates of median income for 1976,1977, and 1978 and associated standard errors usingPareto interpolation if the estimate was larger than
$12,000 for people or $18,000 for families and house-holds. This is because the width of the income intervalcontaining the estimate is greater than $1,000. We cal-culated all other estimates of median income and asso-ciated standard errors for 1976 through 1998 andalmost all of the estimates of median income and asso-ciated standard errors for 1975 and earlier using linearinterpolation.
Thus, use caution when comparing median incomesabove $12,000 for people or $18,000 for families andhouseholds for different years. Median incomes belowthose levels are more comparable from year to yearsince they have always been calculated using linearinterpolation. For an indication of the comparability ofmedians calculated using Pareto interpolation withmedians calculated using linear interpolation, see SeriesP-60, No. 114, Money Income in 1976 of Families andPersons in the United States.
Sampling variability. Sampling variability is variationthat occurred by chance because a sample was sur-veyed rather than the entire population. Standarderrors, as calculated by methods described in ‘‘Standarderrors and their use,’’ are primarily measures of sam-pling variability, but they may include some nonsam-pling error.
Standard errors and their use. Data users must usea number of approximations to derive, at a moderatecost, standard errors applicable to all the estimates inthis report. Instead of providing an individual standarderror for each estimate, we have provided two param-eters, a and b, to calculate standard errors for eachtype of characteristic.
Table E–3 has CPS standard error parameters for vari-ous types of characteristics. Table E–4 provides factorsto approximate CPS standard error parameters for esti-mates prior to 1998. Table E–5 provides CPS Hispanicparameters for estimates prior to 1984. Table
Table E–4. CPS Factors to Apply to a and bParameters for Estimates Prior to1998
Characteristic Factor
NON-HISPANIC
1995 to 1997 . . . . . . . . . . . . . . . . . . . . . . . . . . . . . . . . . 1.001989 to 1994 . . . . . . . . . . . . . . . . . . . . . . . . . . . . . . . . . 0.921988 . . . . . . . . . . . . . . . . . . . . . . . . . . . . . . . . . . . . . . . . . 1.021981 to 1987 . . . . . . . . . . . . . . . . . . . . . . . . . . . . . . . . . 0.861967 to 1980 . . . . . . . . . . . . . . . . . . . . . . . . . . . . . . . . . 0.75
HISPANIC
1995 to 1997 . . . . . . . . . . . . . . . . . . . . . . . . . . . . . . . . . 1.001989 to 1994 . . . . . . . . . . . . . . . . . . . . . . . . . . . . . . . . . 0.921988 . . . . . . . . . . . . . . . . . . . . . . . . . . . . . . . . . . . . . . . . . 1.191984 to 1987 . . . . . . . . . . . . . . . . . . . . . . . . . . . . . . . . . 0.86
APPENDIX E E–5
U.S. Census Bureau

E–6 provides CPS Asian and Pacific Islander parametersfor income and nonincome characteristics. Table E–7has the year-to-year CPS correlation coefficients forincome characteristics.
The sample estimate and its standard error enableone to construct a confidence interval, a range thatwould include the average result of all possible sampleswith a known probability. For example, if all possiblesamples were surveyed under essentially the same gen-eral conditions and using the same sample design, andif an estimate and its standard error were calculatedfrom each sample, then approximately 90 percent ofthe intervals from 1.645 standard errors below the esti-mate to 1.645 standard errors above the estimatewould include the average result of all possiblesamples.
A particular confidence interval may or may not con-tain the average estimate derived from all possiblesamples. However, one can say with specified confi-dence that the interval includes the average estimatecalculated from all possible samples.
Some statements in the report may contain estimatesfollowed by a number in parentheses. This number canbe added to and subtracted from the estimate to calcu-late upper and lower bounds of the 90-percent confi-dence interval. For example, if a statement contains thephrase ‘‘grew by 1.7 (±1.0) percent,’’ the 90-percentconfidence interval for the estimate, 1.7 percent, is 0.7percent to 2.7 percent.
Data users may also use standard errors to performhypothesis testing; this is a procedure for distinguish-ing between population parameters using sample esti-mates. One common type of hypothesis appearing in
Table E–5. CPS Standard Error Parameters for Income and Nonincome Characteristics ofHispanics: 1972 to 1983
Characteristics1972 - 1980 1981 - 1983
a b a b
ALL INCOME LEVELS
People
Total . . . . . . . . . . . . . . . . . . . . . . . . . . . . . . . . . . . . . . . . . . . . . . . . . . -0.000020 3,000 -0.000301 3,357Male . . . . . . . . . . . . . . . . . . . . . . . . . . . . . . . . . . . . . . . . . . . . . . . . . . -0.000043 3,000 -0.000615 3,357Female . . . . . . . . . . . . . . . . . . . . . . . . . . . . . . . . . . . . . . . . . . . . . . . . -0.000038 3,000 -0.000591 3,357
Age
15 to 24 . . . . . . . . . . . . . . . . . . . . . . . . . . . . . . . . . . . . . . . . . . . . . . . -0.000080 3,000 -0.000961 3,35725 to 44 . . . . . . . . . . . . . . . . . . . . . . . . . . . . . . . . . . . . . . . . . . . . . . . -0.000065 3,000 -0.000668 3,35745 to 64 . . . . . . . . . . . . . . . . . . . . . . . . . . . . . . . . . . . . . . . . . . . . . . . -0.000077 3,000 -0.001459 3,35765 and over. . . . . . . . . . . . . . . . . . . . . . . . . . . . . . . . . . . . . . . . . . . . -0.000147 3,000 -0.004124 3,357
Farm . . . . . . . . . . . . . . . . . . . . . . . . . . . . . . . . . . . . . . . . . . . . . . . . . (X) (X) (X) (X)
Households, Families, and Unrelated Individuals
Total . . . . . . . . . . . . . . . . . . . . . . . . . . . . . . . . . . . . . . . . . . . . . . . . . . -0.000014 2,420 -0.000237 2,708Farm . . . . . . . . . . . . . . . . . . . . . . . . . . . . . . . . . . . . . . . . . . . . . . . . . . (X) (X) (X) (X)Households with children under age 18 . . . . . . . . . . . . . . . . . . . -0.000014 2,420 -0.000237 2,708
NONINCOME CHARACTERISTICS
People
Employment status . . . . . . . . . . . . . . . . . . . . . . . . . . . . . . . . . . . . . (X) (X) (X) (X)Educational attainment . . . . . . . . . . . . . . . . . . . . . . . . . . . . . . . . . . -0.000015 2,344 -0.000152 2,623Farm . . . . . . . . . . . . . . . . . . . . . . . . . . . . . . . . . . . . . . . . . . . . . . . . . . (X) (X) (X) (X)
Total, Marital Status, Other
Some household members . . . . . . . . . . . . . . . . . . . . . . . . . . . . . . -0.000026 5,069 -0.000294 5,673All household members . . . . . . . . . . . . . . . . . . . . . . . . . . . . . . . . . -0.000044 10,199 -0.000592 11,414
Households, Families, and Unrelated Individuals
Total . . . . . . . . . . . . . . . . . . . . . . . . . . . . . . . . . . . . . . . . . . . . . . . . . . -0.000020 1,626 -0.000022 1,820Farm . . . . . . . . . . . . . . . . . . . . . . . . . . . . . . . . . . . . . . . . . . . . . . . . . . (X) (X) (X) (X)
X Not applicable.
Note: Data users should multiply the a and b parameters by 1.5 for nonmetropolitan residence categories. The Census Bureau did not pub-lish income data for Hispanics before 1972.
E–6 APPENDIX E
U.S. Census Bureau

this report is that two population parameters are differ-ent. An example of this would be comparing themedian annual income of Black families with themedian annual income of White families.
One can perform tests at various levels of signifi-cance. The significance level of a test is the probabilityof concluding that the characteristics are differentwhen, in fact, they are the same. All statements of com-parison in the text were tested at the 0.10 level of sig-nificance or better. This means that the absolute valueof the estimated difference between characteristics isgreater than or equal to 1.645 times the standard errorof the difference.
Standard errors of estimated numbers. Theapproximate standard error, sx, of an estimated numbershown in this report can be obtained using the formula
sx � �ax2 � bx (1)
Here x is the size of the estimate and a and b are theparameters in Table E–3 or E–6 associated with the par-ticular type of characteristic. When calculating standarderrors for numbers from cross-tabulations involving dif-ferent characteristics, use the set of parameters for thecharacteristic which will give the largest standard error.
Illustration. There were 71,535,000 family householdsin 1999. Use the appropriate parameters from Table E–3and formula (1) to get
Estimate, x 71,535,000
a parameter -0.000012b parameter 2,068Standard error 294,00090% confidence interval 71,051,000 to 72,019,000
The standard error is calculated as
sx � � ��0.000012� �71,535,000�2 � �2,068� �71,535,000� � 294,000
The 90-percent confidence interval for the estimatednumber of family households in 1999 is calculated as71,535,000 ± 1.645 x 294,000.
A conclusion that the average estimate derived fromall possible samples lies within a range computed inthis way would be correct for roughly 90 percent of allpossible samples.
Standard errors of estimated percentages. Thereliability of an estimated percentage, computed usingsample data from both numerator and denominator,depends on the size of the percentage and its base.Estimated percentages are relatively more reliable thanthe corresponding estimates of the numerators of thepercentages, particularly if the percentages are 50 per-cent or more. When the numerator and denominator ofthe percentage are in different categories, use theparameter from Table E–3 or E–6 indicated by thenumerator.
Table E–6. CPS Standard Error Parameters for Income and Nonincome Characteristics of Asiansand Pacific Islanders: 1998
Characteristics a b
ALL INCOME LEVELS
People . . . . . . . . . . . . . . . . . . . . . . . . . . . . . . . . . . . . . . . . . . . . . . . . . . . . . . . . . . . . . . . . . . . . . . -0.000303 2,810Households, families, and unrelated individuals . . . . . . . . . . . . . . . . . . . . . . . . . . . . . . . . . . -0.000352 2,447
NONINCOME CHARACTERISTICS
People
Total, marital status, other
Some household members . . . . . . . . . . . . . . . . . . . . . . . . . . . . . . . . . . . . . . . . . . . . . . . . . . . . -0.000587 7,486All household members . . . . . . . . . . . . . . . . . . . . . . . . . . . . . . . . . . . . . . . . . . . . . . . . . . . . . . . -0.000866 11,039
Households, families, and unrelated individuals . . . . . . . . . . . . . . . . . . . . . . . . . . . . . . -0.000197 1,871
Note: To obtain parameters prior to 1998, multiply by the appropriate factor in Table E–4. Income data for Asians and Pacific Islanders werenot collected prior to 1988.
Table E–7. CPS Year-to-Year CorrelationCoefficients for Income Estimates:1960 to 1998
Characteristics
People
Families,households,
andunrelated
individuals
Total . . . . . . . . . . . . . . . . . . . . . . . . . . . . . 0.30 0.35
White . . . . . . . . . . . . . . . . . . . . . . . . . . . . . . . 0.30 0.35Black . . . . . . . . . . . . . . . . . . . . . . . . . . . . . . . 0.30 0.35Other races. . . . . . . . . . . . . . . . . . . . . . . . . . 0.30 0.35Hispanic1 . . . . . . . . . . . . . . . . . . . . . . . . . . . 0.45 0.55
1Hispanics may be of any race.
Note: These correlations are for comparisons of consecutiveyears. For comparisons of nonconsecutive years, assume the corre-lations are zero. For Asians and Pacific Islanders, use the correla-tion coefficient for total.
APPENDIX E E–7
U.S. Census Bureau
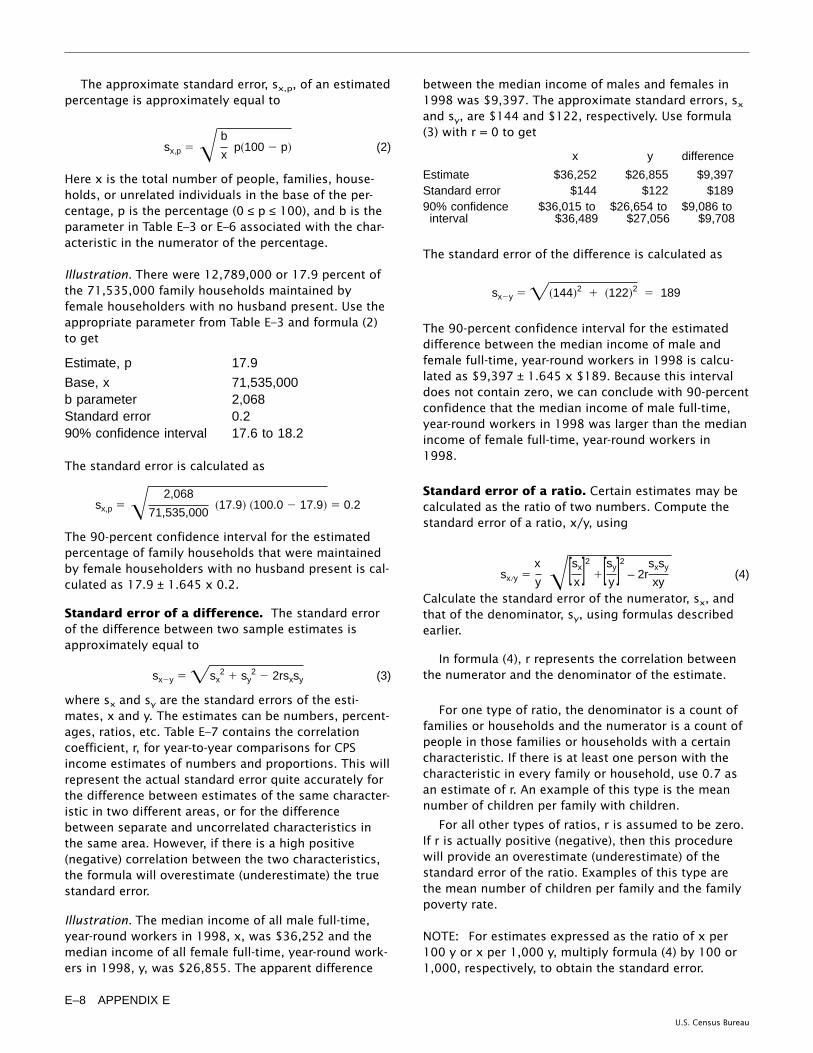
The approximate standard error, sx,p, of an estimatedpercentage is approximately equal to
sx,p �� b
xp�100 � p� (2)
Here x is the total number of people, families, house-holds, or unrelated individuals in the base of the per-centage, p is the percentage (0 ≤ p ≤ 100), and b is theparameter in Table E–3 or E–6 associated with the char-acteristic in the numerator of the percentage.
Illustration. There were 12,789,000 or 17.9 percent ofthe 71,535,000 family households maintained byfemale householders with no husband present. Use theappropriate parameter from Table E–3 and formula (2)to get
Estimate, p 17.9
Base, x 71,535,000b parameter 2,068Standard error 0.290% confidence interval 17.6 to 18.2
The standard error is calculated as
sx,p �� 2,068
71,535,000�17.9� �100.0 � 17.9� � 0.2
The 90-percent confidence interval for the estimatedpercentage of family households that were maintainedby female householders with no husband present is cal-culated as 17.9 ± 1.645 x 0.2.
Standard error of a difference. The standard errorof the difference between two sample estimates isapproximately equal to
sx�y � �sx2 � sy
2 � 2rsxsy (3)
where sx and sy are the standard errors of the esti-mates, x and y. The estimates can be numbers, percent-ages, ratios, etc. Table E–7 contains the correlationcoefficient, r, for year-to-year comparisons for CPSincome estimates of numbers and proportions. This willrepresent the actual standard error quite accurately forthe difference between estimates of the same character-istic in two different areas, or for the differencebetween separate and uncorrelated characteristics inthe same area. However, if there is a high positive(negative) correlation between the two characteristics,the formula will overestimate (underestimate) the truestandard error.
Illustration. The median income of all male full-time,year-round workers in 1998, x, was $36,252 and themedian income of all female full-time, year-round work-ers in 1998, y, was $26,855. The apparent difference
between the median income of males and females in1998 was $9,397. The approximate standard errors, sxand sy, are $144 and $122, respectively. Use formula(3) with r = 0 to get
x y difference
Estimate $36,252 $26,855 $9,397Standard error $144 $122 $18990% confidenceinterval
$36,015 to$36,489
$26,654 to$27,056
$9,086 to$9,708
The standard error of the difference is calculated as
sx�y � ��144�2 � �122�2 � 189
The 90-percent confidence interval for the estimateddifference between the median income of male andfemale full-time, year-round workers in 1998 is calcu-lated as $9,397 ± 1.645 x $189. Because this intervaldoes not contain zero, we can conclude with 90-percentconfidence that the median income of male full-time,year-round workers in 1998 was larger than the medianincome of female full-time, year-round workers in1998.
Standard error of a ratio. Certain estimates may becalculated as the ratio of two numbers. Compute thestandard error of a ratio, x/y, using
sx�y �x
y �[sx
x]2 �[sy
y]2 – 2r
sxsy
xy(4)
Calculate the standard error of the numerator, sx, andthat of the denominator, sy, using formulas describedearlier.
In formula (4), r represents the correlation betweenthe numerator and the denominator of the estimate.
For one type of ratio, the denominator is a count offamilies or households and the numerator is a count ofpeople in those families or households with a certaincharacteristic. If there is at least one person with thecharacteristic in every family or household, use 0.7 asan estimate of r. An example of this type is the meannumber of children per family with children.
For all other types of ratios, r is assumed to be zero.If r is actually positive (negative), then this procedurewill provide an overestimate (underestimate) of thestandard error of the ratio. Examples of this type arethe mean number of children per family and the familypoverty rate.
NOTE: For estimates expressed as the ratio of x per100 y or x per 1,000 y, multiply formula (4) by 100 or1,000, respectively, to obtain the standard error.
E–8 APPENDIX E
U.S. Census Bureau

Illustration. The median earnings for full-time, year-round female workers in 1998, x, was $25,862 and themedian earnings for full-time, year-round male workersin 1998, y, was $35,345. The ratio of the median earn-ings is 0.73. The approximate standard errors, sx andsy, are $118 and $133, respectively. Using formula (4)with r = 0 to get
x y ratio
Estimate $25,862 $35,345 .73Standard error $118 $133 .004390% confidenceinterval
$25,668 to$26,056
$35,126 to$35,564
0.72 to0.74
The standard error is calculated as
sx�y �25,862
35,345 � [ 118
25,862]2 � [ 133
35,345]2 � .0043
The 90-percent confidence interval for the ratio of themedian earnings for full-time, year-round female work-ers to the median earnings for full-time, year-roundmale workers is calculated as .73 ± 1.645 x 0.0043.
Standard errors of other estimates. This reportprovides standard errors for most estimates in therespective tables, or includes a formula showing how tocalculate them. For information on calculating otherstandard errors, contact Carrie Jones at E-mail address:[email protected].
APPENDIX E E–9
U.S. Census Bureau