Money, deposit creation, monetary policy
57
Money, Deposit Creation, and Monetary Policy Dr. Clark Ross Davidson College 08/31/14 www.tinyurl.com/clarkross The presenter gratefully acknowledges the assistance of Asst. Professor Shyam Gouri Suresh (Department of Economics), David Heilbron ‘13 and Wilson Turner ‘15, all from Davidson College.
-
Upload
mike-fladlien -
Category
Education
-
view
362 -
download
1
Transcript of Money, deposit creation, monetary policy

Money, Deposit Creation, and Monetary Policy
Dr. Clark RossDavidson College
08/31/14www.tinyurl.com/clarkross
The presenter gratefully acknowledges the assistance of Asst. Professor Shyam Gouri Suresh (Department of Economics), David Heilbron ‘13 and Wilson Turner ‘15, all from Davidson College.

For more classroom resources as well as discussion forums visit the
AP Macroeconomics Teacher Community
https://apcommunity.collegeboard.org/web/apmacro/home
Money Supply (M1) =
Currency + Checkable Deposits
+Traveler’s Checks Outstanding
$2,793.8 Billion
$1,223.4 Billion $1,567.2 Billion
$3.2 Billion
As of August 18, 2014

M1 With Components

Currency as Percentage of M1

M2 =$11,457.8 Billion
M1 $2,793.8 Billion
+ Savings Deposits $7,497.4 Billion
+ Small-Denomination Time Deposits $527.0 Billion
+ Money Market Mutual Funds $639.7 Billion
As of August 18, 2014

M2

Money Supply and GDP
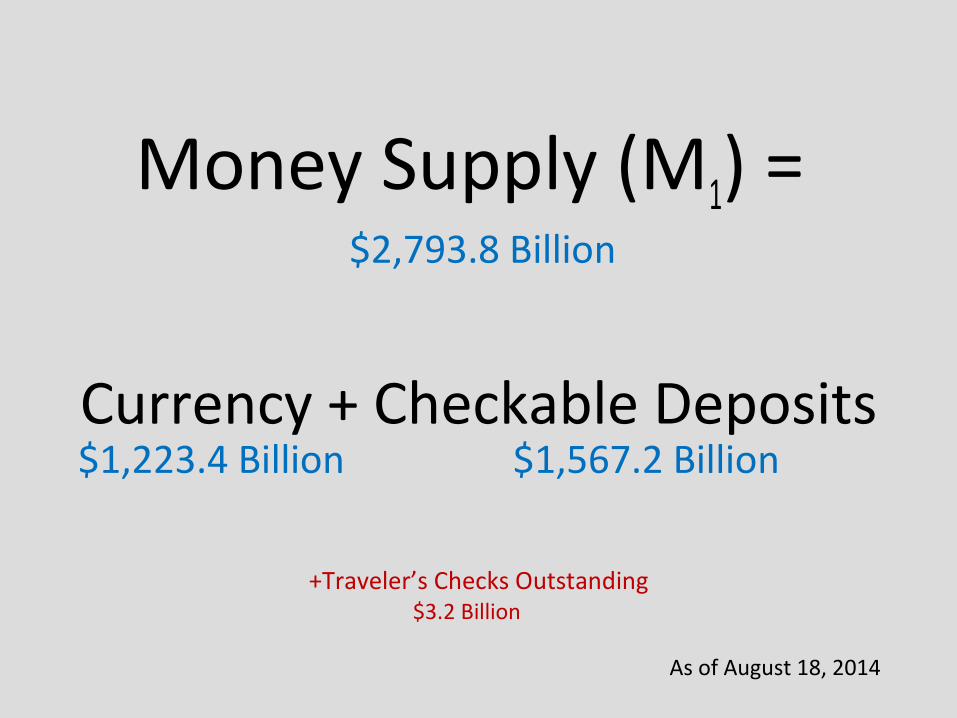
• Velocity: The number of times per year that the average dollar in the money supply is spent for final goods and services. [Economics, McConnell Brue Flynn, 19th edition, 8-30]
M1V = PQM1 x Velocity = Nominal GDP

Current Figures
Category Amount ($ Billion)M1 2,793.8PQ (Nominal GDP) 17,311.3
As of Aug 1, 2014
V = PQ/M1 = 6.20
Velocity of M1

Money Market
$
rn
MS
MD
rt
• MS = Money Supply essentially set by the Federal Reserve
• MD = Money Demand– Influences:
• Transaction demand Nominal GDP or Income (+)
• Asset/Speculative Demand Opportunity cost of holding money (-)
• Precautionary Demand Unforeseen Expenses (+)

Market for “Federal Funds”
$
rn
MS
MD
0.1%
• Federal Funds Rate:
Rate at which banks charge one another for overnight loans made from excess reserves.
• rt = nominal interest rate target for federal funds
(0% - 0.10 % for July 2014)

Federal Funds Rate

Real Interest Rates and Interest-Sensitive Investment and Consumption
rreal
$ Desired Expenditure
Investments
r0
ε0
r1
ε1

The Structure of Nominal Interest Rates1. Federal Funds Target 0% - 0.25%
2. Money Market 0.36%
3. Five-Year C.D. 1.52%
4. Ten-Year Treasury 2.42%
5. 15-Year Mortgage 3.18%
6. 30-Year Mortgage 4.19%
7. 30-Year Treasury 3.18%
Real Interest Rate = RNominal – Expected Inflation
Example: 15-Year Mortgage
Real Interest Rate = 3.18% – 1.5% = 1.67%
The New York Times figures, as of July 2014

Example: Real 30-Year Mortgage Rate

Required Reserve Ratio = 10%
Assets Liabilities & Owner’s Equity
Loans 800 Deposits 1000
Government Bonds 200 Owner’s Equity 100
Reserves 100
1100 1100
Balance Sheet: Bank A
Bank A has no excess reserves

Balance Sheet: Bank BRequired Reserve Ratio = 10%
Assets Liabilities & Owner’s Equity
Loans 750 Deposits 1000
Government Bonds 200 Owner’s Equity 100
Reserves 150
1100 1100
Bank B has $50 excess reserves

Required Reserve Ratio
Bank reserves, required and/or excess,
may either be held at:
1.The bank (vault cash)
2.The regional Federal Reserve Bank

A Model of Deposit Creation
• When a commercial bank receives a cash deposit, the bank’s ability to increase loans begins a chain of new loans that can lead to a multiplied increase in demand deposits and in the money supply.
• The extent of the maximum multiplied increase is directly tied to the required reserve ratio.

An Example
• Assume Person A deposits $1000 of cash, previously held in her home, in Bank I.
• Bank I must maintain $100 of reserves against Person A’s deposit.
• This allows Bank I to loan out $900 to Person B.
Required Reserve Ratio= 10%
Assets Liabilities
Bank New Loans New Reserves New Deposits
I $900 (Person B) $100 $1000 (Person A)

An Example
• Next Person B takes the loan and employs a contractor, Person C, to build a deck for $900 .
• Bank I must maintain $100 of reserves against Person A’s deposit.
• The contractor (Person C) deposits the $900 into his bank, Bank II. Bank II must maintain $90 of cash reserves against this deposit of $900.
• This allows Bank II to loan out an additional $810.
Required Reserve Ratio= 10%
Assets Liabilities
Bank New Loans New Reserves New Deposits
I $900 (Person B) $100 $1000 (Person A)
II $810 (Person D) $90 $900 (Person C)

An Example
• Assume Bank II lends $810 to person D who wishes to have a medical procedure.
• Person D pays the physician (Person E) the $810; the physician deposits the $810 in her account in Bank III.
• Bank III must then hold $81 in cash reserves allowing Bank III to lend out $729 to Person F.
Required Reserve Ratio= 10%
Assets Liabilities
Bank New Loans New Reserves New Deposits
I $900 (Person B) $100 $1000 (Person A)
II $810 (Person D) $90 $900 (Person C)
III $729 (Person F) $81 $810 (Person E)

An Example
• This process continues with the following end result:
Required Reserve Ratio= 10%
• The $1,000 in new reserves represents the $1,000 cash deposit by Person A.
• These reserves are now spread across many banks.

An Example
• The deposit creation multiplier is equal to 1/(Required Reserve Ratio).
• In this example this multiplier is equal to 1/.10 = 10• The maximum final increase in demand deposits is
10 times the increase in cash reserves of $1000.
Required Reserve Ratio= 10%

Change in the Money Supply
• Since the Money Supply is the sum of circulating cash and demand deposits, in this case the maximum increase in the money supply is $9,000. – Circulating cash falls by $1,000 (Person A’s original
deposit of cash into Bank I)– Demand deposits grow by $10,000, for a net
increase of $9,000

Limitations to the Maximum Increase
1. Banks keep excess reserves:
– Bank I need not increase loans by a full $900, the
maximum legal increase in loans.
– In the absence of sufficiently credit-worthy
customers, for example, Bank I may keep excess
reserves, loaning out only $700 and maintaining
$200 of excess reserves.

Limitations to the Maximum Increase
2. Leakage to coin and currency:
– The contractor (Person C) was paid $900.
– If instead of depositing the full $900 in his
account at Bank II, the contractor kept $100 in
cash and only deposited $800, then Bank II
would only have been able to increase its loans
by $720 (90% of $800) instead of $810 (90% of
the full $900.

Limitations to the Maximum Increase
3. Time:
– This process takes many iterations to approach
its full impact.
– After several months, only a partial multiplied
increase in demand deposits can be expected.

Example 2: Using Bank Balance Sheet
Bank I:
1.The $1000 deposit by Person A generates a $1000 increase in cash reserves and a $1000 increase in demand deposits.
Assets Liabilities & Owner’s Equity
Reserves +1000 Demand Deposits (Person A)
+1000

Example 2: Using Bank Balance Sheet
Bank I:2.Bank I may loan out $900 to Person B to build the deck. The bank puts the proceeds of the loan into Person B's checking account at Bank I, so that Person B may write a check to pay the contractor.
Assets Liabilities & Owner’s Equity
Loans (Person B) +900 Demand Deposits (Person B)
+900

Example 2: Using Bank Balance Sheet
Bank I:3.Once the contractor (Person C) cashes the check, Person B's demand deposits decrease by $900 and the cash reserves decrease by $900, as the proceeds of the check are sent to Bank II, where the contractor (Person C) deposits the check.
Assets Liabilities & Owner’s Equity
Reserves (sent to Bank II)
-900 Demand Deposits (Person B)
-900

Example 2: Using Bank Balance SheetBank I:4.The final change for Bank I is: – An increase in Demand Deposits of (Person A) of $1000,– An increase in loans of $900 (Person B),– An increase of cash reserves of $100.
4. Note that Bank I is keeping new cash reserves of $100 equal to 10% of the new demand deposit, the amount consistent with the required reserve ratio of 10%.
Assets Liabilities & Owner’s Equity
Reserves +1000 Demand Deposits (Person A) +1000
Loans (Person B) +900 Demand Deposits (Person B) +900
Reserves (sent to Bank II)
-900 Demand Deposits (Person B) -900
1000 1000
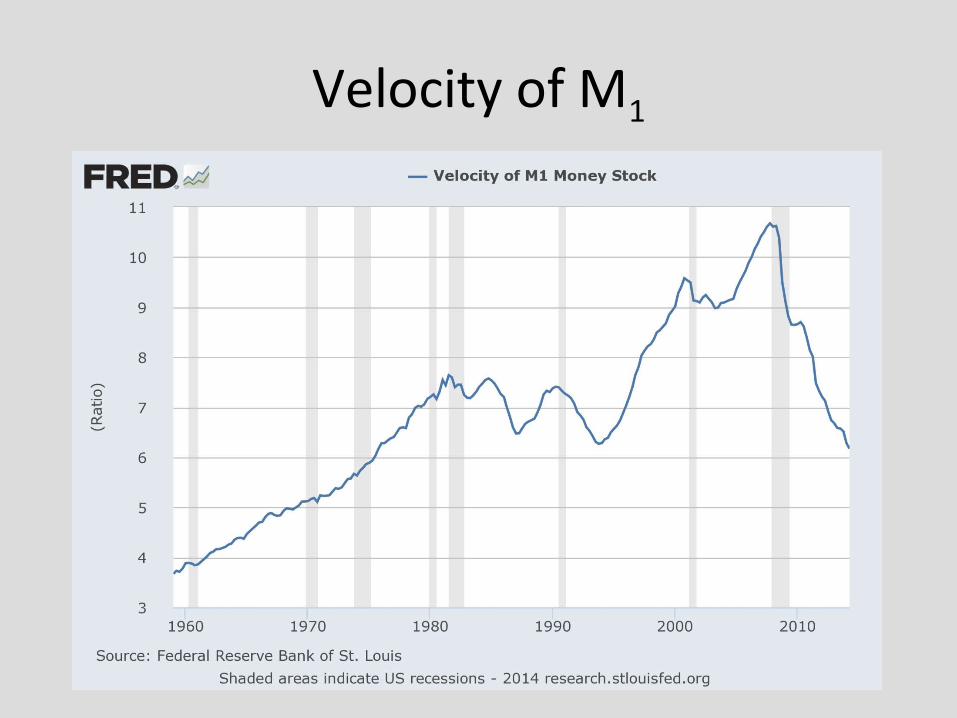
Open Market Operation- Expansionary
r0
r1
M1
Ms’
$
rnominal
M0
Ms
MD

Open Market Operation- Expansionary
SPBond
$D
P1
P0
D’
Secondary Market for Bonds

Open Market Operation- Expansionary
rreal
$
Investments
rr0
I0
rr1
I1

Open Market Operation- Expansionary
Goals:
•GDPreal will Increase
• Employment will Increase
•Unemployment will Decrease

Open Market Operation- Contractionary
r1
r0
M1
Ms’
M0
Ms
$
rnominal
MD

Open Market Operation- Contractionary
SPBond
$
D
P0
S’
P1Secondary Market for
Bonds

Open Market Operation- Contractionary
I1
rr1
rreal
$
Investments
rr0
I0

Open Market Operation- Contractionary
Goal:
•Price Level will Decrease

Leads to:
Expansionary Monetary Policy
–Increased Money Supply–Decreased Interest Rates–Increased Investment–Increased Aggregate Demand–Increased GDP–Increased Employment–Decreased Unemployment

Traditional Tools of Expansionary Monetary Policy
1. Open Market Purchase of Bonds by Federal Reserve
2. Lower Discount Rate– Rate at which banks may borrow from the
Federal Reserve
1. Lower Required Reserve Ratio

Tools of Expansionary Monetary Policy
Recently Employed Tools:4. Quantitative Easing• Purchasing of various financial assets with
newly created money.
5. Operation Twist• Lowering of long-term interest rates by selling
shorter-term bonds and buying longer-term bonds.
• Aim is to encourage long-term investment.

Limits to Monetary Policy
1. Banks keeping excess reserves.
2. Leakage of funds to circulating currency.
3. Time lag in making new loans, reducing immediate effectiveness
4. Inelasticity of investment and other interest-rate expenditures

2012 Free Response
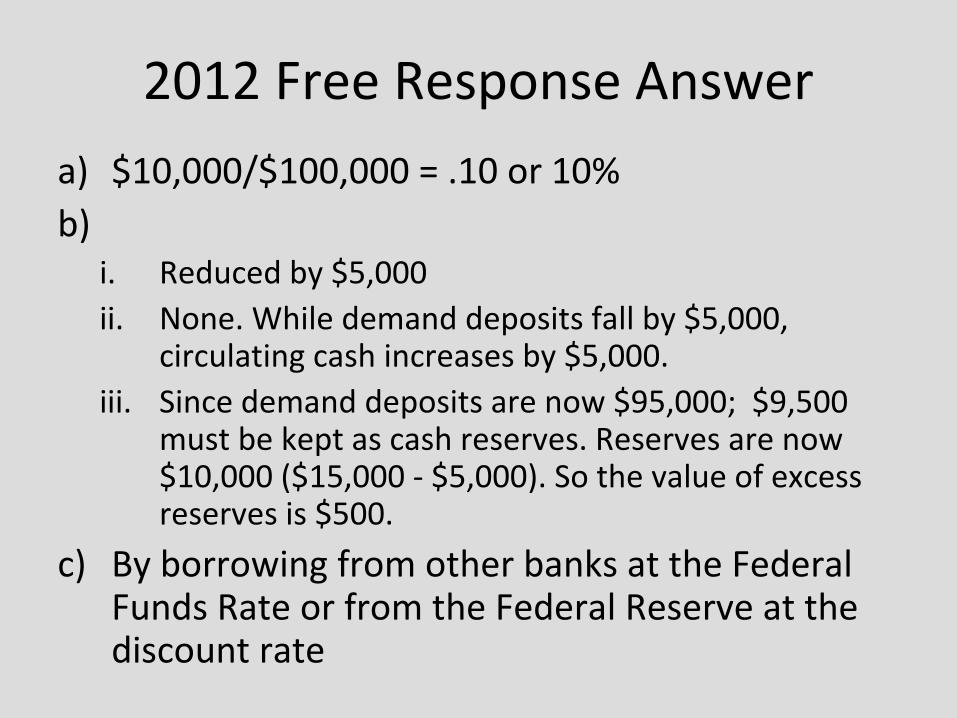
2012 Free Response Answer
a) $10,000/$100,000 = .10 or 10%b)
i. Reduced by $5,000ii. None. While demand deposits fall by $5,000,
circulating cash increases by $5,000.iii. Since demand deposits are now $95,000; $9,500
must be kept as cash reserves. Reserves are now $10,000 ($15,000 - $5,000). So the value of excess reserves is $500.
c) By borrowing from other banks at the Federal Funds Rate or from the Federal Reserve at the discount rate

2011 Free Response

2011 Free Response Answer

2010 Free Response
2. A drop in credit card fees causes people to use credit cards more often for transactions and demand less money.
a) Using a correctly labeled graph of the money market, show the nominal interest rate will be affected.
b) Given the interest rate change in part (a), what will happen to bond prices in the short run?
c) Given the interest rate change in part (a), what will happen to price level in the short run? Explain.
d) Identify an open-market operation the Federal Reserve could use to keep the nominal interest rate constant at the level that existed before the drop in credit card fees. Explain.

2010 Free Response Answer

2009 Free Response Form B

2009 Form B Answer

2009 Form B Answer

2009 Free Response

2009 Free Response Answer

All data and graphs taken from:
Fed FRED
http://research.stlouisfed.org/fred2/