“Money and Your School District” - NYS PTA Funding School districts spend more than $65 billion...
20
NYS PTA Summer Leadership Conference “Money and Your School District” July 23, 2017
Transcript of “Money and Your School District” - NYS PTA Funding School districts spend more than $65 billion...

NYS PTA Summer Leadership Conference
“Money and Your School District” July 23, 2017

School Funding
School districts spend more than $65 billion statewide
New York State supports slightly less than 45% of
school expenditures (with STAR)
Without STAR, state support is just under 40%
High of 48% in 2001-02 (with STAR)
Local revenue supports nearly 55%
Mainly property taxes
© 2017 New York State School Boards Association

School Budget Timeline July 1 – School Year Begins
Late Summer/Early Fall – Property Taxes Levied
Late Summer/Early Fall – Districts submit end of school year spending information and projections for the upcoming year
Late Fall – Initial Budget Development Begins
District Staff, Board Committees, Community Input
November/December – Board of Regents release State Aid Proposal
© 2017 New York State School Boards Association

School Budget Timeline January – Governor releases Executive Budget proposal,
with school aid
March 1 – Property Tax Cap Calculation Due
April 1 – State Budget Deadline School Aid Estimates
Late April – Board of Education Approves Budget Proposal
Third Tuesday in May – School Budget Vote
Third Tuesday in June – School Budget Revote
© 2017 New York State School Boards Association
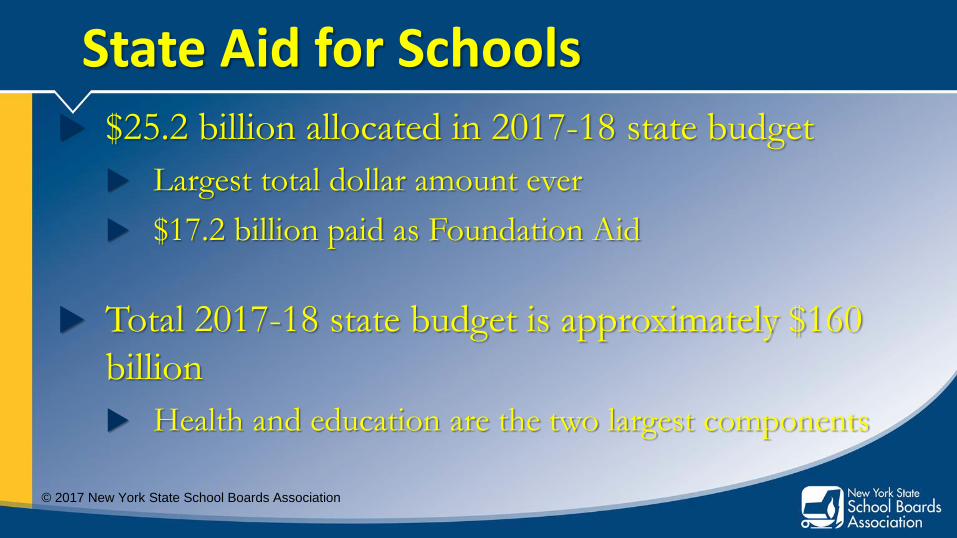
State Aid for Schools $25.2 billion allocated in 2017-18 state budget
Largest total dollar amount ever
$17.2 billion paid as Foundation Aid
Total 2017-18 state budget is approximately $160
billion
Health and education are the two largest components
© 2017 New York State School Boards Association

Formula-Based State Aid for Schools
© 2017 New York State School Boards Association

State Aid Process
Executive State Budget Aid Runs Based on estimates (expenditures, enrollment, etc.) from October
District budget development
Enacted State Budget Aid Runs Based on estimates (expenditures, enrollment, etc.) from January
District budget vote
State Aid Payments Based on revised data throughout the year and
year-end financial reporting
Cash flow © 2017 New York State School Boards Association

State Aid Factors
Free and Reduced Priced Lunch Count (FRPL)
Rolling three year average of students receiving free and reduced price lunches; student need measure
Poverty Count
Students aged 5-17 in families below poverty line, based on the 2000 census; student need measure
Beginning use of Small Area Income and Poverty Estimate (SAIPE)
© 2017 New York State School Boards Association
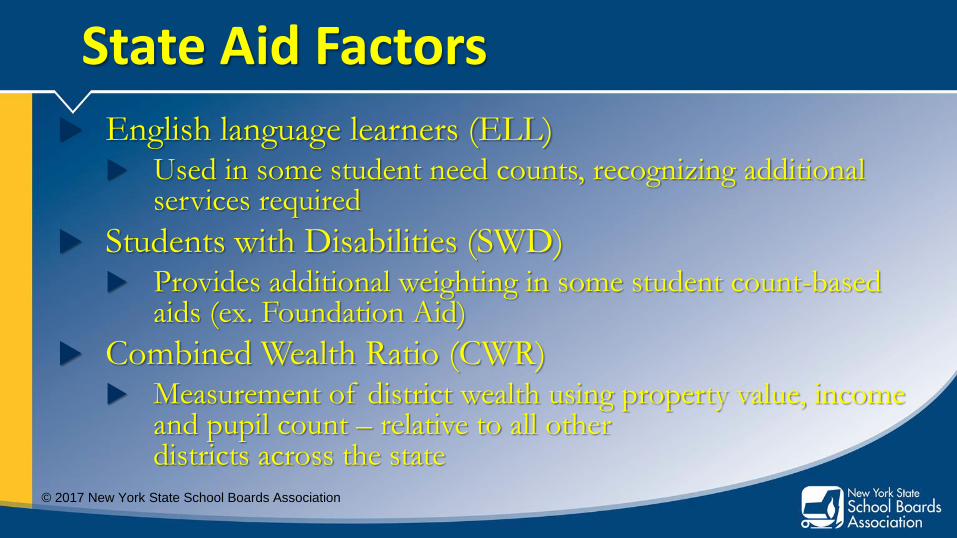
State Aid Factors
English language learners (ELL) Used in some student need counts, recognizing additional
services required
Students with Disabilities (SWD) Provides additional weighting in some student count-based
aids (ex. Foundation Aid)
Combined Wealth Ratio (CWR) Measurement of district wealth using property value, income
and pupil count – relative to all other districts across the state
© 2017 New York State School Boards Association
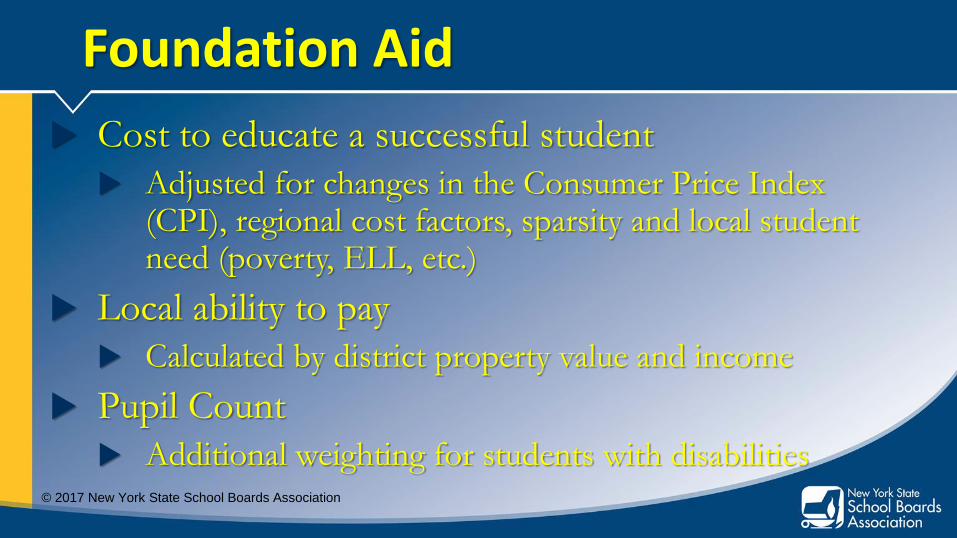
Foundation Aid
Cost to educate a successful student
Adjusted for changes in the Consumer Price Index (CPI), regional cost factors, sparsity and local student need (poverty, ELL, etc.)
Local ability to pay
Calculated by district property value and income
Pupil Count
Additional weighting for students with disabilities
© 2017 New York State School Boards Association
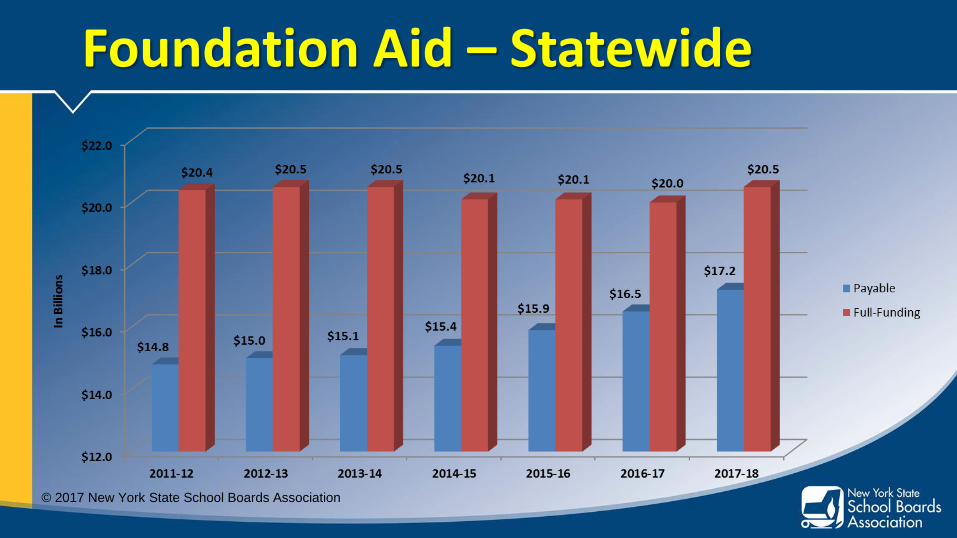
Foundation Aid – Statewide
© 2017 New York State School Boards Association
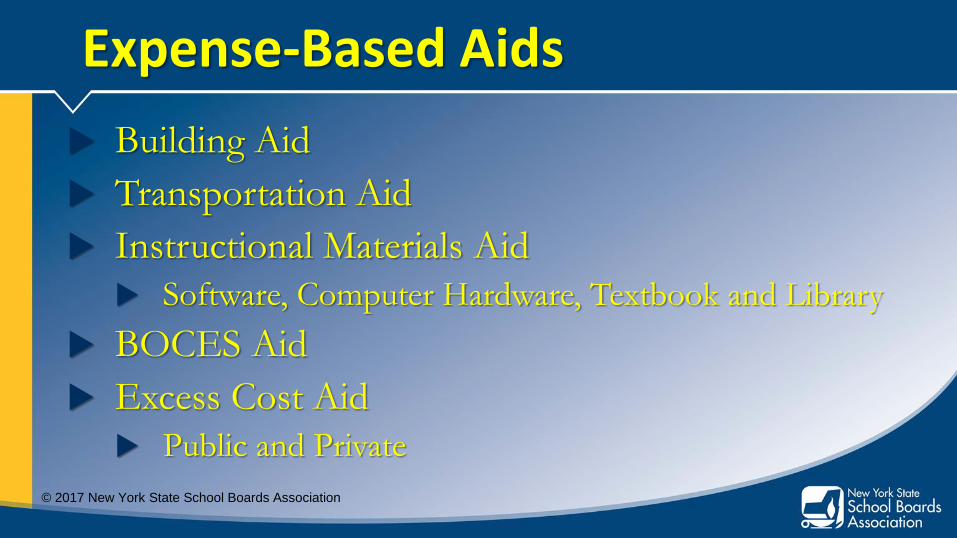
Expense-Based Aids
Building Aid
Transportation Aid
Instructional Materials Aid
Software, Computer Hardware, Textbook and Library
BOCES Aid
Excess Cost Aid
Public and Private
© 2017 New York State School Boards Association

Additional Aids
Full-Day Kindergarten Conversion Aid
Universal Pre-Kindergarten
Special Services Aid
Charter School Transitional Aid
High Tax Aid
Reorganization Incentive Aid Operating and Building
Grants
© 2017 New York State School Boards Association

Aid Payments from the State General Aid
Foundation, building, transportation
Excess Cost Aid
Instructional Materials Aid
BOCES Aid Sent directly to BOCES for distribution
Lottery Aid and VLT Aid General, instructional material and TRS
Not aligned with aid categories
© 2017 New York State School Boards Association
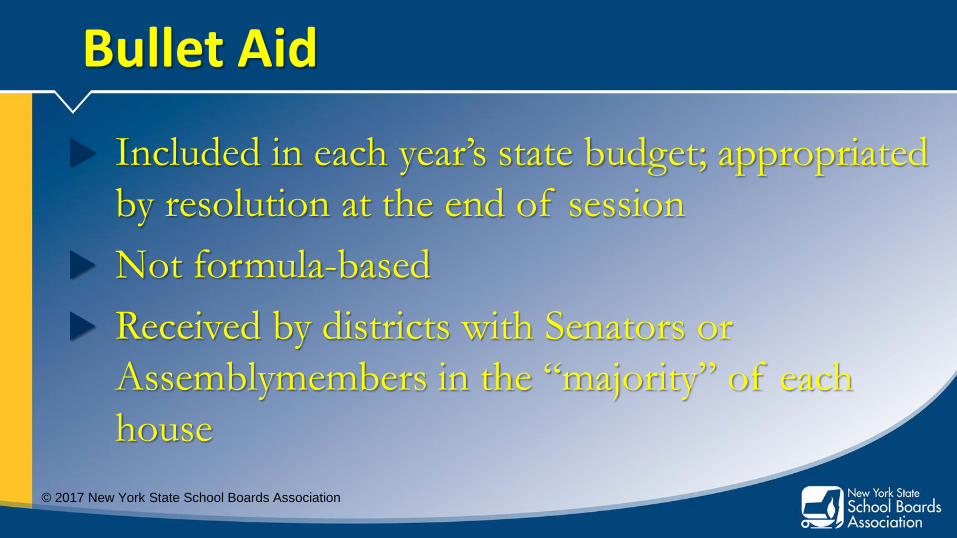
Bullet Aid
Included in each year’s state budget; appropriated
by resolution at the end of session
Not formula-based
Received by districts with Senators or
Assemblymembers in the “majority” of each
house
© 2017 New York State School Boards Association
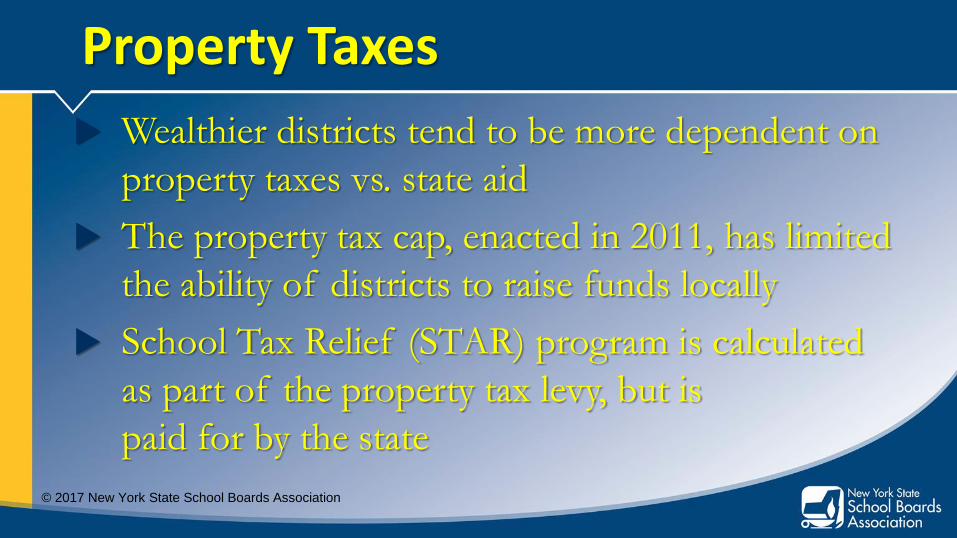
Property Taxes
Wealthier districts tend to be more dependent on
property taxes vs. state aid
The property tax cap, enacted in 2011, has limited
the ability of districts to raise funds locally
School Tax Relief (STAR) program is calculated
as part of the property tax levy, but is
paid for by the state
© 2017 New York State School Boards Association
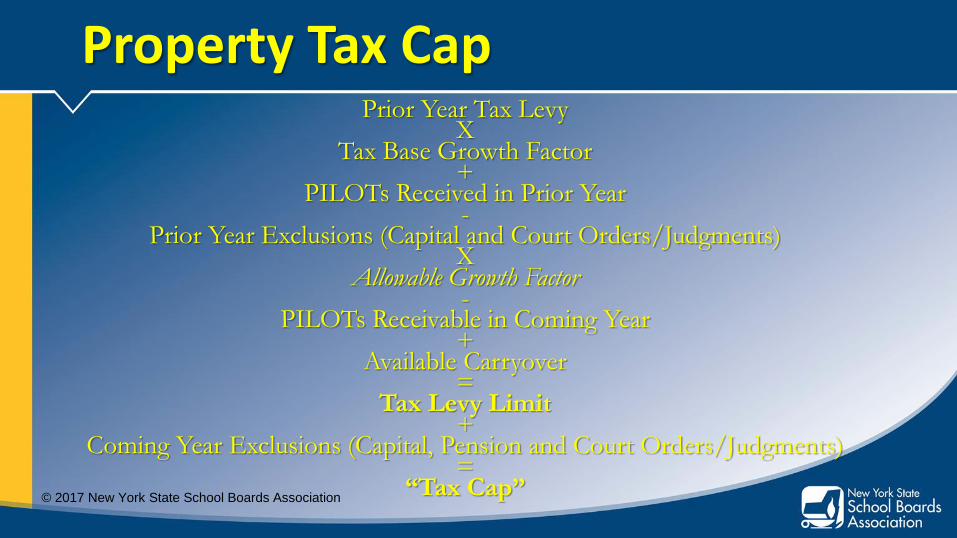
Property Tax Cap Prior Year Tax Levy
X Tax Base Growth Factor
+ PILOTs Received in Prior Year
- Prior Year Exclusions (Capital and Court Orders/Judgments)
X Allowable Growth Factor
- PILOTs Receivable in Coming Year
+ Available Carryover
= Tax Levy Limit
+ Coming Year Exclusions (Capital, Pension and Court Orders/Judgments)
= “Tax Cap”
© 2017 New York State School Boards Association
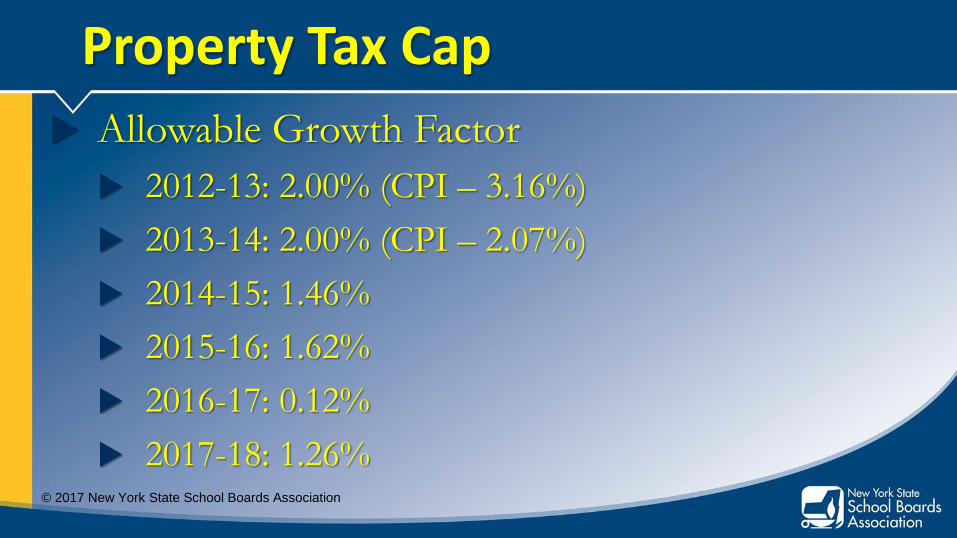
Property Tax Cap
Allowable Growth Factor
2012-13: 2.00% (CPI – 3.16%)
2013-14: 2.00% (CPI – 2.07%)
2014-15: 1.46%
2015-16: 1.62%
2016-17: 0.12%
2017-18: 1.26%
© 2017 New York State School Boards Association

Any Questions?
© 2017 New York State School Boards Association
Contact
Brian C. Fessler Senior Governmental Relations Representative
New York State School Boards Association
518-783-0200
© 2017 New York State School Boards Association