Money and Monetary Policy - Current Practice - IEEP
274
IEEP Money and Monetary Policy Current Practice Josef Jílek Prague, 2006
Transcript of Money and Monetary Policy - Current Practice - IEEP

IEEP
Money and Monetary Policy
Current Practice
Josef Jílek
Prague, 2006

1
Money and Monetary Policy Current Practice
Josef Jílek
Institute for Economic and Environmental Policy
University of Economics, Prague

2
Institute for Economic and Environmental Policy
University of Economics, Prague
W. Churchill sq. 4
130 67 Prague 3
Czech Republic
Copyright © 2006 by Josef Jílek
All rights reserved

3
Preface........................................................................................................................................ 5 About the author......................................................................................................................... 6 Acknowledgements .................................................................................................................... 6 1 Money................................................................................................................................. 7
1.1 Money as monetary aggregates .................................................................................. 7 1.1.1 Current definition of money............................................................................... 7 1.1.2 Monetary aggregates ........................................................................................ 10 1.1.3 Monetary aggregates in the USA ..................................................................... 11 1.1.4 Monetary aggregates in the Eurozone.............................................................. 13 1.1.5 Monetary aggregates in Japan .......................................................................... 14 1.1.6 Monetary aggregates in the United Kingdom .................................................. 15
1.2 Creation and Extinction of Money ........................................................................... 16 1.2.1 Where, how and when does the money create and become extinct ................. 16 1.2.2 Loans granted by banks to non-bank entities ................................................... 20 1.2.3 Interest paid on deposits and other liabilities of banks to non-bank entities.... 40 1.2.4 Assets purchased by banks from non-bank entities ......................................... 42 1.2.5 Payments of wages and salaries to bank employees, management and statutory individuals ........................................................................................................................ 46 1.2.6 Payments of dividends and royalties ................................................................ 47 1.2.7 Extinction of money ......................................................................................... 48 1.2.8 Payments between clients of one commercial bank......................................... 51 1.2.9 Domestic currency payments between clients of two commercial banks ........ 54 1.2.10 Issue of debt and equity securities by commercial banks ................................ 56 1.2.11 Issue of debt and equity securities by clients ................................................... 61 1.2.12 Flow of money as a result of cross-border investments ................................... 61
1.3 Liquidity and reserve requirements.......................................................................... 66 1.3.1 Liquidity and bank reserves ............................................................................. 67 1.3.2 Role of reserve requirements............................................................................ 79 1.3.3 Examples of the reserve requirements ............................................................. 83
1.4 Example of the banking system without central bank.............................................. 85 Example of the banking system including central bank....................................................... 90
1.4.1 Central bank without currency and reserve requirements ................................ 90 1.4.2 Central bank with currency and no reserve requirements ................................ 91 1.4.3 Central bank with currency and reserve requirements ................................... 101
1.5 The basics of financial statements.......................................................................... 107 1.5.1 US generally accepted accounting principles................................................. 107 1.5.2 International Financial Reporting Standards.................................................. 108 1.5.3 EU directives and regulations ........................................................................ 109 1.5.4 The role of accounting in regulation of financial institutions ........................ 110
1.6 Financial statements of central bank ...................................................................... 111 1.6.1 The role of central bank ................................................................................. 111 1.6.2 Three structures of the central bank’s balance sheet...................................... 124 1.6.3 Examples of the central bank’s financial statements...................................... 129 1.6.4 Administration of the international reserves .................................................. 138 1.6.5 Seigniorage..................................................................................................... 141
2 Monetary policy ............................................................................................................. 145 2.1 Essentials of monetary policy ................................................................................ 145 2.2 Monetary policy instruments.................................................................................. 149
2.2.1 Open market operations ................................................................................. 149 2.2.2 Automatic facilities ........................................................................................ 153 2.2.3 The Fed........................................................................................................... 153 2.2.4 The Eurosystem.............................................................................................. 159 2.2.5 The Bank of Japan.......................................................................................... 161 2.2.6 The Bank of England...................................................................................... 162

4
2.3 Operating targets .................................................................................................... 164 2.4 Intermediate targets ................................................................................................ 166
2.4.1 Monetary aggregates targeting ....................................................................... 166 2.4.2 The use of monetary aggregates..................................................................... 168 2.4.3 Exchange rate targeting.................................................................................. 172
2.5 Ultimate targets ...................................................................................................... 173 2.5.1 Price stability.................................................................................................. 173 2.5.2 Definition of Inflation .................................................................................... 177 2.5.3 Real and nominal interest rates ...................................................................... 178 2.5.4 Deflation......................................................................................................... 181
2.6 Inflation targeting................................................................................................... 186 2.6.1 History of inflation targeting.......................................................................... 187 2.6.2 Explicit inflation target................................................................................... 190 2.6.3 Transparency and accountability of central bank........................................... 192 2.6.4 The role of inflation forecasts ........................................................................ 194
2.7 Monetary policy transmission mechanism............................................................. 195 2.7.1 Monetary policy channels .............................................................................. 195 2.7.2 Transfer to other market interest rates............................................................ 201 2.7.3 Effects of inflation expectations..................................................................... 202 2.7.4 Persistence of prices and wages ..................................................................... 203 2.7.5 Monetary policy lags...................................................................................... 204 2.7.6 Monetary policy, GDP and employment........................................................ 207
2.8 Monetary policy rules............................................................................................. 209 2.8.1 Autopilot of monetary policy ......................................................................... 209 2.8.2 NAIRU ........................................................................................................... 210
2.9 Foreign exchange interventions ............................................................................. 212 2.9.1 The essentials of foreign exchange interventions .......................................... 212 2.9.2 The reasons for FX intervention..................................................................... 215 2.9.3 Effectiveness of Interventions........................................................................ 216 2.9.4 Evidence of some Countries........................................................................... 216
2.10 Dollarization........................................................................................................... 218 2.10.1 Advantages and Disadvantages of Dollarization ........................................... 219 2.10.2 Dollarized Countries ...................................................................................... 220
2.11 Monetary policy in the USA .................................................................................. 222 2.11.1 Monetary policy till 1960s ............................................................................. 222 2.11.2 Monetary policy from 1960s .......................................................................... 224
2.12 Monetary policy in Eurozone................................................................................. 228 2.13 Monetary policy in Japan ....................................................................................... 232 2.14 Monetary policy in the United Kingdom ............................................................... 235 2.15 Some general trends ............................................................................................... 239
3 Payment systems ............................................................................................................ 241 3.1 Essentials of payment systems ............................................................................... 241
3.1.1 Interbank payment systems ............................................................................ 241 3.1.2 Forms of bank payments ................................................................................ 245
3.2 Gross and net settlement systems........................................................................... 248 3.2.1 Gross settlement systems ............................................................................... 248 3.2.2 Net settlement systems ................................................................................... 249
3.3 Payment systems in the United States.................................................................... 256 3.4 Payment system in Eurozone ................................................................................. 257 3.5 Payment system in Japan........................................................................................ 259 3.6 Payment system in the United Kingdom................................................................ 261
References .............................................................................................................................. 263

5
Preface The book tries to explain the firm framework of the current money and the current monetary
policy in major countries (the USA, Eurozone, Japan and the United Kingdom). Even if the
book is based on the contemporary banking practice, it comes from careful examination of
historical development of opinions on money and monetary policy. The author is of the view
that the best way how to demonstrate the money (and the financial system as a whole) is by
accounting. Thus any operation is clarified through double-entry.
The first chapter deals with the money as money aggregates, creation and extinction of
money, decision-making of banks about whether or not to grant loans, issue of debt and equity
securities by commercial banks and clients, flow of money as a result of cross-border
investments, liquidity and reserve requirements. Further, two examples of the banking system
(without and including central bank) are shown. These examples help to understand the
effects of the currency and of the reserve requirements on the financial positions of economic
sectors (commercial banks, enterprises, government, households and central bank).
Consequently, the attention is devoted to the basics of financial statements, three structures of
central bank’s balance sheet, examples of the central bank’s financial statements,
administration of the international reserves and seigniorage.
The second chapter concentrates on the practice of monetary policy according to the causality
chain: monetary policy instruments, operating targets, intermediate targets, and ultimate
targets. Inflation targeting follows as many central banks decided to use explicit monetary
policy targets in the 1990s. Monetary policy relies on a chain of economic relations allowing
the central bank to influence inflation. Thus, transmission mechanism plays the central role in
monetary policy. It works through credit, entrepreneurial, expenditure and foreign exchange
channels. Subsequently, the topics are monetary policy rules, foreign exchange interventions
and dollarization. The chapter is closed with description of monetary policy in the major
countries.
The third chapter gives an outline of the payment systems. It is an extension of the first
chapter and begins with interbank payment systems and forms of bank payments. Further,
gross and net payment systems are explained. Finally, payment systems in the major countries
are described.
6
About the author
Josef Jílek, professor of macroeconomics at the University of Economics, Prague (Czech
Republic) and chief expert at the Czech National Bank (central bank), has a long experience
in macroeconomics, monetary policy, financial markets and accounting. His working
philosophy in economics is based on rigorous balance sheet approach as accounting seems to
be the best way how to demonstrate any transaction including complex financial operations.
The description through double-entries is handy. This attitude towards accounting evolved
during his work at the Czech National Bank (central bank) and during numerous meetings
with people involved in practical aspects of macroeconomics, monetary policy and financial
markets (local and international conferences, seminars for professionals, lectures for
students). He is a frequent speaker for adults in different occasions (bankers, academic
people, and general public) and for students regularly: in the Czech Republic and abroad. He
has presented over two hundred educational programs to professional and bank groups in the
Czech Republic and internationally. Professor Josef Jílek is a widely published authority on
macroeconomics, monetary policy, financial markets and accounting and has published 12
books for the publisher Grada Publishing (http://www.grada.cz) and over 300 professional
and scientific papers. He is associated with a number of other professional initiatives germane
to worldwide adoption of International Financial Reporting Standards.
Acknowledgements
Many people have played a part in the production of this book. Practitioners, academics and
students who have made suggestions including Charles Goodhart (Norman Sosnow Professor
of Banking and Finance, London School of Economics), L. Randall Wray (Professor of
Economics, University of Missouri-Kansas City), Lex Hoogduin (Head of Research de
Nederlandsche Bank, Professor of Monetary Economics and Financial Institutions), Huw Pill
(Head of Division, Monetary Policy Stance, European Central Bank), Jonathan Thomas
(Monetary Assessment and Strategy Division, Bank of England), Frederic Gielen (Lead
Financial Management Specialist, The World Bank Group), Jaroslav Kucera (International
Monetary Fund).
I welcome comments on the book from readers. My email address is: [email protected]

7
1 Money
The first chapter deals with the money as money aggregates, creation and extinction of
money, liquidity and reserve requirements, two examples of the banking system (without and
including central bank), basics of financial statements and financial statements of central
bank.
1.1 Money as monetary aggregates
What is money? What can be designated as “money”? Such questions are asked mainly by
central banks. The main objective of almost every central bank is to maintain the price
stability. In order to achieve this target, central banks need to know the quantity of money in
the economy. For general public money generally indicates anything acceptable as a legal
tender in repaying debts and a store of value.
1.1.1 Current definition of money
Any money represents for one entity claim (financial asset) and for the other entity payable
(financial liability) at the same time. There are a lot of relationships between creditors and
debtors in the economy but only some relationships are considered as money. Money
generally refers only to some relationships where the debtors are banks and the creditors are
non-bank entities (relationships where both the debtors and the creditors are banks are not
called “money” but “liquidity”). However not all claims of non-bank entities, which are at the
same time bank liabilities, are included by the definition of money. Therefore, money
(monetary aggregates) is a subset of all relationships between creditors and debtors in
the whole economy1 and more specifically a subset of all relationships between non-bank
creditors and bank debtors. Money as debt instruments represents a subset of financial
instruments2.
Banks as debtors ensure high credibility of debtor-creditor relationship. Such money is
sometimes referred to as “bank money“, “money stock” or “money supply” but we mostly
use the simple term “money”. There are some exceptions to the definition of money. For
1 However, imagine the situation where banks would discount all commercial credits in the economy (i.e., invoices, cheques and other instruments not issued directly by banks). In such a case, all debt relationships would amalgamate into money. Imagine, how would money aggregates change (inflate) if all commercial credit were thus discounted? 2 According to International Financial Reporting Standards, a financial instrument is any contract that gives rise to a financial asset of one entity and a financial liability or equity instrument of another entity.

8
example in some cases, broad monetary aggregates include also some securities issued by
some non-bank entities. For example aggregate M3 of euro-system covers also money market
fund shares and units as well as debt securities with a maturity of up to two years).
The term “money” comprises both the currency held by the public and government (i.e.
currency in circulation, banknotes and coins held by the public and government) and the
accounting money (Figure 1.1) – both held by the public (households and enterprises). The
accounting money has the form of book entries on current accounts (checking accounts,
demand deposits or sight deposits), term accounts (time deposits, term deposits) and saving
accounts. In other words, money represents some liabilities of central bank to the public and
government (currency in circulation3), and some liabilities of commercial banks to the public
(current accounts, term accounts and savings accounts). The definition of money does not
comprise liabilities of commercial banks to other banks, i.e. the liquidity. Nowadays, the
currency in circulation represents only a small portion of the total money stock. Thus talking
about money, we mean primarily the money in the form of book entries.
From the whole set of central bank liabilities only the currency in circulation (i.e. banknotes
and coins held by the public and government) contributes to the money stock (monetary
aggregate M0). We have to point out that the currency in circulation consists only of the coins
and banknotes outside of the central bank and commercial banks. Currency held by
commercial banks in their vaults is usually excluded from the definition of money. Other
liabilities of the central bank to its clients, including government does not contribute to the
monetary aggregates. The same holds for liabilities of central bank to commercial banks
(liquidity).
Money represents the purchasing power of economic agents (households, enterprises and
government). It is supposed that purchasing power of money is strongly related to total
expenses and total production of goods and services in the whole economy. Estimations of
future price changes determine the velocity of money (i.e. the desire by economic agents to
hold money at the expense of other financial and real assets). If there is strong inflation or
inflation expectation, agents seek to minimize holdings of almost all kinds of money and the
velocity of money accelerates. Consequently, agents replace money by holdings of other
financial and real assets. If prices are expected to remain stable, agents generally hold more
money and less other financial and real assets and the velocity of money decelerates. In the
3 This exactly holds when central bank issues both banknotes and coins. However, in many countries coins are issued by the treasury department.

9
case of deflation and deflation expectation, holdings of money become very lucrative and
holdings of other financial and real assets are minimized. The velocity of money decelerates.
The reason is that even if holding of money does not bear any or very low interest, it yields
positive real income.
The question of monetary policy is which monetary aggregates influence the price level, i.e.
which monetary aggregates have the best correlation with the price level as there is no
satisfactory monetary aggregate that can help us find reliable and stable relation
between money and the price level. Diverse money items fit the moneyness differently.
Thus central bank sets several definitions of money (monetary aggregates).
Figure 1.1 Scheme of monetary aggregates M0, M1, and M2 in the balance sheets of
central bank and commercial banks
Central bank
Currency in circulation
Commercial banks
Current accounts
Term and savings accounts
M0
M1
M2

10
1.1.2 Monetary aggregates
The stock of money is usually measured by the monetary aggregates, such as M0, M1, or
M2. There is no unique measure of money. Monetary aggregates generally cover some debt
instruments of central bank and commercial banks. There are some exceptions to this rule. For
example some broad monetary aggregates cover money market fund shares and units as a
high degree of liquidity make these instruments close substitutes for deposits. The interbank
deposits (i.e. deposits commercial bank versus commercial bank and deposits commercial
bank versus central bank) are excluded from the definitions of money. It follows the fact that
during the accounting consolidation of the whole banking system these deposits are cancelled.
Interbank deposits do not influence purchasing power of the public and thus price level.
We can generally characterize monetary aggregates as follows:
o Monetary aggregates are usually distinguished using the letter M in connection with
the digits ranging from 0 to 3 (sometimes even higher),
o The ranking of monetary aggregates follows the degree of liquidity, i.e. the ease and
convenience with which an asset can be converted to a medium of exchange or used
for payments. Lower digits correspond to higher liquidity and vice versa, the
aggregate marked by a higher number generally contains the whole preceding
aggregate plus some of the less liquid assets,
o The currency in circulation is usually denoted as M0 and it contains both the currency
in circulation held by residents as well as by non-residents, for these two parts of
currency are indistinguishable. Some central banks do not publish the M0 at all, as
they regard the deposits on current accounts as liquid as the currency in circulation,
o Broader monetary aggregates are usually more stable than the narrow ones, for
broader aggregates are less affected by the conversions between the components of
money stock (such as the conversions between the current accounts and the term
accounts),
o The narrow money M1 has the best correlation with the purchasing power of the
public and thus with the price level. The reason is that it doesn’t contain the money
which is used by the public as a store of value (i.e. money that is not used for the
purchases of goods and services). The broader money M2 and M3 cannot be used so
easily for immediate purchases for the premature withdrawal from term accounts are

11
usually penalized. The restrictions involve the need for advance notification, delays,
penalties or fees,
o Term accounts also usually provide higher yields, which lead to their higher
popularity,
o In some cases, the liquidity differences between aggregates are quite small. For
example, the conversion from M1 to the liquid parts of broader aggregates (such as the
money market unit) is very easy. These conversions take usually place when the
opportunity costs of holding M1 change,
o In some countries monetary aggregates (with the exception of currency in circulation)
contain only financial instruments held by the country residents, for only this money
is said to impact the domestic inflation. If we study monetary aggregates in different
countries, we really observe that non-residential deposits do not make part of domestic
aggregates in many countries. On the other hand in some countries (e.g. the USA)
some of monetary aggregates include the deposits of domestic residents (U.S. citizens)
in foreign countries,
o Monetary aggregates in some countries can differ substantially even if they bear the
same code. There are continuous changes in definitions of monetary aggregates within
individual countries.
1.1.3 Monetary aggregates in the USA
In the United States, the last revision of monetary aggregates was made in 1983. Fed tracks
and reports three monetary aggregates of depository institutions, i.e. commercial banks and
thrift institutions (Table 1.1).
The first one, M1, consists of money, which is used primarily for immediate payments, that is
of currency in circulation, traveler’s checks, demand deposits and other checkable deposits.
The Federal Reserve float is not included. The second one, M2, consists of M1 plus time and
saving deposits, retail money market mutual funds and money market deposit accounts.
Households primarily hold the M2. M3 equals M2 plus large time deposits, eurodollars and
balances of institutions in money market mutual funds. All aggregates represent liabilities of
Fed, depository institutions, and money market funds to households, non-financial
institutions, federal, state, and local governments.

12
Table 1.1 Monetary aggregates in the USA according to the Fed Monetary
aggregate
Description
M1 o Currency held by the public (i.e. currency outside of the Department of the Treasury, Federal
Reserve Banks, and depository institutions)
o Outstanding traveler’s checks of non-bank issuers,
o Demand deposits at all commercial banks other than those due to depository institutions, the
U.S. government, and foreign banks and official institutions less cash items in the process of
collection and Federal Reserve float,
o Other checkable deposits (OCD), including negotiable order of withdrawal (NOW) and
automatic transfer service (ATS) accounts at depository institutions,
o Credit union share draft accounts,
o Demand deposits at thrift institutions.
M2 o M1,
o Time and savings deposits, including retail repurchase agreements (RPs), in amounts under $100,000,
o Individual holdings in money market mutual funds, o Money market deposit accounts (MMDAs).
o M2 excludes individual retirement accounts (IRAs) and Keogh (selfemployed retirement)
balances at depository institutions and in money market funds. Also excluded are all
balances held by U.S. commercial banks, retail money market funds (general purpose and
broker-dealer), foreign governments, foreign commercial banks, and the U.S. government.
M3 o M2,
o Time deposits and RPs in amounts of $100,000 or more issued by commercial banks and
thrift institutions,
o Eurodollars held by U.S. residents at foreign branches of U.S. banks worldwide and at all
banking offices in the United Kingdom and Canada,
o All balances in institution-only money market mutual funds.
M3 excludes amounts held by depository institutions, the U.S. government, money market funds,
foreign banks and official institutions.
Source: http://www.federalreserve.gov

13
1.1.4 Monetary aggregates in the Eurozone
Eurozone is formed by 12 countries which have introduced euro as a final step of the third
phase of Economic and Monetary Union (EMU), namely by Austria, Belgium, Finland,
France, Germany, Greece, Ireland, Italy, Luxembourg, Netherlands, Portugal, and Spain form
January 2002. Eurosystem consists of European Central Bank (ECB) and of national central
banks of those countries that have accepted euro. To derive monetary aggregates ECB uses
the balance sheet of Eurosystem and the consolidated balance sheet of the so-called monetary
financial institutions (MFIs). MFIs are the central banks, credit institutions, money market
funds, and other institutions accepting deposits (and substitutes of deposits) from the non-
financial institutions – residents of the EU. The number of MFIs amounts to approximately
8000. The complete list of MFIs could be found on the website of the European Central Bank
(http://www.ecb.int).
ECB reports three monetary aggregates of MFIs (Table 1.2). Narrow money M1 includes
currency in circulation as well as balances which can immediately be converted into currency
or used for cashless payments, i.e. overnight deposits. Intermediate money M2 comprises
M1 and, in addition, deposits with a maturity of up to two years and deposits redeemable at a
period of notice of up to three months. Broad money M3 comprises M2 and marketable
instruments issued by the MFI sector. Certain money market instruments, in particular money
market fund (MMF) shares/units and repurchase agreements are included in this aggregate.
Table 1.2 Monetary aggregates in the Eurozone according to the ECB Monetary aggregate
Description
M1 o Banknotes and coins,
o Overnight deposits
M2 o M1,
o Deposits with an agreed maturity of up to two years
o Deposits redeemable at notice of up to three months
M3 o M2
o Repurchase agreements
o Money market fund shares and units
o Debt securities with a maturity of up to two years
Source: http://www.ecb.int

14
1.1.5 Monetary aggregates in Japan
In Japan money stock represents the holdings of corporations, individuals, local government,
etc. Excluded are holdings of financial institutions and central government. Aside from banks
and Shinkin banks, the holdings of trust accounts (including investment trusts), insurance
companies, and public financial institutions are also excluded, but the holdings of securities
companies, securities finance companies and Tanshi companies are included as a part of
corporations' holdings (Table 1.3).
Table 1.3 Monetary aggregates in Japan according to the Bank of Japan Monetary
aggregate
Description
M1 o Currency in circulation.
o Deposit money, i.e. demand deposits (current deposits + ordinary deposits + savings
deposits + deposits at notice + special deposits + deposits for tax payments) + check and
notes held by the surveyed financial institutions.
Financial institutions surveyed for deposit money, quasi-Money, and CDs:
domestically licensed banks (including foreign trust banks), foreign banks in Japan, Shinkin
Central Bank, Shinkin banks, Norinchukin Bank and Shoko Chukin Bank.
M2+CDs o M1,
o Quasi-money, i.e. time deposits + fixed savings + installments savings + non-resident yen
deposits + foreign currency deposits,
o Certificates of deposit.
M3+CDs o M2+CDs,
o Deposits and CDs of Japan Post, Shinkumi Federation Bank, Credit Cooperatives, National
Federation of Labor Credit Associations, Labor Credit Associations, Credit Federations of
Agricultural Cooperatives, Agricultural Cooperatives, Credit Federations of Fishery
Cooperatives, and Fishery Cooperatives,
o Money in trust of domestically licensed banks (including foreign trust banks).
Source: http://www.boj.or.jp

15
M1 equals the currency in circulation and deposit money. Financial institutions surveyed for
M1 are the Bank of Japan, domestically licensed banks, foreign banks in Japan, Shinkin
Central Bank, Shinkin banks, Norinchukin Bank and Shoko Chukin Bank. M2 + CDs equals
M1 plus quasi-money plus certificates of deposits. Financial institutions surveyed for M2 +
CDs are the same as for M1. M3 + CDs equals M2 plus CDs plus deposits of post offices plus
other savings and deposits with financial institutions plus money trusts. Financial institutions
surveyed for M3+CDs are those surveyed for M2+CDs and Japan Post, credit cooperatives,
Shinkumi Federation Bank, Labour Credit Associations, National Federation of Labour Credit
Associations, agricultural cooperatives, credit federations of Agricultural Cooperatives,
fishery cooperatives, credit federations of Fishery Cooperatives and Trust Accounts of
domestically licensed banks.
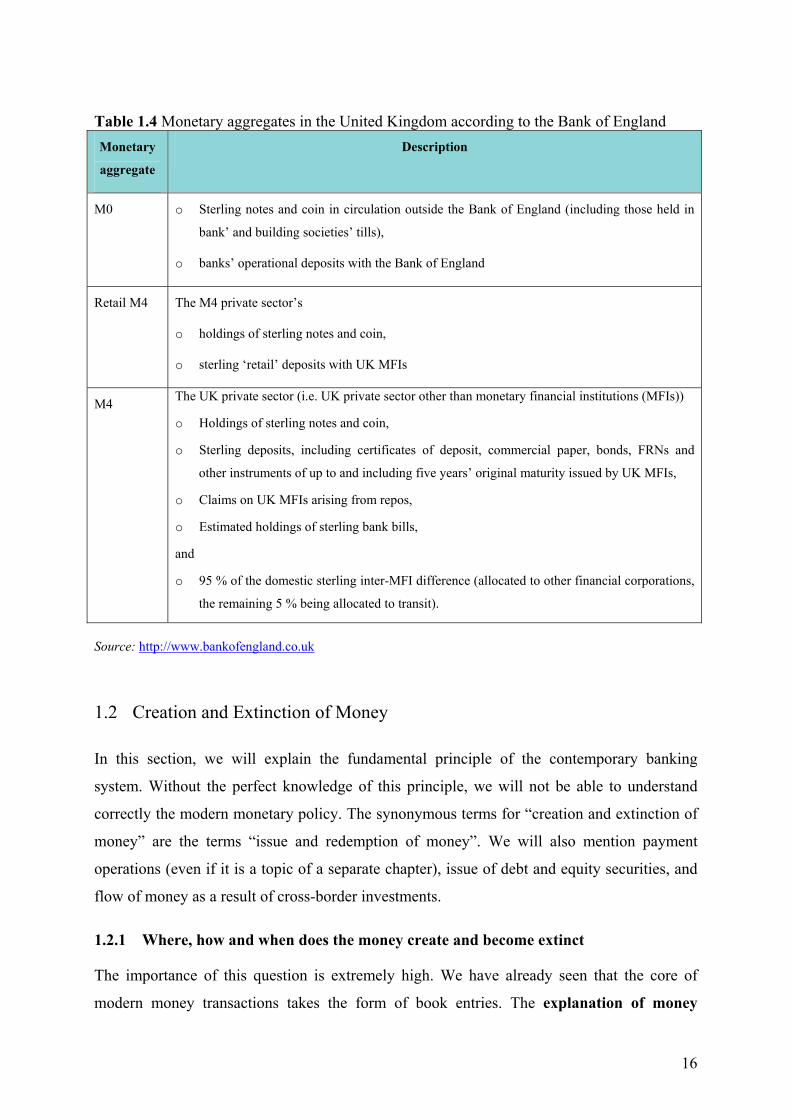
1.1.6 Monetary aggregates in the United Kingdom
The Bank of England has different monetary aggregates. It publishes its own monetary
aggregates M0 (narrow money), retail M4 (known also as M2) and M4 (broad money) and
also estimates of the European Monetary Union aggregates M1, M2 and M3 (table 1.4). The
origins of M0 date back to March 1981, when it was described as the monetary base. Banks’
operational deposits with the Bank of England have constituted a tiny component of M0.
Broad monetary aggregate M44 conforms to the concept of Monetary Financial Institutions
(MFIs) as defined in the European System of National and Regional Accounts 1995 (ESA95).
The UK MFI sector consists of banks (including the Bank of England) and building societies
operating in the UK. The third type of MFI – UK money market funds – also falls under the
ESA95 MFI definition, but is excluded from the UK definition on size grounds. The M4
private sector is sub-divided into “household sector”, “private non-financial corporations” and
“other financial corporations”. The definitions are based on ESA95. Sterling deposits are
broken down into retail and wholesale deposits. The latter includes liabilities arising under
repos (sale and repurchase agreements, which involve the temporary lending of securities by
the MFI in return for cash, where only the “cash leg” is entered on the MFIs balance sheet)
and short-term sterling instruments. The relation between the UK measure M4 and the euro-
area broad money M3 is quite complex.
4 Westley, Karen and Brunken, Stefan: Compilation Methods of the Components of Broad Money and its Balance Sheet Counterparts. Monetary and Financial Statistics (Bank of England), 2002, October, 6-16.
16
Table 1.4 Monetary aggregates in the United Kingdom according to the Bank of England Monetary
aggregate
Description
M0 o Sterling notes and coin in circulation outside the Bank of England (including those held in
bank’ and building societies’ tills),
o banks’ operational deposits with the Bank of England
Retail M4 The M4 private sector’s
o holdings of sterling notes and coin,
o sterling ‘retail’ deposits with UK MFIs
M4 The UK private sector (i.e. UK private sector other than monetary financial institutions (MFIs))
o Holdings of sterling notes and coin,
o Sterling deposits, including certificates of deposit, commercial paper, bonds, FRNs and
other instruments of up to and including five years’ original maturity issued by UK MFIs,
o Claims on UK MFIs arising from repos,
o Estimated holdings of sterling bank bills,
and
o 95 % of the domestic sterling inter-MFI difference (allocated to other financial corporations,
the remaining 5 % being allocated to transit).
Source: http://www.bankofengland.co.uk
1.2 Creation and Extinction of Money
In this section, we will explain the fundamental principle of the contemporary banking
system. Without the perfect knowledge of this principle, we will not be able to understand
correctly the modern monetary policy. The synonymous terms for “creation and extinction of
money” are the terms “issue and redemption of money”. We will also mention payment
operations (even if it is a topic of a separate chapter), issue of debt and equity securities, and
flow of money as a result of cross-border investments.
1.2.1 Where, how and when does the money create and become extinct
The importance of this question is extremely high. We have already seen that the core of
modern money transactions takes the form of book entries. The explanation of money

17
creation must start with accounting money and not with currency. In order to make the
understanding of money creation easier, let us suppose that all currency is deposited with
commercial banks and commercial banks have transferred this currency to their clearing
accounts with central bank. To put it another way, all payments take the form of transfers
between bank accounts. This is a realistic assumption since currently most of the money
transactions are settled through current accounts, i.e. without currency. The questions are:
where, how and when does the money create and become extinct?
First, let us answer the question “where does the creation and extinction of money take
place“? Money both originates and ends in commercial banks in the form of accounting
money. Only after creation of accounting money, it can be converted into currency. Money
originates only as accounting money.
Our second question is “how does the money originate and how does it become extinct“?
There is no production of goods and rendering of services needed for creation of money.
Money originates in commercial banks through:
o Loans granted by banks to non-bank entities,
o Interest paid on deposits and other liabilities of banks (e.g. debt securities) to non-bank
entities,
o Assets purchased (tangible and intangible assets, services, debt and equity securities,
gold etc.) by banks from non-bank entities,
o Wages and salaries paid to bank employees, management and statutory individuals,
o Dividends and royalties paid by banks.
These operations will be described in following subsections. As we will see, money does not
originate because of foreign investments if we consider consolidated money stock of both
countries. The majority of money originates by means of loans. The remaining four sources of
money creation are not generally considered to be substantial. Commercial banks thus
generate money from nothing. Central bank is trying to influence the loan activity of
commercial banks and in this way to control the quantity of money stock in some extent. It
does it through the regulation of interest rates and it cannot do anything else. Herein lies the
true alchemy of modern money.
Money becomes extinct in commercial banks through:
o Loans repaid (including interest) to banks by non-bank entities,

18
o Assets sold (tangible and intangible assets, services, debt and equity securities, gold
etc.) by banks to non-bank entities.
The majority of money becomes extinct by means of loans repayments. In the case of money
creation, we can observe growth of broad monetary aggregates (e.g. M2). In the opposite case,
these broad aggregates are reduced.
Money is always denominated in a certain currency (e.g. dollar, euro, yen, and pound) and the
same holds for newly created money. Commercial banks can create money denominated in
whatever currency. For instance, Any U.S. bank can issue loans denominated not only in
U.S. dollars but also in euros, yens, pounds etc. Commercial banks do not have to issue only
loans in domestic currency but also loans in currency of any other country. Similarly,
a commercial bank can use whatever currency for paying of interests, wages, salaries,
dividends and royalties, as well as for purchasing assets.
Not only commercial banks grant loans, purchase assets, and pay out wages, salaries,
dividends and royalties. Non-bank entities can perform all of these activities as well.
However, non-bank entities do not create money. Current definitions of money thus do not
contain all debt relationships. Non-bank entities can never spend more than the actual balance
of their bank accounts. On the contrary, commercial banks can provide loans, pay interests,
wages, salaries, dividends and royalties, and purchase assets virtually without any limit. In all
of these transactions, commercial banks credit accounts of its partners.
The creation and extinction of money takes place solely because of transaction between
commercial banks and its clients and not because of transactions between banks. If a bank
grants a loan to another bank and consequently charges interests on it, or if it purchases assets
from another bank, or pays dividends to another bank, there is no impact on the aggregate
stock of money, i.e. no additional money is created. Similarly, money does not cease to exist
when one bank repays loan or if it sells assets to another bank or pays dividends to another
bank. Similarly, money does not arise in any transaction between a commercial bank and the
central bank (e.g. when central bank buys the foreign currency from commercial bank).
Interbank transactions affect liquidity. This fact results from the current definition of money.
Furthermore, money is not created or extinct in the course of transaction (payment) between
clients of one commercial bank as well as in the course of transactions (payment) between
clients of two different commercial banks. The exception is when a transaction takes place
between a resident and a non-resident. Such transaction influences monetary aggregates. To

19
put it another way, money is created when the bank credits the account of its client in absence
of operation debiting other client’s account operated by the same bank (this would be
an example of the intra-bank transaction) or by any other bank (this would represent the
interbank transaction). Therefore, money is not generally created when one client receives
payment from another one.
The issue of money matches to the expansion of loans and not to the coinage or to the printing
of notes. The money is created because of every newly granted loan or every purchase of any
asset from bank client or every payment of interest, wage, salary, dividend or royalty by a
bank. In each of these cases, the overall balance of the current accounts rises, i.e. the stock of
money rises.
This reality corresponds to the commonly used accounting principles. The accounting of the
former mentioned operations differs substantially in case of banks and non-bank entities. In
the course of money creation operations (e.g. granting loans), the bank credits the account of
its client. In the course of the reverse operations, the bank debits the account of its client. In
banks, these operations result in entries in both asset and liabilities side of the balance sheet
i.e., newly granted loans increase both assets and liabilities at the same time. In the accounting
of non-bank entities, these operations affect only the structure of assets. This is the only (even
if considerable) difference between the accounting of banks and non-bank entities.
At this moment, we have only one question left. When does the creation and extinction of
money take place? Our answer is very simple. Money originates at the same time when the
bank adds a given amount of money (e.g. the amount of loan) to its client’s accounts.
Similarly, money becomes extinct at the moment when reverse operations take place.
Issue of money was never under the control of central bank. Central bank has never
possessed the issue monopoly. Central bank has solely the monopoly to issue the
currency for commercial banks in exchange for the liquidity of commercial banks (in
some countries, e.g. in the USA, the monopoly right to issue coins lies in the hands of the
Department of the Treasury). Central bank issues new money only as far as it operates as a
commercial bank (e.g. when central bank grants loans to non-bank entities).
Central bank has neither the quantity of currency nor the quantity of accounting money under
direct control. Even if the issue monopoly of currency is usually held by central bank,
central bank cannot influence the quantity of currency (including currency in
circulation). Central bank can influence the amount of accounting money through the

20
credit channel of monetary policy transmission mechanism by increasing or decreasing
interest rates.
If some commercial bank anticipates increasing withdrawals of currency by its clients, it
simply purchases currency from central bank in exchange for its liquidity with central bank.
Liquidity with central bank represents the balance of clearing accounts that commercial bank
holds with central bank. Hence, the quantity of currency can never be set by central bank, but
exclusively by the demand of clients of commercial banks. Because currency does not bear
interest, most agents minimize their holdings of currency. Agents prefer other financial or real
assets in exchange for currency because the income from holding other financial assets or real
assets as well as from production of goods and rendering of services is usually positive.
1.2.2 Loans granted by banks to non-bank entities
a) Principles of money creation by means of loans
We commence this section by reviewing the basic difference between accounting of banks
and non-bank entities. Let us start with Example 1.1 where a non-bank entity (let us call it A)
grants a loan to another non-bank entity (B). In this case, money is not created. The unit A
simply transforms one of its assets (sum on its current account of 1,000) to another asset
(loans granted of 1,000). The total assets of unit A did not change.
By contrary, when in Example 1.2 bank grants a loan to its client (non-banking entity) then
the bank’s total assets increase by the loaned amount. The bank creates both the completely
new asset (loans granted of 1,000) and the new liability (client’s current account of 1,000). In
other words, bank debits the account “loans granted” and credits the “current account”.
Creation of money by granting loans is in every case followed by the next step, when client
makes payment by:
o Transfer of money from its current account to the current account of other client of the
same bank or to current account of the other client of another bank through some
payment system or through correspondent banking, or
o Withdrawal of coins or banknotes from its current account with subsequent transfer of
coins or banknotes to some non-bank entity.
Without this payment there should be no reason for granting a loan.

21
Example 1.1 Non-bank entity A grants a loan to non-bank entity B
The fundamental difference between granting loans by non-bank entities and by banks
follows from the definition of money. Money originates in banks mainly as a result of their
loan activities. As we shall see later, this fundamental principle has many theoretical and
practical consequences. For loans create money (deposits), direction of this causality is
more than definite. At the same time when the non-bank entity receives the loan, it receives
the money on its current account. This is the moment when the non-bank entity can start using
newly created money. Every new loan by a bank to a non-bank entity represents the creation
of new money of the same amount. This simple fact was well described already by Knut
Wicksell in 18985 and Hartley Withers in 19096.
5 Wicksell, Knut: Interest and Prices. Kelley, New York 1898. 6 Withers, Hartley: The Meaning of Money. Smith and Elder, London 1909.
Non-bank entity A granting a loan
Original balance exceeding $1000
1) $1000
Current account with bank
1) $1000
Loans granted
Non-bank entity B accepting a loan
1) $1000
Current account with bank
1) $1000
Loans accepted
1) Non-bank entity A grants a loan of $1000 to non-bank entity B

22
Example 1.2 Bank grants a loan to its client (non-banking entity)
Every loan represents for the bank one accounting operation, namely the occurrence of claim
on the asset side against creation of money (on the client’s current account) on a liability side
of the bank’s balance sheet. Similarly, on the client’s balance sheet, new loan represents one
accounting operations, namely the money on the current account (claim on the bank) on the
asset side and the acceptance of loan on the liabilities side (payables to the bank).
There are many bank loans by many banks and subsequent payments in the banking system. If
some commercial bank expands more in loans than in deposits (i.e. it observes the outflow of
deposits to other banks), it must fill up the difference by accepting loans or deposits at the
interbank market. In such a case, there is, for sure, another commercial bank which is
expanding more in deposits than in loans (such a bank is attractive for depositors) and which
can grant loans or deposits to other banks.
The ability of commercial banks to create money is boundless, i.e. the resources of any bank
are unlimited. Loan expansion may never reach its end. Let’s see the current development of
monetary aggregates in the USA, eurozone, Japan, the United Kingdom etc. It is solely the
decision of the bank how much money it creates. Every newly granted loan increases both the
Bank granting a loan
1) $1000
Client’s current account
1) $1000
Loans granted
Client accepting a loan
1) $1000
Current account with bank
1) $1000
Loans accepted
1) The bank grants a loan of $1000 to its client

23
Bank
Newly granted credits
Existing credits granted
Equity
Existing deposits
New deposits
assets and liabilities in the amount of loan granted (Figure 1.2). The same amount is added to
assets and liabilities of non-bank entities.
Nevertheless, the loan expansion stops somewhere. Commercial banks grant loans primarily
to clients with the highest credit rating, e.g. the AAA rating. Subsequently, they grant loans to
clients with lower rating (AA) and so forth. Figure 1.3 shows that the loan expansion can stop,
for example at CCC. Naturally, the risk aversion of some banks might be stronger. Such
banks refuse to grant loans already to BB or B clients. On the contrary, some banks grant
loans even to CCC clients. It is only up to individual commercial bank to estimate correctly
whom it is ready to lend money. Only the bank decides which economic activity guarantees
high probability of repayment of the loan. We shall see later that central bank can influence
the loan activity of commercial banks by means of short-term interest rates regulation.
Commercial banks make loans in order to maximize their profits. If commercial banks were
granting loans only to their best clients, they wouldn’t reach the maximum profit possible.
Loans to the best clients yield low interest for such loans are granted for approximately
interbank interest rate. On the other hand, loans granted to less credible clients entail higher
credit risk and higher interest rate (exceeding interbank market interest rate). Higher interest
rates generate higher revenues. But at the same time, commercial banks granting risky loans
are forced to create higher amount of allowances, since there is a higher probability of
debtors’ default. Theory of loans assumes that interest income higher than interest income
corresponding to the interbank interest rate should be more or less balanced by
allowances. It is up to individual bank to evaluate properly individual client’s risks and
decide whether or not to grant a loan.
Figure 1.2 Creating newly granted loans and deposits (i.e. creation of money)

24
Figure 1.3 Bank granting loans to non-bank entities
In order to make the best loans possible (in terms of credit risk), banks compete for good
clients (borrowers). Business history of these clients must be transparent. Good clients would
be willing and able to repay their debts. However, there is a limited number of good clients
and an infinite number of bad clients. A bad client will not be either willing or able to repay
debts. Among bad clients, related parties (affiliated parties, connected parties) are considered
to represent the worst ones, hence the rule “never lend money to your friends.” Theoretically,
the amount of loans that banks can grant is unlimited. In practice, however, it is limited by
their credit risk aversion. Default of high-risky clients is highly probable. Loans to clients
with lower ratings are dangerous not only to individual banks but also to the banking system
as a whole. Bank regulation is trying to prevent banks from granting bad loans.
Evolution of the quantity of loans is cyclical, i.e. it follows the business cycle. During the
periods of booms and recoveries, loan specialists are more optimistic and grant, therefore,
more loans. The importance of credit risk management is suppressed. Conversely, during the
Bank
Loans granted to AAA clients (credits of the highest quality, credit risk = 0 %)
Deposits Loans granted to AA clients
Loans granted to A clients
Loans granted to BBB clients
Loans granted to BB clients
Loans granted to B clients
Loans granted to CCC clients
Loans granted to CC clients
Loans granted to C clients
Loans granted to D clients (loans of the lowest quality, credit risk = 100 %)
Limit on quality of loans granted

25
time of recession, banks must write-off the loans granted during the recovery. Recession is
also the time when banks grant less loans and the importance of credit risk management rises.
This rule holds regardless of the fact that loan specialists are paid both for quality and for
quantity of loans. The competitive environment forces them to increase their market share.
We have seen already that every newly granted loan constitutes for the bank and for the non-
bank entity a simultaneous increase of both assets and liabilities. To put it another way,
creation of asset and creation of liability represents for the bank and for the non-bank entity
two inseparable processes. From the point of view of the bank the amount granted is added to
client’s current account. Following payment from this account represents solely the reduction
of payer’s current account balance and increase of recipient’s current account balance.
Payments between current accounts do not change the aggregate money stock
(aggregate quantity of money), i.e. payments do not change the aggregate balance of
deposits. This holds for payments both through the clearing systems (clearinghouses) and
through the correspondence banking systems. Clearinghouses have evolved to meet
requirements of modern banking systems in order to facilitate payments. Clearing centres can
be organized and operated (but not necessarily) by central banks.
b) Primary and secondary allocation of money
At this moment we have all information to answer the question: “Why do banks exist?” Banks
decide whom they will grant loans (i.e. who will get the chance to start new business and who
will not). In order to maximize their profits, banks grant loans only to those entrepreneurs
who convince them that their plans are realistic and that they will be able to repay debts. This
will be the case of entrepreneurs who intend producing saleable products or services. The
ultimate decision about products and services to be produced will be taken by the market
anyway. By deciding whom to grant loans banks realize the primary money allocation to
entrepreneurs and households. Banks do exist to stimulate entrepreneurs and households.
Secondary allocation of money (i.e. the allocation of money created through primary
allocation) takes place on the money and capital markets, where entrepreneurs try to attract
investors possessing enough money in banks (created as a result of primary allocation of
money). Some investors provide this money (deposits) for a definite period of time (in the
form of debt securities like bonds, notes or bills) or for an indefinite period of time (in the
form of equity securities - shares). Investors expect entrepreneurs to produce goods and
services that they will get paid for. This will allow entrepreneurs to repay the principal plus

26
interests (or to pay dividends). Investors take these steps since they expect income exceeding
the risk-free interest (e.g. interest paid on government securities). This is also the case of
entrepreneurs who employ their own savings. Secondary allocation of money (i.e. the issue of
debt and equity securities) does not influence the money stock. Some countries (e.g. the
United States) heavily rely on secondary allocation of money through capital market.
The market-oriented economy thus creates a really ingenious system in which many agents
are concerned in decisions about funding production of goods and services. It follows the
natural human craving for wealth. Financial environment determines economic activity. This
is what differentiates market-oriented economy from the centrally planned one.
The analysis clearly demonstrates that banks are not financial intermediaries. Loans represent
the bilateral relation between the bank and its client and not trilateral relation in presence of
intermediary.
c) Impaired loans
There is one critical danger discouraging banks from granting whatever amount of loans. We
call this danger credit risk of the borrower. This is a risk of impairment (loss) caused by the
partner’s default, i.e. failure in meeting her obligation imposed by the contract. If the loan gets
impaired, the banks have to account loss from impairment (directly of through the allowance
account). Example (1.3) demonstrates the successive creation of allowances (of the amount of
$200 and $800) of a loan of $1,000. This loan was completely written off since the client did
not repay even a part of the principal. In this case the final loss of the bank equals the whole
amount of $1,000 (in fact, the loss is even higher because of accumulated interests).
If the loan is repaid, only the accumulated interest is recorded in the income statement (as
income), whereas in case of default, the whole sum of outstanding loan is recorded in the
income statement (as expense). If we compare these two amounts, we find it very different. It
is evident that the loss from impairment of loans can cause severe damages and perhaps even
bankruptcy of the bank (as long as the bank is not saved using money of taxpayers). If this
was a case of more banks in one country, we would be talking about a banking crisis.
Loan allowance equals the reduction of the value of the loan by reason of increased credit risk
of the borrower. This means that a loan cannot be depreciated by reason of changes in
zero-risk interest rates. Therefore, banks do not account for allowances for debt instruments
issued by state and central banks in OECD countries.

27
Example 1.3 Successive creation of loan allowances
As an example let us take the initial amount granted P0 that equals the sum of discounted cash
flows Ci using the yield to maturity (i.e. effective interest rate) 0r that equals zero-risk yield to
maturity b,0r plus the risk premium 0∆r associated with the given borrower:
( ) ( )01 10 ,0 01 1i i
n ni i
t ti i b
C CPr r r= =
= =+ + + ∆
∑ ∑
The increased risk of borrower’s default (within the length of contract) can be expressed using
two different methods.
The first one consists of the enhancement of risk premium from 0∆r to 1∆r preserving the
nominal value of cash flows Ci. Therefore, the amount of loss for impairment (allowance)
equals the difference between Pa and Pb:
Bank granting a loan
1) $1,000
Client’s current account
1) Bank grants a credit of $1,000 to its client 2) Bank creates the first allowance amounting to $200 3) Bank creates the second allowance amounting to $800 4) Bank writes the credit off
4) $1000 2) $200 3) $800
Allowances
2) $200 3) $800
Loss from impairment
1) $1,000 4) $1,000
Loans granted

28
( )∑= ∆++
−=−=n
it
b
iaba irr
CPPPallowance
1 10,1
where: Pa stands for the accounting value, i.e. the initial amount granted P0
increased by the accumulated interests (we suppose the method of
effective interest rate) and decreased by received repayments.
Pb stands for the sum of nominal cash flows Ci discounted using the
new risk yield to maturity 1r that equals zero-risk yield to maturity b,0r
plus the new (higher) risk premium 1∆r associated to given borrower.
The second method consists of the estimate of decline of future cash flows Ci preserving the
original risk premium 0∆r. Therefore, the amount of loss for impairment (allowance) equals
the difference between Pa and Pb:
( )∑= ∆++
−=−=n
it
b
iaba irr
estimateCPPPallowance
1 00,1
where: Pa stands for the accounting value, i.e. the initial amount granted P0
increased by the accumulated interests (we suppose the method of
effective interest rate) and decreased by received repayments.
Pb stands for the sum of discounted nominal cash flows Ci using the
original risk yield to maturity 0r (i.e. the effective interest rate) that
equals the original zero-risk yield to maturity b,0r plus the original risk
premium 0∆r associated to given borrower:
The use of both methods should result in the same amount of allowances.
Let us take the following example. Bank granted a loan of $1,000,000 with the annuity
amounting to $381,748. The one-year zero-risk interest rate equals b,0r0,1 = 3.50%, two-years
zero-risk interest rate equals b,0r0,2 = 3.82% and three-years zero-risk interest rate equals b,0r0,3
= 4.11%. The yield to maturity of a loan (i.e. the effective interest rate) equals 0r = 7.10%,
since:
( ) ( )2 3$381,748 $381,748 $381,748$1,000,000
1 1 1r r r= + +
+ + +
whence br = 7.10%

29
If the loan with the same annuity amounting to $381,748 were granted to a zero-risk entity,
the amount of loan granted would be $1,061,309, since:
( ) ( )2 3$381,748 $381,748 $381,748 $1,061,3091 0.0350 1 0.0382 1 0.0411
+ + =+ + +
The zero-risk yield to maturity (the so-called zero-risk effective interest rate) b,0r would thus
equal 3.90%, since:
( ) ( )2 3$381,748 $381,748 $381,748$1,061,309
1 1 1b b br r r
= + ++ + +
whence br = 3.90%
This means that the original risk premium 0∆r of the given borrower equals 3.20% (= 7.10% -
3.90%).
Alternatively, we can calculate the original risk premium 0∆r of the given borrower in the
following way:
0 0 0
$381,748 $381,748 $381,748$1,000,0001 0.0350 1 0.0382 1 0.0411r r r
= + ++ + ∆ + + ∆ + + ∆
whence 0∆r = 3.20%
Let the one-year zero-risk interest rate after one year equal b,1r0,1 = 4.50% and two-years
zero-risk interest rate equal b,0r0,2 = 4.82%. The current risk premium of the given borrower
exceeds the original one and equals 1∆r = 5.2% (e.g. the borrower’s financial situation has
worsen). Under the effective interest rate method, the accumulated amount of loan (i.e. the
value recorded in the accounting of both entities) after one year (right after the first
repayment) equals $689,252, since:
( )2$381,748 $381,748 $689,2521 0.0710 1 0.0710
+ =+ +
The value of loan, considering the higher risk premium and original zero-risk yield to
maturity, equals $670,627, since:

30
( )2$381,748 $381,748 $670,627
1 0.0390 0.0520 1 0.0390 0.0520+ =
+ + + +
Using the first method the allowance equals $18,625 (i.e. 2.7% of the accumulated value),
since:
allowances = $689,252 – $670,627 = $18,625
For the sake of completeness, let us observe that the fair value of loan equals $663,372, since:
( )2
$381,748 $381,748 $663,3721 0.0450 0.0520 1 0.0482 0.0520
+ =+ + + +
It is necessary to highlight that loan allowance can not be assessed as the difference
between the accounting value and fair value of the loan, but the difference between the
accounting value and discounted value of cash flows calculated using the new risk yield
to maturity, which equals the original zero-risk yield to maturity plus the increased risk
premium associated to a given borrower.
Alternatively, allowances can be assessed using the estimated cash flows. In such a case, cash
flows are discounted by means of the original risk yield to maturity. For example, we can
estimate the reduction of first repayment from the nominal value of $381,748 to $380,000 (i.e.
the decrease by 0.5%) and reduction of second repayment from the nominal value of
$381,748 to $362,257 (i.e. the decrease by 5.1%). The value of loan hence equals $670,627,
since:
( )2$380,000 $380,000 $670,6271 0.0710 1 0.0710
+ =+ +
Using the second method allowance equals $18,625.
The first method of assessing allowances is based on the estimate of the premium ∆r and the
second method is based on the estimate of future cash flows. However, both of these values
are hard to estimate. Therefore, regulators usually impose the allowances computed as a given
percentage of the unsecured value of the loan. This amount of allowances depends on several
factors such as default in payments, financial situation of the borrower and others. Bank
regulation in individual countries sets usually more concrete rules than those mentioned
above.

31
d) Corporate loans
The nature of loan contract implies that bank cannot control activities of an entity to which it
has lent money. Entrepreneur thus has to:
o Convince the bank of her project’s profitability and ability to run her business in a way
capable of repaying the loan,
o Be ready to share costs of a potential business failure,
o Provide adequate security.
Hardly any corporate loan fits the conditions for bank financing. The quality of the most of
proposed projects is not high enough and financing of such projects would pose, therefore,
high-risks to the bank. Many of those who apply for loans are hardly indebted or
characterized by low equity and insufficient labour productivity. Hence, the profitability of
these entities would be too low to ensure smooth and full repayments. Usually, opinions on
the quality of proposed project differ substantially from the bank and from the entrepreneur’s
point of view. Entrepreneurs usually believe that it is enough to have a:
o Splendid business idea,
o Excellent technology or industrial capacity to carry out the project,
o Not binding confirmations of potential processor of delivered goods and services,
o Estimates of future development based on unreasonably optimistic numbers.
Applicants for a loan usually highlight benefits that the project would represent to regional
employment. The project is usually designed the way that even small changes of input prices
or demand would cause severe losses and thus inability to repay loans. Such projects do not fit
standards of prudent financing.
Conversely, banks must require reasonable demand, measures against unpredictable decreases
in demand and changes of input prices, sound history of both company and its management,
documented competence of managers, market research, and so forth. Success of corporate
operations depends primarily on abilities of its management. The project financing represents
one of special kinds of corporate loans, whose repayments come only from returns of the
established capacity.
In order to lower or transfer credit risk, banks often use credit risk mitigation instruments.
They require guarantees or collateral (financial collateral, real estate etc.) or use credit

32
derivatives. However, such instruments create new risks, such as legal risk. The key feature of
any instrument is its legal enforceability in any relevant legal system.
e) Household loans
Banks do not grant loans solely to entrepreneurs but also to households. Products are ranging
from consumer loans to mortgage loans, credit cards, and overdrafts.
Consumer loan is intended for households who can use it to purchase consumer goods. Non-
banking entities can offer it as well.
Mortgage loan represents the loan granted for the purpose of real estate investment.
Repayment of such a loan must be secured by the mortgage right over this (even if still under
construction) or another real estate. There are residential and commercial mortgage loans.
Credit card is the payment card indicating that its holder is allowed to draw a loan. Holder of
credit card can purchase goods and services or draw money up to a certain predefined limit
(credit line). Such a loan can be repaid partly or fully before the end of interest-free period,
which is usually shorter than 30 days. Interest rates, yearly fees, and terms of maturity differ
substantially among issuers. The major disadvantage of credit card is the high interest charged
on the amount of a loan drawn. The credit line is frequently related to the month salary and to
results of credit scoring.
The main advantage of the bank credit card lies in the interest-free period, usually lasting
from 30 to 45 days and starting at the date of purchase. During the interest-free period
borrower can repay his debt without any additional interest. Such an option thus represents to
credit card holder the advantageous access to a free short-term loan. The interest-free period
applies only to payments and not to ATM withdrawals. Interest on withdrawal is charged
immediately. Credit cards are also usually connected to one of international payment systems
(e.g. Visa or MasterCard).
Non-banking entities, whose activities consist of the instalment sales, issue the purchasing
credit cards. The number of such cards exceeds substantially the number of cards issued by
banks. This happens for two following reasons. First, the issuance of these cards is free of
charge. Second, the application process is much shorter than in case of bank credit cards
(tenths of minutes directly in the store in comparison to several days in a bank). Cards are
provided also to clients who are supposed to make one larger purchase only. However, once
she possesses it, she uses it occasionally even for smaller purchases.

33
The basic difference between bank and purchasing credit cards consists in the interest-free
period. While bank credit cards usually provide it, purchasing credit cards do not. This means
that holder of purchasing card usually cannot avoid interests. Purchasing credit cards systems
also do not usually make part of international payment systems i.e., they form only local
systems. Clients do not have to provide their banking history, which would be rather the case
of credit cards issued by banks. The only sufficient condition is to submit the proof of
identification.
The massive increase of consumer loans occurs worldwide. Banks evaluate their clients
using diverse systems of credit scoring. These systems are continuously recalibrated based on
the new loan observations. A process of granting loans to households is based on a complex
survey of number of parameters. This holds practically for any kind of loans, i.e. also for
loans that can be granted immediately.
Banks compete to attract more households. However, the massive rise of these loans can
represent serious dangers. It can harm banks especially in a moment when the economy
growth starts to slow down. At first, banks do not take these risks seriously. As long as
households receive regular incomes, they are capable of repaying their debts. However, as
soon as the economy slows down and people start loosing their jobs, banks start to face
serious problems since the business cycle affects primarily households and their incomes.
f) Finance lease
Corporate and household loans can be granted also in the form of a lease. Banks usually do
not grant these loans directly but through their subsidiaries (controlled and financed by
banks). International Financial Reporting Standards (IFRS) define lease as an agreement
whereby the lessor conveys to the lessee in return for a payment or series of payments the
right to use an asset for an agreed period of time. There are two basic kinds of a lease, namely
the financial lease and operating lease. Finance (capital) lease is a lease that transfers
substantially all the risks and rewards incidental to ownership of an asset. Title may or may
not eventually be transferred. All other kinds of a lease represent the operating lease.
Classification of a lease does not depend on the legal form of a contract.
According to Generally Accepted Accounting Principles of the United States (US GAAP),
lease shall be considered as finance lease if it meets at least one of the following four criteria:
o The lease transfers ownership of the property to the lessee by the end of the lease term,

34
o The lease contains a bargain purchase option,
o The lease term is equal to 75 % or more of the estimated economic life of the leased
property,
o The present value of at the beginning of the lease term of the minimum lease payments
equals or exceeds 90 % of the excess of the fair value of the leased property to the
lessor at the inception of the lease.
Economically, the finance lease is considered to represent a loan granted by lessor to
lessee, and the item rented as collateral. From the point of view of the lessee the leased
asset is recorded on the asset side correspondingly to liabilities in an amount of future
payments to the lessor.
In the case of operating lease the lessor books received payments uniformly as revenues and
the lessee books provided payments uniformly as expenses. Sale and leaseback stands for the
sale of an asset and the leasing back of the same asset. The lease payment and the sale price
are usually interdependent because they are negotiated as a package.
g) Legal environment
Legal environment represents one of the key features determining the loan granting process.
Banks can grant loans more easily in countries where the legal system provides good
protection of creditors. On the contrary, if the legal environment allows obligors avoiding
successfully fulfillment of their obligations, banks will be granting loans much more
carefully.
h) External credit rating
Corporate credit risk rating represents a very complicated process. Professional investors
seek, therefore, to find the way to simplify it. In contrast to Europe, the United States rely
substantially on the financing through capital market. That is the reason for the expansion of
specialized companies offering the external credit rating services of individual debt
instruments, companies, and countries. Among the most popular rating agencies belong
Standard & Poor’s, Moody’s, FitchIBCA, Duff & Phelps, and Thomson Financial
BankWatch.
Credit rating assesses the probability that the debt will not be repaid or the probability of the
default of some debt, company or country. But rating agencies do not use probability of

35
default but rather some systems of symbols. It would seem politically thorny if S&P have
announced, for instance, “The probability of country X’s bankruptcy within the next five
years equals 3.88%“. Probability of default varies depending on actual world economic
conditions, political changes, and so forth. The interpretation of a downgraded rating is very
easy: Rating agency concluded that the probability of insolvency of a given debt, company or
country has increased.
Agencies evaluate some debt issues, companies, government agencies, local governments
and central governments (countries). Financial experts and commentators often use ratings
as descriptors of the creditworthiness of debt issuers rather than descriptors of the quality of
the debt instruments themselves. This is reasonable because it is rare for two different debt
instruments issued by the same company to have different ratings. Indeed, when rating
agencies announce ratings they often refer to companies, not individual bond issues.
Corporate rating is based on company’s size, relative value of debt to finance business
activity, and profits to repay debts. Rating agencies consider also other features of rather
qualitative substance. Rating agencies weight individual indicators differently. For example,
Moody’s accentuates the issuer’s overall debt burden and cash flows, while Standard &
Poor’s concentrates on issuer’s business environment. Such differences result in different
ratings. In the United States, rating agencies currently evaluate approximately eight thousands
of non-bank institutions (among which about five hundreds obtained rating equal or better
than AA–), while in Europe agencies evaluate only six hundreds institutions (among which
about eighty obtained rating equal or better than AA–). Long-term rating accentuate
profitability and business sector and short-term ratings emphasize solvency.
To evaluate debts rating agencies consider the type of security, seniority in case of default,
and limits for further debts. Debt rating is related to a particular debt and not solely to an
issuing company. One company can, therefore, issue several debts of different ratings. This
allows company to raise funds for riskier projects. Its original rating will be restored after
repaying it. What matters is the correct interpretation of a given rating. Credit rating does not
reflect market prices, expected revenues, or investor’s risk preferences. It evaluates solely the
default risk of a given debt. Ratings of debt instruments do not represent recommendation to
buy or sell securities. Leading agencies evaluate securities by type of issuer and by political
stability. Ratings from renowned agencies are usually very expensive. However, institutional
investors concerned in including high rated securities in their portfolios require it. Nowadays,
credit ratings represent necessary condition to attract key investors.

36
Standard & Poor’s (S&P) evaluates certain debts, companies, government agencies, local
governments, and countries based on current borrower’s credibility (including guarantees and
insurance). It assesses risk of default that might occur at any time from now until the date of
maturity. It takes into account probabilities of all future events. S&P’s ratings are based on:
o Probability of default (regarding borrower’s capacity and willingness to repay both
principal and interest in a full amount and in time),
o Essentials of the debt instrument,
o Legal and contractual protection of creditor including her relative position in case of
borrower’s bankruptcy. This protection follows from the local bankruptcy law and
from other legal regulations.
To indicate the probability of default, S&P uses rating of the borrower’s senior debt. If there
is no such debt, S&P derives the rating implicitly. Subordinated debts usually obtain lower
ratings than senior debts. This practice reflects the relatively better enforceability of senior
debts in case of bankruptcy. If one company issues sizable amount of secured debts, its
unsecured debts are rated in a similar way to rating of subordinated debts.
In the case of S&P’ the best rating is AAA. Financial instruments with this rating are
considered to have almost no chance of defaulting in the near future. The next best rating is
AA. After that come A, BBB, BB, B and CCC. The Moody’s ratings corresponding to S&P’
AAA, AA, A, BBB, BB, B, and CCC are Aaa, Aa, A, Baa, Ba, B, and Caa respectively. To
create finer rating categories S&P’ divides its AA category into AA+, AA, and AA–; it
divides its A category into A+, A, and A–; etc. Similarly Moody’s divides its Aa category into
Aa1, Aa2, and Aa3; it divides A into A1, A2, and A3; and so on. Only the S&P AAA and
Moody's Aaa categories are not subdivided.
Rating categories from AAA to BBB- (S&P) and from Aaa to Baa3 (Moody’s) are referred to
as speculative grades. Originally rating agencies were using this term only to indicate bonds
suitable for investment of banks and insurance companies. Ratings below BBB- (S&P) and
below Baa3 (Moody’s) are considered to represent speculative grades. These debts can often
have quality collateral. However, uncertainties (about what can happen in case of exposition
to negative conditions) far outweigh any collateral.
If the real or implicit rating of senior debt equals AAA, subordinated and junior debts are
rated AAA or AA+. If the real or implicit rating of senior debt is lower than AAA but higher
than BB+, subordinated and junior debts are rated one grade lower. If, for example, rating of

37
senior debt equals A, subordinate debt is usually rated A–. If the real or implicit rating of
senior debt is equal or lower than BB+, subordinated and junior debts are rated two grades
lower. The commonly used term “junk bonds” corresponds approximately to speculative
grades. Regulators use credit ratings too. Fed, for instance, enables its twelve regional Federal
Reserve banks to invest only in securities of first four investment grades. U.S. pension funds
can invest only in commercial papers of the first three categories.
S&P evaluates short-term debts (debts with original maturity of up to 365 days - including
commercial papers) by estimating probability of proper repayment. Short-term ratings consist
of categories from A–1 to D.
Credit rating is usually well correlated to credit spread and to the cumulative default rates
(CDRs). According to the study of Huang, M. and Huang J.7 credit spread between U.S. Aaa
corporate debt and U.S. government bond (both with maturity 4 years) was 0.55%. The credit
spread of Aa debt was 0.65% (credit spread of A was 0.96%, credit spread of Baa was 1.18%,
credit spread of Ba was 3.20% and finally the credit spread of B was 4.70%). Corresponding
four-years cumulative default probabilities were 0.04, 0.23, 0.35, 1.24, 8.51 and 23.32 %
respectively (calculated credit spreads were substantially lower). Similarly, according to the
document of International Convergence of Capital Measurement and Capital Standards
published in June 2004 by Basel Committee on Banking Supervision the three-years
cumulative default probability (based on the twenty-years-long data series) of AAA and AA
debts equals 0.10% (in case of A debts it equals 0.24%, in case of BBB debts it equals 1.00%,
in case of BB debts it equals 7.50% and finally in case of B debts it equals 20.00%).
Country rating does not represent evaluation of economic growth or prosperity. N
September 2004, rating (A–) was given by S&P to countries like Czech Republic, Estonia,
Hungary, Israel, Latvia, Lithuania, Malaysia, Soth Korea and Poland, China and Slovakia
were rated one grade lower. Developed countries like EU members and United States usually
obtain the highest rating AAA. Italy and Japan had lower ratings (AA–), because of their
problems with public finances.
In April 2002, Japan was downgraded into AA– category. This decision raised many
objections. Japanese treasury department laid a formal protest (which, however, didn’t cause
any positive reaction). Rating agencies are independent private companies seeking to achieve
maximum independency. Without such independency rating agencies would soon loose their 7 Huang, Jing-Zhi, and Huang, Ming,: How Much of Corporate-Treasury Yield Spread Is Due to Credit Risk? In: 14th Annual Conference on Financial Economics and Accounting (FEA), Texas Finance Festival. 2003.

38
high credibility and therefore much of current revenues. High ratings do not stand only for
high reputation. Ratings are primarily about money. If, for example, downgraded country
ratings caused falling bond prices, government would be forced to pay higher interests on its
debts. Junk bonds usually represent undesirable items to be removed from big investor’s
portfolios. Downgraded rating thus represents a very bad sign to government finance.
Government’s reaction should be fast and effective. Countries are afraid of downgraded
ratings especially in times of economic slow down.
Downgraded rating indicates the increased risk of bankruptcy. It should not be
underestimated, even though agencies work always perfectly and their warnings can
sometimes come too late. As an example, take their late reaction to economic crisis that
occurred in 1997 in South-eastern Asia. In case of Russian insolvency in 1998 agencies made
several mistakes as well – they overestimated potential of international financial support.
However, in case of Argentina, rating agencies worked substantially better. S&P downgraded
Argentina from investment to speculative grade (BB) as late as in November 2000.
Government still had enough time to take variety of efficient steps. Unfortunately, the only
thing Argentinean government did was the increase of taxes. It expected naively to balance
thereby its budget. Contrariwise, tax revenues have started to fall rapidly and Argentinean
ratings were soon downgraded from BB to B+, B, B-, CCC+, CC and finally to SD, which
stands for partial insolvency. Crisis in Argentina represents a real state bankruptcy whose
consequences did serious harms to the major part of local society. In the case of Enron
(bankrupted in 2001) the downgrading of rating came too late. Agencies were not reacting to
adequate information and downgraded Enron to speculative degree long after its credit
position really worsened – even if they knew about these problems. According to Partnoy8
agencies caused thereby serious losses to many investors who were relying on them.
8 Partnoy, Frank: A Revisionist View of Enron and the Sudden Death of 'May', Villanova Law Review, 2003, 48(4), 1245-1280. According to Partnoy: “The rating agencies received information during this period indicating that Enron was engaging in substantial derivatives and off-balance sheet transactions, including both non-public information and information disclosed in Enron’s annual reports. But they maintained an investment grade rating based in part on the assumption that Enron’s off-balance sheet transactions were appropriately excluded from Enron’s debt and should not matter in calculating related financial ratios because they were non-recourse to Enron.20 In reality, Enron’s derivatives converted its off-balance sheet debt into billions of dollars of recourse debt, depending—among other things—on Enron’s stock price. If Enron’s credit rating had reflected the company’s actual debt levels during this period (i.e., had been sub-investment grade), its cost of capital would have been much higher, and its equity valuations would have been much lower.”

39
i) Internal credit rating
In a majority of loan contracts, institutions (especially banks) need to rely on their own
internal ratings. In banks, responsibility for internal ratings lies in the hands of credit officers.
These workers try to identify all relevant criteria on borrower’s credibility. However, there are
no standard criteria generally applicable to all clients. Individual criteria are weighted, but the
form of weights assigned cannot be easily standardized. At the end of credit rating process,
institution adds up the weighted criteria in order to get one single index number. Although
this technique looks easily understandable and readily applicable, it is characterized by
considerable subjective evaluation of loan officers. Their decisions are unique and
unrepeatable by other persons.
In case of companies, loan officers evaluate for example the industry characteristics, company
characteristics, management, historical earnings, financial conditions, planning, and
prospects. Each characteristic has its own risk-weight. They can also use the international
scoring sheet designed for loans granted to client from foreign countries. In this case, ratings
are based particularly on classification of projects alone for such clients do not usually have
any explicit history. Officers should also consider sovereign risk and currency risk i.e.,
borrower’s capacity to repay debts denominated in a given currency.
Credit scoring is used to rate and monitor individuals before and after the consumer loan is
granted. It usually consists in static analysis of current and past clients. The process of credit
scoring is analogous to the internal credit ratings of companies. First, institution sets relevant
criteria and consequently it weights them. Among the main criteria belong age, sex, marital
status, number of children, length of current employment and the length of current contract.
One can observe that credit institutions usually ascribe higher credibility to women.
Consequently, loan officers add up all weighted criteria and get one single index number.
Scoring and weighting of individual criteria depends on the concrete market segment e.g.,
diverse credit instruments (credit cards, consumer loans and so forth), regions, maturities and
amounts of loans.
j) Information about the borrower’s financial conditions
Information about the borrower’s financial standing represents the core of decision-making
process about whether or not to grant a loan. If this information were distorted, institution
could face serious troubles. Accounting statements should notify their users (investors,
lenders, regulators and public) about the financial standing of the given entity. Nevertheless,

40
accounts do not usually provide all information necessary for good decisions of its users since
these accounts concentrate primarily on the past and usually do not provide non-financial
information.
The existing Generally Accepted Accounting Principle of the United States (US GAAP) and
International Financial Reporting Standards (IFRS) hold equally for all entities regardless
their size. Any operation has the same risks and the same benefits in any entity. There is a
strong effort put to unify U.S. GAAP and IAS.
Accounting thus represents burden that entities must suffer. Authorities should, therefore,
implement such accounting that would not hit them too hard. To put it another way,
accounting should be transparent, not too costly, and endowed with clear rules. Everybody
will, therefore, easily orientate in financial statements and the costs of bookkeeping and audit
would not amount too high. Such accounting also supports competitiveness of companies in a
worldwide scale.
Auditors should evaluate and approve final accounts. Managers generally prefer rather
benevolent auditors. In the United States, however, popularity of “nice” auditors resulted in
several significant business collapses, such as Enron and WorldCom bankruptcies in 2002. In
Europe, this was the case of Vivendi, Ahold, or Parmalat.
1.2.3 Interest paid on deposits and other liabilities of banks to non-bank entities
Interest rates that commercial banks charge on clients’ loans and other claims (on the asset
side of the balance sheet) usually exceed interest rates on interbank money market (e.g.
LIBOR, EURIBOR). The more clients are credible, the less the interest rate exceeds interbank
money market. Banking competition represents the factor determining this excess. On the
other hand, the interest rates paid on clients’ deposit accounts balances and other liabilities
(e.g. on the issued debt securities) never exceed the interbank interest rate. The difference
between the average interest rate on loans and deposits represents the so-called credit spread
(assuming equal maturities of loans, deposits and interbank deposits). Credit spread generates
decisive part of the bank’s profit.
Example 1.4 takes up where the Example 1.2 left off. Let us suppose that the interbank
interest rate equals 6%, interest rate paid on deposits equals 4%, and the interest rate charged
on loans equals 8%. Commercial bank granted loan of $1,000. It follows that the yearly
interest profit generated by this loan equals $40 (= 80 – 40). This profit matches precisely the

41
client’s interest loss of $40. This example shows that interests paid on deposits represent
another way of money creation, i.e. interests paid by banks on deposits represent new money.
Another question arises as how would be the interbank interest rate set if there were no central
bank regulating it. However, this is not the case. There is no such country in which central
bank would not regulate interbank interest rates (LIBOR, EURIBOR and so forth).
Commercial banks thence derive interest rates for charging and paying interests on loans and
deposits.
In the Islamic banking system explicit interests do not exist at all. According to the Islamic
customary law saria, usury prohibition represents the main as well as the most strictly
enforced rule. Under such rules, Islamic banks can charge neither interests nor any other fees
on loans granted. Local banks thus secure their profits by means of preliminary contracts
under the terms of which they participate on borrower’s future profits. Borrower commits
himself to transfer to bank part of potential profit from the project funded.
Islamic financial market recently became very attractive to many western banks since it
embodies relatively high growth rates. According to the Forbes magazine, Muslims represent
about one fifth of the world richest people. On the other hand, this fact does not correspond to
the amount of money deposited in Islamic banks. Estimates show that the total amount of
money deposited in Islamic banks does not exceed $200 billions. Muslims still deposit their
money mostly in foreign banks.
In order to increase credibility and transparency of the Arab financial system, Islamic
countries have established in 2002 a new collective regulating body called Islamic financial
services board (IFSB). It will supervise Islamic banks and control if they obey rules of saria.
Eight Moslem countries agreed on its establishment, namely Bahrain, Indonesia, Iran, Kuwait,
Malaysia, Pakistan, Saudi Arabia and Sudan. IFSB is also expected to set stricter rules on a
bank bookkeeping in order to make financial cash flows more transparent. The amount of
money, that flows through Islamic banks, growths every year by more than 15%. We can thus
expect that rich Muslims will slowly transfer their money from foreign banks.

42
Example 1.4 Bank creates money by paying interest from deposit
1.2.4 Assets purchased by banks from non-bank entities
Although the most part of money originates in banks by means of granting loans, money also
originates when the bank purchases assets (tangible and intangible assets, services, debt and
equity securities, gold etc.) from non-bank entities. Suppose further that the bank is buying
three kinds of assets, namely debt securities, equity securities, and other assets (tangible and
intangible assets, services, gold etc.).
Bank granting loan
1) $1,000 2) $40
Client’s current account
1) Bank grants loan of $1,000 to its client 2) Bank pays yearly interest (from deposit) of $40 on client’s current account (interest rate 4 %) 3) Bank charges yearly interest (on loan) of $80 on loan account (interest rate 8 %)
1) $1,000 3) $80
Loans granted
3) $80
Interest income
Client accepting loan
1) $1,000 3) $80
Loans accepted
1) $1,000 2) $40
Current account
2) $40
Interest income
2) $40
Interest expense
3) $80
Interest expense

43
Example 1.5 Bank creates money by buying debt securities from its client
Purchase of debt securities (bills, notes, bond, bills of exchange) issued by non-bank entity
does not differ economically from granting loan by bank to non-bank entity. The difference
between loans and debt securities results from legal forms of these operations and from the
fact that securities are generally much more marketable than loans. In an Example 1.5, the
bank purchases debt securities directly from issuer (i.e. on the primary market) for $1,000
which is added to issuer’s current account. The economic result of this operation is the same
as in the case of loan granted. In both cases, bank increases its claim against client’s current
account and client increases current account against its liabilities by $1,000. The balance sheet
amount of both bank and client has increased by the same amount.
Bank buying debt securities
1) $1,000
Client’s current account
1) $1,000
Debt securities bought
Client issuing debt securities
1) $1,000
Debt securities issued
1) $1,000
Current account
1) Bank purchases debt securities from its client for $1,000

44
Example 1.6 Bank creates money by buying equity securities from its client
Let us suppose further that the bank purchases equity securities (shares) issued by non-bank
entity. Example 1.6 shows that to carry out this operation, bank credits issuer’s current
account by $1,000. The balance sheet of both bank and client has increased by the same
amount. Economically, the purchase of equity securities differs from purchase of debt
securities. The operation does not increase claims of the bank but its share in client’s assets
(reduced by all other client’s liabilities).
Next, there is an Example 1.7 of bank buying other assets (real estate) from its client. To pay
for this real estate, the bank credits seller’s (client’s) current account by $1,000. Client
replaces one of its assets (real estate) by another asset (cash on current account). The overall
balance of commercial bank has increased by $1,000 and the overall balance of client has
remained unchanged.
Bank buying equity securities
1) $1,000
Client’s current accounts
1) $1,000
Equity securities bought
Client issuing equity securities
1) $1,000
Equity securities issued (equity)
1) $1,000
Current account
1) Bank purchases equity securities from its client for $1,000

45
Example 1.7 Bank creates money by buying real estate from its client
Finally, the bank purchases services from its client (Example 1.8). To pay for these services,
the bank credits provider’s current account. By contrast to preceding examples, however,
bank records this payment as expenses into the income statement. Similarly, client records
this payment as income in her income statement.
Bank buying real estate
Client selling real estate
1) Bank purchases real estate from its client for $1,000
1) $1,000
Real estate
1) $1,000
Current account
1) $1,000
Real estate
1) $1,000
Client’s current account

46
Example 1.8 Bank creates money by purchasing services from its client
1.2.5 Payments of wages and salaries to bank employees, management and statutory
individuals
Money is also created when bank pays wages and salaries to its employees, management and
statutory individuals (Example 1.9). This way is equivalent to purchases of services from
clients.
Bank purchasing service
Client providing service
1) Bank purchases services from its client for $1,000
1) $1,000
Current account
1) $1,000
Income - services
1) $1,000
Expenses - services
1) $1,000
Client’s current account

47
Example 1.9 Bank creates money by paying wages and salaries to its employees
1.2.6 Payments of dividends and royalties
In this subsection we will describe creation of money by means of dividend and royalty
payments to the bank’s non-banking shareholders and management (paying dividends to its
banking shareholders bank does not represent creation of money – it changes interbank
liquidity). This way is also similar to the purchase of services. However, in this case the bank
debits its retained profits i.e., dividend and royalty payments affect the structure of balance
sheet and not the income statement.
Bank paying wages and salaries
Employee providing work
1) Bank pays wages and salaries to its employees of $1,000
1) $1,000
Current account
1) $1,000
Income - employment
1) $1,000
Expenses - labour
1) $1,000
Client’s current account

48
Example 1.10 Bank creates money by paying dividends and royalties to its non-bank shareholders and management
1.2.7 Extinction of money
As we have already mentioned above, money is extinct as a result reverse processes to the
money creation in banks and other similar institutions when:
o Non-bank entity repays to the bank loan including interest (Example 1.11 which
follows Example 1.4) or non-bank entity pays to the bank any fee,
o Bank sales assets (tangible and intangible assets, services, debt and equity securities,
gold etc.) to non-bank entities (Example 1.12 and 1.13).
Bank paying dividends and royalties
Shareholders or management
1) Bank pays dividends and directors’ fees of $1,000
1) $1,000
Current account
1) $1,000
Income - dividends
1) $1,000
Retained profits
1) $1,000
Client’s current account

49
Example 1.11 Money become extinct by repayment of loan including interest to bank
Bank granting loan
4) $1,080 opening balance 1) $1,000 2) $40
Client’s current account
1) Bank grants loan of $1,000 to its client2) Bank pays yearly interest (from deposit) of $40 on client’s current account (interest rate 4 %) 3) Bank charges yearly interest (on loan) of $80 on loan account (interest rate 8 %) 4) Client repays both loan ($1,000) and corresponding interest ($80)
1) $1,000 3) $80
4) $1,080
Loans granted
3) $80
Interest income
Client accepting loan
4) $1,080 1) $1,000 3) $80
Loans accepted
opening balance 1) $1,000 2) $40
4) $1,080
Current account
2) $40
Interest income
2) $40
Interest expense
3) $80
Interest expense

50
Bank
Extinct loans
Loans granted
Equity
Deposits
Extinct deposits
Figure 1.4 Extinction of loans and deposits
Repayment of a loan consists (like in the case of granting a loan in Example 1.4) in a double-
entry, i.e. on the asset side (claims) and liability side (payables) of the bank’s and client’s
balance sheets. According to Example 1.11, loan repayment results in simultaneous decrease
of both assets and liabilities of the bank, i.e. bank credits the account “loans granted” and
debits client’s current account by $1,080. Similarly, the same operation represents
simultaneous decrease on both assets (deposits, i.e. extinction of claims on bank) and
liabilities (extinction of payables to bank) side of client’s balance sheet. To put it another way,
as the bank’s claims and liabilities are extinct, money is extinct as well (Figure 1.4).
Analogous extinction of money could be observed when bank sells other assets (tangible and
intangible assets, services, debt and equity securities, gold etc.) to non-bank entities (Example
1.12 and 1.13).
As the interest rates on loans exceed interest rates on deposits, clients have to pay more
money then they have borrowed. To pay these interests, client first needs to “earn” money in
her business, i.e. to convince other clients to pay her. The interest spread generates
commercial banks’ profits. Commercial bank’s profit represents a very interesting topic for
discussion. In the Example 1.11, we have observed that, in its simplified version, commercial
bank’s profit equals the difference between interest on claims and interest on liabilities.
Therefore, even if all borrowers used deposits of all clients to repay their debts, there
would still remain some claims equal to the difference between interests on loans and
interests on deposits, but borrowers would have no remaining money to repay it.
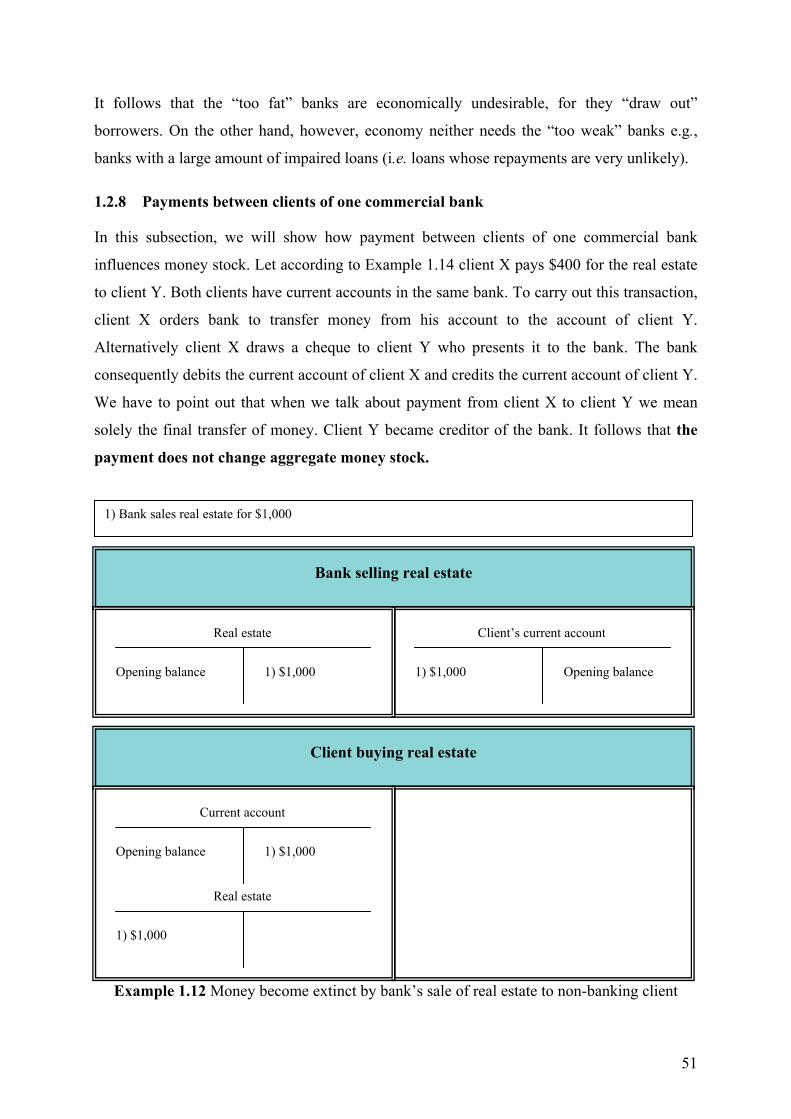
51
It follows that the “too fat” banks are economically undesirable, for they “draw out”
borrowers. On the other hand, however, economy neither needs the “too weak” banks e.g.,
banks with a large amount of impaired loans (i.e. loans whose repayments are very unlikely).
1.2.8 Payments between clients of one commercial bank
In this subsection, we will show how payment between clients of one commercial bank
influences money stock. Let according to Example 1.14 client X pays $400 for the real estate
to client Y. Both clients have current accounts in the same bank. To carry out this transaction,
client X orders bank to transfer money from his account to the account of client Y.
Alternatively client X draws a cheque to client Y who presents it to the bank. The bank
consequently debits the current account of client X and credits the current account of client Y.
We have to point out that when we talk about payment from client X to client Y we mean
solely the final transfer of money. Client Y became creditor of the bank. It follows that the
payment does not change aggregate money stock.
Example 1.12 Money become extinct by bank’s sale of real estate to non-banking client
Bank selling real estate
Client buying real estate
1) Bank sales real estate for $1,000
1) $1,000
Real estate
Opening balance 1) $1,000
Current account
Opening balance 1) $1,000
Real estate
1) $1,000 Opening balance
Client’s current account

52
Example 1.13 Money become extinct by bank’s sale of services to non-banking client
Bank selling service
Client purchasing service
1) Bank sales services for $1,000
Opening balance 1) $1,000
Current account
1) $1,000
Expense - services
1) $1,000
Income - services
1) $1,000
Client’s current account

53
Example 1.14 Payment between clients of one commercial bank
Commercial bank
Client X buying real estate
1) Client X pays $400 to client Y for real estate
opening balance 1) $400
Current account
1) $400
Real estate
1) $400 Opening balance
Client X’s current account
Opening balance 1) $400
Client Y’s current account
Client Y selling real estate
opening balance 1) $400
Current account
1) $400
Real estate

54
1.2.9 Domestic currency payments between clients of two commercial banks
Further, we will examine payment between clients of two commercial banks denominated in
the domestic currency. In Example 1.15 client X, who has current account with bank A, pays
$400 for to client Y, who has his current account with bank B. To carry out this transaction,
client X, for instance, orders bank to transfer money from his account to account of client Y,
or client X draws a cheque to client Y who presents it to bank B. The payment consists in
three successive actions:
o Bank A debits current account of client X and credits its clearing account with the Fed
(asset side of the balance sheet),
o Clearing centre of the Fed transfers liquidity from bank A’s clearing account to bank
B’s clearing account,
o Bank B credits current account of client Y and debits its clearing account.
The aggregate money stock does not change either.

55
Example 1.15 Payment between clients of two commercial banks through clearing house in central bank
Bank A
Client X
1) Client X of bank A pays $400 to client Y of bank B a) Bank A debits current account of client X against its clearing account b) Clearing house transfers liquidity from clearing account of bank A to the clearing account of bank B c) Bank B credits current account of client Y against its clearing account
opening balance 1a) $400
Current account with bank A
1a) $400
Real estate
1a) $400 Opening balance
Client X’s current account
Opening balance 1a) $400
Clearing account with central bank
Bank B
Opening balance 1c) $400
Client Y’s current account
opening balance 1c) $400
Clearing account with central bank

56
Example 1.15 Continuation
1.2.10 Issue of debt and equity securities by commercial banks
Let us examine the impact of the issue of debt and equity securities by commercial banks.
Example 1.16 shows the bank issuing securities for $200 to its client. The issued securities are
sold to bank’s client, who pays for it with money from her current account. It follows that the
aggregate money stock decreases by the amount equal to price of securities sold, i.e., by
$200.
In the Example 1.17, bank A issues securities for $200 and buyer pays for it from her current
account with bank B. The transaction goes through the clearing centre with central bank and it
consists of two successive actions:
o Bank B debits client’s account and credits its clearing account with central bank,
o Clearing centre transfers liquidity from the clearing account of bank B to clearing
account of bank A.
Client Y
1c) $400
Current account with bank B
Opening balance 1c) $400
Real estate
The clearing centre of the Fed
1b) $400 opening balance
Clearing account of bank A
opening balance 1b) $400
Clearing account of bank B

57
Example 1.16 Bank issues securities and sells it its client who pays from his deposit account held with this bank
In this case aggregate money stock decreases by the amount equal to price of securities as
well, i.e. by $200. This means that even if the issue of securities represents the exchange of
one of the bank liabilities (client’s current account) for another (issued securities), first
liability is considered as money and the second one does not represent money. This is fully
reasonable in the case of equity securities. But in the case of the issue of debt securities,
however, one should take into account that there is no economic difference between debt
security and term account. Nevertheless, issued debt securities are not considered as
money. If these securities were considered as money, the aggregate money stock would
remain unchanged.
Bank
Client
1) Client pays $200 for securities to bank from his account with this bank
1) $200
Current account
1) $200
Securities bought
1) $200
Client’s current accounts
1) $200
Securities issued

58
Example 1.17 Bank issues securities and sells to another bank’s client
Bank A
Client
1) Client of bank B pays $200 for securities issued by bank A
opening balance 1) $200
Current account with bank B
1) $200
Securities bought
1) $200
Securities issued
opening balance 1) $200
Clearing account with central bank
Bank B
1) $200
Client’s current accounts
opening balance 1) $200
Clearing account with central bank
Central bank
1) $200
Clearing account of bank A
1) $200 opening balance
Clearing account of bank B

59
Example 1.18 Client Y issues securities and sells them to another bank’s client X
Bank
Client X
1) Client X pays $200 for securities issued by client Y
opening balance 1) $200
Current account
1) $200
Securities bought
1) $200 Opening balance
Client X’s current account
Opening balance 1) $200
Client Y’s current account
Client Y
1) $200
Current account
1) $200
Securities issued

60
Example 1.19 Client Y issues securities and sells them to another bank’s client X
Bank A
Client X
1) Client X of bank A pays $200 for securities issued by client Y of bank B
Opening balance 1) $200
Current account with bank A
1) $200
Securities bought
1) $200
Client X’s current account
Opening balance 1) $200
Clearing account with central
Bank B
1) $200
Client Y’s current account
opening balance 1) $200
Clearing account with central
Client Y
Opening balance 1) $200
Current account with bank B
1) $200
Securities issued

61
Example 1.19 Continuation
1.2.11 Issue of debt and equity securities by clients
In this subsection, we will describe the effects of debt and equity securities issued by clients.
In the Example 1.18, buyer pays for securities from her current account that she has in the
same bank as issuer. Contrariwise, in the Example 1.19 client X pays for securities, from his
current account with bank A, to client Y (issuer) who has his account with bank B. This
transaction is realized through the clearing centre. It is evident that in both cases, the
aggregate money stock remains unchanged.
1.2.12 Flow of money as a result of cross-border investments
Until now, we have not assumed the cross-border financial transactions i.e., we have supposed
that both banks and their clients were residents of the same country. But how would the
situation look like, if client X pays $100 from current account with her bank A (both client X
and bank A are residents of the USA) to client Y’s current account with bank B (both client Y
and bank B are residents of the eurozone). Example 1.20 illustrates such situation. U.S.
investor, for instance, purchases real estate in the eurozone for $100.
The transaction consists of two successive actions:
o Bank A debits current account of client X and credits vostro account of bank B (held
in bank A),
o Bank B credits current account of client Y and debits its nostro account with bank A.
It follows that the aggregate money stock in the USA has decreased by $100 whereas the
aggregate money stock in the eurozone has increased by $100. The amount of $100 is
Central bank
1) $200 opening balance
Clearing account of bank A
opening balance 1) $200
Clearing account of bank B

62
balanced by the claim of the eurozone bank on U.S. bank (but this claim doesn’t make part of
neither eurozone money nor U.S. money). We have to point out once more that when we talk
about payments from client X to client Y we mean solely the final transfer of money. Client Y
became creditor of bank B who became creditor of bank A. Payments denominated in any
other currency follow the same pattern.
This means that the cross-border investments affect money stock in both countries. Money
stock in the country of investor decreases and the money stock of country attracting the
investment increases. Money stock of individual countries thus depends on the inflows
and outflows of money. It is evident that cross-border investments do not cause the real
creation of money. The sum of money stock remains constant. What changes, is the relative
distribution of money stock among countries. In the first country money stock increases and
in the second one it decreases.
Let’s further demonstrate flow of money from the USA to the Czech Republic followed by:
o Foreign exchange intervention of the Czech central bank (Czech National Bank) and
o Central bank’s absorption of liquidity from its clearing account to its term account.
The reason for selection of the Czech Republic is that foreign exchange interventions are
much more frequent in smaller countries. In the USA, eurozone, Japan and the United
Kingdom foreign exchange interventions almost disappeared.
Example 1.21 shows the situation when client X pays $100 from current account with her
bank A (both client X and bank A are residents of the USA) to client Y’s current account with
bank B (both client Y and bank B are residents of the Czech Republic). Claims of the Czech
bank towards the U.S. bank increased by $100. The aggregate money stock in the USA
decreased by $100 and the aggregate money stock in the Czech Republic increased by
the same amount.
The inflow of money into Czech Republic leads to the appreciation of domestic currency
(CZK). Thus Czech National Bank {Czech central bank) usually seeks to avoid appreciation
by means of the so-called sterilized foreign exchange intervention. Central bank purchase
foreign currency in exchange for the domestic currency. In the Example 1.21 the Czech
National Bank purchased $100 from bank B for CZK 3000 (transaction No 2). The liquidity
of CZK 3000 was added to bank B’s clearing account with the Czech National Bank. As we
shall see later, in order to prevent interbank interest rates falling, Czech National Bank have to

63
draw immediately this liquidity (CZK 3000) from clearing accounts to term accounts, e.g. by
means of repo operations with one of the Czech commercial banks (transaction No 3).
Examples 1.20 and 1.21 describe the so-called correspondent banking. It is a situation when
one bank has the current account in another bank and through this account banks operate
payments of their clients (or their own payments). In the first bank, this account is called
nostro account and in the second one, it is called vostro account. Terms nostro account and
vostro account thus stand for one sole account, i.e. once from the point of view of one bank
and once from the point of view of the second one.
Nostro account is the Latin expression for “our” account i.e., for the account of one bank
held in the other (usually foreign) bank. It is on the asset side of balance sheet. The bank that
has an account in another bank to receive thus its payments is called respondent bank. Vostro
account is the Latin expression for “your” account i.e., for the account of another (usually
foreign) bank held in a given bank. It is on the liabilities side of balance sheet. Bank, in which
another bank holds its accounts, and thus provides it services, is called correspondent bank.
Vostro account is also called vostro account.
In Examples 1.20 and 1.21, payments between clients of banks went through the current
account of bank B in bank A. This payment could also be realized through the current account
of bank A in bank B. Such situation can one easily imagine. Both of these cases suppose the
correspondent relation between bank A and bank B. However, this is not always the case. If
there is no such relation, payment operations must go through another bank in the United
States, the eurozone or the Czech Republic through the corresponding local payment system.
In the United States it is the Fedwire operated by Fed and automated clearing houses (ACHs)
operated by Fed or other operators, in the eurozone it is the TARGET operated by Eurosystem
and in the Czech Republic it is CERTIS operated by the Czech National Bank

64
Example 1.20 Cross-border investment denominated in U.S. dollars (Payment through vostro account of payer’s bank)
Bank A – resident of the USA
Client X – resident of the USA
1) Client X (US resident) pays $400 for real estate to client Y (eurozone resident)
Opening balance 1) $100
Current account with bank A
1) $100 Opening balance
Client X’s current account
1) $100
Vostro account of bank B
1) $100
Real estate
Bank A – resident of the eurozone
1) $100
Nostro account with bank B
Client Y – resident of the eurozone
1) $100
Current account with bank B
Opening balance 1) $100
real estate
1) $100
Client Y’s current account

65
Example 1.21 Cross-border investment denominated in U.S. dollars
Bank A – resident of the USA
Client X – resident of the USA
1) Client X (US resident) pays $10 for real estate to client Y (Czech resident) 2) Czech National Bank purchases $10 from bank B for CZK 300 3) Czech National Bank absorbs liquidity from clearing account to term account
Opening balance 1) $100
Current account with bank A
1) $100 Opening balance
Client X’s current account
2) $100 1) $100
Vostro account of bank B
1) $100
Real estate
2) $100
Loro account of the Czech National Bank
Bank B – resident of the Czech Republic
1) CZK 3000 ($100)
Client Y’s current account
1) CZK 3000 ($100) 2) CZK 3000 ($100)
Nostro account with bank A
2) CZK 3000 3) CZK 3000
Clearing account with Czech National Bank
3) CZK 3000
Term deposit with Czech National Bank

66
Example 1.21 Continuation
1.3 Liquidity and reserve requirements
In several countries, we can still find reserve requirements (required reserves). However, the
reasons for their existence are of rather historical and technical character than economic.
Reserve requirements consist in the obligation of commercial banks to hold a certain balance
(liquidity) on their clearing accounts (nostro accounts) so that the average liquidity of any
bank during a given period is equal or higher than the reserve requirement of this bank. Some
central banks allow commercial banks to include in this obligation the currency held in their
vaults. The amount of reserve requirement equals the reserve ratio (set by central bank) multi-
plied by the volume of commercial bank’s reservable liabilities (the so-called reserve base).
Although reserve requirement could be applied to any depository institution, in practice it is
used only in the case of commercial banks. Reserve requirements in individual countries are
historically decreasing. In several countries reserve requirements do not exist anymore (e.g. in
Canada, New Zealand, Denmark, Mexico and Sweden). Originally, there was no interest paid
on required reserves. Nowadays, countries, where required reserves were not abandoned yet,
Czech National Bank
2) CZK 3000 ($100)
Nostro account with bank A
Client Y – resident of the Czech Republic
1) CZK 3000 ($100)
Current account with bank B
Opening balance 1) CZK 3000
Real estate
3) CZK 3000 2) CZK 3000
Clearing account of bank B
3) CZK 3000
Term deposit of bank B

67
slowly start paying the interest on them based on interbank interest rates. In some countries,
one part of reserves does not bear interest and the other part does.9
1.3.1 Liquidity and bank reserves
Liquidity is generally the term denoting balances on interbank (commercial banks and central
banks) current accounts (not balances on interbank term accounts). For the liquidity of
commercial banks on central bank’s current account (clearing account) is often used the term
bank reserves. Liquidity and bank reserves are subject to the interbank market (interbank
loans and deposits). Roughly speaking, the interbank market represents market for liquidity
and bank reserves. Interbank loans and deposits are usually uncollaterised. Neither liquidity
nor bank reserves form an integral part of money (monetary aggregates).
Clearing account is the account of commercial bank at central bank to fulfil reserve
requirements and to conduct interbank domestic currency payments. Banks with the excess of
bank reserves (in relation to reserve requirements) lend this bank reserves (usually without
collateral) to other banks for the interbank interest rate (LIBOR, EURIBOR etc.). Banks can
also deposit the excess reserves at central bank for the interest rate inferior to the interbank
interest rates paid on deposits of the same maturity.
In the United States, bank reserves of depository institutions with Fed are called federal
funds. The interbank market is called federal funds market. The overnight interest rate of
this market is called overnight federal funds rate. The most of interbank loans and deposits
are overnight, but interbank term deposits exist as well. U.S. depository institutions thus
borrow bank reserves usually for only one day i.e., they pay it back at the beginning of the
next workday. Bank reserves, as well as its distribution among individual depository
institutions, changes every day. Smaller banks are usually lending bank reserves to bigger
ones. The overnight federal funds rate is the key rate of monetary policy.
Bank reserves consist of required and excess reserves. Further, some central banks set the
amount of required clearing reserves, since the account with central bank is also used for
clearing (payment) operations. The excess reserves (sometimes also called surplus reserves or
free reserves) represent the excess of commercial bank’s bank reserves over required reserves.
Regarding the fact that excess reserves almost never bear interests (neither in the case when
required reserves do), commercial banks always seek to minimize it.
9 This topic is comprehensively covered in chapter 6 of Bindseil, Ulrich: Monetary Policy Implementation: Theory Past and Present. Oxford University Press, Oxford 2004.

68
Reserve ratio represents the required ratio of reserves and reservable liabilities.
The overall bank reserves of commercial banks at central bank are influenced by the
following operations between central bank and commercial banks and their clients:
o Currency withdrawals and currency deposits between commercial banks and central
bank (for example when client asks for currency withdrawal from his bank). When
depositors start withdrawing currency, commercial banks have to withdraw the
currency from central bank. In substance, withdrawal of currency from central bank by
commercial bank represents central bank’s issue debt security bearing zero interest.
Commercial banks seek to minimize their holdings of currency because it does not
bear interest. The increase of currency decreases bank reserves. Commercial banks
then pay for this currency with their reserves. Conversely, the decrease of currency
increases bank reserves (Example 1.22).
o Payments between central bank and commercial bank in domestic currency (Example
1.23).
o Payments between central bank and client of commercial bank denominated in
domestic currency (Example 1.24).
Currency withdrawals by central bank’s clients do not impact bank reserves (Example 1.25).

69
Example 1.22 Decrease of bank reserves through commercial bank’s withdrawal of currency from central bank
Bank A
Client
1) Client withdraws currency of $400 from her current account 2) Bank A withdraws currency of $400 from its clearing account
Central bank
Currency in circulation
1) $400 opening balance 2) $400
Clearing account with central bank
2) $400 opening balance
Client’s current account
opening balance 1) $400
Currency in circulation
opening balance 2) $400
Clearing account of bank A
opening balance 2) $400
opening balance
Current account with bank A
1) $400
opening balance 1) $400
Currency in circulation

70
Example 1.23 Decrease of bank reserves through commercial bank’s payment to central bank
Bank A
1) Commercial bank pays $400 to central bank to discharge the debt
Central bank
Clearing account with central bank
1) $400 Opening balance
Clearing account of bank A
Opening balance 1) $400
Claims
1) $400 Opening balance
Liabilities
Opening balance 1) $400

71
Example 1.24 Decrease of bank reserves through client’s payment to central bank via
commercial bank
Bank A
1) Client pays $400 to central bank through its current account with bank A
Central bank
Clearing account with central bank
1) $400 Opening balance
Clearing account of bank A
Opening balance 1) $400
Claims
1) $400 Opening balance
Client’s current account
Opening balance 1) $400
Client
Liabilities
Opening balance 1) $400
Current account with bank A
1) $400 Opening balance

72
Example 1.25 Bank reserves remain unchanged through central bank’s client withdraws currency
In addition, there are operations which have impact on bank reserves but the central bank is
not a partner of such operations:
o Payments between clients (including government) of central bank and clients of
commercial bank denominated in domestic currency (Example 1.26).
o Payments between clients (including government) of central bank and commercial
banks denominated in domestic currency (Example 1.27).
1) Client withdraws currency of $400 from central bank
Central bank
Clearing accounts of commercial banks
Opening balances
Client’s current account
Opening balance 1) $400
Client
Currency in circulation
opening balance 1) $400
Currency
Opening balance 1) $400
Current account with central bank
1) $400 opening balance

73
Example 1.26 Decrease of bank reserves when client of commercial bank pays to client of
central bank
Bank A
Central bank
1) Client X of commercial bank A pays $400 to client Y of central bank
1) $400 Opening balance
Client X’s current account
Opening balance 1) $400
Clearing account with central bank
Client X
1) $400 Opening balance
Liabilities
Opening balance 1) $400
Current account with bank A
Client Y
Opening balance 1) $400
Current account with bank B
1) $400
Client Y’s deposit accounts
1) $400 Opening balance
Clearing account of bank A
1) $400
Claims
Opening balance

74
Example 1.27 Decrease of bank reserves when commercial bank pays to client of central
bank
Payment operations between clients of commercial banks do not change bank reserves
(Example 1.15). Bank reserves remains also unchanged in case of payments (resulted from
interbank operations) between commercial banks in domestic currency via central bank
(Example 1.28). In both cases, we observe only the transfers of bank reserves between
commercial banks, not changes of overall bank reserves at central bank.
Bank A
Central bank
1) Bank A pays $400 to client of central bank
1) $400 Opening balance
Liabilities
Opening balance 1) $400
Clearing account with central bank
Client
Opening balance 1) $400
Current account with bank B
Opening balance 1) $400
Client’s current account
1) $400 Opening balance
Clearing account of bank A
1) $400
Claims
Opening balance

75
Example 1.28 Bank reserves remain unchanged through payment between two commercial
banks via central bank
Examples 1.22 to 1.24, 1.26 and 1.27 illustrate decreases of bank reserves at central bank.
Reverse operations that increase bank reserves are not mentioned here.
Let’s pay attention to loan activity. Loan activity of commercial banks does not change
bank reserves directly. There is no direct relationship between amount of loans granted and
bank reserves. Granting new loan results only in the creation of new deposit. But new deposits
Bank A
Central bank
1) Bank A pays $400 to bank B
Opening balance 1) $400
Clearing account with central bank
Opening balance 1) $400
Clearing account of bank B
1) $400 Opening balance
Clearing account of bank A
Bank B
Opening balance 1) $400
Clearing account with central bank

76
are reservable liabilities that with some time delay require on commercial banks to hold
higher bank reserves. That’s the indirect relationship between loan activity and bank reserves.
Commercial bank’s reserves at central bank thus slightly increase (in proportion to reserve
ratio that generally does not exceed a few percents). But this indirect relationship does not
hold true in some cases. Deposits can be converted into nonreservable liabilities (e.g. equity
instruments). In such a case there is neither direct nor indirect relationship between loan
activity of commercial banks and bank reserves.
Central bank fulfils the role of banker to the government. Central bank in many countries
operates government’s accounts. And this is the main source of bank reserve fluctuations. If,
for instance, clients of commercial banks pay taxes, bank reserves decreases. Conversely, if
government sends money to clients of commercial banks, bank reserves increases. Similar
effects would cause the issue of treasury bills, notes and bonds (bank reserves decreases) and
its repayments (bank reserves increases).
Foreign exchange operations of central bank affect bank reserves in a similar way. When
central bank sells dollars for domestic currency, commercial bank that buys it pays from its
clearing account. Hence, the bank reserves of banking sector decreases.
We can summarize that the overall amount of bank reserves varies on a daily basis. Bank
reserves are influenced by payments initialized by commercial banks, their clients, clients of
central bank, and by payments operated by central bank itself. Variations of many factors are
easily predictable. Many fluctuations result from seasonal effects. For example, the volume of
currency in circulation increases before the end of the year. During the Christmas time,
households need to hold more currency for shopping. The balance of government’s accounts
in central bank varies seasonally with dates of tax and social security payments.
Central bank imposes the reserve requirements and then regulates bank reserves by means of
open market operations (buying or selling bank reserves) in order to reach bank reserves
slightly exceeding reserve requirements i.e., so that the excess reserves are positive.
Commercial banks themselves have only a little chance to influence bank reserves. Open
market operations thus represent rather defensive operations. The central bank is using them
to compensate other operations that affect bank reserves.
The amount of excess reserves should be neither too low (in such case, the lack of bank
reserves could force the interbank interest rates to grow without any limit) nor too high
(in this case, the superfluity of bank reserves could force the interbank interest rates to

77
fall to zero). The key aspect of our discussion is the fact that the short-term interbank
interest rate cannot be determined by the excess reserves only but mainly by the interest
rate that central bank uses to sell and buy bank reserves. The optimal amount of excess
reserves can be derived directly from the practice of interbank money market. Whatever
theory seems useless.
The volume of bank reserves of any bank varies on a daily basis as well. To manage its
reserves commercial bank usually establishes reserves (liquidity) management department. If
one bank finds itself with the lack of bank reserves, it can borrow it from bank with the excess
reserves. Such a bank exists for sure. Central bank regulates the overall amount of bank
reserves in such a way that commercial banks as a whole are able to meet reserve
requirements. When managing its bank reserves, commercial bank must deal primarily with
major payments of its clients (both provided and received). It is obvious that at the end of
each workday some banks find themselves with the unpredicted excess of reserves and some
banks with the unpredicted lack of reserves. Experience shows that the more there are banks
in the system, the bigger the amount of everyday excess reserves are.
There is a number of different ways how central bank can regulate bank reserves by open
market operations. One possible way for central bank is to provide reserves by means of
collaterised loan to commercial bank (Example 1.29).
Example 1.30 illustrates the absorption of bank reserves. Central bank offers to commercial
bank to put its bank reserves on term account with the central bank. It is again evident that
open market operations do not affect commercial banks’ loan activity.
Commercial banks use their bank reserves to settle interbank payments. But reserve
requirements in individual countries are historically decreasing and in some countries they do
not exist at all. To settle properly payments banks now need temporary reserve balances
exceeding required reserves. Overdrafts of clearing accounts are forbidden. To secure
continuous operation of payment system, commercial banks thus often need to ask for
collaterised intraday lending facility. Otherwise, payments from their clearing accounts
would face problems. Banks would easily lose its credibility, clients would leave it and some
banks would even turn bankrupt. Central banks do not provide uncollaterised facilities. This
issue will be further developed in chapter three.

78
Example 1.29 Central bank providing bank reserves by means of collaterised loan granted to
a commercial bank
Commercial bank
Central bank
1) Central bank grants collaterised loan of $400 to commercial bank
Opening balance 1) $400
Clearing account with central bank
opening balance 1) $400
Clearing account of bank A
opening balance 1) $400
Loans granted
Opening balance 1) $400
Loans from central bank

79
Example 1.30 Central bank absorbing bank reserves by means of term account offered to a commercial bank
1.3.2 Role of reserve requirements
Reserve requirements perform two functions:
o Taxation of commercial banks and
o Commercial bank’s reserves cushion at central bank
Taxation of commercial banks represents the profit of central bank, i.e. in principle the
profit of the government. Reserve requirements perform this function only if central bank
does not pay interests on it or if the interests paid are lower than interests on the interbank
market. Taxation thus equals interest that would be paid on reserves if it were placed on the
interbank market:
Commercial bank
Central bank
1) Commercial bank transfers $400 from clearing account on a term account with central bank
Opening balance 1) $400
Clearing account with central bank
1) $400 Opening balance
Clearing account of bank A
1) $400
Term account with central bank
1) $400
Term account of bank A

80
taxation = ( r - rr ) x reserve ratio x reserve base
Where: r stands for the interbank interest rate and
rr stands for interest rate paid on required reserves
There is zero taxation if bank reserves yield the interbank interest rate. In the Example 1.42 taxation equals:
taxation = ( 0.06 - 0.00 ) x 0.0324 x $1,050 billion = $2.05 billion
Implementation of the zero-interest bearing reserve requirements represents to central bank an additional profit of $2.05 billion. If the interest rates on clients’ assets and liabilities remain unchanged, profits of commercial banks would fall by the same amount, i.e. $2.05 billion. In fact, banks will rather transfer the decreased income on their customers, i.e. on entrepreneurs and households, by means of lower interest on deposits and higher interest on loans. Regardless competition, this is exactly what commercial banks generally do. While some borrowers have the access to loans from non-banking entities, other borrowers have no other chance than to stay with banks and pay higher interest. Implementation (or rise) of reserve requirements thus makes bank loans less attractive. Anyway, the implementation of zero-interest-bearing reserve requirements causes increased taxation of entrepreneurs and households, i.e. influences the credit spread between interest rates on loans and interest rates on deposits.
Interest loss or “reserve tax” influences directly commercial banks and their clients. It thus motivates clients (both borrowers and depositors) to evade this system. Moreover, banks always seek to minimize their bank reserves by means of new products that allow for similar services but do not require bank reserves. There is an unlimited number of ways how to evade bank reserves. Banks can use the off-balance sheet operations or can offer of non-reservable deposits or transfers of reservable deposits to other institutions (particularly subsidiaries). On the other hand we shall consider the fact that central banks provide number of services (including the supervision) for free.
Bank reserves cushion of commercial banks becomes important when the individual bank faces unpredictable withdrawals of deposits by clients. Example 1.22 illustrates decrease of the total of bank reserves through commercial bank’s withdrawal of currency from central bank initiated by the withdrawal of currency by clients from commercial bank. Example 1.31 describes domestic money transfer from bank A to bank B through the clearinghouse (this example is very similar to Example 1.15). Even if in this case total amount of bank remains unchanged, the bank reserves of the first bank decrease and the bank reserves of the second bank increase.

81
Example 1.31 Transfer of client’s money from current account with bank A to current
account with bank B
Bank A
Client
1) Client transfers $200 from her current account with bank A to her current account with bank B
Opening balance 1) $400
Current account with bank A
Opening balance 1) $400
Current account with bank B
1) $400 Opening balance
Client’s current account
Opening balance 1) $400
Clearing account with central
Bank B
Opening balance 1) $400
Client’s current account
Opening balance 1) $400
Clearing account with central bank
Central bank
1) $400 Opening balance
Clearing account of bank A
Opening balance 1) $400
Clearing account of bank B

82
When facing increased currency withdrawals or money transfers to other banks, commercial
bank needs to borrow bank reserves from other commercial banks (if these banks are willing
to lend them) or from central bank (but central banks is willing to grant only collaterised loans
i.e., commercial bank have to transfer acceptable collateral to central bank), or it must start
selling its assets (usually bank starts selling the most liquid asset, like securities, and proceeds
with less liquid ones).
Many bankruptcies of commercial banks are driven as a result of insufficient bank reserves on
individual interbank accounts. This was also the main reason for the implementation of
reserve requirements. Requirements were set either by law or by moral suasion in the way that
every commercial bank transformed part of its assets into bank reserves on its account at
central bank. However, the cause of insufficient bank reserves (and the primary cause of
bankruptcies) is always to be found in inability of banks to meet withdrawals of deposits, i.e.
conversions of deposits into currency and transfers of deposits from one bank to another. To
avoid such situations, banks were always trying to upgrade temporarily their annual reports
balances (window-dressing) by increasing their holdings of currency and liquid assets.
As an alternative to reserve requirements, several central banks have imposed the so-called
liquid asset (including reserves) ratio to overall assets or to overall liabilities (LAR).
These liquid assets are reserves, currency held by commercial banks (vault cash), balances of
nostro accounts, cheques in the process of collection, and treasury bonds easily convertible
into currency (e.g. T-bills). This method features certain shortcomings. As these assets are to
be held, it could not be used to secure withdrawals. Besides, whatever decline (even if
temporary) in liquid assets under the required level is considered to signal weakness or
troubles of a given bank. Compulsory holdings of the less yielding assets also negatively
affect profits of banks. LAR requirements have restrained competitiveness in banking sector
and sometimes even motivated bank to take riskier actions in order to restore its original
profitability. But this cancelled the original aim of central bank. In several cases LAR was
misused to fiscal purposes.
Reserve requirements were often considered to represent one of the monetary policy
instruments used to influence the loan expansion of commercial banks i.e., the creation of
money and subsequently the final target of monetary policy (price stability, long-term
economic growth and employment). To put it another way, changes in reserve requirements
were supposed to stimulate or restrain amount of loans granted. The raise of reserve
requirement was expected to slow down the loan activity and hence the overall business

83
activity. Nowadays, we know already that this causality doesn’t hold. Monetary policy
consists solely in the open market operations that central bank employs to manage short-term
interest rates. Reserve requirements thus have no monetary effects, for it has nothing common
with commercial bank’s loan activity. It was confirmed by Moore in 198410, Goodhart in
198911 etc.
1.3.3 Examples of the reserve requirements
In this subsection, we will introduce the reserve requirements of the Fed, the European
Central bank, the Bank of Japan and the Bank of England.
1.3.3.1 The Fed
According to the Fed regulation (as of December 31, 2004) the first net transaction accounts
from $0 million–$7.0 million, non-personal time deposits and euro-currency liabilities carry
reserve ratio of 0 %. The second net transaction accounts of $7.0 million–$47.6 million are
burdened by reserve ratio of 3 %. The third net transaction accounts of more than $47.6
million carry reserve ratio of 10 %. Reserve requirements bear 0 % interest rate.
Net transaction accounts are total transaction accounts less amounts due from other depository
institutions and less cash items in the process of collection. Total transaction accounts consists
of demand deposits, automatic transfer service (ATS) accounts, NOW accounts, share draft
accounts, telephone or preauthorized transfer accounts, ineligible bankers acceptances, and
obligations issued by affiliates maturing in seven days or less.
10 Moore, Basil. J.: Contemporaneous Reserve Accounting: Can Reserve be Quality-Constrained? Journal of Post Keynesian Economics, 1984, 7(1), 103-113. According to Moore: “It has only recently been recognized that the conventional view, that the growth of monetary aggregated can be "controlled" through a quantity-constrained process over the sources of bank reserves, represents a fundamental analytical misunderstanding of the nature of the money supply process. In credit-money as distinct from commodity-money economies, the money stock is determined basically by the demand for bank credit, which governs the volume of bank intermediation (Hicks, 1977; Kaldor, 1982; Moore 1984). Banks are price-setters and quantity-takers in both their retail loan and deposit markets, and they use the wholesale markets, where they are price-takers and quantity-setters, to lend or borrow any net excess sources or uses of funds (Willis, 1982). As a result bank earning asset decisions are largely independent of their reserve positions.” 11 Goodhart, Charles: The Conduct of Monetary Policy, The Economic Journal, 1989, 99(396), 293-346. According to Goodhart: “The historical stability of the banks' reserve ratio had depended on the willingness of the authorities always to supply extra cash on demand at an interest rate chosen by the authorities. If the authorities should shift the operational form of the system, by refusing banks' access to cash freely at any price, the banks' desired reserve ratio might experience a major shift, and could then become much more variable. There would be a long transition period, from regime to regime, in which it would be hard to select an appropriate level of base money, and the variability of the banks' reserve/deposit ratio under the new system could be so large as to prevent any improvement in monetary control, while at the same time losing grip on interest rates.”
84
Required reserves must be held in the form of vault cash and, if vault cash is insufficient, also
in the form of a deposit with a Federal Reserve Bank. An institution that is a member of the
Federal Reserve System must hold that deposit directly with a Reserve Bank; an institution
that is not a member of the System can maintain that deposit directly with a Reserve Bank or
with another institution in a pass-through relationship. Reserve requirements are imposed on
commercial banks, savings banks, savings and loan associations, credit unions, U.S. branches
and agencies of foreign banks, Edge corporations, and agreement corporations. Reserve
requirements are not remunerated.
1.3.3.2 The ECB
According to the ECB regulation (as of December 31, 2004) the reserve base comprises some
liabilities to non-bank entities: deposits and debt securities issued. A reserve ratio of 0 % is
applied to the following liabilities:
o deposits with agreed maturity over two years,
o deposits redeemable at notice over two years,
o repos,
o debt securities issued with an agreed maturity over two years.
A reserve ratio of 2.0 % is applied to all other liabilities included in the reserve base. An
allowance of €100 000 is deducted from the calculated reserve requirement. Reserve
requirements are remunerated at the of the ECB rate for the main refinancing
operations.
1.3.3.3 The Bank of Japan
Reserve requirements system in Japan is complicated. There is wide range of reserve ratios
(from 0.05 to 1.3 %) for specific deposits and debt securities. Reserve requirements are not
remunerated.
1.3.3.4 The Bank of England
The Bank of England imposes reserve requirements equal only to 0.15% of eligible liabilities
held by commercial banks and building societies. Reserve requirements are not
remunerated. Taxation resulting from these reserves covers the operational costs of central
bank (particularly wages and salaries). Bank of England’s reserve ratio slowly decreases as its

85
operations become more cost-effective. The Bank of England will introduce a system of
voluntary remunerated reserves and will set upper limits to the amounts that banks can hold.12
1.4 Example of the banking system without central bank
In order to make the concept of the banking system more concrete, we divide the economy
into four separate sectors, namely commercial banks, enterprises, government and
households. This system does not contain central bank yet. Central bank will be included into
the model in the next subsection. This system would operate in a similar way as if the central
bank were included. Another central institution, however, have to regulate interest rates. First,
we will introduce the simplest case in the Example 1.32 (beginning of the year) and Example
1.33 (end of the year).
Commercial banks, at the beginning of the year, grant loans to enterprises amounting to
$1,000 billion charging the interest rate of 8 % (transaction No. 1). Suppose further that
commercial banks finance both enterprises and government. Government usually issues
treasury bonds. In our case, it issues bonds for $200 billion at the interest rate of 6 %.
Commercial banks then buy these bonds (transaction No. 2). In a commercial bank’s balance
sheet, loans granted and treasury bonds purchased represent assets. Similarly, amounts
credited to current accounts belonging to enterprises and government represent its liabilities
(banks pays on these liabilities interest rate of 4 %). In the case of government and
enterprises, loans and bonds issued (sold) represent liabilities and received amounts of money
represent assets.
Further, let’s suppose that at the beginning of the year all real entrepreneurial assets (real
estate, machinery as so forth) are in possession of households and that these households are
not indebted. Let, at the beginning of the year, enterprises to purchase entrepreneurial assets
and labour from households for $1,000 billion (transaction No. 3). Real assets thus shift from
the balance sheets of households into balance sheets of enterprises. Conversely,
entrepreneurial deposits shift from the balance sheets of enterprises into balance sheets of
households.
12 Tucker, Paul: Managing the Central Bank’s Balance Sheet: Where Monetary Policy meets Financial Stability. Bank of England Quarterly Bulletin, 2004, Autumn, 359-82. Clews, Roger: Implementing monetary policy: reform to the Bank of England’s Operations in the Money Market. Bank of England Quarterly Bulletin, 2005, Summer, 211-20. Andrews, Peter and Janssen, Norbert: Publication of Narrow Money Data” the Implications for Money Market Reform. Bank of England Quarterly Bulletin, 2005, Autumn, 367-69

86
In addition, government distributes at the beginning of the year all its cash (held with
commercial banks) to households (salaries of state employees, social benefits and so forth). In
other words, government transfers $200 billion from its balance sheet to the balance sheet of
households. This amount represents expenses of government and income of households.
Households’ equity increases by the same amount (transaction No. 4).
Example 1.32 Balance sheets of commercial banks, enterprises, government and households at the beginning of the year
Commercial banks
Loans granted to enterprises (r = 8 %) 1) + $1,000 billion
Treasury bonds purchased (r = 6 %) 2) + $200 billion
Enterprises deposits (r = 4 %) 1) + $1,000 billion 3) – $1,000 billion
Government deposits (r = 4 %) 2) + $200 billion 4) – $200 billion
Households’ deposits (r = 4 %) 3) + $1,000 billion 4) + $200 billion
Enterprises
Deposits with commercial banks (r = 4 %) 1) + $1,000 billion 3) – $1,000 billion
Loans from commercial banks (r = 8 %) 1) + $1,000 billion
Real assets 3) $1,000 billion
1) Loans of $1,000 billion from commercial banks to enterprises 2) Issue of treasury bonds of $200 billion sold to commercial banks 3) Purchase of real assets of $1,000 billion by enterprises from households 4) Transfer of $200 billion from government to households
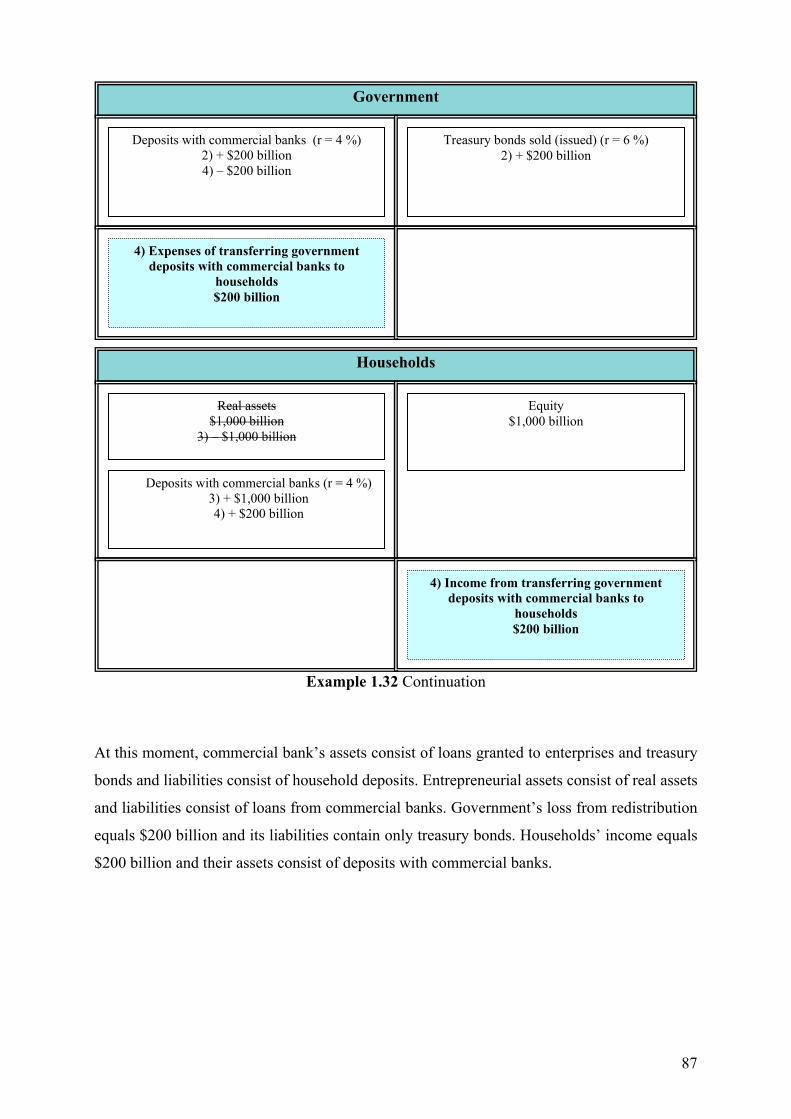
87
Government
Deposits with commercial banks (r = 4 %) 2) + $200 billion 4) – $200 billion
Treasury bonds sold (issued) (r = 6 %) 2) + $200 billion
Households
Real assets $1,000 billion
3) – $1,000 billion
Equity $1,000 billion
Deposits with commercial banks (r = 4 %) 3) + $1,000 billion 4) + $200 billion
4) Expenses of transferring government deposits with commercial banks to
households $200 billion
4) Income from transferring government deposits with commercial banks to
households $200 billion
Example 1.32 Continuation
At this moment, commercial bank’s assets consist of loans granted to enterprises and treasury
bonds and liabilities consist of household deposits. Entrepreneurial assets consist of real assets
and liabilities consist of loans from commercial banks. Government’s loss from redistribution
equals $200 billion and its liabilities contain only treasury bonds. Households’ income equals
$200 billion and their assets consist of deposits with commercial banks.

88
Example 1.33 Balance sheets of commercial banks, enterprises, government and households at the end of the year
Commercial banks
Loans granted to enterprises (r = 8 %) 1) + $1,000 billion (+80)
Treasury bonds purchased (r = 6 %) 2) + $200 billion (+12)
Enterprises deposits (r = 4 %) 1) + $1,000 billion 3) – $1,000 billion
Government deposits (r = 4 %) 2) + $200 billion 4) – $200 billion
Households’ deposits (r = 4 %) 3) + $1,000 billion (+40) 4) + $200 billion (+8)
Enterprises
Deposits with commercial banks (r = 4 %) 1) + $1,000 billion 3) – $1,000 billion
Loans from commercial banks (r = 8 %) 1) + $1,000 billion
Real assets 3) $1,000 billion
1) Loans of $1,000 billion from commercial banks to enterprises 2) Issue of treasury bonds of $200 billion sold to commercial banks 3) Purchase of real assets of $1,000 billion by enterprises from households 4) Transfer of $200 billion from government to households
Interest expenses $48 billion
Interest income $92 billion
Interest expenses $80 billion

89
Government
Deposits with commercial banks (r = 4 %) 2) + $200 billion 4) – $200 billion
Treasury bonds sold (issued) (r = 6 %) 2) + $200 billion
Households
Real assets $1,000 billion
3) – $1,000 billion
Equity $1,000 billion
Deposits with commercial banks (r = 4 %) 3) + $1,000 billion 4) + $200 billion
4) Expenses of transferring government deposits with commercial banks to
households $200 billion
4) Income from transferring government deposits with commercial banks to
households $200 billion
Interest expenses $12 billion
Interest income $48 billion
Example 1.33 Continuation
Let’s observe, how does the economy look like one year later and let’s concentrate primarily
on expenses and income (not from other activities) of each sectors (Example 1.33). Net
interest income of commercial banks equals $44 billion (the difference between gross interest
income and gross interest expense), entrepreneurial expenses equal $80 billion, governmental
interest expenses equal $12 billion and households’ interest income equals $48 billion. The
sum of incomes and expenses in the whole economy equals, naturally, zero as the interest
income of one sector represent interest expenses of another ones (similarly it must hold that
interest expenses of one entity equals interest income of another ones).

90
Example of the banking system including central bank
Now, we can introduce central bank into the system. Central bank’s principal task is to
conduct monetary policy, i.e. to regulate short-term interbank market interest rates in order to
influence inflation. Central bank imposes the short-term interbank market interest rate and
from there the whole range of interest rates in the economy is derived. Central bank also
issues currency.
1.4.1 Central bank without currency and reserve requirements
Let the central bank enter the system described in the Examples 1.32 and 1.33 and let its first
priority be the purchase of the riskless financial assets from commercial banks (e.g. purchase
of treasury bonds). Central bank, therefore, buys treasury bonds from commercial banks and
credits their clearing accounts with the amount equal to the value of purchased bonds. In the
Example 1.34 (beginning of the year) central bank purchases treasury bonds for $200 billion
(transaction No. 5). Suppose further that balances of commercial banks’ current accounts held
with central bank bear the riskless interest rate, i.e. 6 % interest rate (this interest rate equals
to the interest rate paid on treasury bonds).
Let’s observe once more how the economy looks like one year later (Example 1.35). It is
evident that both interest expenses and income of each sector do not differ from the situation
described in the Example 1.33, i.e. expenses and income are the same as if central bank were
not present. Net interest income of commercial banks equals $44 billion (the difference
between gross interest income and gross interest expense), entrepreneurial expenses equal $80
billion, governmental interest expenses equal $12 billion and households’ interest income
equals $48 billion. Net income of central bank is zero. Its interest income equals to interest
expenses of $12 billion. The sum of incomes and expenses in the whole economy equals,
naturally, zero as the interest income of one sector represent interest expenses of another ones.
It is evident that the establishment of central bank did affect neither interest expenses nor
interest income of any sector. The central bank’s profit is zero and it has no influence on
other sectors, i.e., the establishment of central bank neither increases nor decreases interest
expenses and income of any sector. But what are the benefits from the implementation of
central bank? Central bank conducts monetary policy i.e., it regulates short-term interbank
market interest rates. In our examples it regulates the amount of interests paid on
commercial banks’ deposits held with central bank. Herein lie fundamentals of the

91
interest rates regulation. There was no regulator of interest rates in our preceding Examples
1.32 and 1.33. We have been working with interest rates of 4, 6 and 8 %, but there was no
mechanism to anchor it. The introduction of central bank helped solve this problem. Herein
lies the crucial benefit of central bank.
The second benefit from implementing central bank into the system is the possibility to create
central payment system. Commercial banks thus do not need to hold many nostro accounts
with one another anymore. Every commercial bank has only one account in central bank (the
so-called clearing account). Via these accounts, commercial banks can operate their client
payments (if both clients have their accounts with commercial banks) and interbank deposits
(usually denominated in the domestic currency). Central bank influences balances of these
accounts by means of the open market operations. Its objective is to affect balances of
clearing accounts so that it is neither too small (otherwise, interest rates could be pushed very
high) nor too large (in this case interest rates could fall to zero). It is necessary that the short-
term interbank interest rates were not determined by the excess bank reserves but exclusively
by the interest rate used to supply or absorb bank reserves (e.g. interest rate on commercial
banks’ deposits held with central bank as in Examples 1.34 and 1.35).
1.4.2 Central bank with currency and no reserve requirements
Let’s suppose further that the legislature delegates to central bank the privileged position to
issue banknotes and coins and forbids it to any other entity. Banknotes and coins issued by
central bank represent, therefore, debt securities bearing zero interest. The amount of
banknotes and coins issued depends exclusively on the demand of households, enterprises,
commercial banks and government. All entities (households, enterprises, commercial banks
and government) seek to minimize their holdings of currency. We assume that the whole
amount of currency lies in the hands of households. Let the households’ demand for money in
circulation is $150 billion. Central bank hence (according to the Example 1.36 – beginning of
the year) sells banknotes and coins to commercial banks for $150 billion (transaction No. 6).
This amount is also deducted from commercial banks’ clearing accounts held with central
bank. Commercial banks thus exchange part of its assets (deposits with central bank) for the
currency. The balance sheet total of any sector remains unchanged.

92
Example 1.34 Balance sheets of commercial banks, enterprises, government, households and central bank (without currency and reserve requirements) at the beginning of the year
Commercial banks
Loans granted to enterprises (r = 8 %) 1) + $1,000 billion
Treasury bonds purchased (r = 6 %) 2) + $200 billion 5) – $200 billion
Enterprises deposits (r = 4 %) 1) + $1,000 billion 3) – $1,000 billion
Government deposits (r = 4 %) 2) + $200 billion 4) – $200 billion
Households’ deposits (r = 4 %) 3) + $1,000 billion 4) + $200 billion
Enterprises
Deposits with commercial banks (r = 4 %) 1) + $1,000 billion 3) – $1,000 billion
Loans from commercial banks (r = 8 %) 1) + $1,000 billion
Real assets 3) $1,000 billion
1) Loans of $1,000 billion from commercial banks to enterprises 2) Issue of treasury bonds of $200 billion sold to commercial banks 3) Purchase of real assets of $1,000 billion by enterprises from households 4) Transfer of $200 billion from government to households 5) Purchase of treasury bonds of $200 billion by central bank from commercial banks
Deposits with central bank (r = 6 %) 5) + $200 billion

93
Government
Deposits with commercial banks (r = 4 %) 2) + $200 billion 4) – $200 billion
Treasury bonds sold (issued) (r = 6 %) 2) + $200 billion
Households
Real assets $1,000 billion
3) – $1,000 billion
Equity $1,000 billion
Deposits with commercial banks (r = 4 %) 3) + $1,000 billion 4) + $200 billion
4) Expenses of transferring government deposits with commercial banks to
households $200 billion
4) Income from transferring government deposits with commercial banks to
households $200 billion
Central bank
Treasury bonds purchased (r = 6 %) 5) + $200 billion
Deposits from commercial banks (r = 6 %) 5) + $200 billion
Example 1.34 Continuation

94
Example 1.35 Balance sheets of commercial banks, enterprises, government, households and central bank (without currency and reserve requirements) at the end of the year
Commercial banks
Loans granted to enterprises (r = 8 %) 1) + $1,000 billion (+80)
Treasury bonds purchased (r = 6 %) 2) + $200 billion 5) – $200 billion
Enterprises deposits (r = 4 %) 1) + $1,000 billion 3) – $1,000 billion
Government deposits (r = 4 %) 2) + $200 billion 4) – $200 billion
Households’ deposits (r = 4 %) 3) + $1,000 billion (+40) 4) + $200 billion (+8)
Enterprises
Deposits with commercial banks (r = 4 %) 1) + $1,000 billion 3) – $1,000 billion
Loans from commercial banks (r = 8 %) 1) + $1,000 billion (+80)
Real assets 3) $1,000 billion
1) Loans of $1,000 billion from commercial banks to enterprises 2) Issue of treasury bonds of $200 billion sold to commercial banks 3) Purchase of real assets of $1,000 billion by enterprises from households 4) Transfer of $200 billion from government to households 5) Purchase of treasury bonds of $200 billion by central bank from commercial banks
Deposits with central bank (r = 6 %) 5) + $200 billion (+12)
Interest expenses $48 billion
Interest income $92 billion
Interest expenses $80 billion

95
Government
Deposits with commercial banks (r = 4 %) 2) + $200 billion 4) – $200 billion
Securities sold (issued) (r = 6 %) 2) + $200 billion (+12)
Households
Real assets $1,000 billion
3) – $1,000 billion
Equity $1,000 billion
Deposits with commercial banks (r = 4 %) 3) + $1,000 billion (+40)
4) + $200 billion (+8)
4) Expenses of transferring government de-posits with commercial banks to households
$200 billion
4) Income from transferring government deposits with commercial banks to
households $200 billion
Central bank
Treasury bonds purchased (r = 6 %) 5) + $200 billion (+12)
Deposits from commercial banks (r = 6 %) 5) + $200 billion (+12)
Interest expenses $12 billion
Interest income $48 billion
Interest expenses $12 billion
Interest income $12 billion
Example 1.35 Continuation

96
Example 1.36 Balance sheets of commercial banks, enterprises, government, households and central bank (with currency and without reserve requirements) at the beginning of the year
Commercial banks
Loans granted to enterprises (r = 8 %) 1) + $1,000 billion
Treasury bonds purchased (r = 6 %) 2) + $200 billion 5) – $200 billion
Enterprises deposits (r = 4 %) 1) + $1,000 billion 3) – $1,000 billion
Government deposits (r = 4 %) 2) + $200 billion 4) – $200 billion
Households’ deposits (r = 4 %) 3) + $1,000 billion 4) + $200 billion 7) –$150 billion
Enterprises
Deposits with commercial banks (r = 4 %) 1) + $1,000 billion 3) – $1,000 billion
Loans from commercial banks (r = 8 %) 1) + $1,000 billion
Real assets 3) $1,000 billion
1) Loans of $1,000 billion from commercial banks to enterprises 2) Issue of treasury bonds of $200 billion sold to commercial banks 3) Purchase of real assets of $1,000 billion by enterprises from households 4) Transfer of $200 billion from government to households 5) Purchase of treasury bonds of $200 billion by central bank from commercial banks 6) Purchase of currency of $150 billion by commercial banks from central bank 7) Withdrawal of currency of $150 billion by households from commercial banks
Deposits with central bank (r = 6 %) 5) + $200 billion 6) –$150 billion
Currency (r = 0 %) 6) + $150 billion 7) –$150 billion

97
Government
Deposits with commercial banks (r = 4 %) 2) + $200 billion 4) – $200 billion
Securities sold (issued) (r = 6 %) 2) + $200 billion
Households
Real assets $1,000 billion 3) – $1,000 billion
Equity $1,000 billion
Deposits with commercial banks (r = 4 %) 3) + $1,000 billion 4) + $200 billion 7) – $150 billion
4) Expenses of transferring government de-posits with commercial banks to households
$200 billion
4) Income from transferring government deposits with commercial banks to
households $200 billion
Central bank
Treasury bonds purchased (r = 6 %) 5) + $200 billion
Deposits from commercial banks (r = 6 %) 5) + $200 billion 6) – $150 billion
Currency (r = 0 %) 7) + $150 billion
Currency (r = 0 %) 6) + $150 billion
Example 1.36 Continuation

98
Example 1.37 Balance sheets of commercial banks, enterprises, government, households and central bank (with currency and without reserve requirements) at the end of the year
Commercial banks
Loans granted to enterprises (r = 8 %) 1) + $1,000 billion (+80)
Treasury bonds purchased (r = 6 %) 2) + $200 billion 5) – $200 billion
Enterprises deposits (r = 4 %) 1) + $1,000 billion 3) – $1,000 billion
Government deposits (r = 4 %) 2) + $200 billion 4) – $200 billion
Households’ deposits (r = 4 %) 3) + $1,000 billion (+40) 4) + $200 billion (+8) 7) –$150 billion (-6)
Enterprises
Deposits with commercial banks (r = 4 %) 1) + $1,000 billion 3) – $1,000 billion
Loans from commercial banks (r = 8 %) 1) + $1,000 billion
Real assets 3) $1,000 billion
1) Loans of $1,000 billion from commercial banks to enterprises 2) Issue of treasury bonds of $200 billion sold to commercial banks 3) Purchase of real assets of $1,000 billion by enterprises from households 4) Transfer of $200 billion from government to households 5) Purchase of treasury bonds of $200 billion by central bank from commercial banks 6) Purchase of currency of $150 billion by commercial banks from central bank 7) Withdrawal of currency of $150 billion by households from commercial banks
Deposits with central bank (r = 6 %) 5) + $200 billion (+12) 6) –$150 billion (-9)
Currency (r = 0 %) 6) + $150 billion 7) –$150 billion
Interest expenses $42 billion
Interest expenses $83 billion
Interest expenses $80 billion

99
Government
Deposits with commercial banks (r = 4 %) 2) + $200 billion 4) – $200 billion
Securities sold (issued) (r = 6 %) 2) + $200 billion
Households
Real assets $1,000 billion 3) – $1,000 billion
Equity $1,000 billion
Deposits with commercial banks (r = 4 %) 3) + $1,000 billion (+40) 4) + $200 billion (+8) 7) – $150 billion (-6)
4) Expenses of transferring government deposits with to households $200 billion
4) Income from transferring government deposits with to households $200 billion
Central bank
Treasury bonds purchased (r = 6 %) 5) + $200 billion
Deposits from commercial banks (r = 6 %) 5) + $200 billion (+12) 6) – $150 billion (-9)
Currency (r = 0 %) 7) + $150 billion
Interest expenses $12 billion
Interest income $42 billion
Interest expense $3 billion
Interest income $12 billion
Currency (r = 0 %) 6) + $200 billion
Example 1.37 Continuation

100
Further, let commercial banks sell the whole amount of currency to households (transaction
No. 7). To put it another way, households receive currency in exchange for the part of their
deposits held with commercial banks. The households’ current accounts decrease by $150
billion. The balance sheet total of commercial banks decreases by the same amount and the
balance sheet total of any other sectors remains unchanged.
Let’s observe again how the economy looks like after one year (Example 1.37). In
comparison to Examples 1.33 and 1.35, the net income of commercial banks decreased from
$44 billion to $41 billion (i.e. by $3 billion), entrepreneurial interest expenses remain
unchanged ($80 billion), governmental expenses equal $12 billion and households’ income
decreased from $48 billion to $42 billion (i.e. by $6 billion). On the other hand, central
bank’s interest expenses decreased by $9 billion. The sum of incomes and expenses in the
whole economy equals, naturally, zero as the interest income of one sector represent interest
expenses of another ones.
It follows that the introduction of central bank into the system changes substantially
redistribution of interest expenses and income among sectors. Since the currency does not
bear interest, the net income of central bank increased from zero to $9 billion. This net
income results solely from the specific position of central bank at the market. Other entities
cannot achieve this benefit. Such a net income must necessarily represent the net expenses
of other entities, namely enterprises loose $3 billion and households loose $6 billion.
Central bank is the government agency. In view of this fact, issue of currency by central bank
represents:
o Taxation of commercial banks, even if commercial banks does not hold any vault
cash. The cause of this taxation consists in the fall of households’ deposits with
commercial banks and in the equivalent fall of interest-bearing deposits of commercial
banks held with central bank. In our example this taxation equals $3 billion.
o Taxation of households and enterprises. The source of this taxation consists in the
falling households’ and entrepreneurial deposits with commercial banks. In our
example this taxation equals $6 billion.
This taxation makes the profit of central bank. It is evident that taxation results from the
central bank’s privileged position to issue currency, and therefore this taxation should
be redistributed to the government budget. However, legislation usually sets that central
bank does not transfer this particular item but the whole profit, as it performs other state

101
functions as well. The profit of $9 billion mentioned hereinbefore is the so-called
seigniorage.
Theoretically, currency need not exist at all. Deposits on current accounts of households,
enterprises and government can perform the same functions (medium of exchange, accounting
unit and store of value) as currency itself. Central bank would even save its expenses of
printing banknotes and coinage. Households, enterprises, government and commercial banks
would also save their depository expenses. All payments would go cashless, i.e. in the form of
transfers between accounts of commercial banks and central bank.
1.4.3 Central bank with currency and reserve requirements
The issue of currency does not represent the only central bank’s monopoly. Another privilege
consists in the option to decide whether or not to pay (or to pay less then other financial
institutions) interest on commercial banks’ deposits with central bank. In preceding two
subsections, we have presupposed that these deposits yield the interest rate of 6 %.
Nevertheless, legislature on central banks sometimes allows central banks not to pay this
interest (or to use interest rate lower than the interbank interest rate). Since the zero-interest-
bearing deposits are hardly favourable, commercial banks seek to minimize their holdings. If
such deposits become mandatory, we call them reserve requirements (see section 1.3). In
practice central bank usually sets it as a percentage of client deposits (deposits of household
and enterprises) in commercial banks. Let’s suppose (Examples 1.38 and 1.39) that reserve
requirements equal $34 billion (operation No. 8) and that reserve base consists solely of client
deposits. Hence the reserve ratio of 3.24 % (= $35 billion / $1,050 billion).
In the Examples 1.38 (beginning of the year) and 1.39 (end of the year) we suppose that
reserve requirements do not bear interest. The calculation in section 1.3.2 shows that the
taxation through zero-interest-bearing reserve requirements equals $2.05 billion. It is
obvious that central bank’s interest expenses decreased from $3 billion to $0.95 billion, i.e. by
$2.05 billion. If there were no changes of interest paid and charged on client deposits and
loans, the implementation of zero-interest-bearing reserve requirements would affect
adversely profit of commercial banks. Their interest income would fall from $83 billion to
$80.95 billion, i.e. by $2.05 billion (which is the amount of the central bank’s additional
profit).

102
Example 1.38 Balance sheets of commercial banks, enterprises, government, households and central bank (with currency and reserve requirements) at the beginning of the year
Commercial banks
Loans granted to enterprises (r = 8.1 %) 1) + $1,000 billion
Treasury bonds purchased (r = 6 %) 2) + $200 billion 5) – $200 billion
Enterprises deposits (r = 4 %) 1) + $1,000 billion 3) – $1,000 billion
Government deposits (r = 4 %) 2) + $200 billion 4) – $200 billion
Households’ deposits (r = 3.9 %) 3) + $1,000 billion 4) + $200 billion 7) –$150 billion
Enterprises
Deposits with commercial banks (r = 4 %) 1) + $1,000 billion 3) – $1,000 billion
Loans from commercial banks (r = 8.1 %) 1) + $1,000 billion
Real assets 3) $1,000 billion
1) Loans of $1,000 billion from commercial banks to enterprises 2) Issue of treasury bonds of $200 billion sold to commercial banks 3) Purchase of real assets of $1,000 billion by enterprises from households 4) Transfer of $200 billion from government to households 5) Purchase of treasury bonds of $200 billion by central bank from commercial banks 6) Purchase of currency of $150 billion by commercial banks from central bank 7) Withdrawal of currency of $150 billion by households from commercial banks 8) Imposition of reserve requirements of $34 billion by central bank on commercial banks
Deposits with central bank (r = 6 %) 5) + $200 billion 6) –$150 billion 8) – $34 billion
Currency (r = 0 %) 6) + $150 billion 7) –$150 billion
Required reserves (r = 0 %) 8) + $34 billion

103
Government
Deposits with commercial banks (r = 4 %) 2) + $200 billion 4) – $200 billion
Securities sold (issued) (r = 6 %) 2) + $200 billion
Households
Real assets $1,000 billion 3) – $1,000 billion
Equity $1,000 billion
Deposits with commercial banks (r = 3.9 %) 3) + $1,000 billion 4) + $200 billion 7) – $150 billion
4) Expenses of transferring government deposits with to households $200 billion
4) Income from transferring government deposits with to households $200 billion
Central bank
Treasury bonds purchased (r = 6 %) 5) + $200 billion
Deposits from commercial banks (r = 6 %) 5) + $200 billion 6) – $150 billion 8) – $34 billion
Currency (r = 0 %) 7) + $150 billion
Currency (r = 0 %) 6) + $150 billion
Required reserves (r = 0 %) 8) + $34 billion
Example 1.38 Continuation

104
Example 1.39 Balance sheets of commercial banks, enterprises, government, households and central bank (with currency and reserve requirements) at the end of the year
Commercial banks
Loans granted to enterprises (r = 8.1 %) 1) + $1,000 billion (+8.1)
Treasury bonds purchased (r = 6 %) 2) + $200 billion 5) – $200 billion
Enterprises deposits (r = 4 %) 1) + $1,000 billion 3) – $1,000 billion
Government deposits (r = 4 %) 2) + $200 billion 4) – $200 billion
Households deposits (r = 3.9 %) 3) + $1,000 billion (+39) 4) + $200 billion (+7.8) 7) –$150 billion (-5.85)
Enterprises
Deposits with commercial banks (r = 4 %) 1) + $1,000 billion 3) – $1,000 billion
Loans from commercial banks (r = 8.1 %) 1) + $1,000 billion (+81)
Real assets 3) $1,000 billion
1) Loans of $1,000 billion from commercial banks to enterprises 2) Issue of treasury bonds of $200 billion sold to commercial banks 3) Purchase of real assets of $1,000 billion by enterprises from households 4) Transfer of $200 billion from government to households 5) Purchase of treasury bonds of $200 billion by central bank from commercial banks 6) Purchase of currency of $150 billion by commercial banks from central bank 7) Withdrawal of currency of $150 billion by households from commercial banks 8) Imposition of reserve requirements of $34 billion by central bank on commercial banks
Deposits with central bank (r = 6 %) 5) + $200 billion (+12) 6) –$150 billion (-9) 8) – $34 billion (-2.05)
Currency (r = 0 %) 6) + $150 billion 7) –$150 billion
Required reserves (r = 0 %) 8) + $34 billion
Interest expenses $40.95 billion
Interest income $81.95 billion
Interest expenses $81billion

105
Government
Deposits with commercial banks (r = 4 %) 2) + $200 billion 4) – $200 billion
Securities sold (issued) (r = 6 %) 2) + $200 billion (+12)
Households
Real assets $1,000 billion 3) – $1,000 billion
Equity $1,000 billion
Deposits with commercial banks (r= 3.9 %)
3) + $1,000 billion (+39) 4) + $200 billion (+7.8)
4) Expenses of transferring government deposits with to households $200 billion
4) Income from transferring government deposits with to households $200 billion
Central bank
Treasury bonds purchased (r = 6 %) 5) + $200 billion (+12)
Deposits from commercial banks (r = 6 %) 5) + $200 billion (+12) 6) – $150 billion (-9) 8) – $34 billion (-2.05)
Currency (r = 0 %) 7) + $150 billion
Currency (r = 0 %) 6) + $150 billion
Required reserves (r = 0 %) 8) + $34 billion
Interest expenses $12 billion
Interest income $40.95 billion
Interest income $12 billion Interest expenses $0.95 billion
Example 1.39 Continuation

106
In practice, commercial banks usually transfer the decreased profit to their clients by
widening the credit spread between interest paid on deposits and interest charged on loans.
Until now, we have been working with the credit spread of 4 % (8 % - 4 %). However, if
profits of commercial banks were to remain unaffected by the implementation of reserve
requirements, interest charged on loans would have to rise and interests paid on deposits
would have to fall. In our Examples 1.38 and 1.39 interest rates would have to change (both
increase and decrease) by 0.1 % [= $2.05 billion / ($1,000 billion + $1,050 billion)]. Credit
spread would, therefore, increase from 4 % to 4.2 % (8.1 % - 3.9 %).
Central bank is the government agency. In view of this fact, implementation of reserve
requirements represents:
o Taxation imposed on households. In our example it equals $1 billion.
o Taxation imposed on enterprises. In our example it equals $1.05 billion.
Let’s observe again at how the economy looks like after one year. If we compare Examples
1.38 and 1.36, we find that commercial banks’ interest expenses decreased from $42 billion to
$40.95 billion and that their interest income decreased from $83 billion to $81.95 billion. The
net income remained unchanged since it equals $41 billion. Entrepreneurial interest expenses
increased by $1 billion (from $80 billion to $81 billion). Interest expenses of government
remained unchanged ($12 billion). Interest income of households decreased from $42 billion
to $40.95 billion (i.e. by $1.05 billion). Central bank’s interest expenses decrease from $3
billion to $0.95 billion (i.e. by $2.05 billion) and its interest income remained unaffected ($12
billion). The sum of incomes and expenses in the whole economy equals, naturally, zero as
the interest income of one sector represent interest expenses of another ones.
But who has paid for the central bank’s additional net income (and thus for the increased
income of the government budget) resulting from implementation of the zero-interest-bearing
reserve requirements? The additional profit balances additional losses of enterprises
(higher interest expenses) and households (lower interest income). We have, therefore,
proved that zero-interest-bearing reserve requirements represent taxation of enterprises and
households.
To summarize, zero-interest-bearing reserve requirements (or reserve requirements bearing
interest rate lower than the interbank interest rate) impact income statement in a similar way
as an issue of currency. Nevertheless, taxation by virtue of currency is paid directly by holders
(i.e. particularly households and enterprises) but taxation by virtue of zero-interest-bearing
107
reserve requirements is paid by commercial banks. Commercial banks naturally seek to
transfer this taxation to their clients by means of higher interest on loans and lower interest on
deposits.
1.5 The basics of financial statements
Financial statements should inform their users (investors, creditors, regulators and other
stakeholders) about the financial condition and results of operations of an entity. However,
such statements cannot provide all the information needed for economic decision-making by
users because, among other things, they are based solely on past events and usually do not
include non-financial performance indicators. In addition, financial statements in many
countries are used primarily to determine the tax base which is a different purpose yielding a
different result than the reporting of economic performance.
In this section, we will briefly introduce generally accepted accounting principles of the
United States (US GAAP), international financial reporting standards (IFRS) and
corresponding legislation of the European Union. We will also present the role of financial
statements in financial regulation.
1.5.1 US generally accepted accounting principles
Since the United States is the world's largest economy and its financial markets are the largest
and most liquid in the world, it follows that US GAAP had for years generally been
considered the most sophisticated accounting system in the world and set the pace in the
world's development of accounting standards. Nevertheless, significant differences in
accounting standards existed from country to country making comparisons between
companies in the same industry in different countries difficult.
The legal authority over financial reporting for publicly traded companies in the US is the
Securities and Exchange Commission or SEC (established by the Securities Exchange Act of
1934). However, over the years, the SEC has relied heavily on the private sector for the
establishment of US GAAP. For the past few decades, the body responsible for establishing
accounting standards in the United States has been the Financial Accounting Standards Board
(FASB) located in Norwalk, Connecticut. The FASB consists of seven independent experts
with backgrounds in public practice, industry, regulation, academia and the investment
community supported by a large staff developing standards based on research and public

108
deliberation with full due process to get the input of all user groups. Newly adopted standards
attempt to balance economic benefits with implementation and other costs.
With the tremendous growth in cross border investing and the resulting demand for a common
language of financial reporting throughout the world, the FASB and International Accounting
Standards Committee (IASC)headquartered in London reached an agreement in September
2002 to work towards the convergence of existing US and international accounting standards
and the joint development of future standards. As a result, all major projects for the
development of new and modified accounting standards are currently being worked on jointly
by the two standard setting bodies.
Both US and international standards are based on similar general principles but US GAAP
generally contains more detailed rules about how to apply and implement standards in
practice. The reason for this, in the view of many, is the influence of the powerful SEC which
is concerned about diminishing the possibility of evading general principles as well as the
desire by some auditors and companies for exact rules which can be used as a defence against
potential lawsuits and other challenges in a litigious society. As a result, US GAAP generally
contains few alternatives which, some would argue, assure greater comparability of reported
data.
1.5.2 International Financial Reporting Standards
International financial reporting standards (IFRS) are developed by the International
Accounting Standards Board (IASB) which is an independent, privately-funded accounting
standard-setter based in London. There are 14 Board members, each with one vote. The
International Accounting Standards Committee Foundation (IASCF) Constitution provides
that the Trustees shall “select members of the IASB so that it will comprise a group of people
representing, within that group, the best available combination of technical skills and
background experience of relevant international business and market conditions in order to
contribute to the development of high quality, global accounting standards.” The IASB is
committed to developing, in the public interest, a single set of high quality, understandable
and enforceable global accounting standards that require transparent and comparable
information in general purpose financial statements. In addition, the IASB co-operates with
national accounting standard-setters to achieve convergence in accounting standards around
the world. It has a specific and ambitious program of convergence with the FASB (see
paragraph 1.6.1 above).

109
More than 90 countries either require or permit the use of IFRS for publicly traded companies
beginning in 2005. Some other jurisdictions, including Australia, New Zealand, the
Philippines and Singapore, base their national practices on IFRS. In October 2004, the IASB
and the Accounting Standards Board of Japan agreed to initiate discussions about a joint
project to minimize differences between IFRS and Japanese accounting standards towards a
final goal of convergence of their standards.
1.5.3 EU directives and regulations
In EU, there are strong pressures for unification of accounting standards. Investors need
comparable information. Deutsche Bank, for instance, has developed database of more than
seven hundreds companies that would help it compare companies independently of the local
accounting and tax system. Financial reporting in European Union is subject to the following
directives (for all kinds of businesses):
o Fourth Council Directive 78/660/EEC of 25 July 1978 based on article 54(3)(g) of the
Treaty on the annual accounts of certain types of companies,
o Seventh Council Directive 83/349/EEC of 13 June 1983 based on article 54(3)(g) of
the Treaty on consolidated accounts.
In addition, the financial reporting of banks and financial institutions is subject to:
o Council Directive 86/635/EEC of 8 December 1986 on the annual accounts and
consolidated accounts of banks and other financial institutions.
In reaction to the concept of fair values contained in IAS 39, European Union have published
new directive updating the three directives mentioned above:
o Directive 2001/65/EC of the European Parliament and of the Council of 27 September
2001 amending Directive 78/660/EEC, 83/349/EEC and 86/635/EEC as regards the
valuation rules for the annual and consolidated accounts of certain types of
companies as well as of banks and other financial institutions.
This directive contains the concept of fair value according to which some assets as well as
some liabilities should be first recorded and later measured using the fair value pursuant to
IAS39. Implementation of fair value took place for the reason of practical needs, mainly for
the large companies employ derivatives to manage their financial risks. Proposal of this
directive was originally allowing member countries to exclude some companies off the
obligation to use fair value (e.g. small and medium enterprises, SMEs). However, the

110
Economic and Social Committee refused this option in order to assure comparability of
financial data. Subsequently, the concept of fair value became obligatory.
European Commission further published recommendation amending the disclosure of
information on financial instruments for banks and financial institutions:
o Commission Recommendation of 23 June 2000 concerning disclosure of information
on financial instruments and other items complementing the disclosure required
according to Council Directive 86/635/44C on the annual accounts and consolidated
accounts of banks and other financial institutions (2000/408/EC).
In order to meet the needs of insurance companies, EU has published following directive:
o Council Directive of 19 December 1991 on the annual accounts and consolidated
accounts of insurance undertakings (91/674/EEC).
All companies in EU are subject to rules contained in the 4th and 7th council directive
(78/660/EEC and 83/349/EEC). In addition, banks and other financial institutions are subject
to the particular council directive 86/635/EEC. Nevertheless, differences between individual
member countries still persist. One cannot make general conclusions about how do these
different rules affect corporate profits in individual member countries.
Regulation (EC) No 1606/2002 of the European Parliament and of the Council of 19 July
2002 on the application of IFRS came into force in September 2002. According to this
regulation, starting on 1 January 2005 companies shall prepare their consolidated
accounts in conformity with IFRS if their securities are admitted to trading on a
regulated market of any member state. National legislations can extend the application of
IAS to individual financial statements of these companies as well as to financial statement of
any other entities (both the individual and the consolidated financial statements).
1.5.4 The role of accounting in regulation of financial institutions
Any regulation of financial institution is concerned about the accounting principles raising the
transparency of financial transactions and supporting the proper risk management. It is a key
instrument for stability of banks and other financial institutions. Accounting also serves as a
basis for regulation, mainly for capital adequacy. Regulators, therefore, assist in improvement
of accounting practices. Bank regulators focus their attention on financial instruments,
including loan allowances. Loan allowances are the key item in any bank income statement.

111
The international agreement about this topic has not been reached yet. Accounting measures
assets, liabilities, equity, expenses and income. It also helps to increase the market discipline
by means of transparent reporting. Market discipline will become the third pillar of capital
adequacy. It requires reliable and timely information about the accounting methods including
measurement methods of asset and liabilities, risk management, risk portfolio and equity
composition. This information is important to the public. Reliable risk measurement starts
with accurate measurement. From the regulatory point accounting standards must fulfil the
following criteria: criteria:
o to contribute to the risk management and risk control,
o to maintain the market discipline through transparent financial statements and other
information about accounting methods,
o to facilitate supervision of regulated institutions,
o to provide reliable information about the financial situation of regulated institutions,
o not enable alternative treatments (if it does, it must be published).
For capital adequacy purposes regulators sometimes make correction of the accounting data.
But such corrections should be minimized.
1.6 Financial statements of central bank
In order to understand clearly the balance sheet and income statement of central bank one has
to first be acquaint with the its role. Later, we will examine two structures of the central
bank’s balance sheet, income statements, foreign exchange reserves, seigniorage and causes
of central bank’s losses.
1.6.1 The role of central bank
Central banks were evolving gradually over the whole 20th century. Central bank represents
specific government agency to which the treasury department delegated some of its powers.
The difference between central bank and other government agencies consists in the two
tasks that it fulfils independently on government − monetary policy and granting loans
to the government (if any). In all its remaining tasks, central bank can remain dependent on
the government.

112
The central bank’s profit makes explicit part of the government budget. On the other hand, in
most cases, the central bank’s loss is not explicit part of the government budget but it is
implicit part of the government budget. If it is explicit part of the government budget such a
loss should be covered by taxes or the issue of treasury bonds which is politically in most
countries unacceptable. Transfer of a loss to the government budget is delayed. But one
should take into account that central bank’s economic results make in any case the part of
government budget. Hence, we can assert that any of central bank’s income or expenses is
actually government budget income or expenses. Government budget thus benefits from
the central bank’s profits and pays (with some delay) for its losses. From the point of view of
the tax system, taxation of central bank equals 100 %. Under such circumstances central
bank’s equity has no particular importance. Central bank (as well as any other bank) can
operate with any (or even with negative) equity without any impact on its operations.
Central bank has usually the authority to perform the following roles:
o Monetary policy,
o Central payment system and the administration of the commercial banks’ current
accounts,
o Banking supervision,
o Issue of the currency,
o Administration of the international reserves and realization of foreign exchange
interventions,
o Administration of government accounts,
o Administration of treasury securities auctions,
o Granting loans to government (if any),
o Concern over government budget,
o Financial statistics for local, state and federal authorities,
o Lender of the last resort.
Central bank is not the only institution capable to perform these functions. Any other central
institution could perform it as well. Nowadays, almost all central banks have the monopoly to
issue banknotes. However, there are certain exceptions to this rule, namely in Hong Kong and
Scotland where commercial banks issue banknotes under the supervision of central banks.

113
The absolute majority of central banks are in charge of monetary policy. Other tasks (e.g.
central payment system, banking supervision, administration of international reserves,
realization of foreign exchange interventions, and administration of the treasury securities
auctions) often remain under the treasury department or other government agency. Central
bank exist in almost any country (sometimes it is called monetary authority).
a) Monetary policy
Monetary policy will be discussed in the second chapter of this book.
b) Central payment system and the administration of commercial banks’ current
accounts
Central payment system will be discussed in the third chapter of this book.
c) Banking supervision
The task of banking supervision is to avoid bank bankruptcies and thus protects clients’
deposits. In some countries, the bank supervision is not carried out by central bank but by
special government agency.
d) Issue of currency
The issue of currency (banknotes and coins) is central bank’s duty. Commercial banks pay for
currency from their clearing accounts with central bank. Commercial banks do not need the
currency for themselves but for their clients. To issue currency central bank must draft the
graphical design of banknotes and coins and print (stamp) them. It also has to liquidate the
used up ones. The banknotes are almost in any country issued by central bank. In some
countries, however, central bank issues banknotes and the treasury department issues coins
(e.g. in the United States).
e) Foreign exchange reserves administration and realisation of foreign exchange
interventions
Foreign exchange reserves administration is covered by subsection 1.7.4 and foreign
exchange intervention is the topic of section 2.9.

114
f) Administration of government accounts
Government disposes of the enormous budget. In modern economies, government
redistributes frequently from 30 to 60 % of the gross domestic product. Central bank usually
administers the government current account. Any government revenues and expenditures run
through this account. The majority of these revenues and expenditures change commercial
banks’ reserves with central bank by the amount of a given payment. On the other hand,
transactions between government and non-bank clients of central bank and transactions
between government and central bank itself do not affect bank reserves.
g) Administration of treasury securities auctions
Since the government budget is almost never balanced or even in surplus, governments often
needs to borrow money from commercial banks or from public (i.e. from enterprises and
households). In certain countries, government even borrows from its central bank (this issue
will be discussed in the next paragraph). To finance its deficits, government usually issues
treasury securities (T-bills, T-notes and T-bonds). However, borrowing money is hardly the
way to solve fiscal problems in a long-term if the government doesn’t start to control its
expenditures.
When granting a loan, commercial bank looks primarily at the return on this loan. Banks,
therefore, do not grant loan to eighty years old individual for her repayment capacity is
minimal. Contrariwise, the state never dies. Its repayment capacity does not diminish with age
and if the economy grows, debts do not represent serious danger. Many governments pull
their debts onwards as huge snowballs. The debt increases with further deficits. The question
is how huge the ball could be to allow government repaying it. Public debts in countries like
the USA or EU amounts frequently to 70 % of the gross domestic product without causing
serious troubles. On the contrary, Argentina was unable to manage the public debt amounting
only to 55 % of GDP. The answer depends on numerous factors. The most important one is
the overall economic development. Systematic accumulation of deficits necessarily results in
currency devaluation. Anyway, present debt of any government represents future taxation.
The Maastricht Treaty (1991) has imposed the upper limit of yearly budget deficit of EU
countries equal to 3 % of GDP. Member country that fails to meet Maastricht criteria could be
penalized by the amount of up to 0.5 % of GDP and forced to reduce its deficit under the
required level within the next twelve months. Theoretically, several budgetary cuts would
suffice to meet criteria again. However, electorate does not like economy measures. Social

115
expenditures (e.g. education) represent the major part of the government budget and,
therefore, financial trap to any democracy. The first EU country that failed to meet budgetary
criteria was Portugal whose deficit amounted in 2001 to 4.1 % of GDP. Another important
budgetary item is the debt service. Cuts in this field are out of question. Debt service
represents a heavy burden reminding that debts are not for free. The debt service in Portugal,
for instance, amounts to one third of the government budget.
Some issues of treasury securities and subsequent government spending affect monetary
aggregates. Example 1.40 shows how government that issues securities by selling it to client
of commercial bank uses the raised funds for social transfer to households. Example 1.41
shows government that issues securities by selling it to commercial bank uses the raised fund
for social transfer to households. It is obvious that in the first case monetary aggregates did
not change since the money goes eventually from the client X’s current account (buyer of
treasury securities) to the client Y’s current account (recipient of social transfer). Roughly
speaking, both transactions in Example 1.40 represent the loan granted by one non-banking
unit to another non-banking unit (similar to Example 1.1). Conversely, there is an increase of
monetary aggregates in the second case. The purchase of the treasury securities by
commercial bank does not affect monetary aggregates. Nevertheless, the consequent
government spending in the form of social transfer increases the recipient’s current account
balance. The second case is equivalent to the granting loan by bank to its client (similar to
Example 1.2).
We can summarize that issue of treasury bonds with subsequent government spending:
o does not change monetary aggregates if non-bank entities buy the treasury
securities (even if there is no change of monetary aggregates, the operation has
positive impact on inflation because the money change hands from non-spending
individuals to spending individuals) and
o change monetary aggregates if commercial banks buy the treasury securities (the
operation has positive impact on inflation because spending individuals receive
money).
The government usually spends the raised funds very soon and thus in both cases stimulates
inflationary pressures.

116
Example 1.40 The issue of treasury securities, purchase of these securities by client, and subsequent social transfer
Bank A
Central bank
1) Client X of bank A pays $400 to government for treasury securities 2) Government transfers $400 to client Y of bank B (social transfer)
Opening balance 1) $400
Clearing account with central bank
1) $400 Opening balance
Clearing account of bank A
1) $400 Opening balance
Client X’s current account
Opening balance 2) $400
Clearing account of bank B
2) $400 Opening balance 1) $400
Government’s current account
Client X
Opening balance 1) $400
Current account with bank A
Opening balance 1) $400
Treasury securities

117
Example 1.40 Continuation
Bank B
Opening balance 2) $400
Clearing account with central bank
Opening balance 2) $400
Client Y’s current account
Client Y
Opening balance 2) $400
Current account with bank B
Opening balance 2) $400
Income
Government
Opening balance 1) $400
2) $400
Current account with central bank
2) $400
Expenses
1) $400
Treasury securities issued

118
Example 1.41 Issue of treasury securities, their purchase by bank and subsequent social transfer
Bank A
Central bank
1) Bank A pays $400 to government for treasury securities 2) Government transfers $400 to client Y of bank B (social transfer)
Opening balance 1) $400
Clearing account with central bank
1) $400 Opening balance
Clearing account of bank A
2) $400
Clearing account of bank B
2) $400 1) $400
Government’s current account
Client Y
1) $400
T-bonds
2) $400
Income
2) $400
Current account with bank B
Bank B
2) $400
Clearing account with central bank
2) $400
Client Y’s current account

119
Example 1.41 Continuation
There are three possible kinds of the treasury securities issue, namely the auction treasury
securities issue, permanent treasury securities issue and the issue by selling treasury securities
to the limited number of interested persons. The administrator of any kind of treasury
securities issue can be central bank.
In case of the auction treasury securities issue administrator announces the day when it
means to sell a given amount of treasury securities. It also announces the period for bids.
Consequently, it distributes treasury securities to bidders starting with the highest bids. If the
bidders’ demand outstrips the available amount of securities, government meets only the
highest bids. Successful bidders purchase treasury securities for prices that they have bid
(English auction, American auction) or for the price of the last settled bid (Dutch auction,
uniform price auction). English auction allows government to sell the given amount of
treasury securities for the highest revenue possible but the issue price of treasury securities is
not homogeneous (taxation of such bonds could bring other difficulties). Contrariwise, Dutch
auction does not bring such kind of problems but it does not allow government to get the
highest revenue possible.
The auction treasury securities issue is widely used as the main kind of treasury securities
issue. It assures that government raises approximately funds that it needs. However, there
remains certain uncertainty about the exact price of treasury securities and about the interest
rate that the government will have to pay. Sometimes, government announces the minimum
price acceptable.
Government
Opening balance 1) $400
2) $400
Current account with central bank
2) $400
Expenses
1) $400
Treasury securities issued

120
In case of the permanent treasury securities issue administrator offers treasury securities for
the announced price (or alternatively for the announced yield to maturity). If the treasury
securities are not sold out on the issue day, government usually starts selling them in smaller
lots. Government has to decide for what yield to maturity to sell it. If it chooses yield too low,
there is a risk of selling only a small amount of securities. Government would be, therefore,
forced to change the sale conditions. It the yield chosen were too high, government would sell
the whole amount of securities but the costs would be unnecessarily high. In such case, it
would burden future generations with high interest.
The method of issue by selling treasury securities to the limited number of interested
persons lies somewhere between the auction and permanent treasury securities issue. It
requires the existence of institutions that underwrite (and charge for it the fee) the whole
amount of unsold treasury securities. These institutions are usually commercial banks.
However, the number of such institutions is limited even in the developed countries. The only
exception is Japan whose banks have almost the exclusive right (and obligation) to buy any
amount of treasury securities. In exchange for this obligation, Japanese banks get certain tax
and interest benefits.
h) Granting loans to government
Central bank should not directly grant loans to central government or to any state or
local governments. In many countries, direct granting of loans is strictly forbidden. In the
rest of countries, government has imposed less strict rules i.e., quantitative limits to both
direct and indirect granting of loans. Such rules can contribute to fiscal discipline. However,
essentials of these rules are not systematic.
The direct granting of loans (including the purchase of treasury securities on primary market,
i.e. directly from the treasury department) by central bank is called monetization13.
Government usually spends the raised funds very soon and thus stimulates inflationary
pressures. The degree of inflationary pressures depends on the size of monetization measured
as a ratio of the amount of loans and volume of monetary aggregates. Example 1.42
introduces monetization and subsequent social transfer of raised funds. Both operations have
increased monetary aggregates (it is equivalent to the situation described in Example 1.41).
13 In some papers the term “monetization” is used both for direct and indirect loans by central bank to government. In rare cases it means even any purchase of assets (e.g. commercial banks’ shares by central bank in Japan).

121
Example 1.42 Monetization and subsequent social transfer
Central bank
1) Central bank grants loan of $400 to the government 2) Government transfers of $400 to client of commercial bank (social transfer)
2) $400
Clearing account of bank A
2) $400 1) $400
Government’s current account
Bank A
2) $400
Clearing account with central bank
2) $400
Client’s current account
1) $400
Loans granted
Client
2) $400
Income
2) $400
Current account with bank A
Government
Opening balance 1) $400
2) $400
Current account with central bank
2) $400
Expenses
1) $400
Treasury securities issued

122
Central bank can also purchase treasury securities at the secondary market whereby it meets
governmental expenditures indirectly. It thus grants indirect loan to the government. If central
bank purchases treasury bonds from commercial bank, monetary aggregates remain
unchanged. If central bank purchases treasury bonds form commercial banks’ clients,
monetary aggregates increase.
We can summarize that monetization is special case of government security issue (see
previous paragraph), i.e. when securities are bought by the central bank. In accordance with
the summary in previous paragraph we can state that monetization with subsequent
government spending:
o change monetary aggregates (the operation has positive impact on inflation
because spending individuals receive money).
The government usually spends the raised funds very soon and thus monetization stimulates
inflationary pressures. When central bank buys treasury securities from commercial
banks, monetary aggregates remain unchanged. Conversely, when central bank buys
treasury securities from the non-bank entities, monetary aggregates increase.
Price deregulations provoked monetary turbulences in almost all post-communist countries in
the nineties of the 20th century. While the small and medium private enterprises have found
themselves with plenty of new opportunities, large enterprises have started to face serious
problems. Many of the state-owned enterprises were unable to adapt themselves to the new
market conditions. During the nineties, many of Central and Eastern European (CEE) central
banks were forced to grant loans to the industrial and agricultural sector. As a result of these
activities, many of CEE countries soon observed increasing inflation. Commercial banks in
Russia, Byelorussia, Ukraine, Romania, Slovakia and Hungary were often asked to grant bad
loans to preferred sectors as well. In Slovenia, it was the case of small farmers and in
Lithuania case of big farmers. Other countries were trying to support and maintain their state-
owned enterprises and exporters. Each of these prestigious groups was granted with “special”
(i.e. subsidised) interest rates. Wide-ranging monetization always causes high inflation and
sometimes-even hyperinflation. Central banks get almost unable to control the growth of
monetary aggregates.
Formal limits on monetization represent one of the key attributes of the central bank’s
independence. Central bank’s independence is supposed to be the necessary condition of
price stability. Central bank that does not have to fear of the incoming elections is not

123
concerned with the short-term monetary expansion. Governments would often like to borrow
(expand) money from central bank in order to speed up (temporarily) the economic activity.
There is no “third party” involved in such transaction. In addition, government would not
have to issue securities and it would, therefore, avoid difficulties related to such issue (e.g.
high risk premium).
Direct borrowing from central bank can also take the form of overdrafts, loans or direct
purchase of securities. These ways seem also very attractive and their use must be, therefore,
strictly controlled. There should be legal limits on central bank’s loans to government. Limits
are usually imposed yearly e.g., the yearly amount of loan granted to government cannot
exceed a given percentage of the government revenues. Such limits are usually constant over
the whole fiscal period. However, countries where the fiscal deficit shows seasonal variations
can impose additional seasonal limits.
It is hard to implement restrictive measures in countries where the financial markets are week
and inefficient or where the securities market does not exists at all. If this is the case, direct
granting of loans (if any) should obey following rules:
o The amount of loans granted to government should be subject to some binding limits
that can be changed only by legal amendment.
o All loans should bear the market interest rate or the law should, at least, impose the
central bank’s responsibility for setting the interest rate.
o All loans should be collaterised, i.e. it should be secured by securities,
o Central bank should prefer short-term securities in order to minimize the interest rate
risk. Long-term securities should bear the variable interest rates.
i) Concern over government budget
Central bank usually takes care about the government budget. This activity is often more
deserving than central bank’s monetary policy since the government interventions,
expenditures and revenues usually affect inflation more than changes of interest rates.
j) Financial statistics for local, state and federal authorities
Central banks usually deliver information about the development of the financial market (e.g.
banking sector statistics and balance of payments). This field is also the one where central
banks employ the most of their staff.

124
k) Lender of last resort
Textbooks on economics often consider central bank to be the lender of last resort, i.e. to be
always ready to grant loans to any commercial bank that would find itself in bank reserves
trouble. For example the commercial bank may be threaten a run, i.e. unexpected withdrawals
of banking deposits caused by the growing concerns about the bank’s financial health. Central
banks were really working as lenders of last resort in the past.
Nowadays, however, central banks do not perform this function anymore and they do not
even declare to perform it. If the central bank intends to help the commercial bank in
bank reserves trouble, it grants it the so-called lombard loan, i.e. the collaterised loan.
Central bank does not grant bank reserves without the eligible collateral. If the central
bank granted the uncollaterised bank reserves, it could soon have found itself with the
impaired claim. Losses resulting from such bad loans would have to be paid by
government (i.e. by taxpayers).
If the commercial bank is gradually getting entangled and if its clients are gradually
withdrawing their deposits, the bank usually starts selling its liquid assets (including assets
eligible as collateral in lombard loans) to other commercial banks or to other commercial
banks’ clients. Depletion of liquid assets necessarily results in the bankruptcy. Lombard loan
cannot be granted since the bank has already sold eligible assets. Hence, central banks do not
perform the role of a lender of last resort anymore.
1.6.2 Three structures of the central bank’s balance sheet
The balance sheet of central bank contains two items that cannot be found in the balance sheet
of any other entity:
o Currency (excluding the vault cash in central bank) on a liability side. Currency in
circulation (i.e. monetary aggregate M0) consists of currency held by the public and
government and it is currency minus the vault cash in commercial banks and central
bank. The amount of currency exceeds slightly currency in circulation.
o Commercial banks’ clearing accounts on a liability side. We call these balances “bank
reserves” or “liquidity of commercial banks held with central bank”. This item does
not make part of any monetary aggregate, i.e. bank reserves are not money.
The amount of currency is out of central bank’s control and depends entirely on the
willingness of household, enterprises, government and commercial banks to hold

125
currency instead of bank deposits, i.e. on the willingness of these entities to change bank
deposits for currency. If the commercial bank needs banknotes or coins (or if there is a
surplus), it simply exchanges it with central banks for the part of its clearing account
balance. The amount of currency does not depend on central bank’s activities. Rationally
thinking entities seek to minimize their holdings of currency for it doesn’t bear interest.
Examples 1.36 and 1.37 clearly demonstrate that every increase of the amount of currency
represents the additional profit to central bank and losses to commercial banks,
households and enterprises. In the examples mentioned above, the currency of the amount
$150 billion have caused central bank’s profit of $9 billion, commercial banks’ loss of $3
billion and the losses of households and enterprises equal $6 billion.
Lower interest rates increase holdings of currency at the expense of bank deposits. The
amount of currency also depends on stability of the banking sector and on the extension of
shadow economy.
In terms of bank reserves, we distinguish three different structures of central bank’s balance
sheet:
o Central bank providing bank reserves on assets side of the central bank’s balance
sheet (Figure 1.5).
o Central bank absorbing bank reserves on liabilities and equity side of the central
bank’s balance sheet (Figure 1.6).
o Central bank providing and absorbing bank reserves (mixed structure) on both the
assets side and liabilities and equity side of the central bank’s balance sheet. During
the year there are some operations providing bank reserves and some operations
absorbing bank reserves.
Whether the central bank belongs to the first or to the second structure depends in
particular on the volume of central bank’s assets (excluding provided bank reserves) and
the volume of currency and required bank reserves. In some countries central bank’s
assets (excluding the provided bank reserves) consist solely of foreign reserves (in some
countries, foreign exchange reserves are being managed by the treasury department). In
such countries the amount of bank reserves (provided or absorbed) depends mainly
on the central bank’s exchange rate policy, i.e. on its foreign exchange reserves. In
some countries central bank’s assets (excluding provided bank reserves) consist solely of
government securities (the United States, Japan etc.).

126
Central bank providing bank reserves
Assets excluding the provided bank reserves (e.g. foreign exchange reserves)
Provided bank reserves (for example over-night loans granted to
commercial banks
Currency
Clearing accounts of commercial banks (i.e. liquidity)
Commercial banks
Other assets (especially credits granted to clients) Other liabilities and capital
(especially clients’ deposits )
Clearing accounts with central banks (i.e. liquidity)
Provided bank reserves (for example over-night loans granted to
commercial banks)
Figure 1.5 Banking system with central bank providing bank reserves
According to section 1.3 the central bank regulates the overall amount of bank reserves
in such a way that commercial banks as a whole are able to meet reserve requirements.
If there is a lack of bank reserves then central bank provides bank reserves (Figure 1.5).
If there is an excess of bank reserves then central bank absorbs bank reserves (Figure
1.6).
The majority of the central banks operate in the regime of delivering bank reserves (Eurozone,
the United Kingdom etc.) or in the regime of mixed model (the United States, Japan etc.). The
provided bank reserves can take different legal forms, for instance, the form of overnight
loans granted by central bank to commercial banks.

127
Central bank absorbing bank reserves
Assets (e.g. foreign exchange reserves)
Absorbed bank reserves (for example term deposits, accepted loans, issued debt securities for commercial banks)
Currency
Clearing accounts of commercial banks (i.e. liquidity)
Commercial banks
Other assets (especially credits granted to clients)
Other liabilities and capital (especially clients’ deposits )
Clearing accounts with central banks (i.e. liquidity)
Absorbed bank reserves (for example term deposits, accepted loans, issued debt securities for commercial banks)
Figure 1.6 Banking system with central bank absorbing bank reserves
The regime of absorbing bank reserves is used only in a small number of countries (e.g. in
Czech republic, Slovakia). The absorption of bank reserves is mainly the result of central
bank accumulation of huge amount of foreign exchange reserves. The absorbed bank reserves
can take different legal forms, for instance, term deposits, accepted loans, and issued debt
securities for commercial banks.

128
Central bank providing bank reserves
Assets excluding the provided bank reserves (e.g. FX reserves)
Provided bank reserves (for example over-night loans granted to
commercial banks)
Currency
Clearing accounts of commercial banks (i.e. liquidity)
Commercial banks
Other assets (especially credits granted to clients)
Other liabilities and capital (especially clients’ deposits )
Clearing accounts with central banks (i.e. liquidity)
Provided bank reserves (for example over-night loans granted to
commercial banks)
Figure 1.7 Banking system with central bank providing bank reserves facing increased conversions of deposit into currency
What would happen if clients started to withdraw massively their deposits from commercial
banks, i.e. if they started converting massively deposits into currency? Let’s suppose, for
example, that central bank is absorbing bank reserves (Figure 1.7). Then:
o Conversion of deposits into currency reduces the amount of bank reserves to absorb.
The balance sheet total of commercial banks decreases (bank reserves and client’s
deposits decrease) and the balance sheet total of central bank remains unchanged
(currency replaces bank reserves).

129
o Let’s the conversion of deposits into currency reaches the level that there is no need
for the absorption of bank reserves. Further conversion compels the central bank to
start providing bank reserves. The balance sheet total of commercial banks remains
unchanged (bank reserves replaces client’s deposits) and the balance sheet total of
central bank starts rising (bank reserves and currency increase). In an extreme case,
client’s deposits with commercial banks completely disappear.
If the conversion of client’s deposits into currency were distributed between commercial
banks in proportion to client’s deposits, there would be no danger of collapse of any
commercial bank. There would be only a certain redistribution of interest expenses and
income among central bank, commercial banks, household, enterprises and government.
Central bank’s profit increases (its interest expenses diminish) at the expense of currency
holders, i.e. households, enterprises and government (their interest income decreases) and at
the expense of commercial banks (their interest expenses rise). In commercial banks higher-
interest-bearing bank reserves replace low-interest-bearing deposits of clients.
1.6.3 Examples of the central bank’s financial statements
The careful study of any central bank’s financial statements provides useful insight view on
the central bank. Central bank usually pursues fewer transactions than ordinary commercial
bank. In addition, these transactions are easy to operate and central bank needs, therefore,
only a relatively limited number of dealers. In this subsection, we will introduce the balance
sheets and income statements of the Fed, the European Central bank, the Bank of Japan and
the Bank of England. Items in both statements are not harmonised between central banks and
thus items are not comparable.
a) Balance sheet and income statement of the Fed
Table 1.5 and 1.6 show the balance sheet and income statement of the Fed as of December 31,
2004. Fed does not use the U.S. generally accepted accounting principles (US GAAP) but its
own accounting principles. The Board of Governors audits every year all of Federal Reserve
banks. In addition, Federal Reserve banks as well as the Board of Governors are subject to
audit of the General accounting office (GAO). Each Federal Reserve Bank has its own
internal auditor governed by the Board of Governors.

130
Table 1.5 Balance sheet of the Fed as of December 31, 2004 in millions U.S. dollars
Assets
Gold certificates Special drawing rights certificates Coin Loans to depository institutions Securities purchased under agreements to resell (tri-party) U.S. treasury securities bought outright Items in the process of collection Bank premises Assets in foreign currencies Other assets
11,0412,200
728 44
33,000717,819
7,9641,778
21,36819,004
Total assets 814,946
Liabilities and Equity
Federal Reserve notes outstanding, net Securities sold under agreements to repurchase Deposits
- Depository institutions - U.S. Treasury, general account - Foreign, official accounts - Other
Deferred credit items Other liabilities and accrued dividends Total liabilities Equity paid-in Surplus Total equity
719,43730,783
24,0435,912
801,2887,0382,821
791,40211,91411,63023,544
Total liabilities and equity 814,946Source: http://www.federalreserve.gov
The Fed’s balance sheet is relatively simple. The assets side consists mainly of U.S. Treasury
securities ($718 billion), reverse repos ($33 billion) and foreign exchange assets ($21billion).
Any of these items delivers bank reserves. In the United States, foreign exchange reserves are
administered partly by Fed and partly by the U.S. Department of the Treasury. Liabilities and
equity side consists mainly of banknotes ($719 billion) coins are issued by the U.S.
Department of the Treasury, deposits of depository institutions ($24 billion) and repos ($31
billion). Total income for 2004 amounted to $23,540 million mainly due to interest income
resulting from holdings of U.S. Treasury securities ($22,344 million). Total expenses
amounted to $2,239 million with the main item being salaries and other personal expenses
($1,350 million). Interest expenses were negligible. The profit of the Fed reached $21,301
million. Profit after additions and deduction was $21.443 million. From this amount the Fed
transferred $582 million to its shareholders (member banks), $18.078 million to the U. S.
Department of the Treasury (approximately the Fed’s seigniorage) and the remaining part of
$2,783 billion) was transferred to the surplus equity.

131
Table 1.6 Income statement of the Fed for the year 2004 in millions U.S. dollars
Income
Loans U.S. Treasury securities Foreign currencies Priced services Other
322,344
26986658
Total income 23,540
Expenses
Salaries and other personal expenses Retirement and other benefits Fees Travel Software expenses Postage and other shipping costs Communications Materials and supplies Building expenses Equipment Earnings-credit costs Other Recoveries Expenses capitalized Reimbursements
1,3502779757
117871446
22725211671
-79-23
-370Total expenses 2,239
Profit or loss 21,301Source: http://www.federalreserve.gov
Financial situation of the Fed is, therefore, very simple as U. S. Treasury securities
approximately cover the issue of dollar banknotes. Fed receives interests resulting from
holding of U. S. Treasury securities and it pays seigniorage to the government. These amounts
get weekly compensated and what is paid in only the resulting amount.
b) Balance sheet and income statement of the European central bank
Tables 1.7 and 1.8 show the balance sheet and income statement of ECB as of December 31,
2002. The ECB does not use the International Financial Reporting Standards but its own
accounting principles. A Table 1.9 introduces the balance sheet of the Eurosystem (i.e. ECB
and twelve national central banks) as of December 31, 2004. Eurosystem does not publish the
income statement.

132
Table 1.7 Balance sheet of the ECB as of December 31, 2004 in millions euro
Assets
Gold and gold receivables Claims on non-euro area residents in foreign currency
- Receivables form the IMF - Balances with banks and security investments, external loans and other external assets
Claims on euro area residents in foreign currency Claims on non-euro area residents in euro Intra-Eurosystem claims
- Claims related to the allocation of euro banknotes within the Eurosystem - Other claims within the Eurosystem (net)
Other assets - Tangible fixed assets - Other financial assets - Accruals and prepaid expenses - Sundry
Loss for the year
7,928
16426,9392,552
88
40,1003,410
1886,429
7717
1,636Total assets 90,212
Liabilities and Equity
Banknotes Liabilities to euro area residents in euro Liabilities to non-euro area residents in euro Liabilities to euro area residents in foreign currency Liabilities to non-euro area residents in foreign currency Intra-Eurosystem liabilities Other liabilities
- Accruals and income collected in advance - Sundry
Provisions Revaluation accounts Equity and reserve funds
- Equity - Reserves
40,1001,050
1375
1,25539,782
1,137328111
1,921
4,089297
Total liabilities and equity 90,212Source: http://www.ecb.int

133
Table 1.8 Income statement of the ECB for the year 2004 in millions euro
Income and expenses
- Interest income on foreign reserve assets - Interest income arising from the allocation of euro banknotes within the Eurosystem - Other interest income
Interest income - Remuneration of NCBs’ claims in respect of foreign reserves transferred - Other interest expense
Interest expense Net interest income Realised gains/losses arising from financial operations Write-downs on financial assets and positions Net result of financial operations, write-downs and risk provisions Net expense from fees and commissions Other income Total net income Staff costs Administrative expenses Depreciation of tangible fixed assets Banknote production services
423733
1,4562,612-693
-1,229-1,922
690136
-2,093-1,957
05
-1,262-161-176-34-3
Profit or loss -1,636Source: http://www.ecb.int
The asset side of the Eurosystem balance sheet consists mainly of reverse repos (€345 billion)
delivering bank reserves. Foreign exchange assets represent €144billion. Liabilities and equity
side consists mainly of currency (€501 billion) and clearing accounts (€139 billion).
Eurosystem is issuing banknotes since January 1, 2002. Eight percent of banknotes are
allocated to ECB. ECB is managing the issue of banknotes. It can also delegate the issue right
to euro area member countries. Out of the total amount of banknotes (€501 billion) only
banknotes for €40.1 billion belong to ECB (i.e. make part of its balance sheet). Remaining
banknotes belong to central banks of euro area member countries. The ECB balance sheet
contains claim of €40.1 billion by reason of the banknotes allocation within the Eurosystem.
Balance sheets of national central banks contain liabilities by reason of the banknotes
allocation within the Eurosystem amounting to €40.1 billion. Individual euro area member
countries issue their eurocoins. Eurocoins of the same nominal value differ in their “national
sides”.
The ECB’s equity is approximately €4 billion. This equity shall be increasing with every new
country joining the Eurosystem. Increases of equity will follow the so-called “capital key”
that represents the combination of two factors, namely the country’s share of the total EU
population and its share on the gross domestic product of whole union.
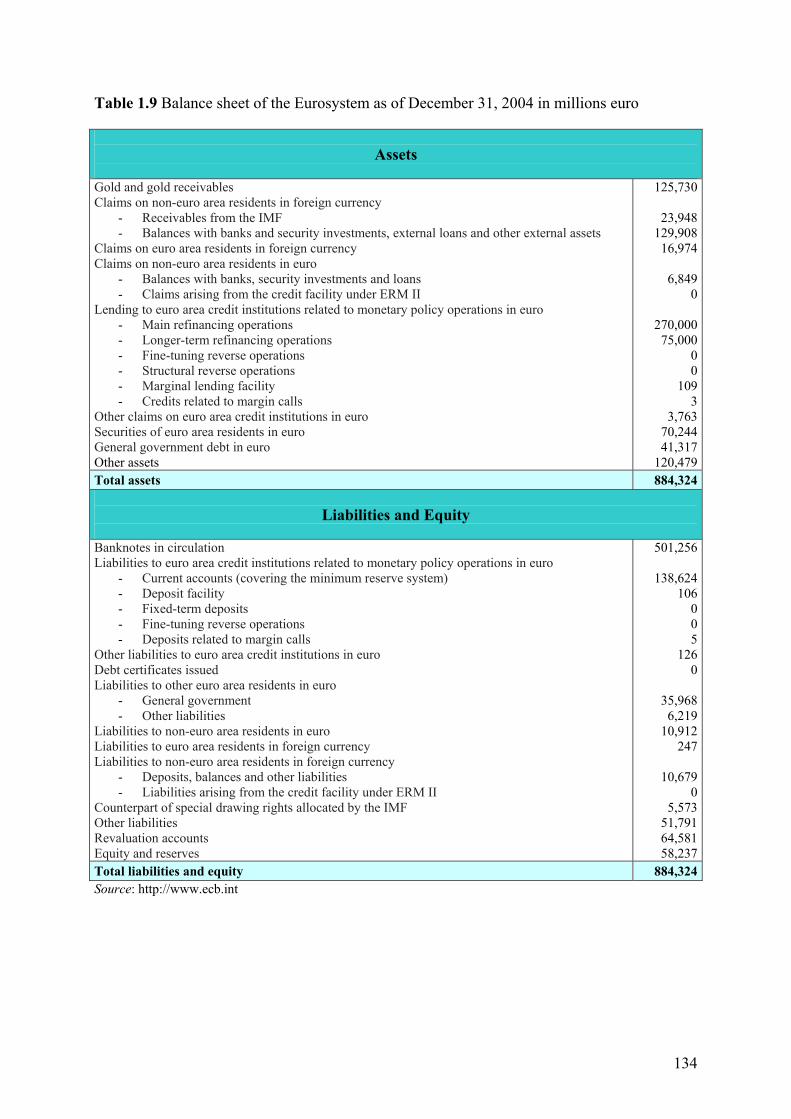
134
Table 1.9 Balance sheet of the Eurosystem as of December 31, 2004 in millions euro
Assets
Gold and gold receivables Claims on non-euro area residents in foreign currency
- Receivables from the IMF - Balances with banks and security investments, external loans and other external assets
Claims on euro area residents in foreign currency Claims on non-euro area residents in euro
- Balances with banks, security investments and loans - Claims arising from the credit facility under ERM II
Lending to euro area credit institutions related to monetary policy operations in euro - Main refinancing operations - Longer-term refinancing operations - Fine-tuning reverse operations - Structural reverse operations - Marginal lending facility - Credits related to margin calls
Other claims on euro area credit institutions in euro Securities of euro area residents in euro General government debt in euro Other assets
125,730
23,948129,908
16,974
6,8490
270,00075,000
00
1093
3,76370,24441,317
120,479Total assets 884,324
Liabilities and Equity
Banknotes in circulation Liabilities to euro area credit institutions related to monetary policy operations in euro
- Current accounts (covering the minimum reserve system) - Deposit facility - Fixed-term deposits - Fine-tuning reverse operations - Deposits related to margin calls
Other liabilities to euro area credit institutions in euro Debt certificates issued Liabilities to other euro area residents in euro
- General government - Other liabilities
Liabilities to non-euro area residents in euro Liabilities to euro area residents in foreign currency Liabilities to non-euro area residents in foreign currency
- Deposits, balances and other liabilities - Liabilities arising from the credit facility under ERM II
Counterpart of special drawing rights allocated by the IMF Other liabilities Revaluation accounts Equity and reserves
501,256
138,624106
005
1260
35,9686,219
10,912247
10,6790
5,57351,79164,58158,237
Total liabilities and equity 884,324Source: http://www.ecb.int

135
The ECB made a loss of €1,636 million for 2004. This loss was due to the development of
exchange rates which affected the value, in euro terms, of the ECB’s holdings denominated in
foreign currency. This loss has been partially offset against the general reserve fund (€296
million) and against the payments allocated to the national central banks (€1,340 million)
according to he capital key.
c) Balance sheet and income statement of the Bank of Japan
Table 1.10 and 1.11 show the balance sheet and income statement of the Bank of Japan as of
March 31, 2004. The ECB does not use the International Financial Reporting Standards but its
own accounting principles.
Table 1.10 Balance sheet of the Bank of Japan as of March 31, 2004 in billions yen
Assets
Gold Deposits at foreign central banks and the Bank for International Settlements Receivables under resale agreement Bills purchased Government securities Asset-backed securities Pecuniary trusts (stocks held as trust property) Loans and bills discounted Foreign currency assets Deposits with agents Other assets Premises and movable property Provisions for possible loan losses
441285
11,13427,219
100,022120
1,948141
4,1663,083
697240
-114Total assets 149,382
Liabilities and Equity
Banknotes Deposits (excluding those of the government) Deposits of the government Payables under repurchase agreements Bills sold Other liabilities Provisions Profit of the year Equity
71,40337,07213,08019,8842,571
352,784
492,494
Total liabilities and equity 149,382Source: http://www.boj.or.jp

136
Table 1.11 Income statement of the Bank of Japan for the fiscal year 2003/2004 in billions yen
Income
Interest on receivables under resale agreement Discounts on bills purchased Interest and discounts on government securities Interest and discounts on foreign currency assets Loans and discounts on foreign currency securities Gains on sale and redemption of government securities Gains on sale, purchase, and redemption, and gains arising from revaluation of foreign currency assets Other operating income Special gains
14
1,429189
23
587870
Total income 1,834
Expenses
Losses on sale and redemption of government securities Losses on sale, purchase, and redemption, and losses arising from revaluation of foreign currency assets General and administrative expenses and costs Other general and administrative expenses
1,129
37723148
Total expenses 1,785
Profit or loss 49Source: http://www.boj.or.jp
The asset side of the balance sheet consists mainly of government securities (¥100 trillion)
and bills purchased (¥11 trillion). Both items deliver bank reserves. Foreign exchange assets
represent only ¥4 trillion. Liabilities and equity side consists mainly of banknotes (¥71
trillion) and clearing accounts (¥37 trillion) coins are issued by the government. The equity
is approximately ¥2 trillion. The Bank of Japan made a profit of ¥49 billion for a fiscal year
ended March 31, 2004. Due to tax refund after tax profit amounted to ¥55 billion. From this
amount the Bank of Japan transferred ¥8 billion to its legal reserves and ¥47 billion to
government. y.
d) Balance sheet and income statement of the Bank of England
The financial statements of the Bank of England are divided in two sets. The first set deals
with the Issue Department and the second set relates to the Banking Department. The Bank of
England use U.K. accounting standards.

137
Table 1.12 Balance sheet of the Issue Department of the Bank of England as of February 28,
2005 in millions pound
Assets
Securities of, or guaranteed by, the British Government Other securities and assets including those acquired under reverse repurchase agreements
14,05921,361
Total assets 35,420
Liabilities
Banknotes - in circulation - in Banking Department
35,4164
Total liabilities and equity 35,420Source: http://www.bankofengland.co.uk
Table 1.13 Income statement of the Issue Department of the Bank of England for the fiscal year 2004/2005 in millions pound
Income
Securities of, or guaranteed by, the British Government Other securities and assets
6411,022
Total income 1,663
Expenses
Cost of production of banknotes Cost of issue, custody and payment of banknotes Other expenses
3112
2Total expenses 45
Profit or loss (payable to the Treasury) 1,618Source: http://www.bankofengland.co.uk
Table 1.12 and 1.13 show the balance sheet and income statement of the Issue Department of
the Bank of England as of February 28, 2005. The asset side of the balance sheet consists of
government securities (£14,059 million) and other assets including reverse repos (£21,361
million). Liabilities (there no equity) consists from issued banknotes (£35,420 million). The
Royal Mint (a government agency) is responsible for the production and issue of coins
throughout the United Kingdom The entire profit of £1,618 million (i.e. seigniorage) is
transferred to the Treasury.

138
Table 1.14 Balance sheet of the Banking Department of the Bank of England as of February
28, 2005 in millions pound
Assets
Cash Items in course of collection Due from the European Central Bank in respect of TARGET Loans and advances to banks and customers Debt securities Equity investments and participating interest Shares in group undertakings Tangible fixed assets Prepayments, accrued income and other assets
4351112
12,5648,248
4018
196609
Total assets 22,142
Liabilities and Equity
Deposits by central banks Deposits by banks and building societies Customer accounts Debt securities in issue Other liabilities Equity subscribed Revaluation reserves Profit and loss account
9,8172,3411,2925,9141,180
15151
1,432Total liabilities and equity 22,142Source: http://www.bankofengland.co.uk
Table 1.14 shows the balance sheet of the Banking Department of the Bank of England as of
February 28, 2005. The income statement is not available but some of the elements of this
income statement are contained in footnote. The asset side of the balance sheet consists
mainly of reverse repos (£12,564 million) and debt securities (£8,248 million). Both items
deliver bank reserves. Liabilities and equity side consists mainly of deposits of central banks
(£9,817 million), issued debt securities (£5,914 million) and clearing accounts (£2,341
million). The equity is £1,598 million. The Banking Department made a profit of £100 million
for a fiscal year ended February 28, 2005. From this amount the Bank of England transferred
£38 million to the Treasury (under the Bank of England Act 1946), £24 million to the
Treasury (tax) and £38 million retained on profit and loss account.
1.6.4 Administration of the international reserves
According to International Monetary Fund (IMF), international reserves (foreign exchange
reserves) represent the part of the balance of payments’ financial account consisting of liquid

139
assets denominated in foreign currencies employable to finance directly payment instability
and to regulate indirectly the size of instability by means of foreign exchange intervention.
Foreign exchanges reserves thus consists of deposits with foreign banks, loans granted, stock
of foreign securities, gold, foreign currencies, special drawing rights (SDR) and reserve
position with IMF administered by central bank or by another central institution (e.g. treasury
department).
Since 1997 to 2002, the world international reserves increased by 32 % to $2,104 billion. At
the beginning of 2003, eastern Asia countries held more than a half of this amount. Japan was
the country holding the highest amount of international reserves ($546 billion). China held
international reserves amounting $286.4 billion as per the end of 2002 and $356,5 billion as
per July 31, 2003. Also Southern Korea, Hong Kong, Singapore and Thailand have reached
their records. These countries have accumulated huge international reserves to maintain weak
currencies to help their exports, which is needed to save and create jobs, thereby absorbing
abundant labour in traditional sectors. International reserves of Russian Federation are
gradually increasing as well (from $36.5 billion held at the end of the year 2001 to $47.8
billion held at the end of the year 2002).
The most part of foreign exchange reserves takes form of U.S. treasury bonds, which play
important role in financing the U.S. trade deficit (foreign entities invest, therefore, their
dollars back to the USA). If Asian banks were not holding these amounts of reserves, the
exchange rate of dollar would be much lower. Asian countries accumulate international
reserves since they still remember impacts of the Asian currency crisis at the end of nineties.
This crisis has fast withdrawn international reserves in the majority of affected countries.
Nowadays, Asian international reserves (excluding Japan) have already exceeded the gross
domestic product by more than 20 %. By maintaining their exchange rates weak, central
banks seek to support domestic exporters. Southern Korean Won, Thai Baht or Singapore
dollar are not as strong as the surplus of their balance of payments would suggest. In average,
Asian currencies (excluding Japanese Yen) are undervaluated by more than 20 %.
International reserves consist mainly of the U.S. dollars. As the value of U.S. dollar is falling,
value of these reserves is falling too. Central banks have, therefore, started to rearrange their
reserves into Euro. This fact can also explain partly the strength of Euro.
Foreign exchange reserves depend strongly on currency crises. International reserves of
Southern Korea, for instance, were equal $19 billion in 1997 and in time of crisis, reserves fell
to a mere $6 billion. Weakening Won have strongly supported the export and international

140
reserves have fast started to grow again. In August 1999, Southern Korean reserves amounted
to $66 billion and in February 2003, the amount of reserves has even reached $123 billion. On
the contrary, crisis in Hong Kong has caused falling exports and increasing unemployment.
Brazil has experienced crisis a bit later – in a first quarter of 1998. Foreign exchange reserves
of Hungarian central bank exceeded the level of €14 billion in January 2003, although at the
end of December 2002 it was only €10 billion. At that time, speculators were trying to force
exchange rate of Forint/Euro to break the upper bound of the 30 % fluctuation interval.
There are not many ways how central banks can diversify their assets. They are usually not
allowed to purchase corporate bonds and shares. U.S. dollar is the world predominant
reserve currency. Central banks hold dollars, even though they find it risky. One half of the
world trade, approximately, comes through in dollars. The whole Asia, for example,
represents de facto dollar zone. To see why the U.S. dollar has become so attractive, notice,
for instance, that prices of main commodities, like oil, copper, steel, wheat and others, are
denominated using the U.S. currency. Another reason is the liquidity and size of the U.S.
financial market. U.S. dollar also features in more than 40 % of the world foreign-exchange
transactions. U.S. currency plays very important role in countries frequently jeopardized by
high inflation or political instability.
Despite its predominant position, U.S. dollar faces recently certain difficulties. Among the
most serious ones belongs the enormous trade deficit of the United States. U.S. economy has
experienced increasing inflow of foreign investments. In recent years, foreign investors have
started, for the first time within more than hundred years, to earn in the United States more
than their U.S. partners abroad. According to certain analyses, trade deficit was the key factor
causing the rapid fall of U.S. dollar to Japanese yen and German mark in 1995 and to euro
during 2003 and 2004.
Central banks in Europe hold approximately one half of international reserves in euros. Since
the launch of European currency in 1999, euro is gradually increasing its share in the world
foreign exchange reserves. After the World War I, U.S. dollar needed several decades to
replace British pound and Swiss frank in such a manner. The gold is also maintaining its
attractiveness and it represents the second most used reserve asset worldwide.
Higher international reserves can help central bank defend better its currency against sudden
attacks of speculators. This avoids the undesirable high volatility of exchange rate.
Historically, IMF has suggested that countries should hold foreign exchange reserves equal to
the three-month’s import of goods and services. The United States holds a reserve not

141
exceeding its one-month’s import. To strengthen their reserves, some countries need to
employ foreign loans.
International reserves increase when the central bank:
o intervenes against appreciating home currency,
o collects interest on international reserves, and
o accepts foreign currency payments on the account of its clients.
Conversely, international reserves decrease when the central bank:
o intervenes against depreciating home currency, and
o when its clients ask for foreign currency payments from their accounts.
Foreign reserves do not change when central bank’s clients exchange foreign currency for
domestic currency or vice versa.
Foreign exchange interventions depend on the currency regime and balance of payments. In
case of the fixed exchange rate regime, interventions are relatively frequent and the amount of
reserves corresponds exactly to the balance of payments. If there is neither surplus nor deficit,
international reserves do not change. In case of surplus (deficit), reserves increase (decrease).
In case of the floating exchange rate regime, FX interventions do not exist and international
reserves do not follow the evolution of balance of payments.
1.6.5 Seigniorage
We have seen already in subsection 1.7.2 that the balance sheet of central bank contains two
items that cannot be found in the balance sheet of any other entity (excluding the government
when government issues coins), namely currency and bank reserves. Seigniorage relates to the
currency. Currency constitutes the zero-interest liability to central bank and the zero-interest
asset to its holders. In principle, currency represents zero-interest bonds issued by central
bank. It would be technically very difficult to develop method for paying interest on holdings
of banknotes and coins, i.e. to estimate holdings of currency of each individual entity during a
given period.
Seigniorage is the surplus profit of central bank corresponding to the zero-interest cost
of currency. Seigniorage results from the central bank’s monopoly to issue currency and it is
always positive or zero. In such a way central bank imposes implicit tax on currency
holders (i.e. on households, enterprises, government, and commercial banks). The tax base

142
for seigniorage (i.e. the amount of currency) depends on the demand of public for currency.
The tax rate is relatively low approximately the main interest rate of central bank. In many
countries, seigniorage contributes to the government budget. On the other hand, seigniorage is
interest loss of currency holders, since the currency constitutes the zero-interest asset.
Seigniorage thus represents benefit of central bank and, consequently, benefit of central
government. The term seigniorage is also used for benefits of the treasury department
resulting from the circulation of issued coins.
How to calculate the amount of seigniorage? There are two methods of the calculation.
According to the first method the seigniorage is income from asset allocated against currency
minus cost of currency production, custody and distribution. The seigniorage depends which
assets are allocated against currency. In the United Kingdom the seigniorage of the Bank of
England for the fiscal year ended February 28, 2005 amounted to £1,618 million, i.e. it is the
profit of the Issue Department (Table 1.13). This amount was directly transferred to the
Treasury. In the United Kingdom seigniorage is explicit item in financial statements.
Unfortunately in the majority of countries the seigniorage is not explicit item in financial
statements and seigniorage should be calculated by the second method. This method
compares the current financial statements with the hypothetical financial statements where
there is no currency (on liability side) and:
o There are less provided bank reserves (on asset side) for the amount of currency
when central bank provides bank reserves, or
o The currency is replaced by absorbed bank reserves (on liability side) when central
bank absorbs bank reserves.
Seigniorage depends on the average holdings of currency during the given period (e.g. during
the calendar year) and on the average main interest rate of the central bank during the same
period (cost of currency production, custody and distribution is usually omitted):
seigniorage ≈ currency × average main interest rate of the central bank
In case of the Fed, the average currency outside the central bank during 2004 (taking the data
about currency holding at the beginning and at the end of the year) was $704.5 billion
[= (690+719)/2]. The average federal funds rate was 1.34 % (calculated as a weighted
average). Therefore, seigniorage for 2004 was equal to $9.4 billion, since:
seigniorage ≈ $704,5 billion × 0.0134 = $9.4 billion

143
Fed receives interests resulting from holding of U. S. Treasury securities and it pays
seigniorage to the government. These amounts get weekly compensated and what is paid in
only the resulting amount. This amount seems relatively low, since in the course of recent
years the seigniorage was amounting to several dozens of billions. However, we should
consider lower dollar interest rates of that year. Over the last several decades, the amount of
U.S. banknotes held by non-residents has rapidly increased. Estimates show that about two
thirds (from 50 % to 70 %) of dollar banknotes circulate outside the United States. That
means that the U.S. government gets every year the indispensable amount of seigniorage from
abroad. The outside world’s contribution to U.S. federal budget amounted approximately to
$6.3 billion.
In case of the Eurosystem, the average currency outside the central banks during 2004
(taking the data about currency holding at the beginning and at the end of the year) was
€468.5 billion [= (436+501)/2]. The average interest rate of main refinancing operations was
2.00 % (calculated as a weighted average). Therefore, seigniorage for 2004 was equal to €9.4
billion, since:
seigniorage ≈ €468,5 billion × 0.0200 = €9.4 billion
The European Central Bank distributes its profit (including seigniorage) to national central
banks according to the capital key.
In case of the Bank of Japan, the average currency outside the central banks during fiscal
year ended March 31, 2004 (taking the data about currency holding at the beginning and at the
end of the year) was ¥71 trillion [= (71+71)/2]. The average uncollaterised overnight call rate
was 0.001 % (calculated as a weighted average). Therefore, seigniorage for fiscal year ended
March 31, 2004 was equal to ¥0.0 trillion, since:
seigniorage ≈ ¥71 trillion × 0.00001 = ¥0.71 billion
The Bank of Japan distributes its profit (including negligible amount of seigniorage) to the
government.
In case of the Bank of England, the average currency outside the central banks during fiscal
year ended February 28, 2005 (taking the data about currency holding at the beginning and at
the end of the year) was £35.716 billion [= (36.015+35.416)/2]. The average repo rate was
4.53 % (calculated as a weighted average). Therefore, seigniorage for fiscal year ended
February 28, 2005 was equal to £1.572 billion, since:

144
seigniorage ≈ £35.716 × 0.0453 = £1.618 billion
This amount is exactly the seigniorage of £1,618 million using the first method (Table 1.13).
The entire seigniorage of £1,618 million is transferred to the government.
Economists often compare the amount of seigniorage to the gross domestic product or to
budgetary receipts. In the United States, the ratio of seigniorage to GDP amounted in 2004 at
0.1 % (= $9.4 billion / $11,679 billion) and the ratio of seigniorage to U.S. federal budget
receipts amounted 0.5 % (= $9.4 billion / $1,922 billion). On the other hand, Argentinean
seigniorage represented in average 6.2 % of GDP and 46 % of budgetary receipts during the
period from 1960 to 1975. High seigniorage usually follows the high inflation.

145
2 Monetary policy
The second chapter deals with the essentials of monetary policy, monetary policy instruments,
operating targets, intermediate targets, ultimate targets, inflation targeting, monetary policy
transmission mechanism, monetary policy rules, and foreign exchange interventions. The
chapter is closed with description of the monetary policy of the Fed, the Eurosystem, the Bank
of Japan and the Bank of England.
2.1 Essentials of monetary policy
Throughout the centuries, the growth of money stock was considered the decisive factor of the
overall long-term price trends. Currently, the major part of money in developed countries
takes form of clients’ deposits at commercial banks and the governments have transferred
responsibility for monetary development into the hands of central banks.
Monetary policy among countries has converged substantially during the last two decades.
The differences are negligible regardless the way central authorities formulate monetary
policy. Nowadays, monetary policy consists in the regulation of the short-term interest
rates by the central bank with a view to stabilize inflation. That is the core of monetary
policy. Monetary policy exists only in market-oriented countries, for prices in centrally
planned economies are subject to direct regulation.
But inflation does not depend solely on interest rates. There are a number of other factors
determining inflation as well. However, these factors are out of central bank’s control.
Taxation and governmental expenditures are considered to represent one of the key factors.
Central bank’s care for government budget is often more deserving than its monetary policy.
Level of taxation and government expenditures affect inflation more directly and
unambiguously than changes of interest rates.
Monetary policy (Fig. 2.1) is defined as the regulation of the operating target (i.e. the short-
term market interest rate) that the central bank accomplishes by means of monetary policy
instruments in view to achieve operating target, intermediate target and, subsequently, the
ultimate target (usually price stability). This sequence represents the causality chain of
monetary policy. Monetary policy instruments constitute the realisation of monetary policy
and operating target represents its tactics. Monetary policy instruments and operating target
are sometimes called “nuts and bolds” of monetary policy. Intermediate target and ultimate

146
target form the strategy of monetary strategy. Monetary policy transmission mechanism
denotes the way in which the operating target affects the ultimate target. Monetary policy
instruments relate to the everyday realisation of monetary policy, while the planning horizon
for ultimate target is usually several months or even years.
Although the central bank has some power to influence exchange rates (directly by selling or
purchasing foreign currency, or indirectly by changing domestic interest rates), particular
value of exchange rate never represents its ultimate monetary target. If the central bank
influences exchange rate, it does it in view of price stability. Nowadays, monetary policy
denotes exclusively the regulation of interest rates with view to achieve the specific
intermediate target and ultimate target. Monetary policy employs the regulation of the
exchange rate by means of interest rates (or by the direct foreign exchange interventions) only
if the exchange rate is its intermediate target.
Monetary and exchange rate policies shall be regarded primarily as two separate policies even
if the regulation of interest rates can affect indirectly the exchange rate as well. Central bank
regulates the exchange rate directly by means of foreign exchange interventions and indirectly
by interest rate regulation.
We distinguish between two possible settings of the operating target, namely the
accommodative and tight monetary policy. Similarly, we can talk about the anti-inflationary
(hawks) and pro-growth (doves) policies. Accommodative monetary policy consists in
measures taken to lower the short-term interest rates (i.e. to lower the interest rate paid and
charged on the absorbed and provided bank reserves). Central bank lowers thereby all interest
rates in the economy. Commercial banks are therefore willing to grant more loans and their
clients tend to apply for more loans. In addition, both household and enterprises spend more
money, i.e. the velocity of money tends to increase. Accommodative monetary policy is
usually employed to stimulate the economy, i.e. when the economy embodies high interest
rates, weak growth, unemployment and lower inflation expectation. Once the interest rates fall
low enough and the economy gets stimulated, central bank starts to have concern about
inflation again and passes to the tight monetary policy.
Conversely, the tight monetary policy represents series of actions taken to increase the short-
term interest rate (i.e. to increase the interest rate paid and charged on the absorbed and
provided bank reserves). Central bank increases thereby all remaining interest rates in the
economy. Commercial banks are, therefore, willing to grant fewer loans and their clients tend
to ask for fewer loans. In addition, both household and enterprises spend less money, i.e. the

147
velocity of money tends to decrease. Central bank is employing tight monetary policy if there
is a danger of increasing inflation, i.e. when the economy embodies low interest rates, when
there is overheated economy (situation when there is a strong growth connected with
increasing wages and consumer prices), low unemployment and high inflation expectation.
Once the interest rates increase high enough and high inflation expectations disappear, central
bank starts to concern about the economic growth again and passes to the expansive monetary
policy.
Economics development in a small open economy (and especially its inflation) depends very
much upon the development in foreign countries than upon domestic interest rates. If, for
example, the world oil prices jump to $60 for a barrel, nobody can avoid domestic fuel prices
to jump as well. If the economy of its largest business partner faces recession and slowing
inflation, small open economy faces slowing inflation (or even deflation) too, for tradable
goods often represent more than a half of its consumption basket.
Price level also depends on weather. In case of good weather, overproduction of food starts
pushing the prices down. Moreover, government often regulates prices of some foodstuff,
rentals, and services. Monetary policy has no means to influence these prices.
Changing interest rates affect prices very slowly. Roughly speaking, the monetary policy
operates in a following way. When the interest rates fall, banks get more willing to grant loans
and simultaneously start paying lower interests on deposits. Enterprises invest more (and
increase thereby their production capacities) and demand for more inputs. Therefore, prices of
both inputs and outputs increase. Consumers spend more and consume more. Demand for
consumption goods increases making the consumer prices increase too. If the economy is
open, lower interest rates result in the outflow of capital abroad and the exchange rate starts
depreciating. Imported goods get more expensive and hence the prices start rising. All these
events occur with a particular delay of one year or more. Meanwhile, changes abroad can
affect domestic prices significantly. Inflation regulation resembles shooting on a long-distance
moving target.
The proper understanding of monetary policy operational procedure can help elucidate the
real power of monetary policy.

148
Monetary policy of central bank
Monetary policy
instruments
○ Open market
operations
○ Standing facilities
○ Direct regulation of
short-term interest rate
→
Operating targets
○ Short-term market
interest rate
○ Monetary base
○ Limits on loans
granted
○ Limits on clients’
interest rates on loans
and deposits
→
Intermediate targets
○ Some monetary
aggregate
○ Exchange rate
○ Long-term market
interest ate
→
Ultimate targets
○ Price stability, i.e.
low inflation
○ Long-term growth
○ Employment
Realisation and tactics of monetary policy Strategy of monetary policy
→ Transmission mechanism of monetary policy →
Exchange rate policy of central bank or other government institution
Exchange rate
instruments
○ open market
operations
→
Operating target
○ exchange rate
Figure 2.1 Causality chain of monetary policy and exchange rate policy
(Formerly used instruments and targets are stroked out)

149
2.2 Monetary policy instruments
Monetary policy instrument is a technique consisting in a permanent maintenance of an
operating target, i.e. of the short-term interbank market interest rate. In other words, once the
certain interest rate in explicitly agreed, monetary authority must assure that this interest rate
is systematically achieved by means of open market operations and standing facilities. This
means that central bank first decides about the explicit short-term interbank market interest
rate and consequently puts this rate into practice by means of open market operation and
standing facilities. This agreed short-term interbank interest rate influences subsequently all
remaining interest rates in the economy. There is no other monetary policy instrument than
open market operations and standing facilities.
In the past some monetary authorities introduced direct regulation of short-term interest rate.
For example, regulations can take form of limits imposed on interest rates that commercial
banks can pay and charge on clients’ deposits and loans. Another way to influence interest
rates is to impose upper limits on the value of loans that commercial banks can grant.
Nowadays, such monetary instruments are used only in several less-developed countries.
Nevertheless, developed countries were frequently using them before the so-called
“deregulation” (from 1975 to 1985). Before deregulation, monetary policy consisted in
several open market operations and in direct regulation of financial markets and institutions.
Changes of monetary policy were changes of one instrument or changes of the whole bulk of
instruments. Sometimes, instruments were combined together with the active exchange rates
regulations (daily corrections or administrative settings). Currently, monetary policy is more
transparent and easier to elucidate.
2.2.1 Open market operations
Open market operations represent the domestic currency operations (usually between
central bank and commercial banks) initiated by central bank with a view to pursue the chosen
level of the short-term interbank market interest rate. There is no other objective of the open
market operations. Central bank buys or sells bank reserves for the given interest rate. The
short-term interbank market interest rate should not be determined by the excess bank
reserves but exclusively by the interest rates on provided and absorbed bank reserves.
These provided or absorbed bank reserves and the interest rate paid and charged on them are
booked in the commercial bank’s balance sheet. Commercial bank consequently adjusts

150
interest rates of other balance sheet items based on this short-term interbank market interest
rate, i.e. it adjusts especially the interest rates on accepted deposits and loans granted.
Open market operations change commercial banks’ bank reserves held on clearing accounts
with central bank. Anyway, open market operations must lead to a certain amount of excess
bank reserves. If the amount of bank reserves is lower than the sum of reserve requirements
and excess bank reserves, central bank must provide it. Otherwise, commercial banks would
get unable to meet reserve requirements and short-term interbank market interest rates would
therefore jump over the desired level (perhaps even unlimitedly high). If, on the other hand,
the amount of bank reserves exceeds the sum of reserve requirements and excess bank
reserves, central bank must absorb it. Otherwise, commercial banks could meet reserve
requirements very easily and short-term market interbank interest rates would fall under the
desired level (perhaps even to zero).
How central bank manages bank reserves? Operations can take only two forms: either
central bank grants or accepts loans or deposits to/from commercial banks or central bank
purchases or sales any asset. If the central bank is providing bank reserves (Example 2.1), it is
usually:
o Granting loans or deposits to commercial banks for the official interest rate. Loans
(deposits) usually take the form of reverse repurchase agreements (in this case, the
interest rate is called repo rate). For these reserves the Fed uses the term “borrowed
reserves”.
o Purchasing any asset (e.g. debt securities including its own debt securities) from
commercial banks. For these reserves the Fed uses the term “non-borrowed reserves”.
If the central bank is absorbing bank reserves (Example 2.2), it is usually:
o Accepting loans or deposits from commercial banks for the official interest rate. Loans
(deposits) usually take the form of repurchase agreements (in this case, the interest rate
is called repo rate),
o Selling any asset (e.g. debt securities including its own debt securities) to commercial
banks.

151
Example 2.1 Central bank providing bank reserves
Bank reserves providing operations do not represent stronger control over interest rates
than bank reserves absorbing operations. Bank reserves market is the special kind of
market. Central bank operates on both demand and supply side of it. It determines the demand
by setting reserve requirements and by setting conditions for the interbank clearing system. At
the same time it determines supply by means of open market operations. Open market
operations are used to achieve the desired level of interest rates.
1) Central bank grants loan to commercial bank of $1 billion 2) Central bank purchases debt securities not-issued by commercial bank from commercial banks for $2 billion 3) Central bank purchases debt securities issued by commercial bank from this bank for $3 billion 4) Central bank purchases its own debt securities from commercial bank for $4 billion
Central bank providing bank reserves
Clearing accounts of commercial banks
Commercial banks
Opening balance 1) $1 billion 2) $2 billion 3) $3 billion 4) $4 billion
Clearing accounts with central bank
1) $1 billion
Loans accepted
1) $1 billion
Loans granted
2) $2 billion 3) $3 billion
Securities
Opening balance 2) $2 billion 4) $4 billion
Securities
3) $3 billion
Securities issued
4) $1 billion Opening balance
Securities issued
Opening balance 1) $1 billion 2) $2 billion 3) $3 billion 4) $$ billion

152
Example 2.2 Central bank absorbing bank reserves
1) Central bank accepts loan from commercial bank of $1 billion 2) Central bank sales debt securities not-issued by commercial bank to commercial banks for $2 billion 3) Central bank sales debt securities issued by commercial bank to commercial bank for $3 billion 4) Central bank issues debt securities for $4 billion for commercial bank
Central bank absorbing bank reserves
1) $1 billion 2) $2 billion 3) $3 billion 4) $4 billion
Opening balance
Clearing accounts of commercial banks
Opening balance 2) $2 billion 3) $3 billion
Securities
1) $1 billion
Loans accepted
4) $4 billion
Securities issued
Commercial banks
3) $3 billion Opening balance
Securities issued
Commercial banks
Opening balance 2) $2 billion 4) $4 billion
1) $1 billion
Loans granted
Opening balance 1) $1 billion 2) $2 billion 3) $3 billion 4) $4 billion
Clearing accounts with central bank
Securities

153
2.2.2 Automatic facilities
We have seen already that open market operations take place on the initiative of central bank.
Nevertheless, central bank allows commercial banks acting also on their own initiative. Such
operations also change bank reserves and we call them automatic facilities (standing
facilities). We define automatic facilities as domestic currency operations taking place on the
initiative of commercial banks in order to increases or decrease their bank reserves. There are
two automatic facilities, namely deposit facility and lending facility. Both facilities are
generally with an overnight maturity.
If some commercial bank finds itself with the lack of bank reserves, there is at least one other
bank with the excess bank reserves. This bank is ready to lend bank reserves to any bank for
the interbank market interest rate. Vice-versa, if some commercial bank finds itself with the
excess of bank reserves, there is at least one other bank with the lack of bank reserves. This
bank is ready to borrow bank reserves from any bank for the interbank market interest rate.
The interest rate on the central bank’s lending facility is always higher than interbank market
interest rate (close to the chosen level of the short-term interbank market interest rate). The
interest rate on the central bank’s deposit facility is always lower than interbank market
interest rate. Commercial banks, therefore, always prefer the interbank market to deposit or
lending facility as the interest rates applied to them are unfavourable when compared with
market rates. It means that the use of deposit or lending facility is exceptional. They still play
important role in setting short-term interbank market interest rates. Bindsell14 concludes that
“the simplest system for controlling short-term interest rates is that with a symmetric standing
facilites corridor around the target rate…”
2.2.3 The Fed
a) Open market operations
Fed both delivers and absorbs bank reserves held by depository institutions with Federal
Reserve banks. Open market operations take place at the Domestic Trading Desk situated in
Federal Reserve Bank of New York (Desk). These operations follow instructions of the
Federal Open Market Committee (FOMC).
14 Bindseil, Ulrich: Monetary Policy Implementation: Theory Past and Present. Oxford University Press, Oxford 2004.

154
Each morning, the staff at the Federal Reserve Bank of New York and at the Board of
Governors prepares estimates of technical factors determining the availability of reserves for
the next several days and for the two-week period. The manager of the New York group
contacts at 11:15 a.m. members of the Board of Governors, who are at the moment members
of FOMC. Participants discuss the recent development of reserves, last trends of financial
markets and the latest data on monetary and loan aggregates. A special interest is given to
trading conditions at the reserve market, particularly to the level of federal funds rate in
relation to the level required by monetary policy. Consequently, they set the program for open
market operations. After the discussion approximately at 11:30 the FOMC members and other
presidents (FOMC non-members) get information about actions that Fed means to undertake
during the day.
Once the Fed decides to make certain operations, the Federal Reserve Bank in New York
contacts dealers trading T-securities and mortgage-backed bonds of federal agencies. All
operations in the market are conducted in auctions, with all primary dealers invited to bid.
There are approximately forty dealers with which the Desk transacts (primary dealers),
especially large banks and securities dealers. Fed also transacts with several official
institutions, such as foreign central banks. After the transaction, reserve account of each
dealer’s bank gets credited or debited and, therefore, bank reserves of the banking system
changes.
Fed uses the following types of open market operations:
o Outright purchases of the Ú.S. treasury securities (T-bills, T-notes and T-bonds) and
mortgage-backed bonds issued by U.S. federal agencies (providing bank reserves) or
outright sales of same securities (absorbing bank reserves). These operations represent
the so-called Fed’s permanent open market operations,
o Loans granted in the form of reverse repurchase agreements (providing reserves) or
accepting loans in form of repurchase agreements (absorbing reserves). These
operations represent the so-called Fed’s temporary open market operations.
Outright purchases and sales of debt securities take usually the form of auctions. The Desk
may not add to the Federal Reserve’s holdings of securities by purchasing new securities
when they are first auctioned because it has no authority to lend directly to the Department of
the Treasury. Therefore, it must make any additions to holdings through purchases from
primary dealers in the secondary market or directly from foreign official and international

155
institutions. When purchasing or selling securities in the secondary market, the Desk
entertains from primary dealers bids on securities of a particular type (T-bills or Treasury
coupon securities). In determining which bids to accept, the Desk considers the bids that
represent the highest yield (for purchases) or the lowest yield (for sales) relative to the
prevailing yield curve.
Temporary open market operations help to offset short-lived imbalances between reserve
supply and demand. The Desk arranges repurchase agreements to add reserve balances
temporarily and matched sale–purchase transactions to drain reserve balances temporarily.
When the Desk arranges a repurchase agreement, it purchases securities from a primary
dealer (or the dealer’s customer) and agrees to resell the securities to the dealer (or customer)
on a specified date. The Desk arranges two types of repurchase agreements: System and
customer-related. For both types, the Desk solicits offers from primary dealers. The dealers
may make offers on their own behalf or on behalf of their customers. The offers set forth a
rate and an amount of repurchase agreements that the dealer (or its customer) is prepared to
transact. The Desk ranks the bids in descending order of rate. It accepts the offer with the
highest rate first and continues to accept lower rates until the total volume of offers equals the
amount of reserve balances that the Desk wants to inject into the depository system.
When conducting system repurchase agreements the Desk does not announce the intended
size of the operation when it solicits offers. The dealer (or customer) whose offer is accepted
sends securities (Treasury or federal agency) to the Federal Reserve Bank of New York, and
the Bank pays for them by creating balances in the Federal Reserve account of the dealer’s (or
the dealer’s customer’s) clearing bank. System repurchase agreements are conducted on an
overnight or term basis. Term repurchase agreements may last no longer than 15 days and
may be either withdrawable or fixed term. If the agreement is withdrawable, the dealer has the
option of asking, before 10:00 a.m. on any day before the agreement concludes, for the return
of its securities. It usually does so if financing rates fall below the rate arranged with the
Desk. If the repurchase agreement is fixed term, the dealer may not withdraw its securities
early.
Customer-related repurchase agreements are a type of transaction arranged by the Desk
with primary dealers on behalf of foreign official and international institutions that maintain
accounts at the Federal Reserve Bank of New York. These institutions maintain accounts at
the New York Reserve Bank to help manage their U.S. dollar payments and receipts. The
Federal Reserve provides a means by which the cash balances in these accounts can be
invested overnight.

156
Matched sale–purchase transactions (reverse repurchase agreements) are the method by
which the Federal Reserve drains reserve balances temporarily. In these transactions, the
Federal Reserve agrees to sell a short-dated Treasury bill at a specified price, and the buyer
simultaneously enters into another agreement to sell the bill back to the Federal Reserve on a
specific date. In a matched sale–purchase transaction, the Desk indicates the bill and the rate
at which it will sell the bill. Dealers then submit offers for the amount of the bill they will buy
and the rate at which they will resell it to the Desk.
b) Discount window
Discount window is the instrument allowing depository institutions to borrow from the Fed
the short-term funds, i.e. to accept bank reserves on its account with Fed for the discount rate.
The term “discount window” comes from the past when the commercial banks needed bank
reserves they sent their agent to Fed’s counter windows. All loans of the discount rate must be
fully collaterised. Nowadays, commercial banks are using discount window loans rarely.
Detailed information on discount window can be found at the website
(http://www.frbdiscountwindow.org).
There are three kinds of discount window loans:
o Primary credit is available to generally sound depository institutions on a very short-
term basis, typically overnight, at a rate above the target rate for federal funds.
Depository institutions are not required to seek alternative sources of funds before
requesting occasional advances of primary credit. The Federal Reserve expects that,
given the above-market pricing of primary credit, institutions will use the discount
window as a backup rather than a regular source of funding. Primary credit may be used
for any purpose. Reserve Banks ordinarily do not require depository institutions to
provide reasons for requesting very short-term primary credit. Rather, borrowers are
asked to provide only the minimum information necessary to process a loan, usually the
amount and term of the loan. Primary credit may be extended for periods of up to a few
weeks to depository institutions in generally sound financial condition that cannot
obtain temporary funds in the market at reasonable terms. Large and medium-sized
institutions are unlikely to meet this test. Longer-term extensions of credit are subject to
increased administration,
o Secondary credit is available to depository institutions that are not eligible for primary
credit. It is extended on a very short-term basis, typically overnight, at a rate that is

157
above the primary credit rate. Secondary credit is available to meet backup liquidity
needs when its use is consistent with a timely return to a reliance on market sources of
funding or the orderly resolution of a troubled institution. Secondary credit may not be
used to fund an expansion of the borrower's assets. The secondary credit program
entails a higher level of Reserve Bank administration and oversight than the primary
credit program. A Reserve Bank must have sufficient information about a borrower's
financial condition and reasons for borrowing to ensure that an extension of secondary
credit would be consistent with the purpose of the facility,
o Seasonal credit program is designed to assist small depository institutions in managing
significant seasonal swings in their loans and deposits. Seasonal credit is available to
depository institutions that can demonstrate a clear pattern of recurring intra-yearly
swings in funding needs. Eligible institutions are usually located in agricultural or
tourist areas. Under the seasonal program, borrowers may obtain longer-term funds
from the discount window during periods of seasonal need so that they can carry fewer
liquid assets during the rest of the year and make more funds available for local lending.
To become eligible for seasonal credit, an institution must establish a seasonal
qualification with its Reserve Bank. Critically undercapitalized institutions are not
eligible for seasonal credit.
In unusual and exigent circumstances, the Board of Governors may authorize a Reserve Bank
to provide emergency credit to individuals, partnerships, and corporations that are not
depository institutions. Reserve Banks currently do not establish an interest rate for
emergency credit. Emergency credit loans have not been made since the mid-1930s.
Each of these loans bears different discount rate. Therefore, there is not only one sole interest
rate but there are three rates. In July 2005, for instance, federal funds rate was of 3.25 %,
interest rate on primary loans was of 4.25 % (i.e. 1.00 % higher than the federal funds rate),
interest rate on secondary loans was of 4.75 % (i.e. 1.50 % higher than the federal funds rate)
and interest rate on seasonal loans was 3.40 % (i.e. 0.20 % higher than the federal funds rate).
The board of directors of every Federal Reserve Bank shall propose a discount rate every two
weeks. This discount rate is subject to the decision of the Board of Governors. Fed makes the
changes of discount rate based on its own judgments, not automatically. Their decisions
come, therefore, with a certain delay after the change of federal funds rate. We have to point
out, that changes of discount rate do not affect the market short-term interest rates (they
depend mainly on the federal funds rate).

158
The monetary-policy role of discount window was changing substantially since the
establishment of Fed. During the twenties, discount window represented the decisive
monetary policy instrument in providing bank reserves to depository institutions. Discount
rate was traditionally playing the role of the announcement factor, i.e. it was signalling
changes of monetary policy to markets. Higher discount rate was indicating tight monetary
policy and lower discount rate was signalling the accommodative monetary policy.
Nowadays, discount rate changes get coordinated with changes of the federal funds rate. U.S.
financial markets were gradually developing and bank reserves provided by means of open
market operations became easier and more efficient. Discount window importance has thus
slowly decayed.
From the beginning of sixties, the basic discount rate has been often lower than the
federal funds rate. In order to limit the access to discount window (and thus to limit the
frequency and volume of lending), Fed relied on administrative measures. Despite the
attractiveness of discount window interest rates, depository institutions used it rarely and the
importance of this instrument has diminished. During nineties, depository institutions had
limited the use of discount window. The larger lending in 1980s effectuated by several banks
in troubles have induced other banks to rather keep away of it. Depositors would interpret the
use of discount window as a sign of potential troubles of a bank.
Before adopting the Depository Institutions Deregulation and Monetary Control act of 1980,
U.S. legislative had restricted the use of discount window only to the Fed member banks. This
act has extended reserve requirements to non-member depository institutions. Further, it has
enabled equal access to discount window to all institutions whose deposits are subject to
reserve requirements. Since that time, all domestic banks and thrift institutions as well as
affiliates of foreign banks have been allowed to use the discount window. Institutions
expecting to use of discount window simply negotiate a series of legal documents with Fed.
All extensions of credit must be secured to the satisfaction of the lending Reserve Bank by
collateral that is acceptable for that purpose. Most performing or investment grade assets held
by depository institutions are acceptable as collateral. Collateral in which a special industry
lender retains a superior legal interest is not acceptable. Assets accepted as collateral are
assigned a lendable value (market or face value multiplied by a margin) deemed appropriate
by the Reserve Bank. The financial condition of an institution may be considered when
assigning values. The following assets are most commonly pledged to secure discount
window advances:

159
o Commercial, industrial, or agricultural loans
o Consumer loans
o Residential and commercial real estate loans
o Corporate bonds and money market instruments
o Obligations of U.S. government agencies and government-sponsored enterprises
o Asset-backed securities
o Collateralized mortgage obligations
o U.S. Treasury obligations
o State or political subdivision obligations
2.2.4 The Eurosystem
The Eurosystem delivers bank reserves (liquidity). The Eurosystem’s open market operations
can be divided into the following four categories:
o Main refinancing operations are regular liquidity-providing reverse transactions with
a weekly frequency and a maturity of normally one week. These operations are executed
by the national central banks on the basis of standard tenders. The main refinancing
operations play a pivotal role in pursuing the purposes of the Eurosystem’s open market
operations and provide the bulk of refinancing to the financial sector. In July 2005
interest rate of main refinancing operations was 2.00 %.
o Longer-term refinancing operations are liquidity-providing reverse transactions with
a monthly frequency and a maturity of normally three months. These operations are
aimed at providing counterparties with additional longer-term refinancing and are
executed by the national central banks on the basis of standard tenders. In these
operations, the Eurosystem does not, as a rule, intend to send signals to the market and
therefore normally acts as a rate taker.
o Fine-tuning operations are executed on an ad hoc basis with the aim of managing the
liquidity situation in the market and steering interest rates, in particular in order to
smooth the effects on interest rates caused by unexpected liquidity fluctuations in the
market. Fine-tuning operations are primarily executed as reverse transactions, but can
also take the form of outright transactions, foreign exchange swaps and the collection of
fixed-term deposits. The instruments and procedures applied in the conduct of fine-
tuning operations are adapted to the types of transactions and the specific objectives
pursued in the operations. Fine-tuning operations are normally executed by the national
160
central banks through quick tenders or bilateral procedures. The Governing Council of
the ECB can decide whether, under exceptional circumstances, fine-tuning bilateral
operations may be executed by the ECB itself.
o Structural operations are carried out through the issuance of debt certificates, reverse
transactions and outright transactions. These operations are executed whenever the ECB
wishes to adjust the structural position of the Eurosystem visà-vis the financial sector
(on a regular or non-regular basis). Structural operations in the form of reverse
transactions and the issuance of debt instruments are carried out by the national central
banks through standard tenders. Structural operations in the form of outright
transactions are executed through bilateral procedures.
Standing facilities are aimed at providing and absorbing overnight liquidity, signal the
general stance of monetary policy and bound overnight market interest rates. Two standing
facilities are available to eligible counterparties on their own initiative, subject to their
fulfilment of certain operational access conditions:
o Counterparties can use the marginal lending facility to obtain overnight liquidity from
the national central banks against eligible assets. Under normal circumstances, there are
no credit limits or other restrictions on counterparties’ access to the facility apart from
the requirement to present sufficient underlying assets. The interest rate on the marginal
lending facility normally provides a ceiling for the overnight market interest rate. In
July 2005 interest rate on marginal lending facility was 3.00 %.
o Counterparties can use the deposit facility to make overnight deposits with the national
central banks. Under normal circumstances, there are no deposit limits or other
restrictions on counterparties’ access to the facility. The interest rate on the deposit
facility normally provides a floor for the overnight market interest rate. In July 2005
interest rate on deposit facility was 1.00 %.
Counterparties subject to minimum reserve requirements may access the standing facilities
and participate in open market operations based on standard tenders. The Eurosystem may
select a limited number of counterparties to participate in fine-tuning operations. For outright
transactions, no restrictions are placed a priori on the range of counterparties.
All Eurosystem credit operations (i.e. liquidity-providing operations) have to be based on
adequate collateral. The Eurosystem accepts a wide range of assets to underlie its operations.
A distinction is made between two categories of eligible assets – “tier one” and “tier two” –

161
essentially for purposes internal to the Eurosystem. However, this distinction will be phased
out gradually over coming years to leave the Eurosystem collateral framework with a single
list of eligible assets. Tier one currently consists of marketable debt instruments fulfilling
uniform euro area-wide eligibility criteria specified by the ECB. Tier two consists of
additional assets, marketable and nonmarketable, which are of particular importance for
national financial markets and banking systems and for which eligibility criteria are
established by the national central banks, subject to ECB approval. No distinction is made
between the two tiers with regard to the quality of the assets and their eligibility for the
various types of Eurosystem monetary policy operations (except that tier two assets are
normally not used by the Eurosystem in outright transactions). Eligible assets may be used on
a cross-border basis, by means of the correspondent central banking model or through eligible
links between EU securities settlement systems, to collateralise all types of Eurosystem credit.
All assets eligible for Eurosystem monetary policy operations can also be used as underlying
assets for intraday credit.
2.2.5 The Bank of Japan
The Bank of Japan (BOJ) is using its open market operations to provide or absorb liability
balances of depository institutions and non-depository institutions, such as securities
companies, securities finance companies, and tanshi companies (money market brokers).
Auctions for operations to adjust funds for the day (same-day-settlement operations) are
offered at 9:20 a.m., and those to adjust funds for the following days are offered at designated
time between 9:30 a.m. and 12:10 p.m. BoJ’s instruments vary depending on the character of
operation:
o Granting of short-term liquidity:
- Purchases of Treasury Bills and Financing Bills (TBs/FBs) 15 under repurchase
agreements,
- Outright purchases of TBs/FBs,
- Borrowing of Japanese Government Bonds (JGB) against cash collateral (JGB
repos),
- Outright purchases of bills,
- Purchases of commercial papers (CP) under repurchase agreements
15 TBs (Treasury Bills)/FBs (Financing Bills) are discount debt securities that are issued at a price less than the face value of the debt security.

162
- Outright purchases of bills backed by corporate debt obligations
o Absorption of funds over a short-term:
- Sales of TBs/FBs under repurchase agreements
- Outright sales of TBs/FBs
- Outright sales of bills issued by the Bank of Japan
o Granting of long-term liquidity:
- Outright purchases of JGBs.
Through standing facility the banks may borrow liquidity at their own initiative against
collateral. Loans bear interest at the official discount rate, currently 0.1 %. The official
discount rate thus provides a ceiling for the fluctuations in the short-term money-market
interest rate, since the banking institutions can always borrow at the central bank.
2.2.6 The Bank of England
The Bank of England uses open market operations to deliver bank reserves. The short-term
maturity of the Bank of England’s lending operations ensures that its counterparties regularly
need to come to it and ask for funds. The British banking system is short of bank reserves,
which the Bank of England provides via open market operations. The Bank's operations are
conducted through a group of counterparties, which can include banks, building societies and
securities firms. Normally, two rounds of operations are held at the official repo rate (set by
the Monetary Policy Committee, MPC) each day at 9:45 and 2:30. If these operations are not
sufficient to relieve the liquidity shortage there is an overnight operation conducted at 3:30,
and a late repo facility at 4:20 for settlement banks only, once the money market is closed.
Both overnight operations are conducted at a higher rate than the official rate. Also at 3:30 the
Bank makes available to its counterparties a daily overnight deposit facility at a lower rate
than the official rate. These overnight rates set upper and lower bands to market rates,
designed to allow active trading but moderate undue volatility, which might complicate banks'
liquidity management and deter use of money markets by non-financial companies.
In its repo operations to supply liquidity to market participants, the Bank of England
purchases eligible securities from its counterparties and agrees to sell back equivalent
securities at a pre-determined future date, around two weeks later. The interest rate charged
on these two-week repos is the official repo rate. Alongside this technique, the Bank of
England also offers its counterparties the option to sell it bills on an outright basis. In this

163
case, the amount the Bank of England pays for the bills is less than their nominal value. The
discount factor used in such operations is set at a level equivalent to the official repo rate. The
securities purchased are required to be of high credit quality; actively traded in a continuous,
liquid market, held widely across the financial system, and available in adequate supply. The
choice of obtaining liquidity by repo or outright sale of securities, and the particular eligible
instrument provided as collateral, are normally at the counterparty’s discretion, subject to
settlement constraints.
In its repo operations to supply liquidity to market participants, the Bank of England is willing
to purchase (and then resell) the following types of securities:
o Gilts (including gilt strips),
o Government non-sterling marketable debt,
o Sterling Treasury bills,
o Bank of England euro bills and euro notes,
o Eligible bank bills,
o Eligible local authority bills,
o Sterling-denominated securities issued by European Economic Area (EEA), central
governments and central banks and major international institutions, and
o Euro-denominated securities issued by EEA central governments and central banks and
major international institutions that are eligible for use in the European System of
Central Banks’ monetary policy operations.
The range of securities that the Bank of England is willing to purchase on an outright basis in
its open market operations is narrower:
o Sterling Treasury bills,
o Eligible bank bills, and
o Eligible local authority bills.
The Bank of England will be making fundamental changes to its money market operations in
2006. Indeed some changes have already been made. It no longer purchases assets outright
and no longer takes bank bills on repo. Also the rate on repos is indexed to the MPC rate
rather than being fixed at the level of the MPC rate ruling at the start of the repo.

164
2.3 Operating targets
Nowadays, the nominal short-term market interest rate (i.e. not the real interest rate)
represents almost exclusively operating target. Heretofore, monetary policy was also using
monetary base, limits on loans granted or limits on clients’ interest rates on loans and
deposits. To achieve the targeted short-term market interest rate, monetary authorities use the
open market operations. Hence, central bank does not manage its ultimate target of price
stability directly, but indirectly by means of short-term market interest rates. It thus follows
that the short-term market interest rate does not come from the market but from the decisions
taken by the central bank. Thus monetary policy has only one output: short-term market
interest rate and nothing more.
a) Operating targets in the history
Let’s look on the infamous U.S. history of the regulation of monetary base. On Saturday, 6
October 1979, Fed, under the governorship of Paul Volcker, has adopted a modified version
of the monetary base targeting using the M1 as an intermediate target. To moderate potential
extreme movements of market interest rate, central bank was using the discount window.
Previously, the Fed was controlling the level of the Fed funds rate. The method was intended
to target non-borrowed reserves. This experiment lasted until September 1982. Volatility of
short-term interest rates during this period increased four times, i.e. the monetary base
regulation caused the excessive volatility of short-term interest rates. In addition, increased
volatility affected both the long-term interest rates and foreign exchange market. The
monetary base targeting even caused higher volatility of monetary aggregate M1. Hence, the
volatility of the whole financial market increased.
Subsequently, the Fed has implemented, for a short time, targeting of borrowed reserves as its
operating target. There is no fundamental difference between these two methods. During the
first half of 1980s, many countries abandoned monetary targeting. The connection between
intermediate monetary target and ultimate monetary target in the form of inflation or nominal
GDP broken (if it ever existed). Preceding history of unstable relationships between monetary
aggregates and nominal GDP has hampered the effort to consider monetary aggregates as
intermediate target. Instead of this, central banks have started changing interest rates
following inflation and foreign exchange rates.

165
In former times, central banks were also using limits (ceilings) on loans granted. The whole
limit was usually distributed among individual banks. This method was widely used
especially in European countries in 1970s and still makes basis of monetary policy in many
developing countries, particularly in Africa. However, the definition of institution subjects to
these ceiling was allowing many ways to avoid it. Efficiency of ceiling was thereby
substantially limited. Ceilings were also hardly affecting competitiveness by penalizing
dynamic institutions. Once the bank has reached the ceiling, there was no further stimulus to
compete regardless the profitability of investment opportunities. There were several
suggestions about how to restore competitiveness, e.g. to allow trading with quotas and so
forth. However, these suggestions were never introduced into practice.
Countries, where the loan ceiling method was abandoned in favour of indirect monetary
policy instruments, usually find themselves unable to control monetary and loan aggregates as
precisely as before. Monetary aggregates in the United Kingdom in 1970s, for instance,
expanded rapidly after the central bank has abandoned these ceilings. Neither loans nor
money have embodied stable relation with nominal GDP and inflation. Developing countries
that have recently abandoned loan ceilings are loosing control over monetary aggregates as
well. Some countries have also imposed limits on clients’ interest rates on loans and
deposits. However, this method was already almost abandoned for similar reasons.
b) Current operating targets
Fed announces only one interest rate, namely the intended federal funds rate. This rate
represents the rate that the Fed member banks use for their over-night inter/bank loans and
deposits. Originally, Fed was not announcing this rate and analysts were deriving it from the
Fed’s open market operations. In July 2005 the intended federal funds rate was 3.25 %.
Eurosystem declares three interest rates, namely the interest rate of one-week main
refinancing operations, the interest rate of deposit facility and the interest rate of loan facility.
The market interest rate Euribor is slightly higher than the interest rate of main refinancing
operations. For example in July 2005 the interest rate of main refinancing operations was 2.00
while the one-week Euribor was on the level of 2.10 %. At the same time interest rate of
deposit facility was 1.00 % and interest rate of loan facility was 3.00 %.
Bank of Japan announces the uncollaterised overnight call rate. From October 2001 this rate
is set at the level o 0,001 %. Official discount rate at which the banks can borrow from central
bank is currently 0.1 %.
166
Bank of England sets out repo rate of the two-week repo operations delivering liquidity. The
market interest rate £Libor is slightly higher than the repo rate. For example in July 2005 the
repo rate was 4.75 while the two-week £Libor was on the level of 4.81 %.
2.4 Intermediate targets
As intermediate target monetary authorities usually use one of monetary aggregates,
exchange rate or the long-term market interest rate. Further, they can use the total amount of
loans granted, assets prices, and so forth. Sometimes, we could also observe other than
monetary indicators serving as intermediate target. At the same time, there needs to be a
relatively stable and easily predictable connection between this indicator and ultimate target.
These aspects differ in individual countries substantially. Financial variables are hardly
observable by public and the frequency of their measurement is generally longer than one
month. In order to achieve the ultimate target, central authority sets the operating target based
on current observations of the intermediate target. Roughly speaking, the choice of concrete
monetary aggregates results from the observation that every creation of money can increase
future inflation and vice versa. This attitude is common especially to monetarists.
2.4.1 Monetary aggregates targeting
According to many mainstream economists, the price level depends on monetary aggregates,
i.e. the total amount money determines the price level. History of this attitude is very long.
Among other authors, we could mention Irving Fisher who has defined the formal identity of
quantitative theory of money, John Maynard Keynes who was strictly opposing it and Milton
Friedman thanks to whom this theory was revived.
The comeback of quantitative theory of money was made possible also because of the
inflationary development during 1970s and beginning of 1980s. That was a period when
central authorities of many countries were forced to redefine their monetary policies. As the
monetary anchor in the form of the fixed exchange rate disappeared with the end of Bretton-
Woods system, central banks had no way to stop the excessive monetary expansion. In order
to reverse such development, some developed countries started to rely upon the money stock
as a monetary conditions indicator or even as intermediate target. Money stock was supposed
a good leading indicator of inflationary development, i.e. the control over money stock was
supposed to help stabilize inflation.

167
According to Goodhart16 however, by the end of 1970s, “…the crucial long-term
relationships, i.e. the relationships between the money stock and nominal incomes (velocity),
and between prices in two countries and their nominal exchange rate (purchasing power
parity), appeared far more fragile than expected.” Goodhart noticed some other mainstream
economists17.
Money stock targeting stems from findings suggesting that in a long-run, the development of
money stock is said to determine the price level. Monetary policy of money stock targeting
thus concentrates on the maintaining the adequate growth rate of a chosen monetary
aggregate. According to the quantitative theory, this variable depends on the growth rate of
nominal GDP. This regime can take a variety of forms concerning the choice of monetary
aggregate, size of a targeted growth rate and manner of targeting.
Another question arises about which monetary aggregate to choose, i.e. what aggregate
shows the econometrically documented stable relationship with the price development, or
with the development of nominal GDP. Central banks could not be ready to manage such
monetary aggregate. Experience shows, that excessive changes of monetary growth affect
inflation with a long lag. But central banks have to react in advance.
Central banks construct, therefore, diverse definitions of money, from narrow money in form
of currency and deposits on current accounts to broader money including mid-term and long-
term deposits, mortgage backed securities and so forth. The choice of individual central bank
does not follow some uniform rule. Experience shows that broader the aggregate is, stronger
its relation to inflation and lower its control by central bank are and vice versa.
The targeted growth of monetary aggregate usually does not comprises one number but rather
the band specifying the desired value of monetary aggregate by the end of the year or corridor
for the desired development of monetary aggregate during the whole year. More and more,
central banks stop using the one-year’s growth rate target but rather the band for several
years. Overheated economy could result in a growth of money stock. Central banks are,
16 Goodhart, Charles: The Conduct of Monetary Policy, The Economic Journal, 1989, 99(396), 293-346. 17 Goodhart, Charles: The Conduct of Monetary Policy, The Economic Journal, 1989, 99(396), 293-346. According to Goodhart: “Yet a large wing of mainstream (mostly US) macro-theoretical economists appear to have taken little notice of such historical experience in recent years, driving ever deeper into an artificial (Arrow/Debreu) world of perfectly clearing (complete) markets, in which money and finance do not matter, and business cycles are caused by real phenomena, e.g. Kydland and Prescott (1982), Long and Plosser (1983), King and Plosser (1984). Moreover, in a number of analytical studies of this kind, e.g. Lucas (1972), Sargent and Wallace (1975), the only reason why monetary policy may affect real variables is owing to an informational imperfection, which would seem simple and worthwhile to overcome. This leaves something of a gap between state-of-the-art macro-theory and practical policy analysis, see Laidler (1988 a, b).”

168
therefore, increasing interest rates in order to reduce the aggregate inflationary pressures.
Conversely, weakening economy usually produces slowing growth of money stock. In such a
case, central banks usually cut interest rates and hence boost the demand and inflation.
If there is the precise causality between money growth and inflation, the money stock
targeting would be suitable, especially in countries, where the relationship between the
targeted monetary aggregate and inflation is stable and predictable. To manage monetary
aggregates efficiently, central banks need a functional credit channel, where the loan
creation reacts to changes of interest rates. Nevertheless, current practice teaches us about
other factors determining the price level. Discussions on monetary policy often concentrate on
topics such as which factors determine the relation between money and prices. Analytic
approaches often use the definition of Granger causality. They search especially for the time
structure of lags of prices behind money and other macroeconomic indicators. Analysts also
search for reverse causality, especially how current prices depend on future money and how
prices affect GDP through loans.
By the end of 1980s, the most of central banks have abandoned, formally or informally,
monetary aggregates targeting in favour of methods allowing them working with diverse
economic indicators. They have also implemented more flexible monetary instrument regimes
allowing for influencing monetary conditions faster and with changing emphasis. These
changes of monetary policy were caused primarily by the increasing instability of monetary
aggregates and disappearing correlation of these aggregates with inflation. Since there was no
suitable intermediate target, many central banks have chosen monetary policy concentrating
directly on ultimate monetary target, i.e. on inflation (inflation targeting).
However, this does not mean that money stock has lost its information importance. It just does
not represent the whole transmission mechanism and cannot serve, therefore, as an
intermediate target. It maintains the role of information variable. The monetary policy
decision-making is always based on imperfect information about the future economic
development of which the monetary aggregates represent a part.
2.4.2 The use of monetary aggregates
In former times, many countries were considering monetary aggregates highly important
monetary policy intermediate targets. However, experiences of countries vary substantially. In
the United States, Canada and the United Kingdom, results of this method were hardly

169
satisfactory. On the other hand, this regime was relatively successful in countries like
Germany and Switzerland.
Estimates show that the lag of inflation behind monetary aggregate in EU member countries
before the adoption of euro was about six to nine months. Some countries were showing lags
of even more than one year. Countries where the growth of monetary aggregate was more
moderate were observing weaker correlation between money and inflation and vice versa,
since there were also other factors determining inflation. These relations are very hard to
model and estimate even ex post. Ex ante forecasts, therefore, can hardly provide reliable data
for monetary policy decision-making.
In the USA the role of monetary aggregates in monetary policy has changed with their
reliability. During much of the post-World War II period, M1 had the stable relationship to
aggregate spending. Full Employment and Balanced Growth Act of 1978 (the Humphrey-
Hawkins Act) introduced the obligation of Fed to specify limits for the desired growth of
money stock. The Fed had to publicly announce its monetary growth target in every February
and to review and possibly redefine it every six months. The Fed set target growth rate ranges
for all three aggregates. This measure supposed relatively stable relationship between money
growth and monetary policy targets, i.e. that this relationship can be used to achieve the
monetary policy targets. It was supposed, that money stock can fix the price level.18
This act was also taking into account possible revision of monetary policy if the relationship
between money and loan aggregates and economy (e.g. velocity of money19) become
unpredictable. Under such circumstances, it would become economically undesirable to hold
the former position. Fed thus does not have to keep its announced targets concerning money
or loan growth. In such case, however, it has to explain these reasons to the Congress and to
the public. Consequently, analysts started examining carefully the reports about movements of 18 The golden standard was supposed formerly to determine it as well.
19 Velocity of money is a key term in the "quantity theory of money," which centres on the "equation of exchange":
M*V = P*Q
Where:
- M is some monetary aggregate (M0, M1, M2 etc.), - V is the velocity of money, - P is the price level. - Q is the production of the economy measured through GDP etc.

170
money stock (especially the movements of M1). If, for example, Fed reported faster growth
than expected, analysts started expecting Fed to raise the federal funds rate in order to
decelerate it.
Thus before the financial markets deregulation in 1980s, monetary aggregates in the United
States represented reliable inflationary indicator. In addition, Fed could relatively simply
manage it. That is why Fed was paying special interest on monetary growth in 1970s and at
the beginning of 1980s. From 1979 to 1982 the Fed was explicitly targeting money stock.
However, the relatively stable relationship between monetary aggregates and inflation started
to slowly disappear during the late 1970s as there were new financial products (NOW and
Super NOW accounts) introduced and as the economic agents became more willing to hold
the narrow (M1) money. Before deregulation, banks were not allowed to pay interest on M1
deposits and individuals were, therefore, holding only the most necessary amounts of money
to arrange their current expenditures. The amount of M1 deposits was thus closely correlated
with expenditures.
At the beginning of eighties, U.S. banks were allowed to pay interests on checking accounts.
The subsequent introduction of NOW accounts (negotiable order of withdrawal) in 1981 and
Super NOW accounts in 1983 resulted in massive transfers of money from saving accounts
(part of M2) to the new ones which make part of M1. NOW and Super NOW accounts offered
the mix of transaction properties of demand deposits with interest properties of term deposits.
New financial products thus resulted in overshooting the target zone for M1 regardless the
slowdown of U.S. economy.
Once the banks were allowed to pay explicit interests on checkable deposits (NOW and Super
NOW accounts), M1 stopped reflecting reliably expenditures since people started to keep
their money deposited on these accounts, i.e. balances of these accounts started to exceed the
amounts necessary for their transactions. In addition, financial markets started providing new
instruments substituting M1 deposits and many people transferred their deposits in favour of
these instruments. Relationship between M1 and expenditures was, therefore, further
weakened. Among these newly instruments, we can mention the introduction of sweep
accounts in 1994 that substantially diminished M1 aggregate without changing the M2
aggregate. M1 aggregate also become more sensible to changes of short-term interest rates.
Since the M1 aggregate was bearing low and relatively stable interests, market interest rates
were causing remarkable changes of M1 money. The relationship between M2 and M3
aggregate and inflation weakened too.

171
Until 1987, Fed was examining particularly the development of monetary aggregate M1. The
relationship between this aggregate and nominal GDP slowly diminished during 1970s and
1980s. Fed therefore shifted its attention to the monetary aggregate M2 in 1987 for the
correlation between this aggregate and nominal GDP was substantially stronger.
Another argument against the use of monetary aggregates highlights their unstable velocity of
money. The velocity of M2 aggregate remained relatively stable for the long period of time
(even though it was changing slightly with changes of interest rates). However, at the
beginning if 1990s, the velocity of M2 abandoned its historical behaviour. It increased
remarkably. This velocity increased although the market interest rates decreased, which would
be otherwise supposed to increase the attractiveness of M2 and lower its velocity of money.
This fluctuation caused the worsening predictability of the velocity of money and problems
with achieving the overall economic objectives.
During the 1990s, the stable relationship between M2 and aggregate spending also broke
down. Beginning in July 2000, the Fed discontinued setting monitoring ranges for M2 and
M3. M3 was never strongly related to aggregate spending. The Fed then proclaimed that the
money stock does not represent the accurate measure for monetary policy and that it will
further use it only as one of indicators Thus, the United States now has three definitions of
money that appear to provide little information about the monetary policy.
Since that time, Fed monitors a wide range of indicators of future development of GDP,
employment and inflation. Among others we can mention diverse monetary aggregates,
growth of real and nominal GDP, commodity prices, exchange rates, inflation expectations
and diverse credit spreads and current yield curve. Relationships between these variables and
effects of monetary policy help throw more light on models. Monetary policy decision makers
thus rely rather on their own judgments. Sometimes they differ in attitude towards a given
indicator in relation with another indicator. It is not surprising since these indicators are
hardly interpretable or sometimes even supporting different measures.
Alternative indicators have thus begun to play more important role in U.S. monetary policy.
In Canada, evolution of financial innovations was very similar and Bank of Canada has left,
therefore, M1 as intermediate target and started to use the whole set of other economic
indicators. This policy is often denoted multi-criteria or “looking at everything”. This
approach has consequently transformed into the so-called inflation targeting. Monetary policy
based on monetary aggregates used during the monetarist era of 1970s and 1980s has been
replaced by the monetary policy based on inflation targeting.

172
2.4.3 Exchange rate targeting
Under this regime, central bank uses interest rates changes and direct foreign exchange
interventions in order to secure the stabilized nominal exchange rate. It usually seeks to
import low inflation from another country. To fulfil this objective, central bank needs
some prerequisites. Above all, there must be a low inflationary differential between these to
countries, sufficient foreign exchange reserves, sustainable competitiveness and credibility of
country employing this way of targeting including its legislative, institutional and political
stability. When the domestic currency depreciates, central bank increases interest rates and
vice versa. Fixed rate regime can also support the economic and political integration. This
was the case of the European Exchange Rates Mechanism (ERM) that anticipated the launch
of euro.
The fixed exchange rate of domestic currency to one or several foreign currencies represents
the basic regime of exchange rate targeting. Inflation of the “anchor” country is generally very
low and this country has usually considerable share in mutual trade. There are other regimes
based on exchange rate targeting. Central bank can, for instance, set a corridor within which
the exchange rate can fluctuate. If there is a danger of exchange rate breaking this limit,
central bank intervenes. This regime is usually chosen in order to increase the foreign
exchange risk which helps reduce the speculative flows of capital. Exchange rate targeting
can also take form of crawling peg. Under such regime central bank sometimes change the
corridor central bank devaluates home currency). This devaluation is usually less than the
inflationary differential. This regime helps prevent inappropriate appreciation of domestic
currency that could endanger competitiveness of domestic producers. In extreme cases,
central banks can choose the currency board regime. This regime features higher credibility
and resistance against speculative attacks.
Among the major disadvantages of the exchange rate targeting belongs the weakening
autonomy of monetary policy, since the domestic interest rates must follow interest rates of
the anchor country (under the condition of liberalized capital flows). The number and
efficiency of measures the central bank can use to react in case of the demand or supply
shocks are also limited. Conversely, shocks affecting the anchor country are easily imported
through monetary policy into the domestic economy. There is also an increased risk of
speculative attacks on domestic currency (with the exception of currency board regime). This
risk increases even more when the domestic exchange rate is overvalued for a long time and
the price competitiveness of domestic producers, therefore, erodes. The probability of

173
monetary instability increases and pushes interest rates upwards. Such a development can
have negative impacts on domestic economy. Furthermore, this policy is very expensive. If
the economy is slowing down and central bank raises interest rates, the economic weakness
will intensify.
The results of this policy also depend on market expectations about the attainability of
exchange rate target. Foreign investors could find higher interest rates temporary. Tightening
of monetary policy would thus have only limited impact. To achieve its original objective
central bank would have to raise interest rates more dramatically, which would damage
economy even more.
The exchange rate targeting regime is suitable for small open economies where the exchange
rate substantially determines the domestic price level. Exchange rate also provides relatively
stable anchor to regulate capital flows. Reduced capital flows help eliminate the risk of
exchange rates speculation. Conversely, it delays the identification of potential economic
problems. Increased liberalization of capital flows and financial markets globalization have
forced many central banks to abandon this regime.
2.5 Ultimate targets
The ultimate target of monetary policy is the price stability (i.e. low inflation) or
alternatively the long-term economic growth and the full employment. Within the last years,
central banks got increasingly concentrated on the only target, which is the price stability, i.e.
on stabilization of the purchasing power of money unit (low inflation). In some cases, there
were a particular percentage points actually imposed by law. It is supposed that the ultimate
target can be only the price stability and not the GDP growth, since central bank can influence
GDP only in short terms. Price stability helps maintain the stable environment for business
activity. It is, therefore, indirectly expressing the central bank’s responsibility for the
sustainable economic growth. However, the central bank’s activity itself can not assure price
stability, for there are a number of other inflationary factors which are out of the central
bank’s control.
2.5.1 Price stability
At the beginning of 1960s, economists were confident that central banks could simultaneously
achieve the low inflation, strong economic growth, high employment, stable exchange rate,

174
low interest rates and even balance of the current account. However, central banks cannot
provide society with a cheap “medicine” against all of its economic troubles. Nowadays,
economists agree that central banks should concentrate primarily on price stability, which
makes part of monetary stability (monetary stability contains exchange rate stability as well).
Experience shows that the price stability boosts the economic growth and employment.
Low inflation does not distort prices of goods and services. Stable prices also encourage
savings and capital accumulation, since assets values do not erode by the unpredictable
inflation. Price stability thus represents the ultimate long-term objective. Short-term
inflationary fluctuations are inevitable and central bank seeks to smooth them. As the
monetary policy influences the economy with the substantial and unpredictable lag, central
banks cannot influence prices in a short term.
Stable low-inflationary environment makes the macroeconomic conditions easier to predict.
Such environment also allows households and enterprises make their economic decisions
based on information that is more reliable, since they can distinguish more easily changes of
relative prices from the overall trends. Both of these aspects make the resource allocation
more efficient. That is the key factor of a long-term economic prosperity. Enterprises can
make their long-term investments without being afraid of future price swings making their
today’s decisions wrong. Similarly, households can make their consumption and savings plans
without facing the risk of future shifts of real financial assets values. This also allows
financial markets to fulfil efficiently their basic function of optimal resource allocation.
The effort taken to maintain the price stability reflects the historical experience demonstrating
that high inflation damages economy. High and unstable inflation affects badly the
economic growth. Empirical evidences demonstrate unambiguously that the economic
growth in countries with lower inflation exceeds the growth of countries with higher and
unstable inflation. In the United States, the average real GDP growth during the low-inflation
period (i.e. from 1952 to 1965) was of 3.3 %. During the higher-inflation period (from 1967
to 1980), the average real GDP growth fell to 2.7 %. This figure is substantially lower despite
the stimulus provided by the Vietnam War. The disinflation (slowing inflation) leading to
price stability often brings short-tem costs consisting in a lower economic growth and lower
employment. However, the long-term growth effects more than balance these costs.
Other negative impacts of higher inflation are:
o High inflation causes direct redistribution effects, for inflation liquidates real value of
money. High inflation redistributes wealth from lenders to borrowers while small

175
inflation and deflation redistributes wealth from borrowers to lenders This
redistribution represents a latent burden to people who save and cannot secure
purchasing power of their incomes and savings. During 1970s and 1980s, those who
were able to borrow money to finance holdings of assets whose value was rising
gained, since the inflation has diminished real value of their debts. Those who were
able to adapt their tax and other affairs in the way to benefit from inflation have
gained too. Inflation expectations motivate people to seek to minimize the impact of
inflation or to take advantage of it.
o High inflation redistributes wealth through the income taxes. Income taxes do not take
into account inflation. The whole amount of interests received, therefore, constitutes
the basis for taxation even though a part of these interests represent compensation for
inflation. Similarly, the whole amount of interests paid by enterprises is assumed to
represent costs and reduce, therefore, the tax burden even if a part of these interests
represents a compensation for inflation. This means that in case of high inflation, tax
system taxes interest incomes more and interest expenses less. Borrowers therefore
benefits at the expense of lenders.
o High inflation represents the source of uncertainty that makes the economic decisions
more difficult. High inflation periods are usually periods of the increased volatility of
inflation. Prices and wages change increasingly. If there is a high and volatile
inflation, people cannot estimate correctly, how fast the overall price level would
increase and what is the right price of individual goods and services. This makes the
price system less efficient in allocation of resources. The uncertainty about the future
relative prices as well as about the overall price level pushes debt markets to require
higher risk premium to compensate it.
o In case of high and volatile inflation, investors tend to concentrate more on the short-
term financial investments and on hedging against inflation and less on investment
projects with longer-term returns. The economic growth is based primarily on long-
term investments.
o In times of high inflation, people and enterprises spend more time thinking about how
to hedge against inflation and concentrate less on productive activities, i.e. the
production of goods and services. They also spend additional costs of monitoring
economic development and actions taken by central bank.

176
o High inflation often means higher interest rates that attract short-term speculative
capital. This can lead to fluctuations of exchange rate.
o If the higher inflation lasts for a longer period, economic entities implement higher
inflation expectations into their decision-making processes.
On the other hand, there are a number of arguments for evading the zero inflation targets.
First, the economy is subject to the so-called downward nominal rigidities. That means that
prices and wages usually do not fall even if the market equilibrium would require it. If there is
a low inflation, prices and wages can fall relatively. Low inflation can make the price system
more efficient. Second, statistical observation can overestimate inflation. This would be the
case when it does not take into account increasing quality of goods and services. Central bank
could consequently take false steps and target lower inflation compared with the situation if
these observations are correct. These argument help justify the general approach of targeting
low positive inflation. Many central banks target inflation close to 2 %.
When achieving the price stability, central bank has to take into account many long-term and
short-term accompanying effects. In a long-term, price stability contributes to GDP growth
and employment. However, in a short-term, it can cause certain pressures between efforts for
the price stability on one hand and GDP growth and employment on the other hand. It might
be the case in times when the economy faces supply side shocks such as poor harvest of
agricultural products or increased oil prices pushing prices upwards and causing economic
slowdown and increasing unemployment. Under such conditions, central bank has to decide
whether and how much it will seek to stop inflation or whether and how it will strive to
support economic growth and employment. Public can also incorporate higher inflation
expectations into its decision-making about prices and salaries, i.e. these expectations become
the self-fulfilling prophecy and cause the temporary fall of GDP and employment. Central
bank must, therefore, use a tighter monetary policy, which can bring certain risk of short-term
falls in GDP and employment. However, such costs are usually justifiable, since the costs of
higher inflation expectations would be much higher.
Central bank achieves its targets more efficiently if the public understands well these
targets and if it is convinced that central bank will do its best to achieve it. For instance, a
credible anti-inflationary policy realized by means of reducing the growth of aggregate
demand can reduce the public’s inflation expectations, which can help reduce inflation.
Employees will not require higher growth of their wages and enterprises will be raising their
prices more slowly. Inflation will consequently decrease proportionally to the fall of

177
aggregate demand whilst the slowdown of the resources markets will be lower than if the
higher inflation expectations persist.
2.5.2 Definition of Inflation
Inflation is the rise of prices in a given economy. The real value of given currency in relation
to consumer goods and services decreases. If there is inflation, consumer needs to purchase
the same basket of goods and services for more and more units of currency. In practice, we
measure inflation by means of the so-called consumer price index (CPI), GDP deflator and
producer price index. The double-digit inflation accompanied by the stagnation of economic
growth is called stagflation. The fall of prices in a given economy is called deflation. The
process of the inflation slowdown is called disinflation.
Hyperinflation means the loss of purchasing power of a given currency in such an extent that
a price comparison of transactions taking place at different moments gets misleading.
Hyperinflation features the following characteristics:
o The general population prefers keeping its wealth in the form of non-monetary assets
or in form of a relatively stable foreign currency,
o The general population considers money amounts denominated in domestic currency
as being denominated in a relatively stable foreign currency,
o Sales and purchases on credit take place at prices that compensate for the expected
loss of purchasing power during the credit period,
o Interest rates, wages and prices are linked to price index, and
o The cumulative rate of inflation over three years is approaching, or exceeds, 100 %.
As a deterring example, we could mention the German hyperinflation caused by the war
reparations. This hyperinflation resulted in a dangerous rise of political extremism.
Consumer price index (CPI) refers to the inflation in relation to the given consumption
basket only. CPI is measure of inflation from the point of view of consumer. However, there
are several technical problems. The determination of consumer basket, for instance, depends
on consumption of all households and on the choice of particular goods and services
reflecting increasing quality of goods and services.
To calculate the consumer price index, Laspeyres’ index I is generally used:
I = ∑pnq0 / ∑p0q0

178
Where: pn = prices of goods (services) in the current period,
p0 = prices of goods (services) in the base period,
q0 = fixed weights of goods (services)
The weights q0 remain constant for several years, since the structure of households’
expenditures does not change too much. This figure measures the so-called “net price
changes”, i.e. price changes not influenced by changes of the consumption basket structure.
In the United States, there are two consumer price indexes. The CPI-U index concerns all
urban consumers and covers about 87 % of population. Financial markets focus very carefully
on it. The CPI-W concerns urban wage earners and clerical workers and it covers about 32 %
of population. Both indexes are published by the U.S. Department of Labour, Bureau of
Labour Statistics at the website http://stats.bls.gov (or http://www.dol.gov) monthly, two or
three weeks after the end of a given month. These indexes measure prices of a fixed
consumption basket of goods and services. The Eurozone is using the harmonized index of
consumer prices (HICP). HICP index contains prices of goods (61.9 %) and services (38.1
%). Monetary policy in the United Kingdom had been based on retail price index excluding
mortgage payments (RPIX) till December 2003 when RPIX was replaced by CPI (UK HICP).
In Japan consumer price index (CPI) is compiled by the Statistics Bureau, Ministry of Public
Management, Home Affairs, Posts and Telecommunications adopting the Laspeyres formula.
Index items are composed of 598 items which are selected according to the relative
importance of each item in total living expenditures.
Producer price index (PPI) measures the inflation of domestic producers’ prices. PPI
measures inflation from the point of view of sellers. The U.S. Department of Labour publishes
PPI at the same web site as it publishes the CPI.
GDP deflator measures inflation concerning the whole GDP and not only the consumption
basket. GDP deflator reacts automatically to changes of consumer preferences, i.e. it takes
into account new goods and services and excludes the non-attractive ones.
2.5.3 Real and nominal interest rates
Real interest rate denotes the nominal interest rate deducted by the depreciation of real value
(i.e. purchasing power) of money during some period. This depreciation is measured by
inflation. The real interest rate is, therefore, the nominal interest rate deducted by inflation. If
we calculate the real interest rate at the end of period, we talk about the ex post approach. In

179
such a case, we use the already measured inflation, and we get the ex post real interest rate. If
we calculate the real interest rate before the end of period, we talk about the ex ante approach.
In such a case, we use the expected inflation, and we get the ex ante real interest rate. One
nominal interest rate can correspond to a number of ex ante real interest rates, since
economists can expect different inflation. The relation between nominal interest rate r, real
interest rate R and inflation i during the period t (in a number of days) is (we use the
annualized values r, R and i):
whence:
In case of time period of one year, i.e. t = 360 days, the former relation is simplified as:
Provided that both nominal interest rates and inflation (either actual or expected) are low, we
can use the approximation consisting in deduction of inflation from the nominal interest rate:
Let’s take an example of the higher inflation environment. Suppose that the nominal interest
rate is 8 % and the expected inflation equals 10 % (annualised values). Then the real interest
is given by:
i.e. R = –1.82 %
Using the approximate formula, we would get the real interest rate R ≈ –2.00 %. The real
interest rates in a high inflationary environment are usually (not generally) negative.
⎟⎠⎞
⎜⎝⎛ +⋅⎟
⎠⎞
⎜⎝⎛ +=⎟
⎠⎞
⎜⎝⎛ +
3601
3601
3601 titRtr
tti
trR 3601
3601
3601
⋅⎟⎟⎟⎟
⎠
⎞
⎜⎜⎜⎜
⎝
⎛
−+
+=
111
−++
=irR
irR −≈
0182.0110.0108.01
−=−++
=R

180
Our next example relates to a deflationary environment. Let the nominal interest rate is 2 %
and the expected deflation equal 1% (annualised values). Then the real interest is given by:
i.e. R = +3.03 %
Using the approximate formula, we would get the real interest rate equal to R ≈ +3.00 %. The
real interest rates in a deflationary environment are usually (not generally) positive.
Demand for goods and services does not depend on nominal interest rates. It is a
function of real interest rates. Real interest rates influence entities (households and
enterprises) in their decisions about expenses. In 1978 the U.S. federal funds rate amounted in
average to 8.0 %. However, the inflation reached 9.0 %. The real interest rate was – 1.0 %.
Monetary policy was thus stimulating the demand. Conversely, in 1998, the nominal interest
rate amounted in average to 5.8 % while the inflation was low on a level of 1.7 %. The real
interest rate amounted to + 4.1 %. Monetary policy was thus tightening the demand. It
follows that the nominal interest rate of 8 % in 1978 was more stimulating demand than the
nominal interest rate of 5.8 % in 1998. Long-term real interest rates in some countries are
summarised in table 2.1.
Table 2.1 Long-term real interest rates in some countries
Country Period Average official interest rate Average inflation
Average real interest rate
United States 1972-2004
Federal funds rate
6.8 4.8 2.0
Eurozone 1999-2004
Main refinancing operations interest rate
2.9 2.0 0.9
Japan 1972-2004
Uncollaterised overnight call rate
4.4 3.4 1.0
United Kingdom 1972-2004 Repo rate 9.0 7.1 1.9
0303.0101.0102.01 +=−
+=R

181
2.5.4 Deflation
Deflation is the fall of prices in a given economy. Deflation can be (but not necessarily)
accompanied by the economic slowdown, rising unemployment, rise of real interest rates,
serious troubles of banks and enterprises and general uncertainty. Many economists consider
deflation more dangerous than modest inflation. It seems that deflation represents a very
serious problem.
a) Historical evidence
Deflation represented a common phenomenon in the 19th century (Figure 2.2). It was a
period of deflationary economic growth. In the United States, it was due especially to the
expansion of the railroads. Within those 30 years, prices fell by 50 % while the economy was
growing by 4.3 % yearly in average. However, during the World War I and soon after it, the
United States has experienced high inflation as many other countries.
But the inflationary period did not last for a long time. Period from 1920 to the beginning of
World War II can be again called deflationary. From 1929 to 1933, the price level of the
world largest economies fell by 30 %. This deflation was accompanied by the comparable fall
of production, chain of bankruptcies and the highest unemployment of modern times.
By contrast, after the World War II, world has experienced a long period of inflation. In the
United States, prices have increased by almost 1,000 % from 1800 to 2002. In the United
Kingdom, prices have increased during the same period by almost 4,800 %. Within the last
sixty years, the world was afraid almost exclusively of inflation and not of deflation.
According to Figure 2.3, inflation in developed countries was gradually increasing since
1950s. It has reached its peak in 1970s and since that time, it is gradually decreasing. In
1990s, the world has experienced global disinflation. Commodity prices decreased
substantially because of falling demand of Eastern-Asia countries, particularly of Japan. As a
result, producers’ prices in the Europe and in the United States were falling. Since more than
two thirds of the GDP in developed countries consists of services, deflation did not expand.
However, the beginning of new century is characterized by deflation in only one major
country (Japan).

182
0
50
100
150
200
250
300
350
400
450
500
1800 1820 1840 1860 1880 1900 1920 1940 1960 1980 2000
%
0
500
1000
1500
2000
2500
3000
3500
4000
4500
5000
1800 1820 1840 1860 1880 1900 1920 1940 1960 1980 2000
%
CPI - the USA RPI - the United Kingdom
Figure 2.2 CPI and RPI development in the United States and the United Kingdom
respectively (charts differ only in scales of their vertical axes) according to Rogoff20
20 Rogoff, Kenneth: Deflation: Determinants, Risks, and Policy Options — Findings of an Interdepartmental Task Force. IMF, Washington 2003.

183
Figure 2.3 The average yearly change of the CPI in developed countries according to Rogoff
b) Causes of deflation
Economists usually mention the following main causes of deflation:
o Fall of the shares’ prices,
o Fall of real estate prices,
o Industrial overcapacities (i.e. excess supply of goods and services),
o Increasing households’ preferences to save instead of spending (i.e. falling demand),
o Sudden fall of key commodities’ prices,
o Deflationary development in countries of major business partners,
o Rapid liberalization of labour or of a financial market,
o Appreciation of domestic currency,
o Rigidity of nominal wages and salaries.
Causes of deflation usually consist in a foregoing speculative bubble at markets of certain
assets when the non-realistic expectations of investors drive prices too high. Naturally, this
cannot last eternally and these markets eventually collapse. This is usually the case of shares
and real estate. Deflation of 1929 started after the collapse on stock exchange. This crash has
provoked numerous bankruptcies, falling prices and finally the Great Depression. Deflation in
0
1
2
3
4
5
6
7
8
9
1950-59 1960-69 1970-79 1980-89 1990-99 2000-03
aver
age
year
ly d
evia
tion
of th
e co
nsum
er p
rice
inde
x, %m

184
Japan started in the middle of 1990s after the fall of the stock and real estate market. Both
deflations represented the epiphenomenon of economic crisis.
c) Effects of deflation
During deflation, both prices and wages are falling. The purchasing power of money is
increasing and real interest rates increase as well (nominal interest rates are converging to
zero and prices are falling). Lenders and people who save and live from capital have benefit
from such situation. Deflation redistributes significantly the wealth from borrowers to
lenders, for prices are falling more rapidly that wage and loan contracts. Deflation increases
the real value of claims. Lenders are getting richer and borrowers are becoming poorer. Real
wages are rising which affects negatively enterprises that are paying wages. Under falling
prices the real value of money rises. Such situations motivate people to save and postpone
their consumption, since “prices will be lower in few weeks”. Nominal interest rate of 1 %
represents under the deflation of 2 % the real yield of 3 %.
Enterprises find themselves under the double pressure. Both real repayments of their debts
and real labour costs are rising. At the same time, however, the demand for their products is
decreasing. To overcome these difficulties for a short term at least, they lower prices, which
makes deflation even worse. Falling demand results in falling income and profit. Since the
growth of real wages cannot be maintained in a long term, enterprises will have to, sooner or
later, decrease nominal wages and reduce staff. Once this happens, households reassess their
expectations and reduce their demand. This produces further deflationary pressures.
Enterprises produce goods that cannot be sold. Consequently, they become unable of repaying
their debts. They would be able to repay it only if interest rates were falling too. However,
this is not possible, since interest rates cannot fall below zero. Enterprises thus turn bankrupt
and banks soon follow them.
Households face serious problems as well. Their wages are under the permanent pressure.
Either they will accept reduced social benefits and frozen or lower wages or they will be fired
and maybe they will be hired later for lower wages and social benefits. Decreasing prices
force entrepreneurs to cut their margins, production and investments. Households
consequently reduce their consumption, which is, however, the main factor of economic
growth.
Banks suffer serious loses since loans are more impaired (repayment of loans rapidly
worsens) and the value of collateral fall. Credit crunch starts. Banks want to borrow money

185
but nobody wants it even if it is free of interest. The demand for loans falls to zero. Financial
flows slow down. “Old” borrowers turn bankrupt, since repayments of interests ruin them.
Borrowers’ crisis becomes banking crisis. If the deflation lasts for several years, enterprises
reduce investments and households reduce consumption.
Both enterprises and banks do not profit and they reduce their economic activity. This opens
the deflationary trap and spiral of decreasing prices, GDP, profits and employment. The
output gap gets larger. These hardly predictable process result in further instability of the
economy, public loosing confidence in banking sector, corporate bankruptcies, high
unemployment and enormous costs of renewing integrity of the economy. Price development
thus gets its own dynamics exceeding the original impulse.
Is the deflation good or bad? The answer is hardly unambiguous. If the deflation is of
structural character (e.g. world economic crisis in 1930s or Japanese crisis in 1990s), then it is
unquestionably bad, for such deflation is usually bound up with high unemployment and
economic crisis. On the other hand, if the falling prices follow from implementation of new
technologies and increasing productivity, there is nothing bad about it, since real incomes,
demand and production further grow. Before the World War I, a decline in the average price
level was quite common during periods of rapid technological change, such as the late 19th
century; yet these were also periods of strong growth. Nowadays productivity in come
countries is growing thanks to the globalization and implementation of informational
technologies. However, decreasing prices raise more fears than in the past.
d) Monetary policy in case of deflation
Central bank can fight against deflation only by lowering interest rates. There is no other
vehicle. However, once central bank lowers interest rates to zero and deflation continues, it
can not do anything more than to hold interest rates at zero (it is impossible to go below zero)
and wait until the deflation stops itself. Once there are zero interest rates, central bank
gets out of operation. Deflation is like a black hole. Once the monetary policy falls into it, it
looses all its powers. Such a situation is sometimes called Keynesian liquidity trap.
e) Deflation in our times
Today, Japan represents a classic example of a country facing deflation. Prices in Japan are
falling since the first half of 1999. Japan had adopted an almost-zero interest rate policy (0.5
% for the target call rate) in September 1995 and a zero interest rate policy since February

186
1999, a strategy which the Bank of Japan hoped would be successful in lifting the economy
out of the bottleneck. However, the Japanese economy in the 1990s resembled the United
States during the Great Depression of the 1930s. Unemployment in Japan in the 1990s was
high by post-World War II standard but had not even reached double digits (5.4 per cent in
September 2002). Deflation was moderate as the CPI index declined from 103.3 in October
1998 to 100.0 in September 2002. The share prices declined but the stock market did not
crash − the share index of Nikkei-225 went down from a high of 169.6 in March 2000 to 80.2
in August 2002.
It is supposed that the Japanese deflation has started in reaction to the end of bubble of the
real estate market. Prices of real estate have fallen rapidly, which have lowered the value of
collaterals of the bank loans. Subsequent problems of banking sector have affected the whole
economy. Interest rates have fallen to zero. Falling prices further negatively affect
consumption expenditures. Lower demand reduces corporate profits, damages banks and
decreases GDP of the world second largest economy. The period of 1990s is sometimes called
“lost decade”. Japan has spent over ¥100 trillion on public works and other governmental
projects in order to encourage its private sector. However, results of this enormous spending
were almost none. The public debt reached almost 165 % of GDP by the end of 2004 which is
by far the highest ratio among the developed countries.
In Eurozone some signs of future deflation exist as well. The economic growth is very low.
The number of unemployed people rises and the consumer confidence stagnates. Deflation
can get even worse and can expand to more countries. It follows that there is a real threat of
global deflation in the future. The distraction of the global fall of prices will not be easy, since
there are new economies entering the world economic system, such as China, India, which are
able to produce goods of the same quality for a much cheaper price.
2.6 Inflation targeting
Inflation targeting is the monetary policy regime when the central bank tries to achieve its
ultimate target (price stability) directly by means of operating target and not through the
intermediate targets. Central bank publicly announces an explicit inflation target for a given
time horizon and consequently regulates short-term interest rates (i.e. the operating target) so
that the inflation will reach the desired level. To set the short-term interest rate, central needs
to know first the difference between the expected and targeted inflation. At the same time,

187
central bank must take other intermediate variables of non-target character into account.
Another important feature of this strategy is its mid-term character. Central bank seeks to
create transparent system. Monetary decision-makings in this system is subject to clear rules
and procedures. System should allow central bank to follow its long-term price stability target
while pursuing the active anti-cyclical monetary policy.
2.6.1 History of inflation targeting
In 1990s, many central banks decided to use explicit monetary policy targets (e.g. inflation
target, money stock target, exchange rate target or the combination of these). Most of these
central banks chose to target inflation or to target inflation together with other economic
variables. This tendency is common to both developed and developing countries. According
to Bank of England, number of countries targeting exchange rate has increased during 1990s
from 30 to 47. Number of countries targeting money stock has increased form 18 to 19 and
the number of countries targeting inflation has increased from 8 to 54. Thirteen of those
countries were using inflation as their only monetary target. At the beginning of 1990s only
New Zealand used inflation as its main target.
On the other hand, during 1990s 17 countries abandoned some form of target or changed the
explicit monetary policy target. Ten of these countries have abandoned the exchange rate
target (e.g. the United Kingdom, Finland, Croatia, Czech Republic, Sweden) mostly in
reaction to exchange rate crisis. No country abandoned inflation targeting yet.
The inflation targeting “takes everything into account”. However, large number of
information contains contradictory signals. Information needs to be, therefore, classified. That
is why central banks are trying to work out lists of suitable indicators. One of these indicators
is the output gap. Another one is the deviation of expected inflation from inflation target.
None of these indicators is faultless and monetary policy thus follows a relatively large
number of variables.
Inflation targeting represents a relatively general monetary policy containing other monetary
policy regimes as special cases. Let’s compare the inflation targeting regime with the money
stock targeting regime. Both contain inflation (explicitly or implicitly) as its ultimate target.
Taking into account the transmission lags of monetary policy, both of these regimes use the
same operating target, i.e. the short-term market interest rates. The difference between these
two regimes consists in weights assigned to informational variables. Inflation targeting regime
employs the broadest set of information to which it assigns different weights. Conversely,
188
money stock targeting regime considers only money stock and ignores information of non-
monetary substance. From this point of view, money stock targeting represents a limit case of
inflation targeting where the weight assigned to money equals one and the weights assigned to
other factors are zero.
Inflation targeting does not represent a new mode of monetary policy. Knut Wicksell, Irving
Fisher and John Maynard Keynes were advising targeting of price indexes already at the
beginning of 20th century. Sweden implemented the price target already in 1930s in order to
avoid depression resulting from collapse of golden standard. Inflation targets were
implemented for the first time in New Zealand (in March 1990). This measure was followed
by other fundamental changes of economic policy including the statute of central bank. New
Zealand was followed by Canada in February 1991. The United Kingdom has implemented
inflation targeting after leaving the exchange rate mechanism (ERM) in September 1992.
Sweden has launched inflation targeting in February 1993, Finland in March 1993 and
Australia is supposed to have implemented this regime in April 1993. Central banks of these
countries are publicly announcing their inflation targets. None of these banks specified rules
to achieve these targets. The Eurozone did not implement the pure inflation targeting system
yet.
In Table 2.7 Mervyn King from the Bank of England shows the average inflation of six
countries targeting inflation before and after the implementation of this regime. Almost all
countries succeeded in significantly lowering their inflation. Lower inflation did cause neither
economic slowdown nor increasing variability of GDP growth. The question arises as whether
this was really caused only by inflation targeting or by some other factors (inflation in these
countries started to lower already before the launch of inflation targeting). On the other hand,
it is evident that all of these countries have experienced an essential economic recovery.
Inflation targeting brought certain rules and discipline into the central bank’s decision-making
process. As a result, to predict central bank’s reactions to economic development has become
easier. Hence, not only particular decisions of central bank represent relevant information to
financial markets but also the published statistical data serve so. Roughly speaking, inflation
targeting is a successful monetary policy since it has helped stabilize low inflation (even if
sometimes out of targeted corridors).

189
Table 2.2 Average inflation and GDP growth in countries targeting and not targeting inflation according to King21
Countries not targeting inflation
Average Inflation Average growth of GDP 1980s 1990s 1980s 1990s Inflation Variability Inflation Variability Inflation Variability Inflation Variability
France 7.4 18.86 2.3 0.56 2.3 1.95 1.4 2.33 Italy 11.3 35.85 5.2 0.94 2.4 2.52 1.2 2.11 Japan 2.5 5.14 1.4 1.67 3.8 1.49 2.2 3.79 Germany 2.9 4.69 3.1 2.01 1.8 3.18 2.1 4.67 USA 5.6 12.52 3.4 1.13 2.8 6.91 2.1 2.30 Average 5.9 15.40 3.1 1.30 2.6 3.20 1.8 3.00
Countries targeting inflation
Average Inflation Average growth of GDP 1980s 1990s 1980s 1990s Inflation Variability Inflation Variability Inflation Variability Inflation Variability
Australia 6.2 8.41 2.7 1.71 3.2 10.18 4.2 0.96 Finland 5.2 3.37 1.1 0.51 1.4 17.33 3.2 6.49 Canada 5.8 7.90 2.0 2.51 2.8 9.99 1.9 3.09 New Zealand 11.6 25.70 2.5 2.70 1.8 6.95 2.4 7.78 Sweden 6.6 6.65 2.3 2.29 1.6 4.73 1.9 5.09 United Kingdom 5.2 2.21 2.8 0.09 2.4 5.76 3.0 1.04 Average 6.8 9.00 2.2 1.60 2.2 9.20 2.8 4.10
There have been a range of recent contributions evaluating the success of inflation targeting,
for example, Bernanke and Woodford22 and Levin, Natalucci and Piger23. Woodford’s
textbook24 is an excellent treatise on matters of transparency and accountability, as well as
implementation.
21 King, Mervyn Allister: The inflation target five years on. Bank of England Quarterly Bulletin, 1997, November, 434-42. 22 Bernanke, Ben S. and Woodford, Michael (eds): The Inflation Targeting Debate. The University of Chicago Press, Chicago 2005. 23 Levin, Andrew T., Natalucci, Fabio M. and Piger, Jeremy M.: The Macroeconomic Effects of Inflation Targeting. Federal Reserve Bank of St. Louis Review, 86(4), 51-80. 24 Woodford, Michael: Interest and Prices: Foundations of a Theory of Monetary Policy. Princeton University
Press, Princeton 2003. Woodford, Michael: Central Bank Communications and Policy Effectiveness. Paper. Columbia University,
New York 2005.

190
There have been, however, also cogent arguments against inflation targeting. Many
economists believe that a simple announcement of inflation target cannot reduce inflation. No
country has reduced the inflation by a “divining rod”. Some central banks have proclaimed
that they do care only about inflation (“inflation nutter”) and they were keeping a distant
attitude toward any strictly specified inflation targets since it was clear that monetary policy
cannot adjust inflation in short-term and that there are short-term impacts on real economy.
There exists a possible trade-off between the volatility of inflation and volatility of GDP.
Inflation targeting represents a mid-term policy. Central authorities hence announce rather the
desired inflation and factors supposed to affect it. Some of these factors can represent a
significant source of inflationary pressures (e.g. wages, public finances, foreign trade) while
being out of central bank’s control. Central bank thus needs a precise knowledge of both past
and current development, premeditation of its actions and cooperation with other central
authorities such as treasury department.
This monetary policy trend requires the three following prerequisites:
o Guarantee that the price stability represents the main target of monetary policy; that is
what differs central bank from other central institutions,
o Guarantee that other public authorities (particularly government) will cooperate on the
declared policy as well, and
o Central bank puts the announced monetary target into practice based on its own
judgments on situation.
Inflation targeting is based on two main pillars:
o Explicit inflation target, and
o High transparency and responsibility of central bank.
2.6.2 Explicit inflation target
Among the main features of inflation targeting belongs the public announcement of the
explicit inflation target or of a series of targets by central bank (often in cooperation with
treasury department or other central authorities). Central bank communicates thereby its target
towards public. Such a target helps create environment suitable for much more intensive
manipulation of inflation expectations. Inflation target should be higher than zero in order to
avoid deflation. Developed countries usually use target varying from 2 to 3 %. Inflation
targets take usually form of intervals declaring where the inflation should be on a certain

191
moment (e.g. by the end of the year) or of continuous decreasing or horizontal bands. This
policy thus represents an active and direct determination of inflation expectations. Inflation
band should be publicly announced and subsequently compared with current inflation.
Inflation targeting also reduces uncertainty. Both household and enterprises know that if the
inflation exceeds bounds of the given interval, central bank will intervene to reduce it.
Inflation target does not represent a fixed band within which the inflation should be at any
time. These bounds do not represent the electric fence. Central banks cannot influence all
items of consumer price index. Some central banks target, therefore, rather an index excluding
prices out of central banks’ control. These indexes are called core inflation and net inflation.
There is no monetary aggregate or exchange rate used explicitly as an intermediate target.
There are also other factors determining inflation. The absence of monetary intermediate
target thus does not represent the absence of the main target. Among these other factors, we
should mention particularly labour market variables, import prices, producers’ prices, output
gap, real and nominal interest rates, real and nominal exchange rate, public finances. This
regime accounts for these variables as being predictable and useful for managing inflation.
Some of these factors can be influenced by interest rates, i.e. by central bank. Other factors
such as wages, public finances, foreign trade are always out of the central bank’s control. This
regime thus relies more on the elaborate procedures and decision-making than on mechanical
actions taken based on some fixed rules.
The Bank of Canada is cooperating on setting of the inflation target with the government. The
same holds for the Bank of England. Central bank should be independent in activities
designed to help it achieve its target, but the setting of targets should be subject to discussion
with other institutions. It is important especially in a long term. Once the government agrees
to cooperate in maintaining stable inflation, it cannot conduct too expansive fiscal policy
since otherwise it would contradict its own objective.
If the prognosis shows that inflation will exceed the target, monetary policy should take
measures that are more restrictive, i.e. to increase the short-term market interest rate.
However, the deviation of prognosis from target can result from exceptional circumstances,
shocks whose inflationary symptoms can abate soon. In such a case, monetary measure could
superfluously damage the economy. Such circumstances make usually part of the official list
of exceptions and central bank does not react to them.

192
2.6.3 Transparency and accountability of central bank
Inflation targeting does not represent a radical shift in monetary policy regimes. The most
important feature of this regime is the accent on transparency and responsibility of
central bank. Transparency plays a very important role since:
o It reduces uncertainty about the status of monetary policy,
o It helps change the behaviour of public so that it supports monetary policy targets,
o It increases discipline of central bank over its market operations and makes more
responsible for success of these operations.
Operations of central bank should not be confidential. Behaviour based on rules represents
one of the monetary policy’s privileges. Central bank introduces thereby predictability and
assures markets that expectations correspond to the target of stable prices. Predictable
monetary policy (not in terms of stable interest rates but in terms of predictable reactions to
changes of the economic development) reduces disturbances produced normally by monetary
policy itself. Monetary policy should avoid GDP and employment fluctuations caused by
uncertainty.
Transparent monetary policy means that the announced changes of the official interest rate
do not represent surprise to market. Economic news should not seek to estimate decisions
of body responsible for short-term interest rates but to provide business statistics. Based on
these statistics, market shall be ready to forecast central bank’s decisions. Converse monetary
policy means that decisions of central banks are unpredictable and monetary policy does not
conform to the economic development. In the extreme case, when the decisions of central
bank are fully accidental, business news have no impact on market short-term interest rates
and all market players concentrate rather on decisions of central bank. Transparency means
that monetary policy is easily predictable.
According to King25 the accountability of central bank represents the answer to questions “to
whom” and “for what”. Bank of England is accountable to the Chancellor of the Exchequer
for implementing his inflation target, to Parliament through the Treasury Select Committee
(TSC), to the Court of Directors of the Bank of England for the proper conduct of the
monetary Policy Committee (MPC) and, more widely, to the public at large. Currently, there
are five ways of Bank of England responsibility:
25 King, Mervyn Allister: The Inflation Target Five Years on. Bank of England Quarterly Bulletin, 1997, November, 434-42.

193
o The decisions of the MPC are announced immediately following the monthly meeting
at 12 noon on a Thursday. The minutes of those meetings are usually published 13
days late after the MPC meeting. These minutes contain not only an account of the
discussion of the MPC, and the issues that it thought important for its decisions, but
also a record of the voting of each MPC member,
o The Inflation Report represents the basis for accountability to Parliament. The original
objective of the Report was to act as a disciplining device on Government. The Report
would set out views of the likely implications for inflation of decisions taken (or not
taken) by the Chancellor. After the responsibility has been delegated to the MPC, the
Report plays a rather different role. It is now an instrument of accountability. It is one
of the principal ways in which the explanations of the MPC can be assessed and
subjected to scrutiny by outside commentators,
o MPC members respond to the TSC. They are asked to appear before the TSC
following each Inflation Report,
o The MPC is required to send an open letter to the Chancellors if inflation is more than
1 % on either side of the target of 2.0 %. It is important to stress that avoiding the need
to write such letters is not the objective of monetary policy. The inflation target is not
a range of 1.0 % to 3.0 %, it is a target of 2.0 % on average. Indeed, one of the main
purposes of the open letters is to explain why, in some circumstances, it would be
wrong to try to bring inflation back to target too quickly. In other words, the MPC will
be forced to reveal in public its proposed reaction to large shocks.
o Finally, the MPC is accountable to the Court of Directors of the Bank of England for
the procedures it adopts and the proper conduct of its business. The 16 non-executive
members of the Court report annually to Parliament on the conduct of the Committee,
and the Annual Report is debated in Parliament.
King follows with the answer to the question of accountability “for what”. Bank of England is
accountable for reaching the inflation target of 2.0 %. In fact, however, unpredictable shocks
can deviate inflation from this target. In addition, long lags between changes of interest rates
and impacts on inflation mean that to compensate shocks will take some time. This also
means that MPC cannot always maintain the inflation at 2.0 % level. If, in addition, these
shocks come from the supply side, which increases inflation even if the GDP is currently
decreasing, maintaining of inflation at 2.0 % would be hardly desirable. To test whether the

194
monetary policy works well we need to use the average inflation for several years and
compare it with the desired level of 2.0 %. Regarding the uncertainties and lags, it is quite
impossible to answer unambiguously the question whether a certain decision was right or not.
Accountability thus does not comprise simple comparison of inflation with target. MPC must
clearly explain all its actions. All its members were elected to reach the explicit inflation
target of 2.0 %.
2.6.4 The role of inflation forecasts
As the lags between changes of monetary policy and their impacts on inflation are long and
variable, monetary policy must be based upon forecasts. Inflation targeting does not mean that
monetary policy acts in reaction to current inflation but it reacts to changes of the expected
inflation. The rise of interest rates afterwards the inflation has already speeded up is a too late
measure that can hardly avoid further rise of inflation and instability of inflation and GDP.
On the other hand, inflation forecasts can easily discredit central bank since it is very difficult
to estimate inflation for the period of more than one year. Monetary policy thus needs to rely
upon its intermediate targets having a closer relation to inflation. To put it another way,
intermediate targets must provide a good estimate of inflation. It is more convenient to
express explicitly the forecast not by means of a single number but by means of a stochastic
prediction. To increase the credibility of such forecasts, central banks publish fan charts of
inflation prognosis including probabilities of reaching given areas of the fan. Inflation reports
prepared by Bank of England, for instance, include charts depicting probabilities of individual
results over the next two years. The central area represents the most likely result (probability
of 90 %), following are a bit less likely result (80 %) and so forth. Like in other fields of
business, decision-makings must be based on probabilities. Inflation reports contain charts
representing data available to MPC.
When deciding about interest rates central bank faces two problems. First, the adequate
reaction to supply shocks is to turn inflation back to the target. How long will it take depends
upon the character of a given shock, two years or a bit more seem adequate. If the inflation
during that time rises or decreases, then the optimal interest rate depends on this period when
inflations should be back to the target..
Second, if there is an uncertainty about the impacts of interest rates changes on economy,
central bank should change slowly interest rate until it reaches the desired level rather than
make a radical shift that would cause increased volatility of the economy. In practice, central

195
banks really change interest rates very sensitively. We should notice that even if forecasts
represent the basis for decision-making, nobody should use it automatically. In other words,
the optimal reaction of monetary policy cannot be derived solely from the expected
inflation and central bank should take into account shocks in economy that follow
monetary policy reaction.
2.7 Monetary policy transmission mechanism
To maintain low inflation does not represent a simple task. We know about this problem
relatively little. Transmission mechanism of monetary policy is the chain of economic
relations allowing central bank to influence inflation (eventually also GDP and employment)
by means of a change of the operating target (i.e. the market short-term interest rate). The
transmission mechanism begins with changes of operating target. This change leads to the
changes of the “intermediary” variables. This subsequently results in the change in the
“target” market whose price development the central bank seeks to influence. Transmission
mechanism works through several parallel channels. The regulation of interest rates is
sometimes called accelerator and brake pedal. However, this comparison rather fits to the
extremely active monetary policy.
2.7.1 Monetary policy channels
Figure 2.4 shows the scheme of monetary policy transmission mechanism, i.e. how the
monetary policy really operates. There are four channels: the credit channel, entrepreneurial
channel, expenditures channel and exchange rate channel. First three channels (i.e. credit,
entrepreneurial and expenditures channels) influence the domestic demand for domestic
goods and services. First channel and entrepreneurial channel (partly) operate indirectly
through the money stock. Expenditures channel and entrepreneurial channel (partly) operate
directly.
Plus and minus signs indicate the direction of transmission in case of step reduction of short-
term interest rates provided that the expected inflation remains unchanged, i.e. in case of step
reduction of the nominal short-term interest rate (and also the real short-term interest rate). If
the central bank raises nominal interest rates, transmission operates in the opposite direction.
This illustration deals with the impact of short-term interest rates reduction, provided that
other things remain unchanged. We suppose further that fiscal policy remains unchanged too.

196
Figure 2.4 Transmission mechanism of monetary policy (white areas represent the effects of prices of foreign goods and services)
Credit channel is the channel of loan supply on the part of banks and demand for loans on
the part of their clients (household and enterprises). Households make decisions about
whether to apply for consumer loan, mortgage loan and so forth. Enterprises make decisions
about applying for loans for their businesses. Banks evaluate applications for loans and finally
decide on the of anticipated client’s capacity to repay the loan. To evaluate it correctly, bank
must take into account number of factors such as the expected economic development,
prospects of given business sector and the like. Through this channel the system determines
the amount of loans, i.e. the money stock. In a long term, money stock has certain impacts on
inflation. In a short term, this does not have to hold. In some countries (e.g. in Japan), money
stock increases while the prices fall.
Real short-term
interest rate (–)
=
nominal short-term
interest rate (−)
minus
expected inflation
Credit channel
(+)
Money stock (+)
Domestic demand for domestic goods and services
(+)
Aggregate demand for domestic goods and services
(+)
Inflation, GDP and
employment (+)
Entreprene-urial channel
(+)
Expenditure channel
(+)
Foreign
exchange channel
(–)
Foreign demand for domestic goods and services
(+)
Domestic demand for foreign goods and services (–)
Prices of imported goods and services
Exchange rates

197
The lower short-term interest rate causes the increased demand for loans both on the
part of households and enterprises, which increases the money stock and thereby the
domestic demand for domestic products, the inflation, the GDP and the employment.
Lenders are less prudent to grant loans when the interest rates are lower. The increased
amount of loans serves partly to finance the additional consumption.
Households increase especially the demand for real estate, cars and other durable goods.
Lower interest rates reduce interest costs of borrowers and incentives to save. To households,
purchases of houses or apartments represent the major investments. Lower interest rates
motivate households to apply for mortgage loans. The number of new houses increases. The
increased housing construction influences also business sectors. Changing number of new
houses affects the demand for building materials and other goods and services for households.
The employment in building industry rises as well.
Mortgage loans represent the major part of households’ debts and the most of these mortgage
loans are connected somehow with the floating interest rate. Any decrease of interest rates
thus raises the remaining disposable income of these households, i.e. the same gross income
allows households to spend more for other goods and services. In case of unsecured loans
(e.g. consume loans) lower interest rates work similarly. The current level of consumption can
be increased without further debts. Households, therefore, expand their demand and
expenditures for goods and services. Remaining mortgage loans, which are not connected
with floating interest rates, do not allow households to benefits from lower interest rates until
the time of fixed interest payments elapses. New borrowers are influenced by lower interest
rates from the beginning of their mortgage contracts till the new fixing of interest rate.
However, this does not hold for all households. A person living from interest income will
suffer lower income. This lower income will force her to reduce expenditures.
In most countries, financial assets of households exceed their financial liabilities. But for
example in Australia, the sector of households is, in aggregate, the net borrower and therefore
the net payer of interests (net interest payments represent 5 % of the aggregate households’
income approximately). Roughly speaking, young people borrow the most, especially to
finance the purchases of houses. Consequently, they start to repay these debts and gradually
become net owners of financial assets. At first sight changes of interest expenses and interest
income with the change of interest rate of these groups get roughly balanced, i.e. the lower
interest rate decreases cash outflow of borrowers and simultaneously decreases cash inflow of
lenders. However, the interest rates elasticity of these two groups of households often differs.

198
Therefore, there is certain impact of interest rates changes on aggregate expenditures of
households. It is supposed, that borrowers are more sensible to changes of interest rates than
lenders since they do not possess enough financial assets to maintain their expenditures when
their incomes get changed. If that is so, decrease of interest rates will increase expenditures of
borrowers more than decrease expenditures of lenders. The net impact will, therefore,
represent the net increase of aggregate households’ spending. Conversely, the increased
interest rates will change aggregate expenditures in the opposite direction.
The expected increase of future demand motivates enterprises to increase their demand for
investment goods. The decreased interest rates further cause that more investments generates
the higher income. New investment projects get therefore realized. In practice, however, it is
hard to observe these movements, since there are a number of other factors determining
investments. Investments depend primarily upon the business cycle that affects demand for
goods and services and cash available for investments. Employment tends to increase.
The most of enterprises represent the net borrowers. Interest expenses usually amount to 25 %
of corporate income. Changes of interest rates affect, therefore, substantially their aggregate
expenses. By the end of 1980s, for instance, when the amount of debts and the level of
interest rates were relatively high, interest expenses were often amounting to nearly 40 % of
corporate income. These extremely high expenses have probably caused the subsequent
decline of business activity. Many enterprises are dependent upon short-term loans and
therefore very sensible to changes of short-term interest rates. Lower interest rates improve
the financial standing of these enterprises and, conversely, higher interest rates damage it.
This means that the probability of new investments increases when the interest rates fall.
Changes of financial standing motivate enterprises to re-evaluate their investment and
employment plans. Lower interest rates thus support activity and higher interest rates cause
postponement of investments and reduction of inventories. Lower interest rates do no affect
all enterprises in the same way. Enterprises that hold deposits get lower interest income.
Entrepreneurial channel is the channel of business activity. Business activity affects
domestic demand both directly and indirectly through money stock. The lower short-term
interest rate boosts business activity that directly or indirectly increases the domestic
demand for domestic goods and services, inflation, the GDP and the employment.
Expenditure channel is the channel of expenditure preferences or savings preferences of
households and enterprises. Thriftiness does not affect monetary aggregates but only the
velocity of money. Provided that the money stock remains constant, increased spending of

199
households and enterprises increases the velocity of money. If the aggregate production
increases in the same extent, the price level remains unchanged. If the aggregate production
grows slower than velocity, price level starts increasing. Household and enterprises are still
making decisions about what part of their wealth to hold in form of money and what part in
the form of other assets. If they decide to hold less money, they increase expenditures.
The lower interest rate makes economic agents prefer expenditures instead of savings.
That boosts directly the domestic demand for domestic goods and services and hence
increases inflation, GDP and employment. When people are not afraid of loosing their jobs,
they spend more. Households spend more on consumption and enterprises on investments.
Reduced savings mean that people do not postpone their consumption. Every economy
depends primarily on consumption expenditures.
Expenditures are also affected by the wealth effect, i.e. by assets’ prices. Roughly speaking,
lower interest rates increase the value of assets and the increased wealth boosts expenditures.
The market value of debt securities changes reciprocally to interest rates, i.e. lower interest
rates increase the value of debt securities and vice versa according to exact mathematical
equations. Lower interest rates also increase, ceteris paribus, prices of shares (however, not
according to the precise mathematical relations). It follows from the fact that future cash
flows are discounted using lower discount factors which means that the present value of any
future cash flows increases. In addition, shares can become more attractive than debt
securities. Prices of shares thus tend to rise. Higher prices of shares motivate enterprises to
issue more shares.
Real estates represent the decisive part of households’ wealth. Lower interest rates make
generally mortgage loans cheaper. Therefore, demand for real estate grows. Higher demand
increases prices of real estate. Changing values of houses influence households’ expenditures
in the same way as changes of financial wealth. Households feel wealthier when the value of
real estate in their possession rises. Houses can be also used as collaterals and households can,
therefore, borrow more money. In the United Kingdom, for instance, increasing prices of real
estate by the end of 1980s have boosted consumption. Conversely, lower prices of real estate
at the beginning of 1990s have reduced consumption.
However, changes of assets’ prices do not follow mechanically changes of interest rates.
These prices depend on a variety of other factors such as changes of expectations and business
cycle trends. The role of wealth effect in transmission mechanism is not too important.

200
In respect of the exchange rate channel, changes of short-term interest rates affect
immediately the exchange rate through the flows of capital (within the scope of the balance of
payments’ financial account) in reaction to changes of the difference between domestic and
foreign interest rates. The lower interest rates provoke the immediate outflow of speculative
capital (domestic currency becomes less attractive) that results under the floating exchange
rate regime in depreciation of domestic currency.
Foreign demand for domestic goods and services and foreign supply of goods and services
gradually change. There is the immediate increase of prices of imported goods and services
for domestic households and enterprises and immediate decrease of price of exported goods
and services for foreign households and enterprises. The prices of domestic exports fall and
prices of imports rise. Foreign demand for domestic production grows and domestic demand
for foreign production decreases. Export grows and import falls. The lower domestic short-
term interest rate depreciates domestic currency and increases, therefore, foreign
demand for domestic goods and services and decreases domestic demand for foreign
goods and services. Hence, the inflation, GDP and employment start growing.
Conversely, the appreciation of domestic currency affects adversely many domestic
producers. Producers have many fixed expenses denominated in local currency but they faces
competition from foreign producers whose expenses are fixed in other currencies.
Appreciation of local currency worsens the competitive position of the producers for their
profits are lower due to reduced sales. There is a number of sectors affected, such as
agriculture, manufacturing, hotels and other sectors dependent on tourism and financial and
consulting services. By making imports cheaper, appreciation of domestic currency affects
adversely domestic demand for domestic goods and services. Domestic economy thus faces
serious losses and contraction.
White areas of Figure 2.4 also show that besides transmission mechanism of monetary policy
there are other factors affecting the inflation, GDP and employment. Two of such factors are:
o The prices of imported goods and services expressed in foreign currencies,
o Changes of exchange rate caused by factors distinct from the short-term interest rate
change. Depreciated domestic currency immediately lowers the prices of domestic
exports and increases prices of imports. Depreciated domestic currency increases
foreign demand for domestic production and decreases domestic demand for
foreign production. Hence, the inflation, GDP and employment grow.

201
All of these four channels affect inflation, GDP and employment through its impacts on
demand for domestic goods and services in the same direction. The economists’ attitudes
towards the importance of individual channels differ. It is also hard to estimate time lags
between impulses and reactions. Time lags and feedbacks make the mapping of all these
processes very difficult. In addition, there is never a 100 % correlation between the individual
channels and the ultimate target of monetary policy, i.e. inflation.
If the demand for domestic goods and services rises, economy starts facing inflationary
pressures. The relation between demand and domestic capacities (including labour market)
represents the key factor determining domestic inflation pressures. If the demand for labour
rises, increasing wages soon affect domestic price level. Strong demand for labour enables
employees to ask higher wages. These impacts on wages and prices are closely related to each
other. Increased prices boost demand for higher salaries and higher wages soon increase other
expenses. Higher expenses soon force producers to increase prices. Once the wages start to
rise, it becomes very hard to slow it down.
The large number of inflation models shows that there still exist many doubts about the
correct understanding of monetary policy transmission mechanism. Some models stress the
role of money, others the role of other factors. Hence, none of these models can provide
complex solution.
Besides interest rates, moral suasion and negotiations with government and unions can
also have certain impact on inflation. In respect to government, central banks usually talk
about budget deficit. In case of unions, negotiations concern with future wage demand. Moral
suasion and negotiations represent a very powerful instrument. In the extreme case, central
bank can also impose the limits on the amount of loans granted by commercial banks.
2.7.2 Transfer to other market interest rates
Changes of the short-term interest rate (maturity of one day or one week, for instance)
transfers immediately to other short-term and long-term interest rates of the interbank market.
Once the central fixes a new “short end” of yield curve, the whole yield curve shifts since
banks immediately correct their interbank interest rates.
Modification of one short-term interest rate by a given value (e.g. by 0.25 %) does not mean
that all remaining interest rates change by the same value. Actually, the change of other rates
can even be in the opposite direction. The reasons for such development are as follows:

202
o If the market expects central bank to cut short-term interest rates, the medium-term
and long-term market interest rates lower before the central bank’s action, i.e. yield
curve shifts down itself. Hence, the action of central bank means a much more
moderate shift of the “long end” of the yield curve,
o Long-term interest rates depend also upon the expectations about the future
development of short-term interest rates. The strongly upward sloping yield curve (i.e.
long-term interest rates are much higher than short-term interest rates) can signal that
monetary policy became to expansive. Conversely, downward sloping yield curve
(short-term interest rates are higher than long-term interest rates) can signal that
monetary policy became to restrictive. If market expects that the current cut of interest
rates will be followed by future increase of short-term interest rates, long-term interest
rates can even increase. This means that the impact on long-term interest rates also
depends on changes of inflation expectations,
o Long-term interest rates also depend on a variety of other factors, such as uncertainty
about future interest rates. The upward sloping yield curve does not have to signal
necessarily that monetary policy became too expansive but also that market became
more uncertain about the future development of interest rates. In other words, liquidity
premium that make part of long-term interest rates has increased.
Within a few days after the change of short-term interest rates commercial banks change
interest rates to their clients, especially in case of new deposits and loans and in case of new
bonds. The interest rates spread between interest-bearing assets (especially of loans granted)
and liabilities (especially deposits) remain approximately constant. The credit spread can
change in course of time because of changed market environment, for instance. The credit
spread usually does not change in reaction to changes of short-term market interest rate.
Within a few months, interest rates of credit and deposit instruments bearing the floating
interest rates change as well. Floating interest rates of mortgage loans change usually even
later.
2.7.3 Effects of inflation expectations
Central bank can influence inflation to a certain degree by changing public expectations about
the future inflation. Figure 2.4 shows that the hypothetical step increase (decrease) of the
expected inflation can have the same impact on inflation (and on GDP and employment) as
the step decrease (increase) of the nominal short-term interest rate. Such a situation is quite

203
hypothetical since in practice since the expected inflation changes gradually and not in the
discrete steps.
Inflation expectations became important part on central banks’ monetary policies. Many
analysts study the impact of inflation expectation on inflation. Central bank, therefore, should
contribute to the formation of low-inflation expectations. If it succeeds, inflation gets really
lowered. The confidence of public represents the essential condition for this success. When
people do not trust the official rhetoric about lowe inflation and expect the increase of
inflation, prices and wages rise.
World economists study how to achieve favourable inflation expectations. Part of the answer
to this question lies in the construction of the monetary policy system. A system that clearly
sets the inflation target and markedly seeks to achieve it can help public to concentrate on
inflation expectations. These activities represent in many countries one of important parts
inflation targeting. Central institutions also have to demonstrate it clearly by means of the
practical monetary policy. Monetary policy must be consistent with its targets if it wants to
succeed.
2.7.4 Persistence of prices and wages
To assure functionality of transmission mechanism described above, central bank needs that
the role of unions in wages negotiations were relatively small. There are deviations form the
mechanism in countries, where unions play a significant role.
Production of goods and services reacts to actions of central bank first. Prices and wages react
with a certain delay. There exists a substantial persistence of prices and wages. The economy
consists of both formal and informal contracts that limit changes of prices and wages in a
short-term. The inflation expectations that affect contract negotiations adapt very slowly. In
other words, as prices and wages do not adapt immediately to changes of the aggregate
demand. Sales and production are slower than aggregate demand. With the next period,
inflation expectation start adapting, new contracts are negotiated and other corrections take
place. As a result, prices and wages get corrected slower with changes of the aggregate
demand.
The increase of wages over the labour productivity reflects the combined impact of the
positive inflation expectations and of the positive or negative element resulting from the
demand for labour. The increase of wages that does not exceed the growth of labour
productivity does not increase the expenses of production and therefore does not affect prices

204
of outputs. However, the increase of wages caused by inflation expectations or the increased
demand for labour increases unit labour expenses and many enterprises tend to change their
prices. Therefore, even if there is not the excess demand for labour, unit expenses rise above
the expected inflation since both enterprises and labourers thing in real terms. This increase of
unit labour expenses affects more or less prices of goods and services.
2.7.5 Monetary policy lags
Monetary policy operates with lags, since today’s actions affect inflation, GDP and
employment not sooner than within one or two years. Inflation targeting thus cannot consist of
reactions to current inflation. To stop current inflation that was caused by circumstances
occurring one or two years earlier, central bank have to employ a considerable tighter policy
(that could cause recession). These lags thus explain why the central bank pays so much
attention to business forecasts, especially to estimates of future inflation trends. Some central
banks use public forecasts as a key feature of its policy targets formulations.
We have mentioned already that a change of monetary policy affects immediately the market
short-term interest rates. The impact on clients’ interest rates of banks is usually slower.
Changes of mortgage loan interest rates can occur even after several months. It takes even
longer time before the changed mortgage repayments affect other consumption expenditures.
Unexpected changes of consumption expenditures affect inventory and purchase orders from
enterprises. Changes of purchase orders affect producers’ inventory and cause changes of
production which results in changes of employment and households’ incomes. These changes
further affect households’ expenditures. But all of these sequential processes take some time.
Why is it difficult to predict the length of these lags? Since the monetary policy concentrates
on affecting the demand of public, it has to estimate reactions of people. But everybody
knows how difficult it is to estimate even reactions of one person. The impact of monetary
policy actions on economy depends, for example, on people’s opinion about impacts of these
actions on inflations. If people thing that the tight monetary policy means that central bank
seeks to keep inflation under its control, they will change immediately its inflation
expectations downwards. In future, they will require more moderate increase of wages and
prices and therefore, monetary policy will achieve its target. Conversely, if people are not
confident about the central bank’s ability to keep the inflation low, they will require in future
higher wages and prices and monetary policy will, therefore, fail. In such a case, central bank
will have to tighten its monetary policy to such an extent that employment and GDP
substantially fall.

205
Experience shows that in developed countries it takes one year approximately before the
monetary policy actions affect the demand and that it takes another year before the
changed demand affects inflation. However, the uncertainty about the length of these lags is
still substantial. There are many factors influencing inflation, such as the overall economic
conditions, consumer confidence, world economic development, future inflation expectations
and others. These factors are out of central bank’s control but their influence over the length
of lags is substantial. These corrections contain lags in decision-making about expenditures
and lags in renegotiating wages and prices.
To illustrate how do central banks forecast impacts of their actions on inflation and GDP, we
will refer to a macromodel designed by the Bank if England (Figure 2.5 and 2.6). This
simulation does not provide probabilities of results. Shaded areas correspond to two
alternative simulations based on different assumptions about the monetary and fiscal policy
reaction functions. The upper limits of both bands in both Figures were derived for monetary
policy assuming constant inflation target and fiscal expenditures. The lower limits were
derived assuming monetary policy based on the output gap and inflation target and fiscal
expenditures proportionate to GDP. The both Figures show the response of real GDP and
inflation (relative to a base projection) to an unexpected 1 % rise of the short-term interest
rate that lasts for one year.
In both paths real GDP starts to fall rapidly after the monetary policy action. It reaches a
minimum of between 0.2 % and 0.35 % of GDP below its original level after five quarters.
Afterwards real GDP returns to its original level as a result both of the equilibrating forces
and of the reversal of the short-term interest rate. In both paths, inflation changes a little
during the first year. But during the second year, inflation falls sharply and it reaches the
minimum after nine quarters. In the first case, inflation fell by 0.2 % and in the second case by
0.4 %. In both cases, the impact on inflation then starts to diminish, but it has not returned to
the original level three years after the change of short-term interest rate, even though short-
term interest rate was reversed after one year. We have to point out that these simulations are
only illustrative. This Figure cannot be used to infer how much interest rates should be
lowered to achieve some reduction in inflation. Simulations prove that short-term interest rate
changes affect GDP and inflation with lags. This model generates the simulations which are
symmetric, i.e. rises and falls in the official rate of equal size have effects of similar
magnitude but opposite sign.

206
-0,4
-0,35
-0,3
-0,25
-0,2
-0,15
-0,1
-0,05
0
0,05
1 2 3 4 5 6 7 8 9 10 11 12
time, quarters
chan
ge o
f rea
l GD
P, %
Figure 2.5 Effect on real GDP, relative to base, of 1 % increase in the official rate maintained
for one year according to the Bank of England26
-0,45
-0,4
-0,35
-0,3
-0,25
-0,2
-0,15
-0,1
-0,05
0
0,05
0,1
1 2 3 4 5 6 7 8 9 10 11 12
time, quarters
chan
ge o
f inf
latio
n, %
Figure 2.6 Effect on inflation rate, relative to base, of 1 % increase in the official rate
maintained for one year according to the Bank of England
26 The transmission mechanism of monetary policy. Bank of England, London 1999.

207
2.7.6 Monetary policy, GDP and employment
It follows from the monetary policy transmission mechanism that the change of market short-
term interest rates does not affect only inflation but also GDP and employment. The decrease
of interest rates causes, with a certain lag, growth of GDP and employment. Conversely, the
increase of interest rates causes, with a certain lag, slower growth of GDP and lower
employment. Nevertheless, the Figure 2.5 shows that these changes are of a temporary
character, since GDP growth and employment return back to its original level within two
years. Monetary policy affects GDP and employment only in a short-term and inflation
in a long-term. In a long-term the target of monetary policy can be only inflation and
not GDP. The U.S. experience has also shown that the effects of “pumping economy up”
were only short-term. Central bank cannot have these two targets at the same time: long-term
price stability and long-term GDP and employment.
Central bank is able to boost or weaken economic growth and employment but it cannot do it
always. The continuous effort to expand economy above its long-term potential can cause
only the higher and higher inflation. In other words, the continuous accommodative monetary
policy cannot generate a long-term benefit but a higher inflation.
The long-term price stability does not necessarily represent the only monetary policy target.
Low volatility of GDP and employment are also valuable. Central banks therefore concentrate
on the short-term economic performance as well. However, this target is in contradiction with
long-term price stability. Central bank thus has to decide which one of these targets is
currently more important. Imagine than the economy is facing recession and that the central
bank seeks to higher employment through the expansive monetary policy. A short-term
success can result in a long-term trouble since the expansive monetary policy increases
inflation. Central banks thus have to balance short-term economic stabilization and long-term
price stability. Monetary policy thus has two major targets:
o To achieve a desired rate of inflation in a mid-term and in a long-term,
o To avoid fluctuations of GDP and employment i.e., to avoid the so-called “boom and
bust syndromes”.
There is always a certain level of GDP when enterprises employ exactly their current
capacities without being forced to change production or prices faster than expected changes of
the price level. This level of GDP is called potential GDP level. If the actual GDP equals the
potential GDP, production does not cause inflationary pressures and enterprises do not face

208
pressures towards changes of labour expenses. There is a balance between domestic supply
and demand.
The difference between the actual GDP and its potential is called output gap. If the output
gap is positive, high demand is pushing production above its potential level and enterprises
are operating over their normal capacities. The excessive demand can cause a trade deficit but
it will cause primarily inflationary pressures. Production costs of many enterprises are rising
as they operate over the level of efficient production. Other enterprises start demanding more
labour force to increase their production. The additional demand for labour subsequently
causes rise of wages and prices. Some enterprises take advantage of this development and
raise their profit margins by increasing prices more than costs. If the output gap is negative,
opposite movements take place. When the economy grows above its potential level, inflation
increases and vice versa.
However, the output gap is very hard to estimate. Structural changes (e.g. development of
technology or labour market) can shift the potential output in an unknown direction. Economy
consists of many heterogeneous sectors. In addition, business cycles differ from each other.
Some sectors can expand while others face recession. Finally, the growth of labour
productivity changes with time as well. The output gap approach cannot, therefore, show a
precise numerical relation to inflationary pressures. On the other hand, it is a helpful indicator,
since to control inflation central bank needs to estimate the level of business activity.
Provided that there are no external shocks, the maintaining of real GDP at its potential level
would represent the sufficient condition for stable inflation only if the targeted inflation
equals to the expected inflation. The zero output gap corresponds to any rate of inflation
expected by economic agents. These expectations make already part of wages and hence part
of prices of goods and services. Potential GDP thus corresponds to both high stable inflation
and low stable inflation. The given rate inflation depends on monetary policy actions and
public confidence.
Central banks in some countries (e.g. Australia) consider a short-term trade off between
inflation and business activity. The inflation target must be fulfilled in average for the whole
business cycle period. That means that in a short-term, monetary policy can seek to achieve to
antagonistic targets – faster economic growth and low inflation. Let’s imagine that central
bank considers inflation too high. Higher interest rates can help lower inflation but at the
same time, we can expect that the economic growth will slow down. Whether and how to
increase interest rates depends on the actual economic conditions. When the economy

209
operates slightly above its potential, central bank can use a fast increase of interest rates. On
the other hand, if there are substantial overcapacities, central bank should rather choose to
raise interest gradually.
In a long-term, GDP and employment depend upon other factors than monetary policy
that the central bank cannot control. These factors represent the production capacity of a
given economy consisting in a technical progress, quantity and quality of labour force and
others. Some government policies can influence these supply side factors but the monetary
policy cannot. Monetary policy cannot increase the long-term economic growth.
Economy operates in cycles. GDP and employment are often bellow and above their long-
term potential. Although the monetary policy cannot influence these aggregates in a long-
term, it can do so in a short-term. In case of falling demand and recession, central bank can
temporarily stimulate economy and push it back to its potential level by cutting interest rate.
Central bank therefore concentrates also on a short-term stabilization, i.e. on smoothing GDP
and employment on their potential level. Sometimes, we could observe that some states or
regions are in recession while the national economy goes well. Central bank has no instrument
to use against such development.
2.8 Monetary policy rules
The aim of monetary policy is to make the economy richer and not to leave the card room
with money of its opponents. In practice, however, monetary policy is changing interest rates
and the public can sometimes loose their money. Financial markets therefore seek to predict
future changes of interest rates. Persons responsible for monetary policy thus seek to
understand the market and market participants seek to predict behaviour of these persons.
Some economist elaborated monetary policy rules. According to the Friedman’s rule central
bank should follow constant growth of money stock. Taylor’s rule sets the level of official
interest rate based on expected inflation, target inflation (2 %), equilibrium real interest rate (2
%) and production gap. Let’s mention autopilot of monetary policy and NAIRU.
2.8.1 Autopilot of monetary policy
We have mentioned already (subsection 2.7.3) that the experience of last decades show that
expectations play the essential role in behaviour of economic agents. When estimating future
inflation, people do not look only into the past but they also seek to predict behaviour of

210
central bank and to adapt their expectations. Financial markets participants regard central
bank representatives to predict the future central bank’s actions.
Markets react to the information about economic development, i.e. to the same information as
central bank. If markets react to proclamations of central bank representatives, they do not
follow information about economy, i.e. they do not follow some monetary policy rule. Central
bank itself does not know how to set rules of its decision-making. Under the inflation-
targeting regime, central banks rely on subjective judgments and not on exact rules. If
there is any monetary policy rule, it should be simple and clear, for otherwise the rule could
provoke undesirable surprises. It is not possible to accept such rule that would cause
unpredictable changes of monetary policy. The fundamental requirement is that the decisions
about interest rates should not differ for identical sets of information. If any of such
rules proved efficient, central bank could adapt it as autopilot.
2.8.2 NAIRU
Some economists hold the view that monetary policy should concentrate on the non-
accelerating inflation rate of unemployment (NAIRU). This concept is close to the so-
called natural rate of unemployment. To explain NAIRU, we can use the Phillips curve that
represents the relationship between the inflation and unemployment. According to this
concept, the rate of unemployment bellow NAIRU coincides with the rise of inflation and
vice versa.
Tightening labour market was one of the reasons why the Fed intervened prematurely against
inflation in 1994. The federal funds rate jumped from 3 % at the beginning of 1994 to 6 % at
the beginning of 1995. According to the Fed it was reaction on information indicating the
future increase of inflation. Inflation did not increase. Later, the Fed did not increase interest
rate even though the unemployment dropped bellow 4.75 %, i.e. bellow estimates provided by
NAIRU.
In macroeconomic models of monetary transmission containing the Phillips curve
unemployment plays important role by linking the aggregate demand for goods and services
(the demand shock) and inflation. The increased demand increases the real GDP that boosts
the demand for labour and thus reduces unemployment. The increased demand increases
consequently inflation. The unemployment thus helps predicting inflation that represents the
main monetary policy target.

211
Some economists believe that NAIRU can provide useful information whereas others argue
that such information is misleading. NAIRU opponents base their arguments both on practical
and theoretical experience. NAIRU estimates change substantially throughout the time. In
1960s, it was of 5 % in the United States, in the mid-seventies it increased to 7 % and in the
mid-nineties it fell back to 5.5 – 6 %. NAIRU depends on a variety of factors including
demographical trends, government employment policies and regional economic changes.
That means that NAIRU cannot be determined precisely. Based on the thorough empirical
analysis of Phillips curve, Staiger, Stock and Watson27 have drawn a 95 % estimate of
NAIRU from 4.8 to 6.6 %. Regarding this uncertainty, NAIRU can provide misleading
monetary policy signals. In addition, the short-term trade-off between unemployment and
inflation is unstable. NAIRU also depends upon the inflation-expectations-generating
processes. Any trade-off disappears as soon as the central bank attempts to employ it
systematically.
NAIRU can indicate future inflation only when the economy is hit by demand shocks.
Nevertheless, the economy can be also hit by supply shocks, i.e. by unexpected changes of the
aggregate supply of goods and services – e.g. by the step increase of labour productivity.
Initially, this shock increases the volume of goods and services in relation to the current
demand. Hence, the prices start falling. The growing GDP boosts the demand for labour and
reduces thereby the unemployment. Falling unemployment thus coincides with deflationary
pressures. If the central bank uses NAIRU, than it can expect wrongly future inflationary
pressures and tighten monetary policy.
The arguments that we have mentioned above were opposing the so-called trigger strategy.
Under this strategy, the central bank compares the current rate of unemployment with NAIRU
and consequently adjusts the interest rate. Nevertheless, no central bank bases its monetary
policy upon the one sole variable. The question arises as whether the models containing
NAIRU are more adequate than other models. Although all models generate errors, it is still
hard to say which one provides the best estimates. As inflation is monetary phenomenon the
models based on money stock have some advantage when predicting inflation.
27 Staiger, Douglas, Stock, James H., and Watson, Mark W.: The NAIRU, unemployment and monetary policy. Journal of Economic Perspectives, 1997, 11(1), 33-49.

212
2.9 Foreign exchange interventions
Foreign exchange intervention (FX intervention) is the action of central bank or another
central institution taken in order to affect the spot exchange rate of domestic currency to other
currencies at the market. Central bank or another central institution purchases or sells foreign
currencies for domestic currency. If it finds the domestic currency too strong, it purchases
foreign currencies for the domestic currency and vice versa. FX intervention is not regarded
as a part of monetary policy as its primary goal is to influence exchange rate and not
inflation. But we have already seen (Figure 2.4) that change of exchange rate has indirect
effect on inflation.
FX interventions are more frequent in smaller countries. In the USA, Eurozone, Japan and the
United Kingdom are unusual. The reason is that foreign exchange market in developed
countries is massive compared to any possible size of FX intervention and thus central
authorities in reality do not have power to influence the spot exchange rate generated on FX
market..
2.9.1 The essentials of foreign exchange interventions
The essentials of FX intervention are very simple as shown in the Examples 2.3 and 2.4. The
intervention to depreciate the domestic currency is the operation when central bank
purchases foreign currency in exchange for the domestic currency. In the Example 2.3 the
Czech National Bank purchases $1 billion from commercial bank for CZK 30 billion. The
purchase of foreign currency represents the settlement of foreign-currency part of the contract
(adding the value of $1 billion to the nostro account of the central bank) and settlement of
domestic-currency part of the contract (adding the value of CZK 30 billion to the clearing
account of commercial bank). The liquidity of CZK 30 billion is added to commercial bank
clearing account with the Czech National Bank. In order to prevent interbank interest rates
falling, Czech National Bank have to draw immediately this liquidity (CZK 30 billion) from
the clearing accounts to term accounts, e.g. by means of repo operations with one of the
Czech commercial banks. Hence we use the term “sterilized foreign exchange
intervention”. Non-sterilized interventions have almost ceased to exist in practice.

213
Example 2.3 FX intervention to depreciate the domestic currency
The intervention to appreciate the domestic currency is the operation when central bank
sales foreign currency in exchange for the domestic currency. In the Example 2.4 the Czech
National Bank sales $1 billion from commercial bank for CZK 30 billion. The sale of foreign
currency represents the settlement of foreign-currency part of the contract (deduction of the
value of $1 billion from the nostro account of the central bank) and settlement of domestic-
currency part of the contract (deduction of the value of CZK 30 billion from the clearing
account of commercial bank). The liquidity of CZK 30 billion is deducted from the
commercial bank clearing account with the Czech National Bank. In order to prevent
interbank interest rates rising, Czech National Bank have to add immediately this liquidity
(CZK 30 billion) to the clearing accounts, e.g. by means of reverse repo operations with one
of the Czech banks. Hence we again use the term “sterilized foreign exchange intervention”.
It is obvious that FX intervention does not affect the volume of money stock, since bank
reserves does not make part of monetary aggregates.
Czech National Bank
1) Czech National Bank purchases $1 billion from commercial bank for CZK 30 billion
Opening balance 1) CZK 30 bln
Clearing accounts of commercial banks
Commercial bank
Opening balance 1) CZK 30 bln
Clearing account with Czech National Bank
Opening balance 1) CZK 30 bln ($1 bln)
Nostro account
opening balance 1) CZK 30 bln ($1 bln)
Nostro account

214
Example 2.4 FX intervention to appreciate the domestic currency
We have to point out that currency swaps do not represent instrument of FX intervention but
the instrument to influence bank reserves. Currency swap composed of the exchange of
payments at the beginning and at the end of the contract does not affect exchange rate
since commercial banks include both balance sheet and off-balance sheet items into their
foreign exchange positions. When the central bank purchases dollars for domestic currency,
commercial bank has “shorter” dollar balance sheet position (lower amount of dollars at the
nostro account), but it has at the same time “longer” dollar off-balance sheet position. Overall
dollar position of commercial bank remains unaffected by the currency swap. That means that
currency swaps do not represent instrument of FX interventions.
Czech National Bank
1) Czech National Bank sales $1 billion to commercial bank for CZK 30 billion
1) CZK 30 bln Opening balance
Clearing accounts of commercial banks
Commercial bank
Opening balance
1) CZK 30 bln
Clearing account with Czech National Bank
Opening balance
1) CZK 30 bln ($1 bln)
Nostro account
Opening balance 1) CZK 30 bln ($1 bln)
Nostro account

215
2.9.2 The reasons for FX intervention
The reasons for FX interventions are:
o Maintaining the spot exchange rate within the fixed band under the fixed exchange
rate regime,
o Preventing the excessive instability under the floating exchange rate regime (e.g. in
case of the so-called overshooting).
We also have to point out that the level of interest rate influences exchange rate as well.
Central bank should not react to the normal short-term volatility of exchange rate. It should
rather concentrate on the elimination of excessive deviations from the long-term trend. In
other words, central bank should intervene against fluctuations not against the trend. Central
bank is not able to fix permanently the exchange rate by means of interventions if the market
finds that such a level as not corresponding to fundamental economic variables. The exchange
rate can deviate from its equilibrium level even if the market were deep and liquid. These
fluctuations can occur especially when the exchange rate sharply changes. Such effect is often
called “overshooting”. Once it occurs, central bank can intervene with a view to correct the
exchange rate to its equilibrium level. The disequilibrium exchange rate lasting for longer
period of time can affect badly inflation and the overall economic activity.
Once the developed countries have shift to floating exchange rates regimes, financial markets
have become considered to keep assets’ prices consistent with changes of other fundamental
variables. The main arguments followed the so-called efficient market hypothesis (EMH).
According to this theory, all information relevant to determine market equilibrium is
contained already in market prices through trading of rationally thinking traders. Hence,
assets markets are always in equilibrium and actions of all market participants “catalyze” the
equilibrium. If that is the case, all interventions would be superfluous.
However, the experience shows that markets are not efficient. There is a large number of
literatures proving that trading does not correspond to the efficient markets hypothesis.
Markets often generate speculation bubbles and heard behaviour. Although such phenomena
do not correspond to the EMH, speculators can profit on inefficient financial markets. In case
of such “overshooting”, intervention can be successful since it can bring the exchange rate
back to its equilibrium level. Also the permanent volatility can force central bank to intervene
on foreign exchange market.

216
2.9.3 Effectiveness of Interventions
FX interventions can really affect the exchange rate. However, it is very difficult to predict
the magnitude of this impact even if this depends certainly upon the amount of intervention.
Experience shows that FX interventions can help smoothing short-term fluctuations
providing that they conform to the long-term trend. That means that interventions can
influence the exchange rate only in the short run providing that they conform to fundamental
variables. Interventions cannot determine the exchange rate systematically. Nowadays, the
most of economists consider interventions inefficient and thus superfluous. The effectiveness
is also hard to estimate since one never knows how the exchange rate would behave if the
central bank did not intervene.
Sometimes, economists argue that the resources available for intervention are too low with
respect to the market size. The argument stems from the fact that intervention work primarily
through the restructuring of investors’ portfolios. In other words, if the intervention is to
affect relative price of one currency, it would have to cause substantial changes of the relative
supply of this currency. Nevertheless, researches have shown that the amount of intervention
often does not represent the primary factor and that the news about intervention can affect
exchange rate. The result of intervention depends upon whether investors keep their
expectations regardless the intervention or not. Other researches prove that interventions
almost never affect the structure of investment portfolios.
In 1950s Milton Friedman proposed the classical test of efficient and stabilizing intervention
consisting in the analysis of gains from intervention. Friedman has shown that central bank
should act exactly as a rational speculator. It should buy currency when it is relatively cheap
and vice versa. Studies by central banks show that interventions are usually profitable for
central banks and that Friedman’s test is applicable.
2.9.4 Evidence of some Countries
In the United States, the magnitude of monetary aggregates, volume of foreign exchange
transactions, and the overall activity on foreign exchange market make FX interventions very
limited, since the Fed or some other central authority is not able significantly to influence
these huge variables. Neither the U.S. Department of the Treasury nor the Fed care about
exchange rates too much currently.
The possible FX interventions are managed by the Federal open market committee (FOMC)
in cooperation with the Department of the Treasury that is responsible for these operations.

217
The Fed then runs the intervention through its foreign exchange desk at the Federal Reserve
Bank of New York and through the Exchange Stabilization Fund (ESF) governed by the
Department of the Treasury. However, the initiative lies in the hands of ESF that is holding
portfolio of FX reserves, which it can sell in order to strengthen the dollar. It is also holding a
limited amount of dollar assets that it can use to weaken the dollar. In addition, Fed is holding
portfolio of FX assets that it can use to strengthen dollar by selling these FX assets and vice
versa. Fed and ESF intervene in cooperation. The exchange rate policy in the United States
thus lies primarily in the hands of the Department of Treasury as a part of its international
financial policy. Nevertheless, Fed plays important role through FOMC and Federal Reserve
Bank of New York.
Fed is not targeting any given level of exchange rate. It concerns only about “incorrect”
changes at the currency markets such as speculations that can endanger the efficiency of these
markets. Within several preceding decades, Fed intervened several times to support
weakening dollar. In such a case, the federal reserve bank of New York sells foreign exchange
assets for dollars (Fed debits member banks’ accounts at Fed).
At the same time, interventions initiated by Fed or by the Department of the Treasury cannot
change bank reserves with Fed, i.e. it interventions cannot affect federal funds rate. To avoid
the lack or surplus of reserves, Fed uses sterilization operations immediately after the
intervention. These operations do not make part of Fed’s monetary policy. To neutralize the
impact of changing balances of commercial banks accounts at Fed, the Federal Reserve Bank
of New York provides or drains reserves automatically in or out of the system.
In September 1985 the G-7 central banks have signed the Plaza agreement on active
interventions to weaken dollar. The United States was often intervening against dollar by the
late 1980s. At the beginning of 1990s, U.S: institutions have abandoned this practice as the
most of interventions were ineffective. Since that time, the United States has intervened only
twice, namely in 2000 and 2002 in cooperation with other central banks.
In the past FOMC was also responsible for monitoring the swap network of Fed. The swap
network consisted of bilateral agreements between Fed and other fourteen central banks and
Bank for International Settlements (BIS). Swap network was created in 1962 to allow central
banks to replenish their FX assets. Fed has used this network in 1980 for the last time.
The European Central Bank intervened in 2000 in cooperation with several other central
banks to appreciate euro, and in 2002 to depreciate yen. ECB usually does not care about

218
exchange rate. Central banks should concentrate primarily on inflation and not on exchange
rates. The exchange rate should result from the market. The most of exports of EU member
countries focuses to other member countries so that the exchange rate of euro does not
influence the business activity very much. The export outside Eurozone represents only 15 %
of GDP of Eurozone. If the United Kingdom and Sweden will join Eurozone, this ratio will be
even smaller.
In Japan central bank is acting as the agent of government based on the request made by
treasury department. Japan has been for a long time very interested in keeping the exchange
rate of yen lower, i.e. to help exporters. Japan thus intervenes sometimes against yen.
The Bank of England is using FX reserves held by the Treasury at the special exchange
equalization account. Central bank is using these reserves in the name of government. Based
on the changes of the Bank of England Act of 1998, central bank is managing now its own FX
reserves separately from reserves managed in the name of government. These reserves can be
used for monetary policy purposes subject to limits imposed by the Court of Directors.
2.10 Dollarization
We talk about dollarization when some country abandons its own currency and adopts the
U.S. dollar as the official currency and legal tender. This type of dollarization is called
sometimes official or full dollarization. The unofficial or partial dollarization means that
dollar does not become legal tender but the most of money transactions are denominated in
dollars. This is the case of some countries of Latin America (whose largest business partner is
the United States). Dollarization can sometimes refer to the situation when the domestic
currency is officially or unofficially replaced not only by U.S. dollar but even by some other
currency, e.g. by the euro, Australian dollar, New Zealand dollar and the like.
Countries are generally not willing to give up their currencies. Currency represents a kind of
national symbol and the adoption of dollar could face political aversion. Dollarization means
that central bank has to draw all the domestic currency out of circulation in exchange for
dollars. The key functions of central bank disappear, since the central bank stops
functioning as an issuer of currency and monetary policy maker. It is hard to say if it is
advantage or disadvantage for a dollarized country. What remain are the less important
functions of central bank like banking supervision (if it had been part of central bank already).
Central bank can require commercial banks to hold bank reserves.

219
2.10.1 Advantages and Disadvantages of Dollarization
.Dollarization is the way to avoid currency crisis, to ensure lower costs of foreign loans and to
deepen the integration on the world markets. On the other hand, full dollarization represents
to give-up seigniorage in favour of the United States and to loose control over the exchange
rates policy.
The main advantage of the full dollarization is the elimination of currency crises. If there is
no domestic currency, there can be no sharp devaluation of domestic currency and the sudden
outflows of capital. Currency crisis are very expensive for the reason of widening the credit
spread and affecting badly the overall economy. In Mexico, GDP has fallen by 7 % in 1995
and Asian countries have experienced the fall of GDP ranging from 5 to 15 %. The most of
countries had to devaluate their domestic currencies after the crises and to adopt floating
exchange rates regime. Elimination of currency crises makes capital flows more stable.
Elimination of currency crises directly lowers the costs of foreign loans since the credit
spread gets smaller. The credit spread is lower since the dollarization eliminates FX risk (i.e.
the risk of devaluation of a given currency). Despite, interest rates of dollar-denominated
bonds of the given country are higher than dollar-denominated bonds issued by the U.S.
government for the reason of the higher credit risk. In other words, the sovereign risk of the
dollarized country is higher than the sovereign risk of the U.S. government. Higher
confidence of foreign investors lowers the costs of loans which lower fiscal expenses and
boosts investments and economic growth.
Dollarization can represent other benefit as well. Lower transaction costs and stable dollar
prices boost the deeper financial and economic integration into the world economy.
We have seen already that the right to issue its own currency enables government to benefit
from the existence of the so-called seigniorage. This seigniorage represents profits of central
bank that central bank transfers into the government budget. Dollarization means that
domestic central bank (i.e. domestic government) gives up seigniorage in favour of the Fed
(i.e. in favour of the U.S. government). In 2004, the seigniorage of Fed amounted to $9.4
billion of which $6.3 billion came from foreign countries. Earlier this amount was even higher
for the seigniorage of Fed is directly related to the level of federal funds. The loss of
seigniorage is the main obstacle for dollarization. The United States would get more
seigniorage from dollarization in other countries.

220
There is a case for the U.S. authorities to share part or all of the seigniorage with countries
that adopt the U.S. dollar. A precedent exists in the arrangements between South Africa and
three other states that use the rand (Lesotho, Namibia, and Swaziland). While the United
States has no sharing arrangement with Panama or any other officialy dollarized economy,
there have been some initiatives in the U.S. Senate to consider legislation providing for
seigniorage reimbursement. In 1999 and 2000, there was a heated debate between the Fed,
U.S. Department of the Treasury, and politicians. The new legislation was expected. Senator
Connie Mack proposed to follow IMF proposal and to adopt an act on international monetary
stability. According to the proposal, 85 % of seigniorage should be transferred back to the
dollarized countries. The major opponent was Secretary of the U.S. Department of the
Treasury Larry Summers according to whom there was no reason to transfer seigniorage to
dollarized countries. This proposal was rejected.
Dollarization means also that the given country looses its exchange rate policy, i.e. it looses
the possibility to devalue domestic currency. Devaluation of domestic currency can help
domestic economy and reduce the risk of government default. If on the other hand the banks
are lending dollars, the banks are not exposed to FX risk but the banks are exposed higher
credit risk as domestic clients become very easy unable to repay dollar-denominated loans and
often default. This was the case of currency crises in Mexico (1994) and Asia (1997).
The decisive feature of dollarization is its long-term character. Dollarization is much harder
to leave than currency board. Abandonment of dollarization and currency always affects badly
the overall economy. The major benefit of dollarization is that it is supposed to be the
irrevocable measure towards lower inflation, fiscal discipline, and transparency. It can
bring the stabilized financial and macroeconomic environment. However, in case of full
dollarization, investors can fear of the fiscal deficits or the insufficient regulation. Panama, for
example, has faced already several crisis and rescue programs of the IMF.
2.10.2 Dollarized Countries
The Table 2.3 shows the list of thirty-two officially dollarized countries as in June 2002.
Ecuador, Salvador, Puerto Rico, and Panama are the only larger countries of this list. These
countries are using U.S. dollar as legal tender. The remaining officially dollarized countries
are smaller ones. Many other countries (in Latin America, for example) are almost (but not
fully) dollarized. Dollarized countries of Latin America differ substantially from the United
States and the dollarization does not represent substantial benefits. Before the launch of euro

221
currency, German-mark banknotes represented from 10 to 20 % of all currency in circulation
in Poland. Some economists have suggested that Canada should dollarize as well.
Table 2.3 Officially dollarized countries as in June, 200228
Country Number of inhabitants
DGP (USD billions) Political status Currency Dollarized
since American Samoa Andorra British Virgin Islands Cocos (Keeling) Islands Cook Islands Cyprus, Northern East Timor Ecuador El Salvador Greenland Guam Kiribati Kosovo Liechtenstein Marshall Islands Micronesia Montenegro Monaco Nauru Niue Norfolk Island North Mariana Islands Palau Panama Pitcairn Island Puerto Rico San Marino Tokelau Turks and Caicos Islands Tuvalu U.S. Virgin Islands Vatican City
67,00068,00021,000
60021,000
140,000857,000
13,200,0006,200,000
56,000160,000
94,0001,600,000
33,00071,000
135,000700,000
32,00012,0002,0002,000
75,00019,000
2,800,00042
3,900,00027,0001,500
18,00011,000
120,0001,000
0.51.20.30.00.10.80.2
37.224.0
1.13.20.1n.a.0.70.10.31.60.90.10.00.00.90.1
16.60.0
39.00.90.00.10.01.80.0
U.S. territoryIndependent
British dependencyAustralian ext. territory
New Zealand territoryDe facto independent
IndependentIndependentIndependent
Danish self-gov. regionU.S. territoryIndependent
U.N. administrationIndependentIndependentIndependent
Semi-independentIndependentIndependent
New Zealand territoryAustralian ext. territory
U.S. commonwealthIndependentIndependent
British dependencyU.S. commonwealth
IndependentNew Zealand territory
British colonyIndependent
U.S. territoryIndependent
USD EUR USD AUD NZD TRL USD USD USD DKK USD AUD EUR CHF USD USD EUR EUR AUD NZD AUD USD USD USD NZD USD EUR NZD USD AUD USD EUR
189912781973195519951974200020002001
before 18001898194319991921194419442002186519141901
before 1900194419441904
1980s1899189719261973189219341929
After the economic stagnation in 1998, the economy of Ecuador collapsed into the deep
recession in 1999 (GDP fell by 8 %). The reason was that banks were falling bankrupt and
that caused credit crunch. The unemployment increased to almost 16 %. The year-to-year
inflation increased from 43 % by the end of 1998 to 91 % by the end of 1999. Public finances
were in a bad condition which was caused, among other reasons, by the long-lastingly low oil
prices. In 1998, the government introduced the indexation of oil-product and gas-product
prices to the exchange rate of dollar. The overall public debt increased from 64 % of GDP in 28 www.dollarization.org.

222
1997 to 118 % in 1999. In August 1999, the government suspended its payments of Brady
bonds and eurobonds. The local congress has therefore adopted full dollarization. Domestic
banknotes were slowly replaced by dollar banknotes. Nevertheless, the inflation during the
first half of 2000 amounted to 60 %. According to Stanley Fisher, the dollarization in Ecuador
should serve as a good example to be followed by the whole Latin America.
Panama is the country with strong and close historical, political, and economic relations to
the United States. It has adopted officially the U.S. dollar as the only legal tender already in
1904. Brazil and Costa Rica are also considering whether to adopt dollar or not. In Panama,
the dollarization has helped to maintain as stable currency and low inflation as in the United
States.
Among the unofficially dollarized countries, we can mention Argentina. Dollarization of
Argentina amounted to 60 % approximately (measured as ratio between dollar and non-dollar
items in balance sheet of the banking sector). If Argentina decided to adopt the full
dollarization, it would have lost $750 million yearly on seigniorage. The key question arises
as whether the dollarization would sufficiently lower the credit spread of dollar-denominated
bonds by reducing the FX risk to investors.
2.11 Monetary policy in the USA
The contemporary Fed differs substantially from the conceptions of authors of the Federal
Reserve Act of 1913. Priorities of Fed were strongly affected by consequences of world wars,
great depression of 1930s, and inflation of 1970s. The decentralized system was gradually
centralized. The objective now is the price and economic stability.
2.11.1 Monetary policy till 1960s
Figure 2.7 shows the development of monetary aggregates in the USA from 1867 till 1960
according to data of Friedman and Schwartz (for period from 1867 till 1947) and Rasche (for
period from 1948 till 1958). The money stock grew at a higher rate than the growth of
nominal GDP. The money stock has tended to rise more rapidly during business cycle
expansions than during business cycle contractions. An actual decline of the money stock has
occurred during only three business cycle contractions: 1920 to 1921, 1929 to 1933, and 1937
to 1938. The severity of the economic decline was a consequence of the reduction in the
money stock, particularly so for the downturn that began in 1929. The price development

223
from 1800 till 1916 was mainly deflationary Figure 2.2). World War I (1914 to 1920) caused
the first period of higher inflation. Nevertheless, since 1920 to 1940, deflation was
dominating again. Then there was inflation from 1939 to 1948. Each of the price inflations
has been preceded and accompanied by a corresponding increase in the rate of growth of the
money stock. An acceleration of money growth in excess of real output growth has invariably
produced inflation in these periods.
The most well-known part is the monetary policy during 1929-33. The money stock and price
level fell by one-third, ex post real interest rates reached double-digits, and thousands of
banks failed. Most economists blame the Fed’s policy. The most prominent explanation of the
Fed behaviour during the Great Depression is that of Friedman and Schwartz (1963). They
argue that a distinct shift in policy occurred with the death in 1928 of Benjamin Strong,
Governor of the Federal Reserve Bank of New York. He understood how to employ the tools
of monetary policy to minimize cyclical fluctuations in output and prices.
0
50
100
150
200
250
300
1860 1870 1880 1890 1900 1910 1920 1930 1940 1950 1960
USD
bln
.
Monetary aggregate M0 Monetary aggregate M1
Monetary aggregate M2 Monetary aggregate M3
Figure 2.7 Development of monetary aggregates in the USA from 1867 to 1960 according to
Anderson29, Friedman and Schwartz30 and Rasche31
29 Anderson Richard G.: Some Tables of Historical U.S. Currency and Monetary Aggregates Data. Working Paper. Federal Reserve Bank of St. Louis, St. Louis, 2003. 30 Friedman, Milton, and Schwartz, Anna J.: A Monetary History of the United States, 1867– 1960. Princeton University Press, Princeton 1963.

224
In 1931, uncertainty about the ability or willingness of the United States to remain on the gold
standard accelerated gold outflows that forced the Fed to make a decision. They could choose
to defend their gold reserve by rising interest rate or they could delay convertibility of the
dollar into gold. The Fed understood that a tighter monetary policy might worsen the
downturn, but to preserve the gold standard it chose not to increase bank reserves which
resulted in the rise of interest rate. It was the classic defence. The Fed viewed the gold
standard as fundamental to long-run economic prosperity and was willing to defend the
system even if it took actions that worsened the ongoing depression. The Fed made virtually
no open-market purchases of government securities during the crisis to lower interest rate.32
2.11.2 Monetary policy from 1960s
Figures 2.8 to 2.12 show the development of federal funds rate, monetary aggregates,
consumer price index (CPI), inflation derived from CPI, and ex post real interest rate in the
U.S from 1960 till 2005.
The USA in the period from 1965 till 1980 sustained the rise of inflation from 2 % to over 12
% (Great Inflation). There was a similar historical pattern for inflation in Japan, the United
Kingdom, Canada and other countries. But in Japan disinflation occurred earlier (in the mid-
1970s) as opposed to the early 1980s in the USA other countries.
In August 1971 President Nixon announced his “New Economic Policy.” The plan included
two features that reflected::
o to combat inflation, Nixon imposed wage and price controls, and
o in response to America’s long-running and worsening international payments deficit,
Nixon suspended convertibility of the dollar into gold.
Both policies were intended to be temporary. Wage and price controls were temporary, but
the dollar convertibility into gold appeared to be permanent. The dollar floated against other
currencies since 1973. Both measures reflected the failure of U.S. monetary policy to control
inflation under the Bretton Woods System. This gold standard did not impose the same level
31 Rasche, Robert H.: Demand Functions for Measures of U.S. Money and Debt. In: Proceedings of the Board of the Governors of the Federal Reserve System. 1990, 113-172. 32 Wheelock, David C.: Monetary Policy in the Great Depression and Beyond: The Sources of the Fed's Inflation Bias. Working Paper 1997-011A. Federal Reserve Bank of St. Louis, St. Louis 1997.

225
of discipline on monetary policy that the pre-war gold standard had. From all explanations,
there is important common ground: monetary policy was too expansionary in the 1970s, and a
tighter monetary policy had been required to produce lower growth in nominal aggregate
demand and, hence, lower inflation.33
In October 1979, the Fed decided to take decisive actions against inflation. The Fed chose to
manage money base and M1 as an intermediate target (see part 2.4.2). Inflation decreased
rapidly at the expense of the strong economic recession. Nevertheless, M1 was still growing.
Since 1983 price level in the United States (as well as in some other countries facing high
inflation) stabilized rapidly.
In the mid-1980s the relationship between M1 and real GDP and inflation proved too be week
and the Fed started, therefore, to use M2 and M3 aggregates. These aggregates were used
until the 1990s when Fed observed serious troubles resulting from their use. The growth of
M2 and M3 slowed down at the beginning of 1990s. This could be caused by new capital
adequacy measures whereas interest rate decreased. Commercial banks reduced their loan
expansion in order to improve their profits. The Fed has been gradually eliminating the
reliance on monetary aggregates as indicators of monetary policy and has been laying more
focus on employment data, expenditures, wages, foreign trade, and other economic variables.
This policy represents a certain shift to inflation targeting.
From 1991 to 2001 economic expansion, the longest in U.S. history, came to an end in March
2001. The economy was growing at a rate that was thought to be unsustainable. To curb
growth, the Fed between mid-1999 and May 2000 raised the interest rate from 4-3/4% to 6-
1/2%. Apparently this tightening of monetary policy was too severe, for economic growth
collapsed soon thereafter. In the presence of slumping economic growth, falling industrial
production, and an increasing unemployment rate, the Fed began aggressively easing
monetary policy. Between January 3 and December 11, 2001, the interest rate was reduced
from 6-1/2% to 1-3/4%. Economic growth became sluggish during the second half of 2000
and remained sluggish through 2001. During 2002 and 2003 the Fed lowered interest rate
further. Positive growth resumed in the fourth quarter and has continued throughout 2002 and
2003. From 2004 the Fed was tightening monetary policy again.
33 Nelson, Edward: The Great Inflation of the Seventies: What Really Happened? Working Paper 2004-001. Federal Reserve Bank of St. Louis, St. Louis 2004.

226
0
2
4
6
8
10
12
14
16
18
20
1960 1964 1968 1972 1976 1980 1984 1988 1992 1996 2000 2004 2008
%
Federal funds rate
Figure 2.8 The development of federal funds rate in the USA
0
1000
2000
3000
4000
5000
6000
7000
8000
9000
10000
1960 1964 1968 1972 1976 1980 1984 1988 1992 1996 2000 2004 2008
USD
bln
.
Monetary aggregate M0 Monetary aggregate M1
Monetary aggregate M2 Monetary aggregate M3
Figure 2.9 Development of monetary aggregates in the USA
.

227
0
20
40
60
80
100
120
140
160
180
200
1960 1964 1968 1972 1976 1980 1984 1988 1992 1996 2000 2004 2008
%
Consumer price index (CPI)
Figure 2.10 Development of consumer price index (CPI) in the USA
0
2
4
6
8
10
12
14
16
18
20
1960 1964 1968 1972 1976 1980 1984 1988 1992 1996 2000 2004 2008
%
Inflation
Figure 2.11 Development of inflation derived from CPI in the USA

228
-10
-8
-6
-4
-2
0
2
4
6
8
10
1960 1964 1968 1972 1976 1980 1984 1988 1992 1996 2000 2004 2008
%
Real interest rate
Figure 2.12 Development of ex post real interest rate in the USA
2.12 Monetary policy in Eurozone
European Monetary Union (EMU), the so-called eurozone, has been established on January
1, 1999. The ECU currency was replaced by euro by the ratio 1:1. Euro started to be used only
for cashless transfers. European Central Bank (ECB) started its monetary policy. A part of
foreign reserves held by national central banks was transferred to ECB. On January 1, 2002,
countries of eurozone have started to use euro notes and euro coins. The transition to euro
notes and coins finished on March 1, 2002. All means of payments (credit transfers, direct
debits, cheques, payment cards) had been converted to euros.
According to paragraph 105 of the Treaty of Rome, the primary objective of ESCB is to
maintain price stability. In addition, ESCB is supposed to support the overall economic policy
of EU. In doing so, it is also supposed to act in concordance with market principles based on
free competition and to support the efficient allocation of resources. The Treaty does not set
precisely what is meant by the price stability. Hence, in 1998, the governing council of ECB
defined quantitatively the price stability as a yearly increase of the harmonized index of

229
consumer prices (HICP) in eurozone not exceeding 2 %. Later, it has also defined the lower
limit of 0 % in order to prevent deflationary expectations.
Monetary policy of ECB is based on two pillars. The first pillar is the role of money.
According to ECB, there is stable long-term relationship between the price level and
monetary aggregates. Monetary aggregates thus contain information about the income and
represent the basis of inflation. According to this monetarist pillar (proclaimed by the chief
economist of ECB Otmar Issing) ECB took up the policy of the German Bundesbank that was
maintaining for a long time low inflation together with strong economic growth. ECB
enunciates reference growth of monetary aggregate M3. This reference value does not
represent the monetary target and ECB thus does not attempt to maintain it by means of
interest rates. The reference value is 4.5 % yearly. This value results from the following
calculation:
M3 growth = real GDP growth + inflation – change of the velocity of money,
M3 growth = 2 % + 2 % – ( – 0.5 %),
M3 growth = 4.5 %.
ECB supposes that the real GDP grows at 2 %, HICP growth is 2 % and the drop of the
velocity of M3 equals to 0.5 %. The reality is, however, different. From the start of 1999 till
the middle of 2005 the annual M3 growth is much higher − in the range from 4 % to 9 %.
The second pillar of monetary policy represents a wide-ranging set of other variables.
Neither Bundesbank was using only monetary aggregates. ECB is preparing the second pillar
twice a year and it publishes it in its monthly bulletin. Analyses of the second pillar
concentrate on diverse price-determining factors. These factors are: GDP, labour market,
indicators of expenses and prices, fiscal policies, balance of payments, asset prices etc.
This double-pillar strategy of ECB is often subject to criticism. Some critics consider M3 the
vestige of the strictly monetarist policy of Bundesbank.
Figures 2.13 to 2.16 show the development of main refinancing operations interest, monetary
aggregates, harmonized index of consumer prices (HICP), and inflation derived from HICP in
Eurozone till 2005.

230
0
2
4
6
8
10
12
14
16
18
20
1960 1964 1968 1972 1976 1980 1984 1988 1992 1996 2000 2004 2008
%
Main refinancing operations interest rate
Figure 2.13 The development of main refinancing operations interest rate in Eurozone
0
1000
2000
3000
4000
5000
6000
7000
1960 1964 1968 1972 1976 1980 1984 1988 1992 1996 2000 2004 2008
EUR
bln
.
Monetary aggregate M0 Monetary aggregate M1
Monetary aggregate M2 Monetary aggregate M3
Figure 2.14 Development of monetary aggregates in Eurozone

231
0
20
40
60
80
100
120
140
160
180
200
1960 1964 1968 1972 1976 1980 1984 1988 1992 1996 2000 2004 2008
%
Harmonised index for consumer prices (HICP)
Figure 2.15 Development of harmonized index of consumer prices (HICP) in Eurozone
0
2
4
6
8
10
1960 1964 1968 1972 1976 1980 1984 1988 1992 1996 2000 2004 2008
%
Inflation
Figure 2.16 Development of inflation derived from HICP in Eurozone

232
2.13 Monetary policy in Japan
Figures 2.17 to 2.21 show the development of uncollaterised overnight call rate, monetary
aggregates, consumer price index (CPI), inflation derived from CPI, and ex post real interest
rate in Japan from 1960 till 2005.
Japan is in 2005 for ten years in economic crisis with low or negative growth. The roots of the
crisis were sown in the high-growth period of the 1980s when the stock market and real sector
market experienced a bubble. From a peak in around 1990 stock and land prices halved in the
course of 2-3 years. This led to negative effects on both consumption and investments.
Growth of GDP lowered in 1992-94. In reaction to the decline, Bank of Japan gradually eased
monetary policy from 1991. The benchmark official interest rate was lowered to 0.5 % in
1995, and in 1999-2000 a zero-interest-rate policy was applied. At the same time expensive
fiscal policy measures were introduced, and the economy then seemed to be back on the right
track in 1995-96. However, there was a new slowdown in 1997-98. For example the financial
crisis in Asia negatively influenced many of Japan's trading partners.
The attempt to comply with the capital adequacy requirements reduced the banks' lending
activities at the beginning of 1990s which led to credit crunch. Banks were also suffering the
consequences of the burst of the stock and real estate bubble. They experienced large losses
on their portfolios of shares and on bad loans. Low or negative growth reduced the borrowers'
ability to service the loans, while the value of the collateral (often land) lowered significantly.
In 1997 this led to a banking crisis including bankruptcies of banks, and the government had
to step in to provide capital.
Japan plunged into deflation in the first half of 1999. Fiscal policy was eased significantly,
resulting in the public debt of approximately 165 % of GDP by the end of 2004. In view of an
economic upswing the central bank decided to raise the interest rate to 0.25 % in the summer
of 2000. Shortly afterwards the economy weakened again as a result of the global economic
slowdown. In early 2001, the interest rate was lowered to 0.15 %, and in March of the same
year the central bank introduced a new operational target. It is sometimes referred to as a
quantitative target and is a target for counterparty deposits at the central bank. From the mid
2001 the short-term money-market interest rate is 0.001-0.003 %. Japan is in a liquidity trap.
Estimates vary as to the scale of the bad loans. Officially, they are assessed at 6-7 % of GDP,
while market participants consider the volume to be much larger. The immediate prospects for
the Japanese economy are miserable. There is a recession, prices are falling, the large public
debt is increasing, and the banking sector is weak.

233
0
2
4
6
8
10
12
14
16
18
20
1960 1964 1968 1972 1976 1980 1984 1988 1992 1996 2000 2004 2008
%
Uncollaterized overnight call rate
Figure 2.17 Development of uncollaterised overnight call rate in Japan
0
1000
2000
3000
4000
5000
6000
7000
8000
9000
10000
11000
12000
1960 1964 1968 1972 1976 1980 1984 1988 1992 1996 2000 2004 2008
JPY
100
bln
.
Monetary aggregate M0 Monetary aggregate M1
Monetary aggregate M2+CDs Monetary aggregate M3+CDs
Figure 2.18 Development of monetary aggregates in Japan

234
0
20
40
60
80
100
120
140
160
180
200
1960 1964 1968 1972 1976 1980 1984 1988 1992 1996 2000 2004 2008
%
Consumer price index (CPI)
Figure 2.19 Development of CPI in Japan
-5
0
5
10
15
20
25
30
1960 1964 1968 1972 1976 1980 1984 1988 1992 1996 2000 2004 2008
%
Inflation
Figure 2.20 Development of inflation derived from CPI in Japan

235
-14
-12
-10
-8
-6
-4
-2
0
2
4
6
8
10
1960 1964 1968 1972 1976 1980 1984 1988 1992 1996 2000 2004 2008%
Real interest rate
Figure 2.21 Development of ex post real interest rate in Japan
2.14 Monetary policy in the United Kingdom
It is appealing to compare monetary policy of the USA with monetary policy of the United
Kingdom34. Both countries did not experience hyperinflation. Inflation in the United Kingdom
was often substantially higher than in the USA (Figure 2.2). From 1800 to 1916, the price
level in the United Kingdom was mostly lowering. During the World War I inflation
increased. From 1920 to 1940, the United Kingdom experienced deflation again. Until 1971,
the inflationary development was quite modest. Since that time, inflation in the United
Kingdom was highly exceeding inflation in the USA. The average yearly inflation for the
period starting 1972 and ending 2005 reached 7.1 %.
34 If somebody would like to compare the current monetary framework within a historical context then she may with to consult the textbook:
Balls, Ed and O’Donnell, Gus (eds): Reforming Britain’s Economic and Financial Policy – Towards Greater Economic Stability. Palgrave, Basingstoke 2002.
She may also wish to look at:
Bean, Charles and Jenkinson, Nigel: The formulation of Monetary Policy at the Bank of England. Bank of England Quarterly Bulletin, 2001, Winter, 434-41.

236
Figures 2.22 to 2.26 show the development of repo rate, monetary aggregates, retail price
index excluding mortgage payments (RPIX), inflation derived from RPIX, and ex post real
interest rate in the United Kingdom from 1960 till 2005.
The key difference between the USA and the United Kingdom is non-monetary view on
inflation and scepticism about the control of aggregate demand through monetary policy in
1950s. At that time policy advisers and academics adhered to the “Neanderthal Keynesian”
view35. This view was based on assumption that consumption and investment were quite
insensitive to monetary policy actions. Monetary policy was seen to influence the exchange
rate. The U.K. adhered on a fixed exchange rate also in the 1960s. Some tightening of
monetary policy had a source in exchange rate considerations. But high money growth and
inflation during the 1960s made adherence to a fixed exchange rate impossible. The U.K.
gradually made higher reliance on classical monetary policy.
In the 1960s the “main instrument” of monetary policy was considered the credit control. It
was the requirement that the commercial banks should keep their increase in loans to the
private sector to a specified limit. This control was applied to the “clearing banks” up to 1961,
and was extended thereafter to other commercial banks. Credit control was abolished in 1971.
Targets for broad money growth (M3) were formally announced in July 1976, even if
monetary targets had been used since 1973. These developments occurred despite continuing
strong reliance on the non-monetary variables. The details of internal discussions were not
disclosed at that time (thus the term “Kremlinology”). The dissent between advocates of
classical monetary policy and traditional hardliners continued. According to Goodhart36 soon
after the introduction of monetary targets, the short term rates were used to almost fix the
dollar/sterling exchange rate.
The “corset” scheme was introduced in late 1973 with the aim to lower M3 growth without
changing interest rates. By supplementary special deposits scheme (the corset) banks and
finance houses were required to place special deposits with Bank of England if their growth in
interest bearing liabilities exceeds specified limits. It is doubtful whether the corset had a
restrictive effect but it led the banks to evade the new control (creation of deposit substitutes).
The corset was abolished in mid-1980.
35 Batini, Nicoletta, and Nelson, Edward: The U.K.’s Rocky Road to Stability. Working Paper 2005-020A. Federal Reserve Bank of St. Louis, St. Louis 2005. 36 Goodhart, Charles.: Monetary Theory and Practice: The U.K. Experience. Macmillam, London 1984.

237
0
2
4
6
8
10
12
14
16
18
20
1960 1964 1968 1972 1976 1980 1984 1988 1992 1996 2000 2004 2008
%
Repo rate
Figure 2.22 Development of repo rate in the United Kingdom
0
100
200
300
400
500
600
700
800
900
1000
1100
1200
1300
1960 1964 1968 1972 1976 1980 1984 1988 1992 1996 2000 2004 2008
GB
P bl
n.
Monetary aggregate M0 Monetary aggregate M1
Monetary aggregate M2 Monetary aggregate M4
Figure 2.23 Development of monetary aggregates in the United Kingdom

238
0
20
40
60
80
100
120
140
160
180
200
1960 1964 1968 1972 1976 1980 1984 1988 1992 1996 2000 2004 2008
%
Retail price index excluding mortgage loans (RPIX)
Figure 2.24 Development of retail price index excluding mortgage loans (RPIX) in the
United Kingdom
02468
10121416182022242628
1960 1964 1968 1972 1976 1980 1984 1988 1992 1996 2000 2004 2008
%
Inflation
Figure 2.25 Development of inflation derived from the RPIX in the United Kingdom

239
-16-14-12-10
-8-6-4
-202468
10
1960 1964 1968 1972 1976 1980 1984 1988 1992 1996 2000 2004 2008
%
Real interest rate
Figure 2.26 Development of ex post real interest rate in the United Kingdom
In early 1980s disinflation was very fast. But at the late 1980s there was a marked
deterioration in inflation with a peak in 1990. In October 1990 the U.K. entered into the
Exchange Rate Mechanism and in September 1992 was forced to exit (with large exchange
rate depreciation). In October 1992 inflation targeting was introduced and in 1997
independence was conferred on the Bank of England. This regime continues to the present
day. In December 2003 HM Treasury changed the inflation target from 2.5 % measured by
RPIX to a 2 % measured by the new CPI (UK HICP).
2.15 Some general trends
Let’s compare the development of broad monetary aggregates (M2, M3) in the USA,
Eurozone, Japan and the United Kingdom during the last four decades. In the first three
decades (from 1960 till 1990) broad monetary aggregates had been increasing exponentially
in all above mentioned countries. Introduction of Basle Capital Accord of 1988 had not the
same impact in all countries. Growth of broad monetary aggregates had been heavily
suspended for five years in the USA and Japan while monetary growth had been only slowed

240
down in the United Kingdom. It seems that there was almost no effect of Basle Capital
Accord on monetary development in the countries which later constituted the Eurozone.
Afterwards (from 1995 till 2005), monetary aggregates in the USA, Eurozone, and the United
Kingdom have been increasing exponentially again even if it seems that there is transition to
linear growth in the USA in the last five years. But in Japan the rise of monetary aggregates
follow linear pattern.
It is worth mentioning that the suspension or the low down of the growth of the broad
monetary aggregates due to the introduction of Basle Capital Accord of 1988 did no have any
impact the growth of real GDP in any mentioned country.
Let’s compare the growth of broad monetary aggregates with the growth of nominal GDP
(Table 4.2) in the last two decades. In the USA the average growth of broad monetary
aggregates approximately matched the average growth of nominal GDP. But in Eurozone,
Japan and United Kingdom the average growth of broad monetary aggregates was faster than
the growth of nominal GDP. The United Kingdom experienced the average difference in
growth of more than 3 %.
Consumer price index (or its equivalent) followed approximately linear pattern in the last
three decades. The reason is that the high inflation of 1970s and 1980s passed away.
Table 2.4 Average growth of broad monetary aggregates and average growth of nominal
GDP in some countries (in percent)
Country Period Growth of
M2 (1)
Growth of
M3 (2)
Growth of nominal
GDP (3)
(1) − (3) (2) − (3)
United States 1960−2004 7,04 7,95 7,31 −0,27 +0,64
Eurozone 1991−2004 5,57 5,92 3,87 +1,70 +2,05
Japan 1980−2003 5,28 - 3,13 +2,15 -
United Kingdom 1983−2004 10,34 9,63 6,62 +3,72 +3,01

241
3 Payment systems
This chapter describes essentials of payment systems. Further we explain gross and net
settlement systems and payment systems in the United States, Eurozone, Japan and the United
Kingdom.
3.1 Essentials of payment systems
Payment means the transfer of money or liquidity. The payment is carried out by means of
currency or by transfers of bank deposits, i.e. bank payment. Currency is used usually to
realize small retail payments. The large wholesale payments take usually the form of deposit
transfers. In this chapter we will concentrate solely on bank payments.
Payment system or funds transfer system (FTS) is the system of transfers of money or
liquidity between current accounts. It can operate either on the basis of settlement of
individual (gross) payments while checking balances on the current accounts (gross payment
system), on the basis of settlement the net payment calculated as a difference between mutual
claims and obligations (net payment systems), or on the basis of combination of both systems.
3.1.1 Interbank payment systems
The interbank payment system or the interbank funds transfer system (IFTS) is the
system of transfers of liquidity whose participants are mostly or exclusively banks. This
system operates usually on the basis of correspondent banking through mutual nostro and
vostro accounts. Within individual countries, the system of nostro and vostro accounts gets
simplified so that there is one bank or some special entity owned by banks where the banks
hold their nostro accounts. Then, there is one-tier or two-tier system architecture. In one-tier
system architecture, all banks are directly connected to the central payment system operated
usually by central bank. In two-tier system architecture, the central payment system is
restricted on some banks while other banks are connected through satellite payment systems.
The simplest transfers comprise usually three partners. That is the case of payer and payee
(beneficiary) being clients of the same bank. More complicated transfers are, however, more
common. Let’s look to the transfer with two banks: the payer’s bank and the beneficiary’s
bank. This case is covered by the term of correspondent banking which is a situation when

242
one bank has the current account in another bank and through this account banks operate
payments of their clients (or their own payments). One bank considers this account as its
nostro account and the second bank as its vostro account. Example 1.20 (the first chapter)
shows the payment in U.S. dollars through vostro account of payer’s bank and Example 3.1
shows the payment in U.S. dollars through nostro account of payer’s bank. In both cases U.S.
resident pays $100 to eurozone resident. No clearinghouse is needed. In reality more banks
can be involved in the transfer. This type of correspondent banking is mainly used for
domestic or cross-boarder payments in foreign currencies (from the view of some
participant).
For domestic payments in domestic currencies the former system is usually simplified so
that there is one bank or some special entity owned by banks where the banks hold their
nostro accounts. It is central payment system (nostro accounts are held with the central
bank) or satellite payment system (nostro accounts are held with special entity owned by
banks). We have demonstrated the central payment system in the case of the clearing centre of
the Fed on Figure 1.15 (the first chapter).
The central interbank payment system operates on the basis of liquidity transfer from the
account of payer bank to the account of recipient bank within the clearinghouse. The banks
carry out payments following their own orders, their clients’ orders in the form of written
document (transfer order, cheque etc.) or in the form of other types of orders (electronic
orders, phone orders etc.). If both payer and recipient hold their accounts at the same bank,
the transfer is carried out inside the bank’s clearing centre without using the interbank
payment system.
Figure 3.1 shows the U.S. dollar payment between two eurozone residents. The transfer of
funds is based on:
o Two correspondent relationships (eurozone bank A with its correspondent bank in
the USA and eurozone bank B with its correspondent bank in the USA), and
o One central payment system. The transfer between correspondent banks in the
United States is carried out through the standard payment system of the United
States, e.g. through Fedwire or the clearing house interbank payment system
(CHIPS).

243
Example 3.1 Cross-boarder investment denominated in U.S. dollars
(Payment through nostro account of payer’s bank)
Bank A − resident of the USA
Client X − resident of the USA
1) Client X (U.S. resident) pays $100 for real estate to client Y (eurozone resident)
1) $100 Opening balance
client X’s deposit accounts
Opening balance 1) $100
Nostro account with bank B
Bank B − resident of the eurozone
Client Y
Opening balance 1) $100
Current account with bank A
1) $100
Real estate
1) $100 Opening balance
Vostro account of bank A
Opening balance 1) $100
Client Y’s deposit accounts
1) $100
Current account with bank B
Opening balance 1) $100
Real estate

244
Figure 3.1 The payment in U.S. dollars between two eurozone entities
Theoretically eurozone banks A and B can have mutual nostro and vostro foreign currency
accounts and can make their foreign currency payments through these accounts. In practice,
however, commercial banks do not have direct relationships with each other and make their
payments through two or more correspondent banks in countries where the currency of
transfer represents the domestic currency (the so-called U-turn).
Accounts of member banks
Fedwire
Gross settlement system
Clearing house interbank payment system (CHIPS)
American correspondent bank of the eurozone
bank B
American correspondent bank of the eurozone
bank A
Atlantic Ocean
Eurozone bank A Eurozone bank B
Payer BeneficiaryUnderlying liability in U.S. dollars

245
Anyway, there must be an uninterrupted chain of banks having correspondent relationships
between to carry out the transfer. Moreover, each of these correspondent relationships can be
subject to a different legislation and different terms and conditions. It is necessary to
distinguish the chain of mutual correspondent relationships from the underlying obligation
between transferee and beneficiary. The underlying obligation is subject to some legislation
and the transfer of funds to some other legislation. We have to point out that the transfer of
funds does not need to coincide necessarily with any underlying obligation. Depositor, for
instance, can wish only to transfer money from one bank to another one.
The large-value payment is the payment between bank and other important players on the
financial market. This payment requires the early and preferred settlement. Large-value
funds transfer system (wholesale funds transfer system) is the system enabling transfers of
large sums of money or liquidity of high priority between users’ accounts. Although there is
no bottom limit for transferred amounts, the average amount of payments carried through this
system is relatively large. The retail funds transfer system (bulk funds transfer system) is
the system enabling transfers of a large number of smaller payments in form of credit
transfers, direct debits, cheques and payment cards.
The retail payment is typically payment on behalf of bank customer, such as individual,
company, and public authority. The value of the individual orders tends to be low and they are
usually not time-critical.
Some payment systems are operated by central banks. In such a case, there is usually the
facility known as collaterised intraday credit (daylight credit, daylight overdraft). It is the
credit granted by central bank to commercial banks for period shorter than one day for the
purpose of delivering liquidity on clearing accounts with central bank. The facility is
important when reserve requirements are zero or small. In such a way payment system runs
smoothly. The credit is fully collaterised.
3.1.2 Forms of bank payments
There is a variety of current accounts (checking accounts) used to carry out bank payments.
Term deposits and saving deposits are designed primarily for saving and they are usually not
used for payments. Bank payments take usually form of credit transfers, direct debits, cheques
and payment cards.

246
a) Credit transfers
Credit transfer or giro transfer is the payment order made by payer through his bank in
order to transfer money to the account of beneficiary at the same or another bank. Payment
order is headed from the payer to beneficiary and sometimes even through several payment
systems. The payer’s bank debits the given sum from the account of its client. The
beneficiary’s bank credits the given sum to the account of its client. In other words, the
payer’s bank looses obligation to its client and the beneficiary’s bank accepts the obligation to
its client. The system is called credit transfer system or giro transfer system. The problem
of bad cheques does not exist here, for the payer cannot transfer more money than she has. In
the United States, this way of payments does not exist – the only exception is represented by
the automated clearinghouses (ACH).
b) Direct debit
Direct debit, debit transfer or debit collection is a client’s instruction to her bank
authorising a beneficiary to collect varying amounts from her current account. Any payment
is then initiated by beneficiary and the debit order is transferred from the beneficiary’s bank to
payer’s bank and the payment hence follows. The corresponding system is called debit
transfer system (or debit collection system).
Beneficiary makes the payment order in the same way as she would make the credit transfer
order (written or electronic form). Beneficiary’s bank then sends this order to the payer’s bank
through the interbank electronic clearing system and the payer’s bank then debits payer’s
account. Debiting is possible only if payer ordered her bank in advance to do so. The bank is
obliged to prevent any debiting of its client’s account without the explicit agreement. To
identify properly their payment orders, clients have to follow some standardized procedures
allowing banks to understand the aim of those payments.
c) Cheques
Cheque is the written order of drawer to drawee (usually a bank) to pay a given amount to
beneficiary. In case of banking cheque it is in general an order to transfer money from payer’s
current account to beneficiary’s current account held with the same or another bank. The
problem is that sometimes, banks have to deal with bad cheques. The cheque guarantee
system is the system guaranteeing cheques up to the given amount set by the client.
247
Cheque clearing represents the process of sending the cheque from the institution where it
was presented back to institution that had issued it and the simultaneous transfer of money or
liquidity. There are some national cheque clearing systems in some countries (in the United
States this system is operated by the Fed). Cheque truncation means that the institution
where the cheque was presented keeps the paper cheque and sends electronically all necessary
information to the bank which has issued the cheque. Truncated cheque does not return to the
issuing institution.
Cheque payments are widely used for example in the United States, where the majority of
smaller banks send cheques to correspondent banks or to the Fed. If the payer’s account is
outside the local clearinghouse, the payment goes usually through the Fed. The money that
exists both at the payer’s account and at the beneficiary’s account during the transaction is
called “Fed’s float”. Once the beneficiary presents the cheque to her bank, she gets her money
immediately. Payer thus gets the interest-free credit for the time of cheque transaction, i.e.
until the time when the money is debited from her account. Credit cards offer much longer
interest-free credit period.
d) Payment cards
The term payment card represents charge card, debit card or credit card. By using the charge
card the accounts are normally submitted to the card holder monthly and must be settled in
full. Debit card is issued by a bank or other financial institution for the purpose to draw
money from the current account. The debiting procedure commences directly after the
transaction which results in the holder's account being debited within a few days. Credit card
allows obtaining goods and services on credit terms. Transactions during a month are totalled
and presented to the card holder for settlement on a monthly basis. Alternatively a percentage
of the outstanding amount can be paid and the balance extended to the next month and so on.
This will normally incur a much higher annual rate of interest than usual, for example, 2% per
month being equivalent to an annual percentage rate of 26.82 %.
Payment schemes bring together cardholders, traders and banks. They provide functions such
as clearing and authorisation including some form of payment guarantee. Visa and
MasterCard are the leading examples of large international payment schemes.

248
3.2 Gross and net settlement systems
Fundamentally, there are two basic types of settlement systems, namely the gross settlement
systems and net settlement systems. Settlement systems can operate in a real time or on a
batch basis.
3.2.1 Gross settlement systems
Gross settlement system is a settlement system in which settlement takes place on an order-
by-order basis (without netting). The gross feature of the system refers to the fact that each
transaction is settled separately. The structure of the gross payment system is simple (Figure
3.2). Every single payment is processed separately and immediately when the bank-payer has
sufficient liquidity. The settlement does not depend upon any netting mechanism. Moreover,
any settlement is final and there is no mechanism of unwinding (see further). The gross
settlement system features a disadvantage resulting from higher liquidity requirements.
The most of interbank gross settlement systems in the world are the real time gross settlement
systems (RTGS). RTGS is the system where payment orders are processed and settled
continuously in a real time. The modern information technology has almost eliminated any
delays between the transfer order and settlement. The queuing is usually based on principle
the “first in, first out” Any payment system operated by the central bank is RTGS. In such a
system, liquidity is wired by banks on behalf of their customers (or on behalf of their own) to
other banks. The banks actually transfer bank reserves (liquidity) from and to their accounts
on the books of the central bank. The real-time feature of the system means that the funds
received are available at exactly the time when they arrive. There is no wait for accumulated
inflows and outflows to largely offset each other, with only a smaller net amount transferred.
An RTGS system essentially eliminates settlement risk by eliminating any delay between the
time a payment message is sent and the time it is processed and settled. To improve the
liquidity of RTGS systems, the central bank typically provides participants some access to
collaterised intraday credit.
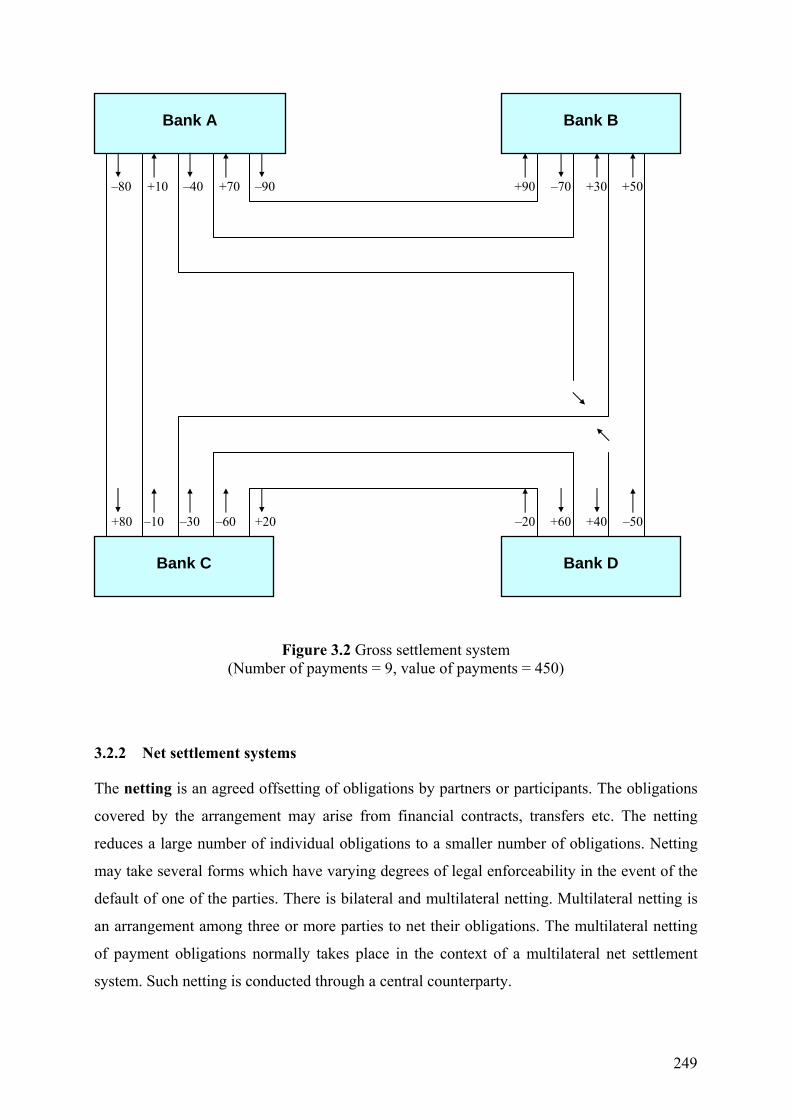
249
Figure 3.2 Gross settlement system (Number of payments = 9, value of payments = 450)
3.2.2 Net settlement systems
The netting is an agreed offsetting of obligations by partners or participants. The obligations
covered by the arrangement may arise from financial contracts, transfers etc. The netting
reduces a large number of individual obligations to a smaller number of obligations. Netting
may take several forms which have varying degrees of legal enforceability in the event of the
default of one of the parties. There is bilateral and multilateral netting. Multilateral netting is
an arrangement among three or more parties to net their obligations. The multilateral netting
of payment obligations normally takes place in the context of a multilateral net settlement
system. Such netting is conducted through a central counterparty.
+80
Bank A Bank B
Bank C Bank D
–10
–80 +10 –40
–30
+70
–60 +20 –20 +60 +40 –50
–90 +90 –70 +30 +50

250
Net settlement system is a settlement system in which settlement takes place on a net basis.
The system requires less liquidity for the participants involved. Payments to and from any
participant accumulate and only the net difference is transferred. What that means is that, on
receipt of the funds, the recipient does not have access to those funds until the accumulated
inflows and outflows are netted and settled. Transfers are settled at the end of the processing
cycle, with all transfers being provisional until all participants have discharged their
settlement obligations.
If a participant fails to settle, some or all of the provisional transfers involving that participant
are deleted from the system and the settlement obligations from the remaining transfers are
then recalculated. Such an unwinding procedure has the effect of transferring unpredictable
liquidity pressures and possible losses arising from the failure to settle to the remaining
participants, and may in an extreme case result in defaults by other participants. In order to
avoid unwinding procedures, a system could set up a guarantee fund, paid into by the
participants, in combination with a limit system on net open debit positions, which would
make sure that settlement would take place even if the largest debtor in the system defaults.
There are two basic systems of net settlement, namely bilateral net settlement system and
multilateral net settlement system.
Bilateral net settlement system is a settlement system in which settlement takes place on a
net basis between two parties (Figure 3.3).
Multilateral net settlement system is a settlement system in which settlement takes place on
a net basis between three or more parties (Figure 3.4 – 3.6). Calculations of multilateral net
positions are provided usually by the clearing centre operating as a central party place in the
middle of the system. Every operation between participants X and Y is thus divided into two
separate operations: operation between X and clearing centre and operation between the
clearing centre and Y.
Multilateral net settlement position is the sum of the value of all the transfers a participant
in a net settlement system has received during a certain period of time less the value of the
transfers made by the participant to all other participants. If the sum is positive, the participant
is in a multilateral net credit position; if the sum is negative, the participant is in a multilateral
net debit position. The net credit or debit position is called net settlement position. The
multilateral net position is also the bilateral net position between each participant and the
central counterparty.

251
Figure 3.3 Bilateral net settlement system (Number of payments = 6, value of payments = 250)
+70
Bank A Bank B
Bank C Bank D
–70 –40
–30 –40 +40 +40 –50
–20 +20 +30 +50

252
Figure 3.4 Multilateral net settlement system based on direct calculation of multilateral net positions
+80
Bank A (Multilateral net position
= –130)
Bank B (Multilateral net position
= +100)
Bank C (Multilateral net position
= 0)
Bank D (Multilateral net position
= +30)
–10
–80 +10 –40
–30
+70
–60 +20 –20 +60 +40 –50
–90 +90 –70 +30 +50
Clearing centre

253
Figure 3.5 Multilateral net settlement system based on indirect calculation of multilateral net positions
Bank A (Multilateral net position
= –130)
Bank B (Multilateral net position
= +100)
Bank C (Multilateral net position
= 0)
Bank D (Multilateral net position
= +30)
–70
+70
–40
–30 –40
–20 +20 +30 +50
Clearing centre
+40 +40 –50

254
Figure 3.6 Multilateral net settlement system (Number of payments = 3, value of payments = 130)
The multilateral net settlement system is much more complicated than gross settlement
systems from the point of view of their legal structure. There are two basic types of
multilateral net settlement systems:
o The multilateral net settlement system based on direct calculation of multilateral net
positions, i.e. there is no bilateral netting prior to multilateral netting (Figure 3.4),
and
o The multilateral net settlement system based on indirect calculation of multilateral
net positions, i.e. there is bilateral nettings prior to multilateral netting (Figure 3.5).
Bank A (Multilateral net position
= –130)
Bank B (Multilateral net position
= +100)
Bank C (Multilateral net position
= 0)
Bank D (Multilateral net position
= +30)
–130
0
+100
Clearing centre
+30

255
Operations of the multilateral settlement systems can be divided into two separate phases,
namely the netting and the settlement. Payment orders are electronically transferred into the
clearing centre. Clearing centre calculates multilateral net settlement positions of each
participant (debit, credit, or zero). Such positions are no usually legally enforceable.
Afterwards, participants having the net debit positions are expected to initiate payments in
favour of participants having the net credit positions.
Once the system has settled all net positions, individual payment orders included are
considered to be legally enforceable. If any of the participant was unable to settle her net
position, unwinding follows. By cancelling some payments, some creditors can loose part of
their payments due. But unwinding does not represent the only possible solution. There is also
possibility that all other participants can share loses equally through the guarantee fund.
Let’s compare the gross settlement system, bilateral net settlement system, and multilateral
net settlement system:
o In the case of gross settlement system (Figure 3.2), the number of payments is 9 and
the value of payments is 450,
o In the case of bilateral net settlement system (Figure 3.3), the number of payments is
6 and the value of payments is 250,
o In the case of multilateral net settlement system (Figure 3.4 − 3.6), the number of
payments is 3 and the value of payments is 130.
The main advantage of net settlement systems consists in the substantial reduction of the
number and value of interbank settlement operations and reduction of liquidity requirements.
However the multilateral settlement systems carry the risk for all participants relying on the
net position estimates − these positions are usually not legally enforceable (till the settlement)
and are subject to the subsequent settlement between all system participants. In other words,
the time lag between netting and settlement causes that participants with the net credit
positions grant implicit credits to participants of the net debit position.
We conclude that bilateral and multilateral net settlement systems can save large amounts of
liquidity and reduce settlement risk. However, the real-time gross settlement systems are now
considered more convenient.

256
3.3 Payment systems in the United States
There are two major large-value payment transfer systems in the United States: Fedwire and
CHIPS. Generally, these payment systems are used by financial institutions and their
customers to make large-dollar, time-critical transfers. We mention also Federal Reserve
National Settlement Service and Automated Clearing Houses.
The Fedwire funds transfer system is a real-time gross settlement system that enables
participants to send and receive final payments through liquidity at the Fed between each
other. Fedwire processes and settles payment orders individually. Payment to the receiving
participant is final and irrevocable when the amount of the payment order is credited to the
receiving participant’s account or when notice is sent to the receiving participant, whichever
is earlier. Fedwire funds transfers are generally initiated online, via an electronic connection
to the Fed communications network. Approximately 9,500 participants are currently able to
initiate or receive funds transfers over Fedwire.
CHIPS (Clearing House Interbank Payments System) is owned and operated by the Clearing
House Interbank Payments Company L.L.C. (CHIPCo). All participants are members of
CHIPCo. In 2001, CHIPCo converted CHIPS from an end-of-day, multilateral net settlement
system to one that provides real-time final settlement for payment orders. Participation in
CHIPS is available to commercial banking institutions or Edge Act corporations. A non-
participant wishing to send payments over CHIPS must employ a CHIPS participant to act as
its correspondent or agent. There are approximately 60 participants. The payments transferred
over CHIPS are often related to international interbank transactions, including the dollar
payments resulting from foreign currency transactions (such as spot and currency swap
contracts) and eurodollar placements and returns. Payment orders are also sent over CHIPS
for the purpose of adjusting correspondent balances and making payments associated with
commercial transactions, bank loans and securities transactions.
The Fed allows participants in private clearing arrangements to settle transactions on a net
basis using account balances held at the Fed through the Federal Reserve National
Settlement Service (NSS). Participants include cheque clearing houses, ACH networks and
some bank card processors. Approximately 70 local and national private sector clearing and
settlement arrangements use NSS. NSS offers finality that is similar to that of the Fedwire
funds transfer service and provides an automated mechanism for submitting settlement files to
the Fed.

257
The Automated Clearing Houses (ACHs) are nationwide electronic file transfer mechanisms
that process transfers initiated by depository institutions through electronically originated
batches. Only banks may have direct links to the ACH, and, through them, more than 3
million businesses and 100 million consumers originate and receive ACH transactions. The
first ACH was created in the mid-1970s as part of the government’s efforts to begin
dispersing electronically the burgeoning number of government payments (such as Social
Security). There are currently two ACH operators: the Fed and Electronic Payments Network
(EPN) − formerly the New York Automated Clearinghouse. The Fed is the nation’s largest
ACH operator and processed more than 85% of the commercial interbank ACH transactions.
ACH transactions processed by the Fed are settled through deposit-taking institutions’
accounts held at the Fed. Though EPN is not a bank, it is bank-owned. For transactions sent
through the Fed, settlement may take place in the Fed account of each bank or in the Fed
account of designated correspondents. EPN ultimately relies on the Fed for settlement.
3.4 Payment system in Eurozone
There are six large-value payment systems operating in euro:
o TARGET of the Eurosystem,
o The Euro System of the EBA Clearing Company (EURO 1),
o The French Paris Net Settlement (PNS),
o The Spanish Servicio de Pagos Interbancarios (SPI),
o The Finnish Pankkien On-line Pikasiirrot ja Sekit-järjestelmä (POPS),
o CLS.
TARGET is the RTGS system for the euro, offered by the Eurosystem. It is used for the
settlement of central bank operations, large-value euro interbank transfers as well as other
euro payments. It provides real-time processing, settlement in central bank money and
immediate finality. TARGET was created by interconnecting national euro real-time gross
settlement (RTGS) systems and the ECB payment mechanism. It was launched in January
1999. The launch of the single currency necessitated a real-time payment system for the euro
area. TARGET stands for Trans-European Automated Real-time Gross settlement Express
Transfer system.

258
EURO 1 is a multilateral large-value payment system for euro payments. It is managed by the
EBA Clearing Company, set up by the Euro Banking Association (EBA). The EBA is a
cooperative undertaking between EU-based commercial banks and EU branches of non-EU
credit institutions. It currently has over 70 participating banks from the EU-15 Member States
and five non-EU countries. EURO 1 is a net settlement system. It handles credit transfers and
direct debits. Payments are processed throughout the day. Balances are settled at the end of
the day via a settlement account at the European Central Bank.
PNS is a hybrid settlement system. Participants can set bilateral limits. Transactions are
settled in real time if there is sufficient liquidity on the participant’s account and if bilateral
limits are met. Otherwise, transactions are queued. The system offers optimization
mechanisms. At the opening of the system, participants need to make a transfer from their
settlement accounts at the Banque de France through the French TARGET component TBF to
their position in PNS. Participants may transfer liquidity between TBF and PNS and vice
versa during the day. Balances in PNS are always positive. End-of-day balances are credited
the participants’ settlement accounts at the Banque de France. PNS went live in April 1999.
SPI is a net settlement system which clears and settles large-value payments in euro. It is
owned by its participants. The system processes mainly cross-border interbank and customer
payments. Domestic payments are also processed. Payment orders are exchanged all day.
Final positions are settled via the account held by the participants at the Banco de España.
POPS is a real-time system operated by the participating banks on a decentralised basis. The
banks send payment messages bilaterally. The system uses both netting and gross settlement.
Payment orders are generally netted bilaterally. Whenever a large payment exceeds the
established limits, the bank has to make a corresponding transfer in the Finnish TARGET
component BoF-RTGS. Once the bilaterally agreed net debit limit is reached, a transfer is
made via the BoF-RTGS. At the end of the day a settlement is made, thereby zeroing any
remaining bilateral obligations.
CLS is the continuos linked settlement system for foreign exchange transactions.
Traditionally the two legs of a foreign exchange transaction were settled separately. Taking
time-zone differences into account, this heightened the risk of one party defaulting before
both sides of the trade are settled. CLS eliminates this risk. It settles both sides of a foreign
exchange deal simultaneously. This is also called payment-versus-payment (PvP) settlement.
Settlement in CLS is final and irrevocable. Participating banks get real-time settlement
information. This helps them to manage liquidity more efficiently, reduce credit risks and

259
introduce operational efficiencies. CLS started operating in September 2002. The ECB acts as
the settlement agent for CLS bank's euro payments. The ECB has opened an account for CLS
Bank. All payments to and from CLS are processed via the ECB payment mechanism (EPM
and consequently via TARGET). The euro is the most important currency settled in this
system after the US dollar. It accounts for about one-quarter of all settlements.
The major retail payment systems in the euro area are:
o CEC (Centre for Exchange and Clearing) of Belgium,
o CHS (Brussels Clearing House),
o PMJ (Banks Payment System) of Finland,
o SIT (Systeme Interbancaire de Telecompensation) of France,
o RPS (Retail Payment System) of Germany,
o ACO (Athens Clearing Office) of Greece,
o DIAS (Interbanking System) of Greece,
o IRECC (Irish Retail Electronic Payments Clearing Company Limited) of Ireland,
o IPCC (Irish Paper Clearing Company Limited),
o BI-COMP (Clearing system for interbank payments) of Italy,
o LIPS-Net (Luxembourg Interbank Payment System on a net basis) of Luxembourg,
o CSS (Clearing and Settlement System) of the Netherlands,
o SICOI (Interbank Clearing System) of Portugal,
o SNCE (National Electronic Clearing System) of Spain,
o STEP 2 system of the EBA Clearing Company.
Retail payment systems traditionally cover only one country. The first pan-European
automated clearing house (PE-ACH) is the STEP 2 system, which the Euro Banking
Association (EBA) launched in April 2003.
3.5 Payment system in Japan
There are four major clearing systems in Japan:
o Bank of Japan Financial Network System,

260
o Zengin Data Telecommunications System,
o Foreign Exchange Yen Clearing System (FXYCS), and
o bill and check clearing systems.
In the first two systems, and at the 34 bill and check clearing houses in which the Bank of
Japan’s head office or branches are direct participants, the net settlement position of each
financial institution is calculated by netting payments made and received by the institution
and settled by debiting and crediting BOJ accounts through the BOJ-NET Funds Transfer
System.
The Bank of Japan Financial Network System (BOJ-NET) permits electronic settlement of
transactions for participants with accounts at the Bank of Japan. Transfers through BOJ-NET
may settle immediately (RTGS) or at a designated time depending on participant instructions.
In both cases settlement is final and irrevocable. Transactions are initiated through BOJ-NET
terminals.
The Zengin Data Telecommunications System is operated by the Tokyo Bankers
Association (TBA). It is a completely electronic payment system for domestic third party
transfers which uses a communications and network from NTT Data Communications
Systems Corporation. Transactions are entered and processed online but settlement does not
take place until after the Zengin System has closed for the day.
The Foreign Exchange Yen Clearing System (FXYCS) is operated by the TBA. The
FEYCS is a net settlement system which accepts SWIFT formats for message transmission
and uses Bank of Japan accounts for settlement. It is used for settlement of yen transactions
associated with cross border financial transactions and is similar to CHIPS such as yen
payments from individuals and firms overseas to residents in Japan, or foreign exchange
transactions between financial institutions.
The Bill and check clearing systems are used by financial institutions to clear bills of
exchange and checks drawn by individuals or firms. There are more than 600 clearing housed
in Japan.. More than 70 % of the total clearing value is concentrated within the Tokyo
Clearing House. Any clearing house serves a specific geographical area. Member institutions
gather at a specific time to exchange bills and checks and calculate their net settlement
positions. Clearing houses are operated, among others, by local bankers associations. Net
settlement is realised through the BOJ-NET.

261
3.6 Payment system in the United Kingdom
In the United Kingdom, the main interbank payment networks are: CHAPS (Sterling and
Euro), BACS, and the cheque and credit clearings. BACS and the cheque and credit clearings
deal with high volumes of relatively small-value payments, although they are able to
accommodate non-urgent large value transfers if required. All three “retail” clearings work on
a three-day processing cycle and are not suited for use by those wholesale financial markets
(eg. foreign exchange and money markets) which are geared to shorter settlement cycles. As a
result, the average value of transactions in these clearings is much smaller than for those
processed through either of the CHAPS clearings.
The Clearing House Automated Payment System (CHAPS) is RTGS system primarily
designed for high-value payments, although there is no lower (or upper) limit on the value of
payments that may pass through the clearings. The CHAPS now handles nearly all large-value
same-day sterling payments between banks. There are currently 13 direct participants in
CHAPS Sterling. Prior to April 1996 payments were processed as a single net transaction at
the end of the day and exposed the settlement banks to massive losses if one of the banks
were to fail. In January 1999 the RTGS system was developed to accommodate euro accounts
(CHAPS Euro) so that members could make domestic and cross-border euro payments.
CHAPS Euro connects to the TARGET system, which links together the RTGS systems of
the 15 EU states and the European Central Bank. This provides member banks with the ability
to make and receive cross-border as well as domestic payments in euros. A total of 20 banks,
including two remote participants, are members of CHAPS Euro. Of these, 12 banks
(including the Bank of England) are also members of CHAPS Sterling. A significant
proportion of CHAPS payments, by value, originate in the foreign exchange market and other
wholesale markets owing to their requirement for a prompt settlement service. The CHAPS
system is, however, also used to facilitate same-day transfers arising from a range of other
activities (general commercial transactions and the purchase of domestic property etc.), and
the value of individual transfers can be quite small.
BACS (known as Bankers’ Automated Clearing Services Ltd until 1986) is an ACH
responsible for clearing bulk electronic transfers in both debit and credit form, and now
processes the majority of electronic interbank funds transfers in the United Kingdom. The
clearing is operated by BACS Ltd. BACS Ltd sets operational rules for users and for the
banks and building societies which act as settlement members. The membership of BACS

262
consists of the Bank of England, 12 commercial banks (representing 10 separate banking
groups) and one building society. These credit institutions are the shareholders of BACS Ltd,
and are responsible for settling all interbank obligations arising from the BACS clearing
process. Users are allocated a BACS user number by their sponsor and are able to submit
payment instructions directly to the system. There are in the region of 60,000 users, including
a wide range of commercial and public sector bodies, along with many other indirect users
who submit instructions via an intermediary. The interbank obligations that arise in BACS are
settled at the Bank of England on a multilateral net basis on Day 3 of the clearing cycle.
The Cheque and Credit Clearing Company is responsible for the cheque and paper credit
clearings for England, Wales and Scotland. Although the cheque and credit clearings are
managed by the same body and have the same set of settlement members (7) they are distinct
clearings subject to their own rules. The Cheque and Credit Clearing Company has 12 direct
settlement members, which settle all interbank items passing across the two clearing
arrangements. The membership includes the Bank of England, 10 commercial banks
(representing nine separate banking groups) and one building society. Other banks and
building societies can have access to both clearings through agency arrangements with the
direct members.
In November 2001 the Bank of England, with CRESTCo, has introduced Delivery versus
Payment (DvP) against central bank liquidity for the settlement of securities in CREST −
gilts, equities, and money market instruments. It is a simultaneous exchange of central bank
liquidity for securities. This is achieved by each CREST settlement cycle resulting in transfers
between RTGS accounts in respect of the payments generated in that cycle, debiting each
sending bank with the sum of the gross debits advised by CREST and crediting the receiving
bank in central bank liquidity.

263
References
Anderson, Richard G.: Some Tables of Historical U.S. Currency and Monetary Aggregates Data. Working Paper. Federal Reserve Bank of St. Louis, St. Louis, 2003.
Arestis, Philip and Eichner, Alfred: The Post-Keynesian and Institutionalist Theory of Money and Credit. Journal of Economic Issues, 1988, 22(4), 1003-21.
Arestis, Philip and Howells, Peter: The Supply of Credit Money and the Demand for Deposits: a Reply. Cambridge Journal of Economics, 1999, 23(1), 115-19.
Arestis, Philip and Sawyer Malcolm (ed): Money, Finance and Capitalist Development. Edward Edgar, Cheltenham 2001.
Bagehot, Walter: The Lombard Street: A Description of the Money Market. Henry S. King and Co., London 1873.
Balls, Ed and O’Donnell, Gus (eds): Reforming Britain’s Economic and Financial Policy – Towards Greater Economic Stability. Palgrave, Basingstoke 2002.
Banking Reform – Discussion. The American Economic Review, 1913, 3(1), 64-88.
Batini, Nicoletta, and Nelson, Edward: The U.K.’s Rocky Road to Stability. Working Paper. Federal Reserve Bank of St. Louis, St. Louis 2005.
Bean, Charles and Jenkinson, Nigel: The formulation of Monetary Policy at the Bank of England. Bank of England Quarterly Bulletin, 2001, Winter, 434-41.
Beckhart, Benjamin H.: Monetary Policy and Commercial Bank Portfolios. The American Economic Review, 1940, 30(1) Supplement, 17-26.
Bell, Stephanie: The Role of the State and the Hierarchy of Money. Cambridge Journal of Economics, 2001, 25(2), 149-163.
Bellofiore, Riccardo: Between Wicksell and Hayek: Mises' Theory of Money and Credit Revisited, The American Journal of Economics and Sociology, 1998, 57(4), 531-78.
Bernanke, Ben S. and Woodford, Michael (eds): The Inflation Targeting Debate. The University of Chicago Press, Chicago 2005.
Between Wicksell and Hayek: Mises' Theory of Money and Credit Revisited, The American Journal of Economics and Sociology, 1998, 57(4), 531-78.
Bernholz, Peter: Monetary Regimes and Inflation: History, Economic and Political Relationships. Edward Elgar, Cheltenham 2003.
Bessis, Joel: Risk Management in Banking. John Wiley & Sons, Chichester 1998.
Bindseil, Ulrich: Monetary Policy Implementation: Theory Past and Present. Oxford University Press, Oxford 2004.
Bisschop, W. R.: The Rise of the London Money Market, 1640 to 1826. Batoche Books Limited, Ontario 1896 (2001).
Black, Fischer: Active and Passive Monetary Policy in a Neoclassical Model. Journal of Finance, 1972, 27(4), 801-814.
Black, Fischer: The Trouble with Econometric Models. Financial Analysts Journal, 1982, 38(2), 29-37.

264
Black, Fischer: Business Cycles and Equilibrium. Basil Blackwell, New York 1987.
Blomquist, Thomas W. Commercial Association in Thirteenth-Century Lucca. Business History Review, 1971, 45(2), 157-178.
Bruun, Charlotte: Logical Structures and Algorithmic Behaviour in a Credit Economy. Ph.D. dissertation. Department of Economics, Politics and Public Administration, Aalborg University 1995.
Champ, Bruce, and Freeman, Scott: Modelling Monetary Economics. John Wiley & Sons, New York 1994.
Chown, John F.: A History of Monetary Unions. Routledge, London 2003.
Clower, Robert W.: Theoretical Foundations of Monetary Policy. In: Monetary Theory and Monetary Policy in the 1970s. Oxford University Press, London 1971, 15-28.
Collins, Michael: Central Banking in History. Edward Edgar, Cheltenham 1993.
Cook, Robert M.: Speculation on the Origins of Coinage. Historia, 1958, 7, 257-62.
Cottrell, Allin: Post-Keynesian Monetary Economics. Cambridge Journal of Economics, 1994, 18(6), 587-605.
Cramp, A. B.: Two Views on Money. Lloyd’s Bank Review, 1962, July, 1-16.
Crick, W. F.: The Genesis of Bank Deposits. Economica, 1927, 20, 191-202.
Chrystal, Alec (ed): Monetarism. Edward Edgar, Cheltenham 1990.
Dahlberg, Arthur O.: When Capital Goes on Strike. How to Speed up Spending. Harper & Brothers, New York 1938.
Dahlberg, Arthur O.: Money in Motion. John de Graaf, New York 1962.
Dalton, George: Barter. Journal of Economic Issues, 1982, 16(1), 181-90.
Davenport, Herbert J.: Value and Distribution. A Critical and Constructive Study. University of Chicago Press, Chicago 1908.
Davenport, Herbert J.: Velocities, Turnovers and Prices. The American Economic Review, 20(1), 1930, 9-19.
Davidson, Paul: Money and the Real World. London, Macmillan 1972.
Davidson, Paul: Reforming the World’s Money. Journal of Post-Keynesian Economics, 1992/93, 15(2), 153-79.
Davidson, Paul and Kregel, Jan A. (eds): Full Employment and Price Stability in a Global Economy. Edward Edgar, Cheltenham 1999.
Davies, Glyn: A History of Money from Ancient Times to the Present Day. University of Wales Press. Cardiff 1994.
Davies, Glyn: Credit: 6,000 Years Old and Still Evolving Vigorously. Business Credit, 1996, June, 16-19.
Davies, Glyn and Davies, Roy: A Comparative Chronology of Money. Part 1: From the Origins of Agriculture to the Industrial Revolution, Journal of Management History, 1998, 4(3), 160-85.

265
Davies, Glyn and Davies, Roy: A Comparative Chronology of Money. Part 2: From the Industrial Revolution to the Present Day, Journal of Management History, 1998, 4(3), 186-232.
Day, Alan Charles Lynn: Outline of Monetary Economics. Oxford University Press, Oxford 1957.
Douglas, Clifford Hugh: The Monopoly of Credit. Chapman and Hall, London 1931.
Dunbar, Charles F.: Deposits and Currency. Quarterly Journal of Economics, 1887, 1, 401-18.
Dunbar, Charles F.: The Theory and History of Banking, Putman, New York 1891.
Edwards, James D.: Early Bookkeeping and its Development into Accounting. Business History Review, 1960, 34(4) 446-58.
Ficek, Karel K.: The Quantity Theory and the Wages Fund. The American Economic Review, 1934, 24(4), 631-34.
Financial Structure and the Monetary Policy Transmission Mechanism. Bank for international settlements, Basle 1995.
Fontana, Giuseppe: La théorie du credit d’Emile Mireaux: ‘Les miracles du credit’, Revue d’Économie Politique, 1997, 107(2), 285-94.
Forstater, Mathew: Tax-Driven Money: Additional Evidence From the History of Thought, Economic History, and Economic Policy. Working Paper. University of Missouri, Kansas City 2004.
Friedman, Benjamin M. and Hahn Frank H (eds): Handbook of Monetary Economics I – II.. Elsevier, Amsterdam 2000.
Friedman, Milton and Schwartz, Anna J.: A Monetary History of the United States, 1867– 1960. Princeton University Press, Princeton 1963
Friedman, Milton et al (eds): Milton Friedman's Monetary Framework: A Debate with his Critics. University of Chicago Press Journals, Chicago 1975.
Friedman, Milton: Price Theory. Aldine, Chicago 1976.
Friedman, Milton: Lessons from the 1979-82 Monetary Policy Experiment. The American Economic Review, 1984, 74(2), 397-400.
Fullarton, John: On the Regulation of Currencies. Kelley. New York 1844.
Galbraith, John K.: The Unfinished Business of the Century. London School of Economics, London 1999.
Ghosh, Atish R., Gulde, Anne-Maria and Wolf, Holger C.: Exchange Rate Regimes: Choices and Consequences. MIT Press, Cambridge 2003. .
Giovannini, Alberto: The Debate on Money in Europe. MIT Press, Cambridge 1996.
Goodhart, Charles.: Monetary Theory and Practice: The U.K. Experience. Macmillam, London 1984. .
Goodhart, Charles: The Conduct of Monetary Policy, The Economic Journal, 1989, 99(396), 293-346.
Goodhart, Charles: Has Moore Become too Horizontal? Journal of Post Keynesian Economics, 1989, 12(1), 29-34

266
Goodhart, Charles: The Two Concepts of Money: Implications for the Analysis of Optimal Currency Areas. European Journal of Political Economy, 1998, 14(3), 407-32.
Goodhart, Charles: Myths about the Lender of Last Resort. International Finance, 1999, 2(3), 339-60.
Goodhart, Charles: Can Central Banking Survive the IT Revolution? International Finance, 2000, 3(2), 189-209.
Graziani, Augusto: The Monetary Theory of Production. Cambridge University Press, Cambridge 2003.
Greco, Thomas H.: Money: Understanding and Creating Alternatives to Legal Tender. Chelsea Green, White River Junction 2001.
Gunnings, Patrick J.: Hayek, Free Banking, and the Commodity Money Syndrome: Toward A Praxeological Theory of Credit and Money. Feng Chia University, Taichung 1999.
Gwartney, James D., Stroup, Richard L. and Sobel, Russell, S. and McPherson, David: Economics: Private and Public Choice (10th edition). South-Western College Publishing, Mason 2003.
Hahn, Albert L.: Volkswirtschaftliche Theorie des Bankkredits. Mohr, Tübingen 1920.
Hahn, Albert L.: The Effects of Saving on Employment and Consumption. Journal of Marketing,1946, 11 (July), 35-43.
Hahn, Frank: Money and Inflation. The MIT Press, Cambridge 1985.
Hall, Margaret W.: Early Bankers in the Genoese Notarial Records, The Economic History Review. 1935, 6(1), 73-79.
Hamilton, Alexander: Report on a National Bank. 1790.
Hawtrey, Ralph G.: Good and Bad Trade. Constable, London 1913.
Hawtrey, Ralph G.: Currency and Credit. Longmans, London 1919.
Hawtrey, Ralph G.: The Tenth Annual Report of the Federal Reserve Board, The Economic Journal, 1924, 34(134), 283-86.
Hayek, Fridrich A.: Prices and Productions. London: Routledge & Kegan, 1931.
Hayek, Fridrich A.: Money and Capital: A Reply. The Economic Journal, 1932, 42(166), 237-49.
Hicks, John R.: Automatists, Hawtreyans, and Keynesians. Journal of Money, Credit and Banking, 1969, 1(3), 307-17.
Hicks, John R.: IS-LM: An Explanation. Journal of Post Keynesian Economics, 1980/81, 3(2), 139-54.
Hildreth, Richard: The History of Banks. Hilliard, Gray & Company, Boston 1837.
Howells, Peter. and Bain, Keith: The Economics of Money, Banking and Finance. A European Text (3rd edition). FT Prentice Hall, Harlow 2005.
Huang, Jing-Zhi and Huang, Ming: How Much of Corporate-Treasury Yield Spread Is Due to Credit Risk? In: 14th Annual Conference on Financial Economics and Accounting (FEA), Texas Finance Festival. 2003.

267
Humphrey, Thomas M.: The Theory of Multiple Expansion of Deposits. What it is and whence it Came. Economic Review (Federal Reserve Bank of Richmond), 1987, 73(2), 3-11.
Humphrey, Thomas M.: Rival Notions of Money. Economic Review (Federal Reserve Bank of Richmond), 1988, 74(5), 3-9.
Humphrey, Thomas M.: Price-Level Stabilization Rules in a Wicksellian Model of the Cumulative Process. Scandinavian Journal of Economics, 1992, 94(3), 509-518.
Innes, Mitchel A.: The Credit Theory of Money. The banking Law Journal, 1914, 31(Dec./Jan.), 151-68.
International Financial Reporting standards. IASB, London 2005.
Kaldor, Nicholas: The Scourge of Monetarism. Oxford University Press, Oxford 1982.
Kaldor, Nicholas: How Monetarism Failed. Challenge, 1985, 28(2), 4-13.
Keynes, John N.: The Scope and Method of Political Economy. University of Cambridge, Cambridge 1890.
Keynes, John, M.: The Prospects of Money, The Economic Journal, 1914, 24(96), 610-34.
Keynes, John M.: A Treatise on Money. Macmillan, London, 1930.
Keynes, John M.: A Monetary Theory of Production. Macmillan, London 1933.
Keynes, John M.: The General Theory of Employment, Interest and Money. Macmillan, London 1936.
Keynes, John M.: The General Theory of Employment. The Quarterly Journal of Economics, 1937, 51(2), 209-223.
King, Mervyn A.: The Inflation Target Five Years on. Bank of England Quarterly Bulletin, 1997, November, 434-42.
King, Mervyn A.: Changes in UK Monetary Policy: Rules and Discretion in Practise. Journal of Monetary Economics, 1997, 39(1), 81-97.
Knapp, Georg F.: The State Theory of Money. London, Macmillan 1905.
Kohn, Meir G.: Finance Before Industrial Revolution: An Introduction. Working Paper. Dartmouth College, Hanover 1999.
Kohn, Meir G.: Early Deposit Banking. Working Paper. Dartmouth College, Hanover 1999.
Kohn, Meir G.: Bills of Exchange and the Money Market to 1600. Working Paper. Dartmouth College, Hanover 1999.
Kohn, Meir G.: Merchant Banking in the Medieval and Early Modern Economy. Working Paper. Dartmouth College, Hanover 1999.
Kohn, Meir G.: Payments and the Development of Finance in Pre-Industrial Europe. Working Paper. Dartmouth College, Hanover 2001.
Laidler, David (ed): Foundations of Monetary Economics I – III. Edward Elgar, Cheltenham 1999.
Laughlin, Laurence J.: The Principles of Money. Scribner, New York 1903.
Laughlin, Laurence J.: The Quantity-Theory of Money. The Journal of Political Economy, 1924, 32 (3), 265-81.

268
Levin, Andrew T., Natalucci, Fabio M. and Piger, Jeremy M.: The Macroeconomic Effects of Inflation Targeting. Federal Reserve Bank of St. Louis Review, 86(4), 51-80.
Lavoie, Marc: The Endogenous Flow of Credit and the Post Keynesian Theory of Money. Journal of Economic Issues, 1984, 18(3), 771-97.
Lavoie, Marc: Credit and Money: The Dynamic Circuit, Overdraft Economics and Post Keynesian Economics. In: Jarsulic, Marc (ed): Money and Macro Policy. Kluwer-Nijhoff, Boston 1985.
Lavoie, Marc: Foundations of Post-Keynesian Economics. Aldershot, Edward Elgar 1992.
Lavoie, Marc: The Credit-led Supply of Deposits and the Demand for Money: Kaldor’s Reflux Mechanism as Previously Endorsed by Joan Robinson. Cambridge Journal of Economics, 1999, 23(1), 103-13.
Lavoie, Marc: On the Full Endogeneity of High-powered Money: Lessons from the Canadian Case. In: The Monetary Theory of Production. Benevento, University of Sannio 2003.
Leijonhufvud, Axel: Three Items for the Macroeconomic Agenda. Kyklos, 1998, 51(2), 197-218.
Lerner, Abba P.: Functional Finance and the Federal Debt. Social Research, 1943, 10(1), 38-51.
Lerner, Abba P.: Money as a Creature of the State. The American Economic Review, 1947, 37(2), 312-17.
Lewinsky, Jan S.: Money, Credit and Prices. P.S. King & Son, London 1929.
Macleod, Henry D.: The Theory and Practice of Banking I-II: Longman, Brown, Green and Longmans, London 1855-1856.
Macleod, Henry D.: Lecture on Credit and Banking. Longman, Green, Reader and Dyer. London 1882.
Macleod, Henry D: The Theory of Credit I-II. Longmans, Green, Reader, and Dyer. London 1893.
Maureen, Burton and Lombra, Raymond E.: The Financial System and the Economy. Principles of Money and Banking (4th edition). South-Western College Publishing, Cincinnati 2005.
Mayer, Thomas and Sheffrin, Steeven M. (ed): Fiscal and Monetary Policy. Edward Edgar, Cheltenham 1995.
Mehrling, Perry: Understanding Fischer Black. Columbia University, New York 2000.
Mehrling, Perry: Economists and the Fed: Beginnings. Journal of Economic Perspectives, 2002, 16(4), 207-18.
Michener, Ron: Money in the American Colonies. EH.Net Encyclopedia 2003.
Mill, John S.: Principles of Political Economy. J. W. Parker, London 1848.
Minsky, Hyman P.: Central Banking and Money Market Changes, The Quarterly Journal of Economics, 1957, 71(2), 171-87.
Minsky, Hyman P.: Private Sector Asset Management and the Effectiveness of Monetary Policy: Theory and Practice. Journal of Finance, 1969, 24(2), 223-38.

269
Minsky, Hyman P.: The Financial Instability Hypothesis: An Interpretation of Keynes and an Alternative to "Standard" Theory. Nebraska Journal of Economics and Business, 1977 16(1), 5-16.
Minsky, Hyman P.: Can “It” Happen Again? Essays on Instability and Finance. M.E. Sharpe, Armonk 1982.
Minsky, Hyman P.: Stabilizing an Unstable Economy. Yale University Press, New Haven 1986.
Minsky, Hyman P.: On the Non-Neutrality of Money. Quarterly Review (Federal Reserve Bank of New York), 1993, 18(1), 77-82.
Mises, Ludwig: Theorie des Geldes und der Umlaufmittel. Duncker & Humblot, München 1912.
Mises, Ludwig: Geldwertstabilisierung und Konjunkturpolitik. Fischer, Jena 1928.
Mishkin, Frederic S. and Eakins, Stanley G.: Financial Markets and Institutions (3rd edition). Addison-Wesley, Reading 2000.
Mishkin, Frederic S.: The economics of Money, Banking and Financial Markets (7th edition). Addison-Wesley, Boston 2004.
Mitchell, Innes, A.: What is Money? Banking Law Journal 1913, May, 377-408.
Mitchell, Innes, A.: The Credit Theory of Money. Banking Law Journal 1914, 31, 151-68.
Mizen, Paul (ed): Central Banking, Monetary History and Practice. Edward Edgar, Cheltenham 2003.
Moore, Basil J.: Wages, Bank Lending, and the Endogeneity of Credit Money. In: Jarsulic, Marc (ed): Money and Macro Policy. Kluwer-Nijhoff, Boston 1985.
Moore, Basil. J.: Contemporaneous Reserve Accounting: Can Reserve be Quality-Constrained? Journal of Post Keynesian Economics, 1984, 7(1), 103-113.
Moore, Basil J.: Horizontalists and Verticalists: The Macroeconomics of Credit Money. Cambridge University Press, Cambridge 1988.
Moore, Basil J.: Money Supply Endogeneity: "Reserve Price Setting" or "Reserve Quantity Setting"? Journal of Post Keynesian Economics, 1991, 13(3), 404-13.
Moore, Basil J.. Reconciliation of the Supply and Demand for Endogenous Money. Journal of Post Keynesian Economics, 1997, 19(3), 423-28.
Morgan, H. Wayne: The Origins and Establishment of the First Bank of the United States. Business History Review, 1956, 30(4), 472-92.
Munro, John H.: Monetary Policies, Guild Labour-Strife, and Compulsory Arbitration during the Decline of the Late-Medieval Flemish Cloth Industry, 1390 – 1435. Working Paper. University of Toronto, Toronto 1998.
Munro, John H.: Wage-Stickiness, Monetary Changes, and Real Incomes in Late-Medieval England and the Low Countries, 1300 - 1450: Did Money Really Matter? Working Paper. University of Toronto, Toronto 2000.
Munro, John H.: Postan, Population, and Prices in Late-Medieval England and Flanders. Working Paper. University of Toronto, Toronto 2002.

270
Munro, John H.: The Monetary Origins of the ‘Price Revolution’: South German Silver Mining, Merchant-Banking, and Venetian Commerce, 1470-1540'. Working Paper. University of Toronto, Toronto 2003.
Musella, Marco and Panico, Carlo (eds): The Money Supply in the Economic Process: A Post Keynesian Perspective. Edward Elgar, Aldershot 1995.
Nell, Edward J. and Semmler, Willi (eds): Nicholas Kaldor and Mainstream Economics: Confrontation or convergence?.St. Martin’s Press, New York 1991.
Nelson, Edward: The Great Inflation of the Seventies: What Really Happened? Working Paper. Federal Reserve Bank of St. Louis, St. Louis 2004.
Original pronouncements. Accounting Standards as of June 1, 2005. John Wiley & Sons, New York 2005
Papadimitriou, Dimitri B. and Wray, L. Randall: The Economic Contributions of Hyman Minsky: Varieties of Capitalism and Institutional Reform. Review of Political Economy, 1998, 10(2), 199-225.
Partnoy, Frank: A Revisionist View of Enron and the Sudden Death of 'May', Villanova Law Review, 2003, 48(4), 1245-1280.
Pollin, Robert: Two Theories of Money Supply Endogeneity: Some Empirical Evidence. Journal of Post Keynesian Economics, 1991, 13(3), 366-96. .
Rabin, Jack and Stevens, Glenn L. (eds): Handbook of Monetary Policy. Marcel Dekker, New York 2001.
Rasche, Robert H.: Demand Functions for Measures of U.S. Money and Debt. In: Proceedings of the Board of the Governors of the Federal Reserve System. 1990, 113-172.
Redlich, Fritz: Jacques Laffitte and the Beginnings of Investment Banking in France. Business History Review, 1948, 22(4-6), 137-60.
Redlich, Fritz: Banking in Mediaeval Bruges: A Review. Business History Review, 1949, 23(2), 109-12.
Redlich, Fritz and Christman, Webster M.: Early American Checks and an Example of their Use. Business History Review, 1967, 41(3), 285-302.
Redlich, Fritz: The Role of Private Banks in the Early Economy of the United States. Business History Review, 1977, 51(1), 90-93.
Romer, Christina D. and Romer, David H. (eds): Reducing Inflation. University of Chicago Press, Chicago 1997.
Richards, R. D.: The Evolution of Paper Money in England. The Quarterly Journal of Economics, 1927, 41(3), 361-404.
Robertson, Dennis H.: Money. Cambridge University Press, Cambridge 1922.
Robertson, Dennis H.: Banking Policy and the Price Level. P.S. King & Son, London 1926.
Robertson, Dennis H.: Theories of Banking Policy. Economica, 1928, 23, 131-46.
Rochon, Louis-Philippe.: The Creation and Circulation of Endogenous Money: A Circuit Dynamic Approach. Journal of Economic Issues, 1999, 33(1), 1-21.
Rogoff, Kenneth: Deflation: Determinants, Risks, and Policy Options — Findings of an Interdepartmental Task Force. IMF, Washington 2003.

271
Roover, Raymond de: Money, Banking, and Credit in Medieval Bruges. The Journal of Economic History, 1942, 2(Supplement), 52-65.
Roover, Raymond de: The Lingering Influence of Medieval Practices. The Accounting Review, 1943, 18(2), 148-51.
Roover, Raymond de: The Medici Bank Financial and Commercial Operations. The Journal of Economic History, 1946, 6(2), 153-72.
Roover, Raymond de: The Scholastics, Usury, and Foreign Exchange. Business History Review, 1967, 41, 257-71.
Rousseas, Stephen: Post Keynesian Monetary Economics. M.E. Sharpe, Armonk 1986.
Schaling, Eric: Institutions and Monetary Policy. Edward Edgar, Cheltenham 1995.
Schumpeter, Joseph A.: Theorie der wirtschaftlichen Entwicklung. Duncker & Humblot, Leipzig 1912.
Schumpeter, Joseph A.: The Explanation of the Business Cycle. Economica, 1927, 21, 286-311.
Schumpeter, Joseph A.: There is Still Time to Stop Inflation. Nation's Business, 1948, 36, 33-35, 88-91.
Schumpeter, Joseph A.: History of Economic Analysis. George Allen & Unwin, London 1954.
Schumpeter, Joseph A.: Das Wesen des Geldes. Vandenhoeck & Ruprecht, Göttingen 1970.
Sechrest, Larry J.: Free Banking: Theory, History, and Laissez-faire Model. Quarum Books, Westport 1993.
Shilling, A. Gary: Deflation. McGraw-Hill, New York 1999.
Skaggs, Neil T.: Henry Dunning Macleod and the Credit Theory of Money. In: Cohen Avi J., Hagemann Harald, and Smithin John (eds): Money, Financial Institutions and Macroeconomics. Recent economic thought series. Kluwer Academic Publishers, Boston 1997.
Skaggs, Neil T.: Debt as the Basis of Currency: the Monetary Economics of Trust - Special Invited Issue: Money, Trust, Speculation and Social Justice - Part 2: Trust and Money. The American Journal of Economics and Sociology, 1998, 57(4), 453-68.
Skaggs, Neil T.: Changing Views: Twentieth-Century Opinion on the Banking School-Currency School Controversy, History of Political Economy 1999, 31(2), 361-92.
Smith, Adam: An Inquiry into the Nature and Causes of the Wealth of Nations. 1776.
Smithin, John N.: Controversies in Monetary Economics. Edward Elgar, Cheltenham 2003.
Staiger, Douglas, Stock, James H., and Watson, Mark W.: The NAIRU, Unemployment and Monetary Policy. Journal of Economic Perspectives, 1997, 11(1), 33-49.
Steuart, James: An Enquiry into the Principles of Political Oeconomy. 1767.
Stiglitz, Joseph E.: Money, Credit, and Business Fluctuations. The Economic Record, 1988, 64(187), 307-22.
Strong, Benjamin: Federal Reserve Control of Credit. Quarterly Review (Federal Reserve Bank of New York), 1989, 75th Anniversary issue, 6-14.
Syed, Ahmad: Is Money Net Wealth? Oxford Economic Papers, 1970, 22(3), 357-61.

272
Taylor, W. G. Langworthy: The Source of Financial Power. The Journal of Political Economy, 1905, 13(3), 368-88.
Taylor, W. G. Langworthy: The Credit System. Macmillan, New York 1913.
Teichova, Alice, Hentenryk, Ginette, K.and Ziegler, Dieter (eds): Banking, Trade and Industry: Europe, America and Asia from the Thirteenth to the Twentieth Century. Cambridge University Press, Cambridge 1997.
Thornton, Henry: An Enquiry into the Nature and Effects of the Paper Credit of Great Britain, J. Hatchard, London 1802.
Tobin, James: Commercial Banks as Creators of Money. In: Carson, Deanne (ed): Banking and Monetary Studies. Richard D. Irwin, Homewood 1963.
Tooke, Thomas: An Inquiry into the Currency Principle. Longman, Brown, Green, and Longmans, London 1844.
Transmission Mechanism of Monetary Policy. Bank of England, London 1999.
Usher, Abbott P.. The Origins of Banking: The Primitive Bank of Deposit, 1200-1600. The Economic History Review, 1934, 4 (4), 399-428.
Vatter, Harold G and Walker, John F. (eds): History of the U.S. Economy since World War II. M.E. Sharpe, Armonk 1996.
Wagner, Helmut (ed): Current Issues in Monetary Economics. Physica-Verlag, Heidelberg 1998
Walsh, Carl E.: Monetary Theory and Policy (2nd edition). MIT Press, Cambridge 2003.
Warburg, Paul M.: Central Bank of the United States. American Economic Association Quarterly, 1909, 10 (1), 338-58.
Wee, Herman van der: International Business Finance and Monetary Policy in Western Europe, 1384- 1410. Business History Review, 1969, 43, 372-80.
Wee, Herman van der: Structural Changes and Specialization in the Industry of the Southern Netherlands, 1100-1600. The Economic History Review, 1975, 28(2), 203-21.
Weintraub, Sidney: Keynes, Keynesians, and Monetarists. University of Pennsylvania Press, Philadelphia 1978.
Wheelock, David C.: Monetary Policy in the Great Depression and Beyond: The Sources of the Fed's Inflation Bias. Working Paper. Federal Reserve Bank of St. Louis, St. Louis 1997.
White, Horace: Money and Banking. Ginn, Boston 1896.
White, Lawrence H.: The Theory of Monetary Institutions. Blackwell, Oxford 1999.
Whitesell, William: Tunnels and Reserves in Monetary Policy Implementation. Working Paper. Board of Governors of the Federal Reserve System, Washington 2003.
Wicksell, Knut: Interest and Prices. Kelley, New York 1898.
Wicksell, Knut: Lectures on Political Economy. Vol. 1. General Theory. Routledge & Kegan Paul, London 1901.
Wicksell, Knut: Lectures on Political Economy. Vol. 2. Money. Routledge & Kegan Paul, London 1906.

273
Wicksell, Knut: The Influence of the Rate of Interest on Prices. Economic Journal, 1907, 17(66), 213-20.
Wicksell, Knut: Stabilizing the Value of Money. A Means of Preventing Crises. In: Wicksell, Knut: Selected Essays in Economics. Routledge, London 1908.
Willis, Henry P.: The Theory and Practice of Central Banking. Harper & Brother, New York 1936.
Wilson, James: Capital, Currency and Banking. The Economist, London 1847.
Withers, Hartley: The Meaning of Money. Smith and Elder, London 1909.
Withers, Hartley: Money. Benn, London 1927.
Wojnilower, Albert M.: The Central Role of Credit Crunches in Recent Financial History. Brookings Papers on Economic Activity, 1980, 2, 277-339.
Woodford, Michael: Monetary Policy in a World Without Money. Working Paper. National Bureau of Economic Research, New York 2000.
Woodford, Michael: Interest and Prices: Foundations of a Theory of Monetary Policy. Princeton University Press, Princeton 2003.
Woodford, Michael: Central Bank Communications and Policy Effectiveness. Paper. Columbia University, New York 2005.
Wray, L. Randall: Money and Credit in Capitalist Economies: the Endogenous Money Approach. Edward Elgar, Northampton 1990.
Wray, L. Randall: Commercial Banks, the Central Bank, and Endogenous Money. Journal of Post Keynesian Economics, 1992, 14(3), 297-310
Wray, L. Randall: Keynesian Monetary Theory: Liquidity Preference or black box horizontalism? Journal of Economic Issues, 1995, 29(1), 273-82.
Wray, L. Randall: Understanding Modern Money: The Key to Full Employment and Price Stability. Edward Elgar, Cheltenham 1998.
Wray, L. Randall: Seigniorage of Sovereignty?. In: Rochon, Louis-Philippe and Rossi, Sergio (eds): Modern Theories of Money: The Nature and Role of Money in Capitalist Economies. Edward Edgar, Cheltenham 2003.