Monetary valuation methods in urban ecosystem … · Source: adapted from Gómez-Baggethun and...
24
Presentation at London Group meeting, “Methodology of SEEA CF and the Ecosystem Accounts”, 17- 20 October 2017, Costa Rica. Monetary valuation methods in urban ecosystem accounting - examples of their relevance for municipal policy and planning in the Oslo metropolitan area David N. Barton, Norwegian Institute for Nature Reesarch (NINA) [email protected] Contributing authors: Kristine Grimsrud and Mads Greaker, Axel Heyman, Xianwen Chen, Per Arild Garnåsjordet, Iulie Aslaksen Keywords: policy applications SEEA EEA, valuation techniques beyond the SNA; parallel accounts; The SEEA Experimental Ecosystem Accounting Technical Recommendations discuss a number of potential uses and applications of ecosystem accounting information. Using Oslo municipality as an example we discuss what types of monetary valuation methods could provide decision-support to different municipal planning and policy needs. We discuss the SNA accounting compatibility of hedonic property pricing, restoration costs, replacement cost, travel cost valuation and stated preference techniques, using the guidance criteria provided by the SEEA EEA Technical Recommendations. We find that the SEEA EEA TR guidance on monetary valuation is restrictive in terms of what information is considered SNA compatible. Our benchmark for this comparison is an assessment is what economic information municipalities or regional governments might find relevant for planning. We find that the SNA production boundary excluding household allocation of time is a serious limitation to valuing cultural ecosystem services, particularly in urban ecosystems. We also find that SEEA TR offer few guidelines on how to use economic valuation information that does not conform to SNA standards. This is in contrast to extensive recommendations on how to use biophysical indicators of ecosystem condition, and parallel thematic environmental accounts, which also currently lie outside the SNA production boundary. Applying current SEEA EEA TR ‘to the letter’ regarding monetary valuation risks already available and useful information falling outside an ecosystem accounting system that – for exchange values and biophysical indicators - offers great possibilities for a systematic organization of municipal environmental management. We argue that further work is needed on parallel thematic accounts. Providing a suite of ecological, accounting, welfare and socio-cultural indicators that are sought after by local governments in planning, will in time strengthen ‘grassroots’ support for ecosystem accounting at national level. Acknowledgements Special thanks to Lars Hein, Carl Obst and Henrik Lindhjem for discussions about accounting compatible valuation methods. Thanks also to colleagues of the URBAN EEA project - Experimental Ecosystem Accounting for Greater Oslo (URBAN EEA) for wider discussions on mapping ecosystem services that have informed this presentation.
Transcript of Monetary valuation methods in urban ecosystem … · Source: adapted from Gómez-Baggethun and...
Presentation at London Group meeting, “Methodology of SEEA CF and the Ecosystem Accounts”, 17-
20 October 2017, Costa Rica.
Monetary valuation methods in urban ecosystem accounting
- examples of their relevance for municipal policy and planning in the Oslo metropolitan area
David N. Barton, Norwegian Institute for Nature Reesarch (NINA)
Contributing authors: Kristine Grimsrud and Mads Greaker, Axel Heyman, Xianwen Chen, Per Arild
Garnåsjordet, Iulie Aslaksen
Keywords: policy applications SEEA EEA, valuation techniques beyond the SNA; parallel accounts;
The SEEA Experimental Ecosystem Accounting Technical Recommendations discuss a number of
potential uses and applications of ecosystem accounting information. Using Oslo municipality as an
example we discuss what types of monetary valuation methods could provide decision-support to
different municipal planning and policy needs. We discuss the SNA accounting compatibility of hedonic
property pricing, restoration costs, replacement cost, travel cost valuation and stated preference
techniques, using the guidance criteria provided by the SEEA EEA Technical Recommendations. We
find that the SEEA EEA TR guidance on monetary valuation is restrictive in terms of what information
is considered SNA compatible. Our benchmark for this comparison is an assessment is what economic
information municipalities or regional governments might find relevant for planning. We find that the
SNA production boundary excluding household allocation of time is a serious limitation to valuing
cultural ecosystem services, particularly in urban ecosystems. We also find that SEEA TR offer few
guidelines on how to use economic valuation information that does not conform to SNA standards.
This is in contrast to extensive recommendations on how to use biophysical indicators of ecosystem
condition, and parallel thematic environmental accounts, which also currently lie outside the SNA
production boundary. Applying current SEEA EEA TR ‘to the letter’ regarding monetary valuation risks
already available and useful information falling outside an ecosystem accounting system that – for
exchange values and biophysical indicators - offers great possibilities for a systematic organization of
municipal environmental management. We argue that further work is needed on parallel thematic
accounts. Providing a suite of ecological, accounting, welfare and socio-cultural indicators that are
sought after by local governments in planning, will in time strengthen ‘grassroots’ support for
ecosystem accounting at national level.
Acknowledgements
Special thanks to Lars Hein, Carl Obst and Henrik Lindhjem for discussions about accounting compatible
valuation methods. Thanks also to colleagues of the URBAN EEA project - Experimental Ecosystem
Accounting for Greater Oslo (URBAN EEA) for wider discussions on mapping ecosystem services that
have informed this presentation.
Contents 1. Introduction ..................................................................................................................................... 3
1.1 The decision support role of SEEA EEA .......................................................................................... 3
1.2 Purposes of monetary valuation in supporting municipal policy .................................................. 4
1.3 Accuracy requirements for financial and economic decision support .......................................... 6
1.4 Exchange value - valuation methods appropriate for ecosystem accounting .............................. 8
2. Examples – assessing the accounting compatibility of ecosystem service valuation methods in
Oslo 10
2.1 Hedonic pricing ............................................................................................................................ 10
2.2 Marginal values from demand functions .................................................................................... 12
2.3 Contingent valuation ................................................................................................................... 15
2.4 Restoration cost .......................................................................................................................... 16
3. Discussion ...................................................................................................................................... 17
3.1 On hedonic pricing, amenity values and double counting .......................................................... 17
3.2 On the exchange values of urban recreation .............................................................................. 17
3.3 On the relevance of monetary ecosystem accounting for municipal decision-making .............. 20
4. Conclusions .................................................................................................................................... 21
5. References ..................................................................................................................................... 23
1. Introduction In this paper we discuss the recommendations of the draft SEEA EEA Technical Recommendations on
the appropriate and inappropriate methods for valuation in monetary accounts. In the following we
refer to SEEA-EEA 2016 draft Technical Recommendations as SEEA-EEA TR. We discuss the
recommendation for valuation methods in light of the purpose of ecosystem accounting, and more
specifically the purpose of ecosystem accounting for municipal level policies for urban ecosystem
management. We use examples from valuation of urban ecosystem services in Oslo to illustrate the
discussion.
1.1 The decision support role of SEEA EEA What does SEEA EEA TR say about the purposes of ecosystem accounting for policy and decision
support? Some general observations regarding the purpose of ecosystem accounts which are relevant
for our further discussion include (recommendations from the SEEA-EEA TR are written in italics
throughout the text) (section 1.1):
[..] - at sub-national scales, the potential of ecosystem accounting can be demonstrated more easily
by linking directly to the development of responses to specific policy themes or issues. [..]
- the core monetary ecosystem accounts will not provide all of the information needed to support all decision making contexts. Nonetheless, the broad information set of the ecosystem accounts, in particular accounts in physical terms, will, at a minimum, provide coherent context for all decision-making situations. [..]
- the approach increases the potential for ecosystem accounting to provide information that is highly relevant in assessing site specific trade-offs and heightens the potential for the ecosystem accounting framework to assist in organizing a large amount of existing ecological data.
SEEA EEA TR also describes a number of specific policy and management uses of information from
different accounts:
Ecosystem accounts provide several important pieces of information in support of policy and decision
making relating to environment and natural resources management (section 1.1.4):
[..] - Detailed, spatial information on ecosystem services supply [..] - Monitoring of the status of ecosystem assets [..] - Highlighting the ecosystem assets, ecosystem types and ecosystem services of particular
concern for policy makers. [..] - Monitoring the status of biodiversity and indicating specific areas or aspects of biodiversity
under particular threat. [..] - Quick response to information needs. [..] - Monitoring the effectiveness of various policies.[..] - Use in economic and financial decision-making. i.a. [..] to extend standard economic modelling
approaches and to enhance broad indicators of economic performance such as national income, savings and productivity. While these measures and applications are different from the more common applications of ecosystem services valuations, the ability to consider ecosystems through multiple analytical lenses appears a strong motivation to continue development of valuations for accounting purposes. [..]

Notably, only one of the seven purposes of ecosystem accounting listed in the introduction to SEEA
EEA TR requires the use of monetary valuation. For economic and financial decision-support the
purpose is more specifically to “extend” standard economic modeling and “enhance” broad indicators,
as well as to “consider ecosystems through multiple analytical lenses”. The purpose of “monitoring”
of ecosystem asset, biodiversity status and policy effectiveness is prominent, but does not necessarily
require monetary valuation.
What is the decision support role of monetary accounts more specifically, including ecosystem service
use, supply and asset accounts? In section 7.2 on ecosystem monetary asset accounts, the purposes
are more specific. Of interest to our further discussion is to note differences in accuracy and reliability
that the different purposes of monetary accounting will require.
[..] Estimates of ecosystem assets in monetary terms are useful for making decisions about alternative
uses of ecosystem assets since they provide a consistent basis for comparison. In addition, estimates in
monetary terms can be integrated with valuations for other types of assets to provide more complete
assessments of net wealth. A decline in value of ecosystem assets at aggregated scales (e.g. in the EAA)
may point to unsustainable ecosystem use. [..]
1.2 Purposes of monetary valuation in supporting municipal policy Specification of the purpose of valuation can help determine the reliability and accuracy required of
valuation methods, helping to select methods compatible with the decision-support requirements.
Gómez-Baggethun and Barton (2013) and Schröter et al. (2014) discuss how different decision support
purposes have different accuracy and reliability requirements for valuation and accounting methods.
They argue that the decision-support purpose will determine which monetary valuation methods are
suitable because of differences in their accuracy and reliability. Several broad policy support needs at
municipal level are suggested in Figure 11.
Using this framework we can consider the different purposes of monetary accounts cited above in
section 1.1. Requiring monetary accounts to identify a “decline in value of ecosystem assets at
aggregated scales” is the least demanding of these monetary purposes as it only requires that a
significant trend be observed. Comparing “alternative uses of ecosystem assets”, suggests screening
or ranking of alternatives in terms of value. This is a purpose familiar to benefit-cost analysis, and is
demanding in terms of accuracy of monetary values as net benefits of alternatives must be compared.
Finally, a “more complete assessment of net wealth” suggests an awareness-raising purpose in
demonstrating ecosystems’ economic contribution to overall societal well-being. It carries the implicit
expectation that valuation methods quantify significant asset value of ecosystems. ‘Significance’ of
values might be the result of a comparison with the value of assets that currently fall within the
production boundary of SNA.
When discussing monetary valuation methods from Oslo below in light of SEEA EEA TR requirements,
we will also try to keep these policy support purposes in mind. Do SEEA EEA TR requirements for SNA
compatibility further or hamper the purposes shown in Figure 1? Furthermore, do the accounting
compatibility requirements maintain a reasonable balance between (i) consistency with SNA, (ii) costs
of obtaining the information, and (iii) providing information value for decisions. Providing information
value for decisions concerns obtaining sufficient accuracy and reliability for the purpose at hand.
1 based on experiences from collaborating with Oslo Municipiality in the OpenNESS project http://www.nina.no/OpenNESS and URBAN EEA Project.

Figure 1. The aim of urban ecosystem accounting is to provide decision-support for municipal
policy needs.
The choice of ecosystem service mapping, modeling and valuation methods for accounting
depends on the specific decision-support purpose, spatial scale, and resolution of accounting
information. Information costs of valuation methods increase from left to right as we move across
ever more demanding decision-contexts in municipal planning on the horizontal axis. Information
costs, also increase with spatial scale and resolution required for a specific municipal policy
purposes (Gómez-Baggethun and Barton, 2013). Policy purposes on the far right of the horizontal
axis typically require much greater spatial resolution than on the left.
Source: adapted from Gómez-Baggethun and Barton (2013)

1.3 Accuracy requirements for financial and economic decision support
The kinds of accuracy that may be expected of monetary valuation methods can be further illustrated
for some broad types of financial and economic decisions (Barton, 2016). Figure 2 provides some
examples of generic purposes of economic valuation discussed by Gómez-Baggethun and Barton
(2013). A number of the municipall policy support purposes shown in Figure 1 also have an economic
rationale which is reflected in the generic categories of Figure 2.
In the following we briefly explain Figure 2. Monetary valuation for awareness raising is the least
demanding policy support purpose. There is an expectation that a method can distringuish between
orders of magnitude in monetary values. In our experience, valuation that only shows “millions” for
ecosystem services at aggregate municipal level do not have ‘a big numbers effect’. What constitutes
an ‘awareness-raising number’ depends on expectations and points of comparison. Millions are “big
numbers” relative to site specific studies, while “billions” operate at the same magnitude as for
example municipal budgets. The purpose of accounting is monitoring changes in the monetary value
of assets. Monetary valuation needs to have sufficient accuracy to identify signficant trends between
accounting periods in the value of assets. In priority-setting there are several distinctions to be made.
A familiar distinction in benefit-cost analysis is between screening –taking action based on confidence
about benefits being greater than costs —and ranking— identifying with confidence the decision
alternative with the highest net benefits. Ranking requires greater accuracy than screening. In
assessing feasibility of economic instruments such as water pricing or payments for ecosystem
services, we expect valuation methods to be sufficiently accurate to set prices that cover full economic
costs. If the purpose is to assess incentive compatibility, valuation of ecosystem services must be able
Figure 2 Accuracy required of ecosystem service valuation depends on decision context.
Chevrons depict generic decision support purposes of monetary valuation methods. Yellow bars
depict confidence intervals. Source: adapted from Barton (2016)
to determine whether benefits are higher than opportunity costs, but lower than willingness-to-pay
(with some level of confidence). This purpose is at least as, or more, demanding than ranking for
benefit cost analysis. Finally, in a legal setting economic liability for interim damages (before ecosystem
services recover) would seem to place the highest standards on the accuracy of monetary valuation.
We assume here that reliability and accuracy of monetary valuation results must stand up to a high
level of scrutiny in court by a jury. The extent to which punitive fines —negative incentives— are
considered, complicates this picture.
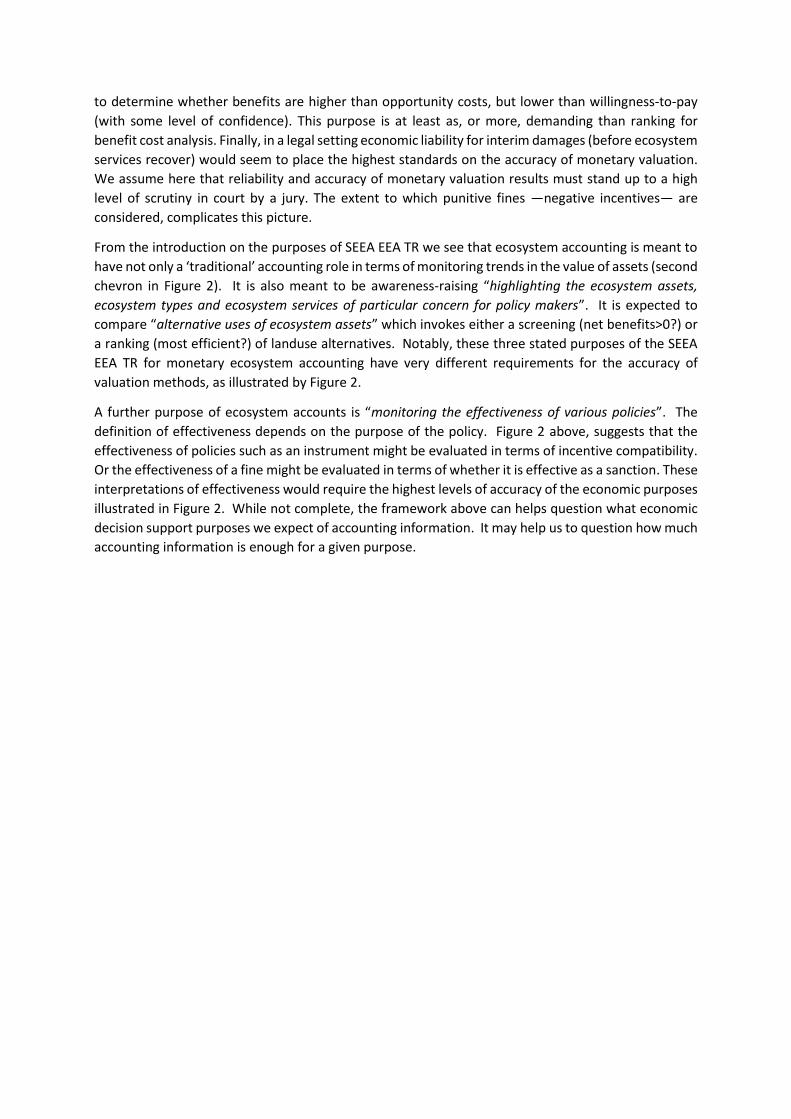
From the introduction on the purposes of SEEA EEA TR we see that ecosystem accounting is meant to
have not only a ‘traditional’ accounting role in terms of monitoring trends in the value of assets (second
chevron in Figure 2). It is also meant to be awareness-raising “highlighting the ecosystem assets,
ecosystem types and ecosystem services of particular concern for policy makers”. It is expected to
compare “alternative uses of ecosystem assets” which invokes either a screening (net benefits>0?) or
a ranking (most efficient?) of landuse alternatives. Notably, these three stated purposes of the SEEA
EEA TR for monetary ecosystem accounting have very different requirements for the accuracy of
valuation methods, as illustrated by Figure 2.
A further purpose of ecosystem accounts is “monitoring the effectiveness of various policies”. The
definition of effectiveness depends on the purpose of the policy. Figure 2 above, suggests that the
effectiveness of policies such as an instrument might be evaluated in terms of incentive compatibility.
Or the effectiveness of a fine might be evaluated in terms of whether it is effective as a sanction. These
interpretations of effectiveness would require the highest levels of accuracy of the economic purposes
illustrated in Figure 2. While not complete, the framework above can helps question what economic
decision support purposes we expect of accounting information. It may help us to question how much
accounting information is enough for a given purpose.
1.4 The significance of exchange value
Figure 2 also raises the question of the decision-support significance of the values identified using
methods that meet SNA-compatibility criteria. Are the values large enough to make a difference in
changing decisions in each of the purposes identified for SEEA EEA?
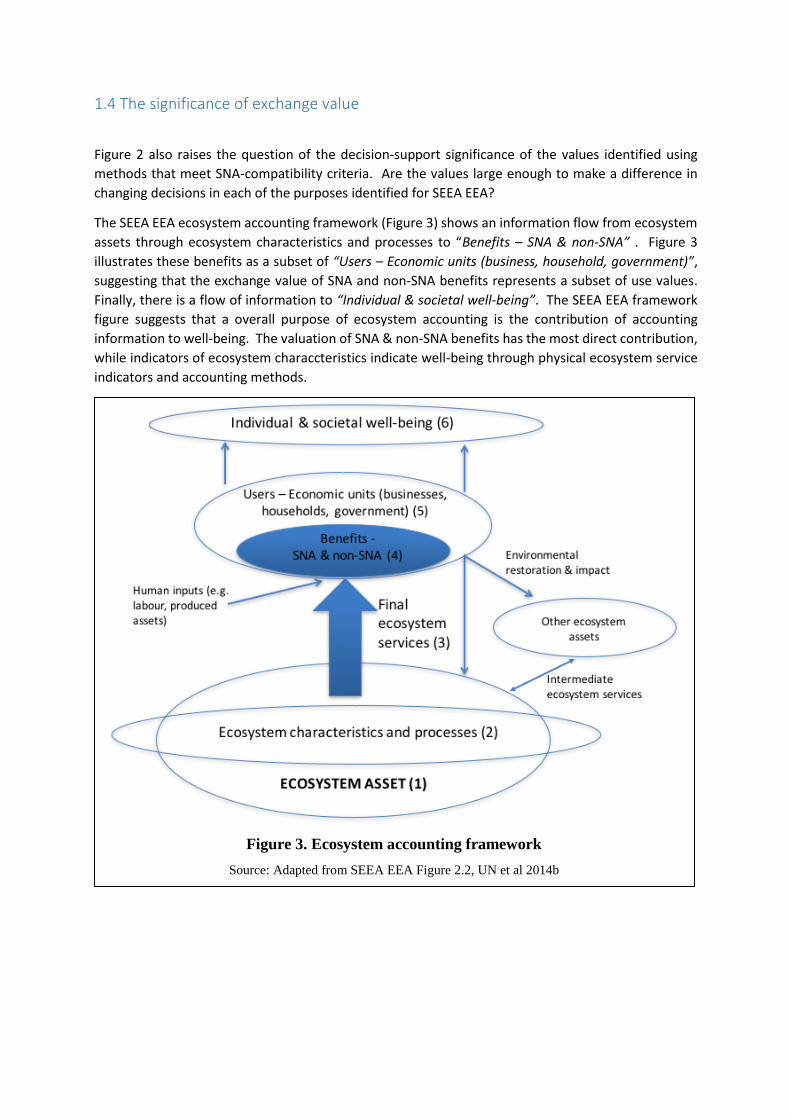
The SEEA EEA ecosystem accounting framework (Figure 3) shows an information flow from ecosystem
assets through ecosystem characteristics and processes to “Benefits – SNA & non-SNA” . Figure 3
illustrates these benefits as a subset of “Users – Economic units (business, household, government)”,
suggesting that the exchange value of SNA and non-SNA benefits represents a subset of use values.
Finally, there is a flow of information to “Individual & societal well-being”. The SEEA EEA framework
figure suggests that a overall purpose of ecosystem accounting is the contribution of accounting
information to well-being. The valuation of SNA & non-SNA benefits has the most direct contribution,
while indicators of ecosystem characcteristics indicate well-being through physical ecosystem service
indicators and accounting methods.
Figure 3. Ecosystem accounting framework
Source: Adapted from SEEA EEA Figure 2.2, UN et al 2014b
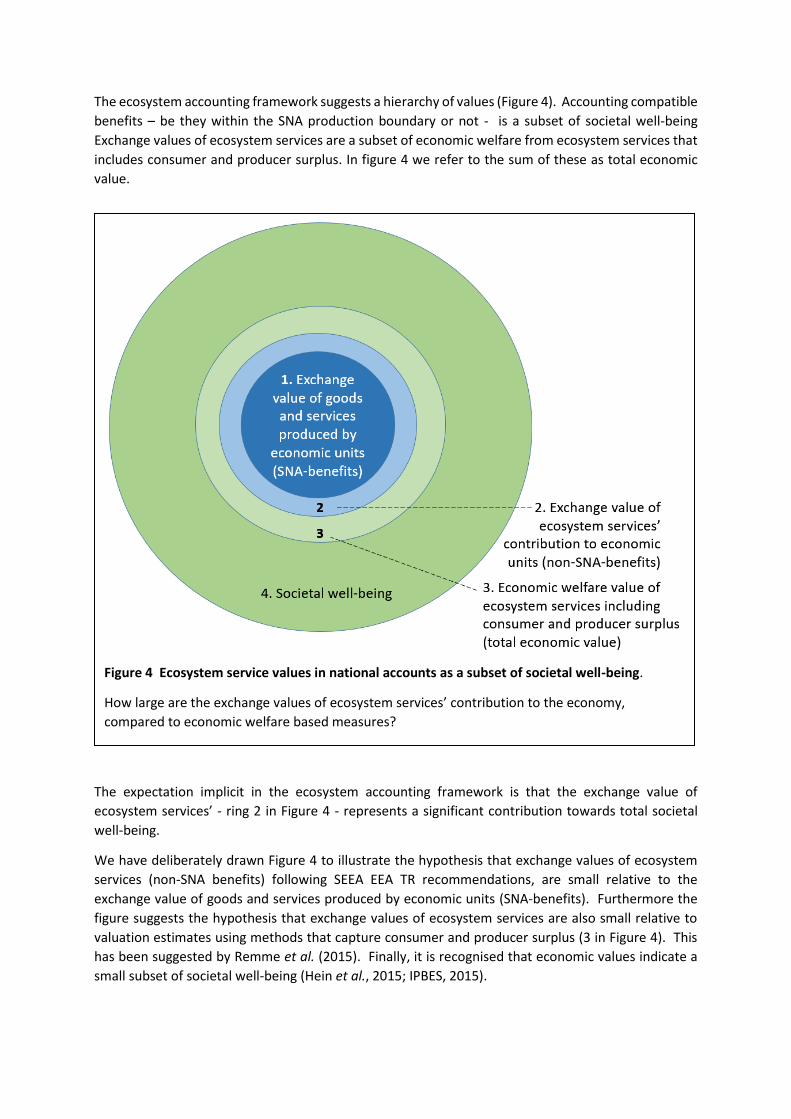
The ecosystem accounting framework suggests a hierarchy of values (Figure 4). Accounting compatible
benefits – be they within the SNA production boundary or not - is a subset of societal well-being
Exchange values of ecosystem services are a subset of economic welfare from ecosystem services that
includes consumer and producer surplus. In figure 4 we refer to the sum of these as total economic
value.
The expectation implicit in the ecosystem accounting framework is that the exchange value of
ecosystem services’ - ring 2 in Figure 4 - represents a significant contribution towards total societal
well-being.
We have deliberately drawn Figure 4 to illustrate the hypothesis that exchange values of ecosystem
services (non-SNA benefits) following SEEA EEA TR recommendations, are small relative to the
exchange value of goods and services produced by economic units (SNA-benefits). Furthermore the
figure suggests the hypothesis that exchange values of ecosystem services are also small relative to
valuation estimates using methods that capture consumer and producer surplus (3 in Figure 4). This
has been suggested by Remme et al. (2015). Finally, it is recognised that economic values indicate a
small subset of societal well-being (Hein et al., 2015; IPBES, 2015).
Figure 4 Ecosystem service values in national accounts as a subset of societal well-being.
How large are the exchange values of ecosystem services’ contribution to the economy,
compared to economic welfare based measures?
While, the hypotheses illustrated in Figure 4 may be contrived, they are not trivial. The current SEEA
EEA TR audience is national accountants, but SEEA EEA guidelines are already being scrutinized by
welfare economists and social scientists more generally. Initial reactions to the requirements for
accounting compatible valuation methods may fail to keep in mind that SEEA EEA TR is not claiming
that the resulting exchange values represent all, or even most of societal values relevant for making
policy decisions. This point has perhaps not been sufficiently communicated.
1.5 Valuation methods appropriate for ecosystem accounting What are the criteria in ecosystem accounting for choosing monetary valuation methods that are
compatible with the SNA? In the discussion on valuation methods (Chapter 7) three compatibility
criteria can be discerned from the discussion:
1. Stay within the production boundary. Some cost and benefit flows fall outside the current SNA production boundary, as well as the proposed extension to ecosystems of the SEEA EEA TR. Notably of interest for estimating values of local nature recreation, the valuation of household time as an input to production is valued, but not as an input to non-remunerated activities such as recreation.
2. Use exchange values. This is the value of the service at the point of interaction between the supplier (the ecosystem asset) and the user. Exchange values reflect ecosystems contribution to the economy. Valuation methods that capture exchange value should be chosen.
3. Avoid double counting. Valuation methods should be able to identify separable service streams in order to estimate the the present value of the future flow of income attributable to an asset.
Literature testing monetary valuation of ecosystem services for accounting (Hein et al., 2015; Remme
et al., 2015; Sumarga et al., 2015) also discusses a fourth criteria, which is implicit to the awareness
raising objectives of SEEA EEA TR discussed in the introduction. Ecosystem services are expected to
have significant or non-zero accounting values. The empirical studies observe that resource rent
methods often find zero or low rents for ecosystem contributions to open access uses, heavily
subsidies resource extraction and public utilities operating according to cost-recovery principles.
2. Examples – assessing the accounting compatibility of ecosystem
service valuation methods in Oslo
In the following valuation examples from Oslo, mainly drawn from the OpenNESS project2, we discuss
accounting compatibility criteria. Are the valuation estimates for urban ecosystem services
appropriate or inappropriate from an ecosystem accounting point of view, as defined by the SEEA EEA
TR? We also discuss the policy relevance of accounting inappropriate valuation methods that were
carried out and compare that to the policy relevance of accounting appropriate values.
2.1 Hedonic pricing Hedonic pricing decomposes the value of an asset into its attributes and prices each attribute using
regression analysis. In the housing market large samples are needed, using historical sales data from
across a housing market, often from a decade or more, including property structural characteristics.
GIS modelling determines proximity to ecosystem assets and their condition. Spatial econometric
2 http://www.nina.no/english/Research/Projects/OpenNESS
methods are used to identify the effect of ecosystem assets on property price, while controlling for
other structural and neighbourhood characteristcs. The method has been used to value access to green
space, air quality and noise. SEEA-EEA Tech 2016 deems the method appropriate in principle if
individual ecosystem services can be identified.
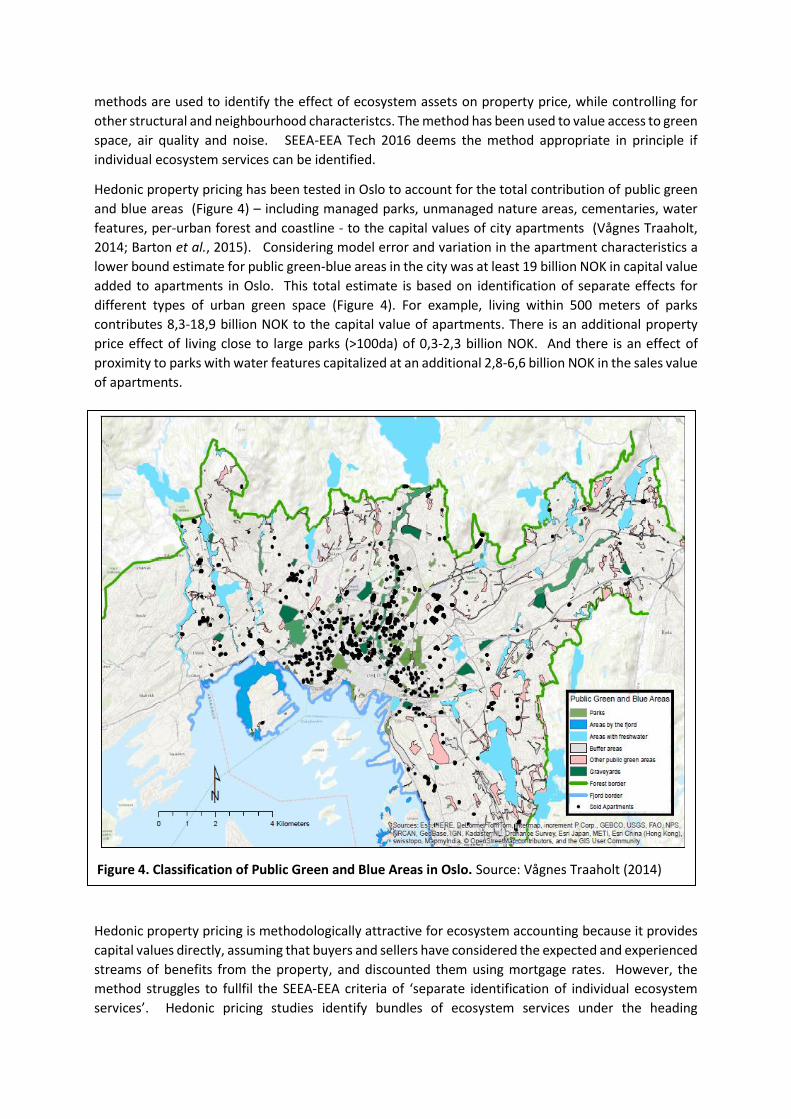
Hedonic property pricing has been tested in Oslo to account for the total contribution of public green
and blue areas (Figure 4) – including managed parks, unmanaged nature areas, cementaries, water
features, per-urban forest and coastline - to the capital values of city apartments (Vågnes Traaholt,
2014; Barton et al., 2015). Considering model error and variation in the apartment characteristics a
lower bound estimate for public green-blue areas in the city was at least 19 billion NOK in capital value
added to apartments in Oslo. This total estimate is based on identification of separate effects for
different types of urban green space (Figure 4). For example, living within 500 meters of parks
contributes 8,3-18,9 billion NOK to the capital value of apartments. There is an additional property
price effect of living close to large parks (>100da) of 0,3-2,3 billion NOK. And there is an effect of
proximity to parks with water features capitalized at an additional 2,8-6,6 billion NOK in the sales value
of apartments.
Hedonic property pricing is methodologically attractive for ecosystem accounting because it provides
capital values directly, assuming that buyers and sellers have considered the expected and experienced
streams of benefits from the property, and discounted them using mortgage rates. However, the
method struggles to fullfil the SEEA-EEA criteria of ‘separate identification of individual ecosystem
services’. Hedonic pricing studies identify bundles of ecosystem services under the heading
Figure 4. Classification of Public Green and Blue Areas in Oslo. Source: Vågnes Traaholt (2014)

‘amenities’ (Czembrowski and Kronenberg, 2016). Even if agents in the housing market were able to
sum expected benefits from different uses of green spaces, there is an identification problem.
Identifying the separate effects of different types of green areas is already challenging due to spatial
autocollinearity issues. Estimation problems may become intractable when green spaces are afurther
classified / diaggregated according to individual ecosystem services. Some headway can be made by
identifying attributes of green spaces that are functional types, i.e. associated with specific uses. An
example was given in the Oslo case, where large parks with water features attributed more capital
value to apartments in their proximity, than t parks without these characteristics. Large parks with
water are associated with a greater diversity of recreational activities in Oslo (Soy Massoni et al., in
press).
Follow-up hedonic pricing studies conducted within the URBAN EEA project (Heyman et al., 2017) have
shown that hedonic amenity values from ecosystems are highly sensitive to model specification. In
particular, specification of green space variables in terms of proximity or percentage coverage;
modelling of linear versus network walking distance proximity; and inclusion of variables representing
cultural and commercial services associated with green spaces, can have significant effects on
estimates of urban ecosystems contribution to property prices. Testing of robust model specifications
is on-going.
2.2 Marginal values from demand functions Marginal values from demand functions are estimated by utilising an appropriate demand function
and setting the price at a point on that function intersecting with (i) observed behaviour to reflect
supply (e.g. visits to parks) or (ii) modelling a supply function. The method can use demand functions
estimated by travel cost or stated preference methods. These are methods that are otherwise
considered inappropriate for direct valuation as they use the demand function to estimate consumer
surplus. We note that the SEEA-EEA Tech 2016 considers these methods potentially technically
challenging – they involve computing both a demand function and a supply function and inferring a
hypothetical exchange value. The demand function of the travel cost method may be estimated using
different rates of visitation as a function of travel expenses.
We should note that in the SEEA EEA TR, the opportunity cost of the travel time used by the household
is considered outside the scope of the production boundary used for accounting purposes.
Furthermore, we note that ‘by convention, the measurement scope of non-SNA benefits for ecosystem
accounting purposes is limited to the flow of ecosystem services with a direct link to human well-being’
(SEEA-EEA Tech 2016). We also note that ‘the SNA production boundary currently includes goods and
services produced through illegal activity and subsistence production, i.e. these products form a part of
the set of SNA benefits.’
Below, we discuss the valuation of household recreation time in green space in and around Oslo and
question the accounting boundary of ecosystem accounts.
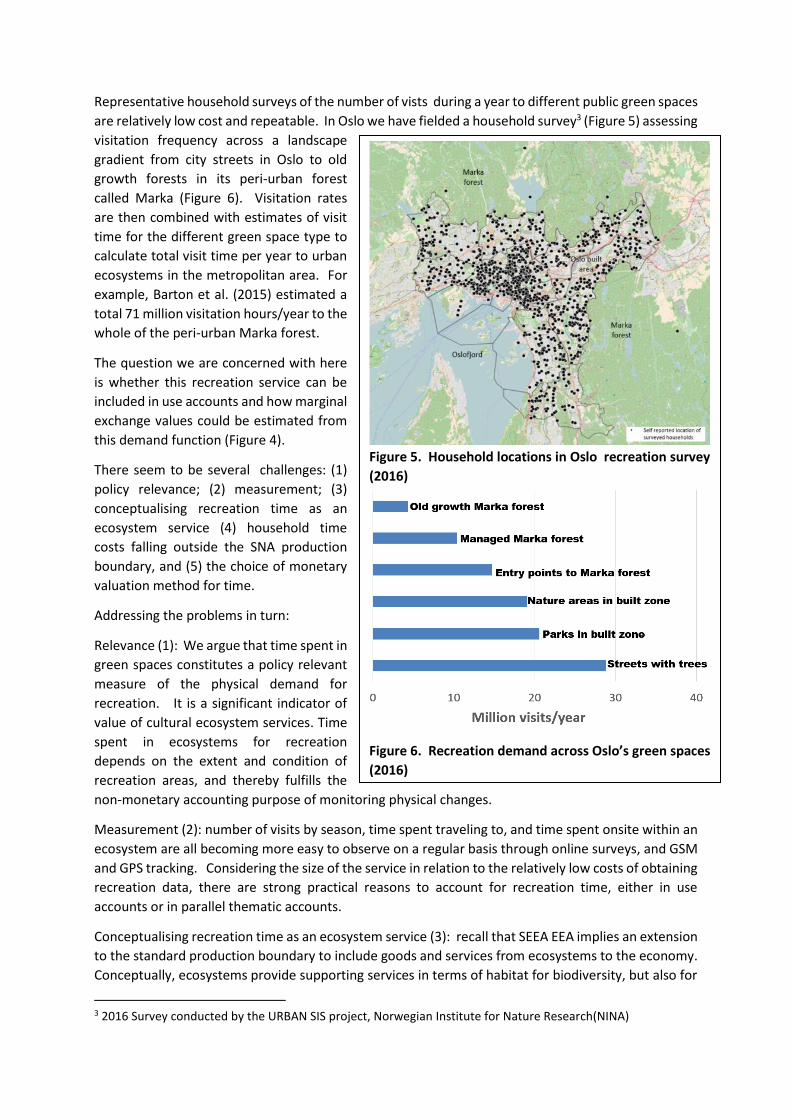
Representative household surveys of the number of vists during a year to different public green spaces
are relatively low cost and repeatable. In Oslo we have fielded a household survey3 (Figure 5) assessing
visitation frequency across a landscape
gradient from city streets in Oslo to old
growth forests in its peri-urban forest
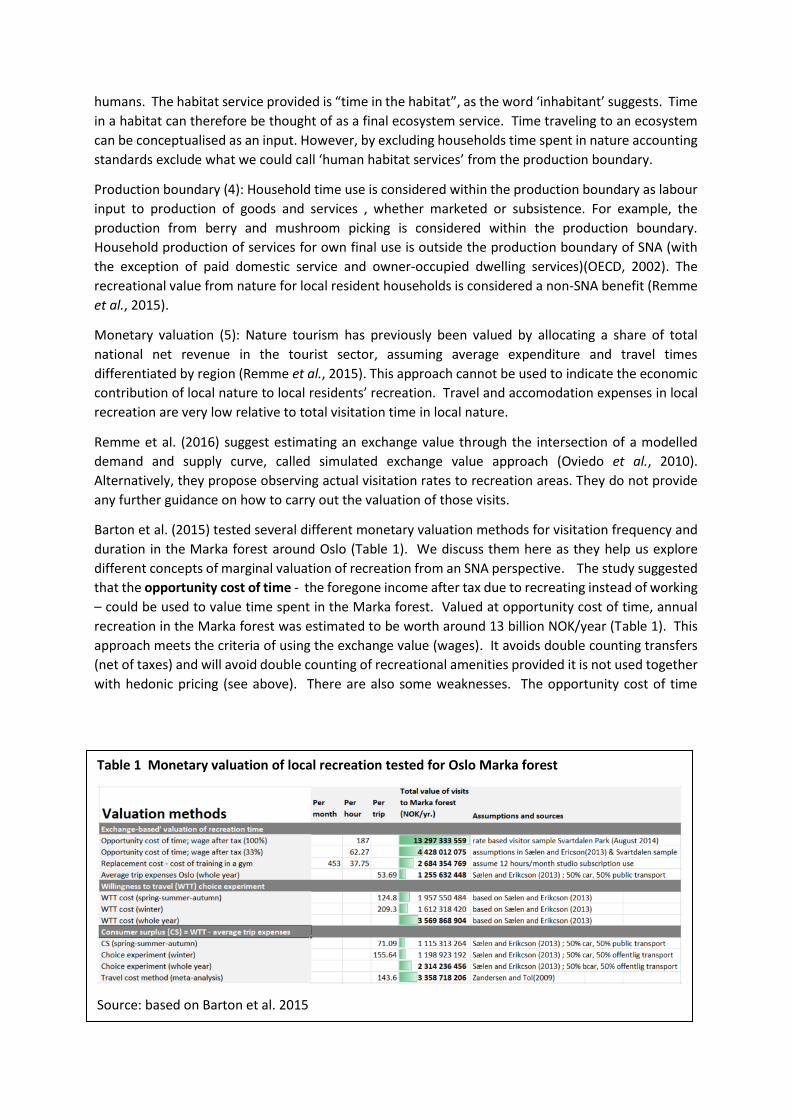
called Marka (Figure 6). Visitation rates
are then combined with estimates of visit
time for the different green space type to
calculate total visit time per year to urban
ecosystems in the metropolitan area. For
example, Barton et al. (2015) estimated a
total 71 million visitation hours/year to the
whole of the peri-urban Marka forest.
The question we are concerned with here
is whether this recreation service can be
included in use accounts and how marginal
exchange values could be estimated from
this demand function (Figure 4).
There seem to be several challenges: (1)
policy relevance; (2) measurement; (3)
conceptualising recreation time as an
ecosystem service (4) household time
costs falling outside the SNA production
boundary, and (5) the choice of monetary
valuation method for time.
Addressing the problems in turn:
Relevance (1): We argue that time spent in
green spaces constitutes a policy relevant
measure of the physical demand for
recreation. It is a significant indicator of
value of cultural ecosystem services. Time
spent in ecosystems for recreation
depends on the extent and condition of
recreation areas, and thereby fulfills the
non-monetary accounting purpose of monitoring physical changes.
Measurement (2): number of visits by season, time spent traveling to, and time spent onsite within an
ecosystem are all becoming more easy to observe on a regular basis through online surveys, and GSM
and GPS tracking. Considering the size of the service in relation to the relatively low costs of obtaining
recreation data, there are strong practical reasons to account for recreation time, either in use
accounts or in parallel thematic accounts.
Conceptualising recreation time as an ecosystem service (3): recall that SEEA EEA implies an extension
to the standard production boundary to include goods and services from ecosystems to the economy.
Conceptually, ecosystems provide supporting services in terms of habitat for biodiversity, but also for
3 2016 Survey conducted by the URBAN SIS project, Norwegian Institute for Nature Research(NINA)
Figure 5. Household locations in Oslo recreation survey
(2016)
Figure 6. Recreation demand across Oslo’s green spaces
(2016)
humans. The habitat service provided is “time in the habitat”, as the word ‘inhabitant’ suggests. Time
in a habitat can therefore be thought of as a final ecosystem service. Time traveling to an ecosystem
can be conceptualised as an input. However, by excluding households time spent in nature accounting
standards exclude what we could call ‘human habitat services’ from the production boundary.
Production boundary (4): Household time use is considered within the production boundary as labour
input to production of goods and services , whether marketed or subsistence. For example, the
production from berry and mushroom picking is considered within the production boundary.
Household production of services for own final use is outside the production boundary of SNA (with
the exception of paid domestic service and owner-occupied dwelling services)(OECD, 2002). The
recreational value from nature for local resident households is considered a non-SNA benefit (Remme
et al., 2015).
Monetary valuation (5): Nature tourism has previously been valued by allocating a share of total
national net revenue in the tourist sector, assuming average expenditure and travel times
differentiated by region (Remme et al., 2015). This approach cannot be used to indicate the economic
contribution of local nature to local residents’ recreation. Travel and accomodation expenses in local
recreation are very low relative to total visitation time in local nature.
Remme et al. (2016) suggest estimating an exchange value through the intersection of a modelled
demand and supply curve, called simulated exchange value approach (Oviedo et al., 2010).
Alternatively, they propose observing actual visitation rates to recreation areas. They do not provide
any further guidance on how to carry out the valuation of those visits.
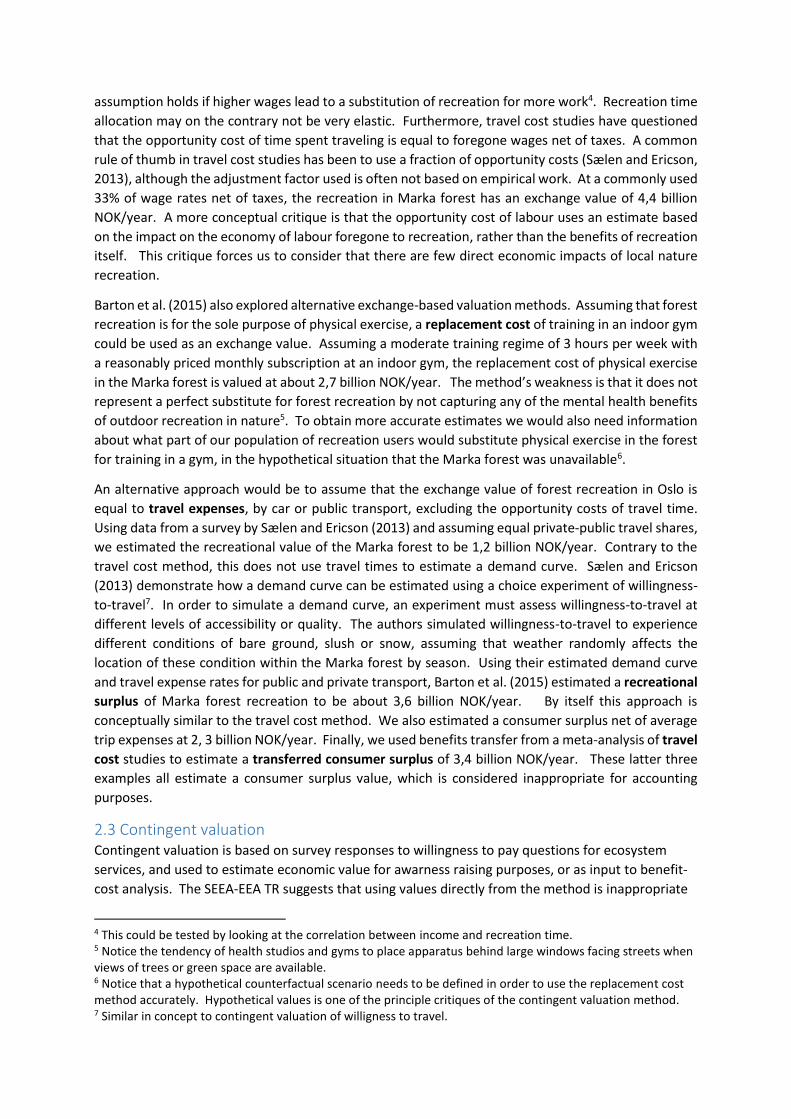
Barton et al. (2015) tested several different monetary valuation methods for visitation frequency and
duration in the Marka forest around Oslo (Table 1). We discuss them here as they help us explore
different concepts of marginal valuation of recreation from an SNA perspective. The study suggested
that the opportunity cost of time - the foregone income after tax due to recreating instead of working
– could be used to value time spent in the Marka forest. Valued at opportunity cost of time, annual
recreation in the Marka forest was estimated to be worth around 13 billion NOK/year (Table 1). This
approach meets the criteria of using the exchange value (wages). It avoids double counting transfers
(net of taxes) and will avoid double counting of recreational amenities provided it is not used together
with hedonic pricing (see above). There are also some weaknesses. The opportunity cost of time
Table 1 Monetary valuation of local recreation tested for Oslo Marka forest
Source: based on Barton et al. 2015
Source
assumption holds if higher wages lead to a substitution of recreation for more work4. Recreation time
allocation may on the contrary not be very elastic. Furthermore, travel cost studies have questioned
that the opportunity cost of time spent traveling is equal to foregone wages net of taxes. A common
rule of thumb in travel cost studies has been to use a fraction of opportunity costs (Sælen and Ericson,
2013), although the adjustment factor used is often not based on empirical work. At a commonly used
33% of wage rates net of taxes, the recreation in Marka forest has an exchange value of 4,4 billion
NOK/year. A more conceptual critique is that the opportunity cost of labour uses an estimate based
on the impact on the economy of labour foregone to recreation, rather than the benefits of recreation
itself. This critique forces us to consider that there are few direct economic impacts of local nature
recreation.
Barton et al. (2015) also explored alternative exchange-based valuation methods. Assuming that forest
recreation is for the sole purpose of physical exercise, a replacement cost of training in an indoor gym
could be used as an exchange value. Assuming a moderate training regime of 3 hours per week with
a reasonably priced monthly subscription at an indoor gym, the replacement cost of physical exercise
in the Marka forest is valued at about 2,7 billion NOK/year. The method’s weakness is that it does not
represent a perfect substitute for forest recreation by not capturing any of the mental health benefits
of outdoor recreation in nature5. To obtain more accurate estimates we would also need information
about what part of our population of recreation users would substitute physical exercise in the forest
for training in a gym, in the hypothetical situation that the Marka forest was unavailable6.
An alternative approach would be to assume that the exchange value of forest recreation in Oslo is
equal to travel expenses, by car or public transport, excluding the opportunity costs of travel time.
Using data from a survey by Sælen and Ericson (2013) and assuming equal private-public travel shares,
we estimated the recreational value of the Marka forest to be 1,2 billion NOK/year. Contrary to the
travel cost method, this does not use travel times to estimate a demand curve. Sælen and Ericson
(2013) demonstrate how a demand curve can be estimated using a choice experiment of willingness-
to-travel7. In order to simulate a demand curve, an experiment must assess willingness-to-travel at
different levels of accessibility or quality. The authors simulated willingness-to-travel to experience
different conditions of bare ground, slush or snow, assuming that weather randomly affects the
location of these condition within the Marka forest by season. Using their estimated demand curve
and travel expense rates for public and private transport, Barton et al. (2015) estimated a recreational
surplus of Marka forest recreation to be about 3,6 billion NOK/year. By itself this approach is
conceptually similar to the travel cost method. We also estimated a consumer surplus net of average
trip expenses at 2, 3 billion NOK/year. Finally, we used benefits transfer from a meta-analysis of travel
cost studies to estimate a transferred consumer surplus of 3,4 billion NOK/year. These latter three
examples all estimate a consumer surplus value, which is considered inappropriate for accounting
purposes.
2.3 Contingent valuation Contingent valuation is based on survey responses to willingness to pay questions for ecosystem
services, and used to estimate economic value for awarness raising purposes, or as input to benefit-
cost analysis. The SEEA-EEA TR suggests that using values directly from the method is inappropriate
4 This could be tested by looking at the correlation between income and recreation time. 5 Notice the tendency of health studios and gyms to place apparatus behind large windows facing streets when views of trees or green space are available. 6 Notice that a hypothetical counterfactual scenario needs to be defined in order to use the replacement cost method accurately. Hypothetical values is one of the principle critiques of the contingent valuation method. 7 Similar in concept to contingent valuation of willigness to travel.
since it measures consumer surplus, rather than exchange values. However, as discussed above for
simulated exchange values, the SEEA EEA TR suggest it is possible to estimate a demand curve from
stated preference estudies. This information may be used in forming exchange values for ecosystem
services.
As an example, the contingent valuation method was used in Oslo to obtain the willingness to pay a
municipal fee for maintaining the density of public street trees. Aggregate willigness to pay across
Oslo’s population was estmated at 60 million NOK/year for maintaining or increasing street trees
across the city (Haavardsholm, 2015). By comparison, current municipal costs for maintaining trees
in municipal parks and streets only is 12 million NOK/year.
While theses contingent valuation estimates cannot be used directly to estimate the value of current
street trees, the information is useful as decision support and for determining a financially feasible
level of supply. Municipal utility services such as water and waste management are charged
according to the cost recovery principle (i.e. no producer surplus). Contingent valuation estimates
could be used to determine is enough households would pay a cost-recovery fee to make it
financially feasible. Also, contingent valuation estimates could be used to determine the increased
level of street tree maintenance possible if the stated amount was actually charged to households,
following a cost-recovery principle. Future increased supply – here increased maintenance of city
trees - might be based on the findings from this contingent valuation study, thereby determining
future maintenance costs and the cost recovery fees per household.
While not determined by a market transaction, a public utility fee for maintenance costs of street
trees can be seen as accounting appropriate as it is a service transaction price (although, similar to
nature, public utilities are often rights, or technically difficult to withold even if no payment is
forthcoming from the user). Providing the utility of public street trees at cost-recovery levels mean
that street trees have no residual resource rent. However, even at cost-recovery levels street trees
may provide consumer surplus to beneficiaries. This value would be ignored by accounting standards.
2.4 Restoration cost Restoration cost refers to the estimated cost to restore an ecosystem asset to an earlier, benchmark
condition. The SEEA-EEA Technical recommendations suggest that the methods is likely to be
inappropriate since it does not determine a price for an individual ecosystem service, but may serve
to inform valuation of a basket of services. Accounting incompatibility in this case is due to an
increased risk of double counting when ecosystem services cannot be identified separately, and
instead are valued as a bundle associated with a specific ecosystem site or green structure. The
valuation method is nevertheless useful in municipal policy, and can meet accounting requirements
under special conditions.
For example, in the city of Oslo, restoration costs of city trees is calculated as a basis for a
compensation fee to be paid by parties responsible for damaging trees on public land (Barton et al.,
2015). The price of nursery trees is adjusted for the age, health and contribution of the tree to site-
specific qualities. Expert judgements of a city arborist are used to score these qualities and arrive at
an adjusted restoration cost. This restoration cost is often taken as a transaction cost by property
developers when destroying a tree as part of construction is unavoidable. As such this is an exchange
value, although the ‘transaction price’ has been set through regulation rather than the market.
Regarding the risk of double counting, this may be avoided by not including municipal trees in other
valuation models (e.g. hedonic pricing models as discussed above).
3. Discussion
In the following we discuss some possible implications of the Oslo valuation examples for
recommendations regarding accounting compatible valuation methods.
3.1 On hedonic pricing, amenity values and double counting The objective of monetary accounts in SEEA EEA is to extend traditional accounting to capture
ecosystems contribution to the economy. Does it fulfill this objective by excluding information from
a market that arguably provides more information on the exchange value of land characteristics than
any other? The accounting compatibility criteria of identifying individual ecosystem services is a
means to avoid double counting of services. But the classification of ecosystem services is an
accounting convenience that may have greater or lesser resolution depending on the purpose of
accounting and the ability of methods to identify non-overlapping types in relation to benefit streams.
Benefits from ecosystems can be subclassified by increasingly more detailed segments, according to
type of beneficiary, time and place the benefit occurs - the definition of “individual ecosystem service”
is therefore a flexible one.
Even though the functional dependence of different types of recreational benefits on different physical
qualities of green space cannot be identified, and even though the recreational composition of each
household is not observed, hedonic property pricing still makes it possible to observe aggregate effects
of green spaces on property values.
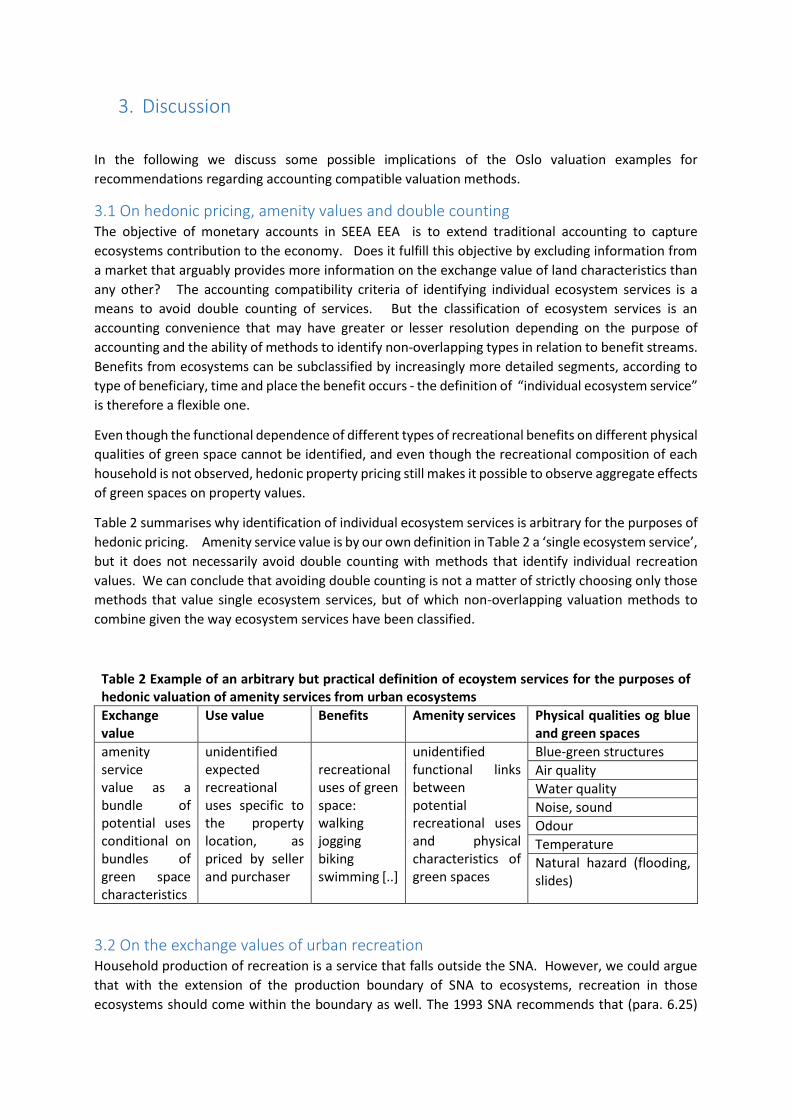
Table 2 summarises why identification of individual ecosystem services is arbitrary for the purposes of
hedonic pricing. Amenity service value is by our own definition in Table 2 a ‘single ecosystem service’,
but it does not necessarily avoid double counting with methods that identify individual recreation
values. We can conclude that avoiding double counting is not a matter of strictly choosing only those
methods that value single ecosystem services, but of which non-overlapping valuation methods to
combine given the way ecosystem services have been classified.
Table 2 Example of an arbitrary but practical definition of ecoystem services for the purposes of hedonic valuation of amenity services from urban ecosystems
Exchange value
Use value Benefits Amenity services
Physical qualities og blue and green spaces
amenity service value as a bundle of potential uses conditional on bundles of green space characteristics
unidentified expected recreational uses specific to the property location, as priced by seller and purchaser
recreational uses of green space: walking jogging biking swimming [..]
unidentified functional links between potential recreational uses and physical characteristics of green spaces
Blue-green structures
Air quality
Water quality
Noise, sound
Odour
Temperature
Natural hazard (flooding, slides)
3.2 On the exchange values of urban recreation Household production of recreation is a service that falls outside the SNA. However, we could argue
that with the extension of the production boundary of SNA to ecosystems, recreation in those
ecosystems should come within the boundary as well. The 1993 SNA recommends that (para. 6.25)
“the production of a good for own final use should be measured when the amount is believed to be
quantitatively important in relation to the total supply of the good in the country.” Because recreation
is a service it falls outside the production boundary, and outside ecosystem accounts. While recreation
is a service, it is a quantitatively important activity for household subsistence in a wide sense. Time
allocation to nature recreation is significant and comparable some households to salaried time use.
Barton et al. (2015) found consumer surplus-based estimates to be roughly similar to the replacement
cost estimate (Table 1), although admittedly we have not carried out sensitivity analysis on each of the
methods. The value based on opportunity cost of time was roughly four times higher than the
recreational surplus estimate, using Sælen and Ericson’s data. Conversely, Remme et al. (2015) found
consumer surplus values roughly 4 times higher than exchange values for air quality regulation services
in Limburg. The difference in the 1:4 versus 4:1 ratio of exchange value to consumer surplus between
cultural and regulating ecosystem services may be due to many factors. One difference that stands out
is the use of pressure-state-impact-response model chains to assess regulating services – long cause-
effect chains may attenuate the value of off-site air quality, when monetary evalues are anchored oto
on-site pollution mitigation costs.
Remme et al. (2015) suggest that simulated exchange value methods should be tested in future, citing
Oviedo et al. (2010). Oviedo et al. (2010) estimated per visitor costs of fixed visitor infrastructure and
variable management costs of an open access natural park in Spain. They assumed that current
management costs per visitor would increase proportionally with each visit. They intersected the
resulting park management supply curve with trip-expenditure willingness-to-pay, estimated from a
contingent valuation survey.
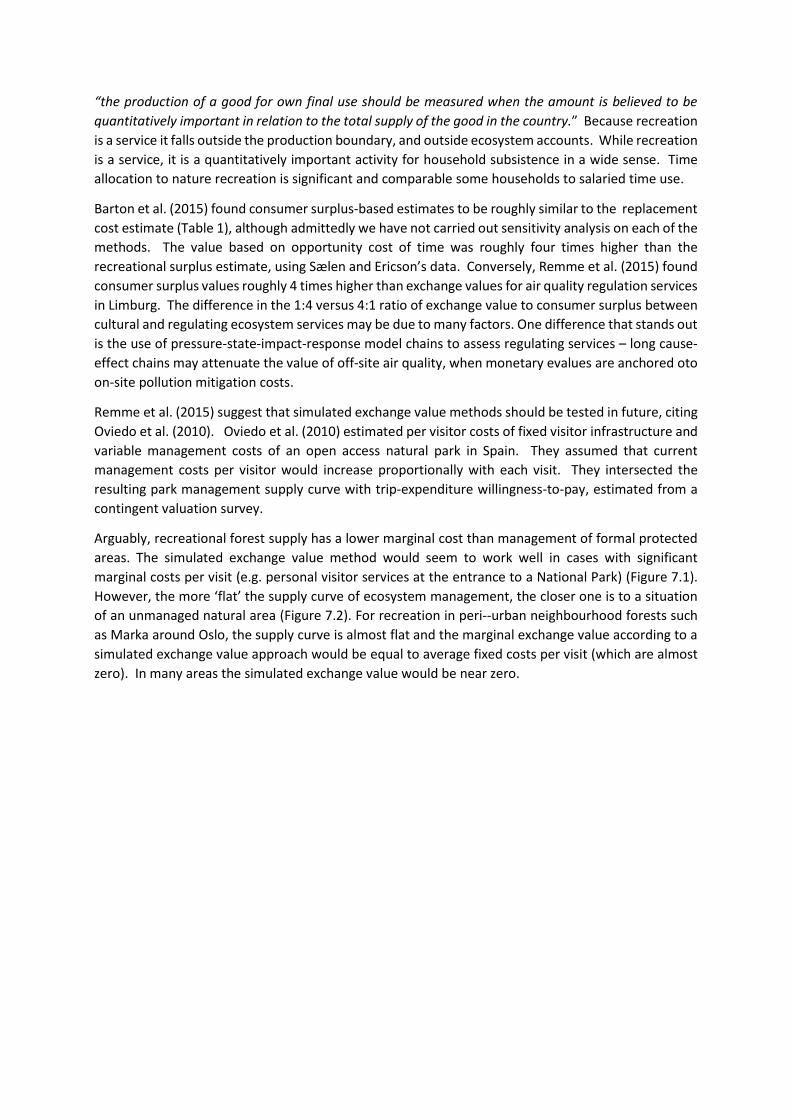
Arguably, recreational forest supply has a lower marginal cost than management of formal protected
areas. The simulated exchange value method would seem to work well in cases with significant
marginal costs per visit (e.g. personal visitor services at the entrance to a National Park) (Figure 7.1).
However, the more ‘flat’ the supply curve of ecosystem management, the closer one is to a situation
of an unmanaged natural area (Figure 7.2). For recreation in peri--urban neighbourhood forests such
as Marka around Oslo, the supply curve is almost flat and the marginal exchange value according to a
simulated exchange value approach would be equal to average fixed costs per visit (which are almost
zero). In many areas the simulated exchange value would be near zero.
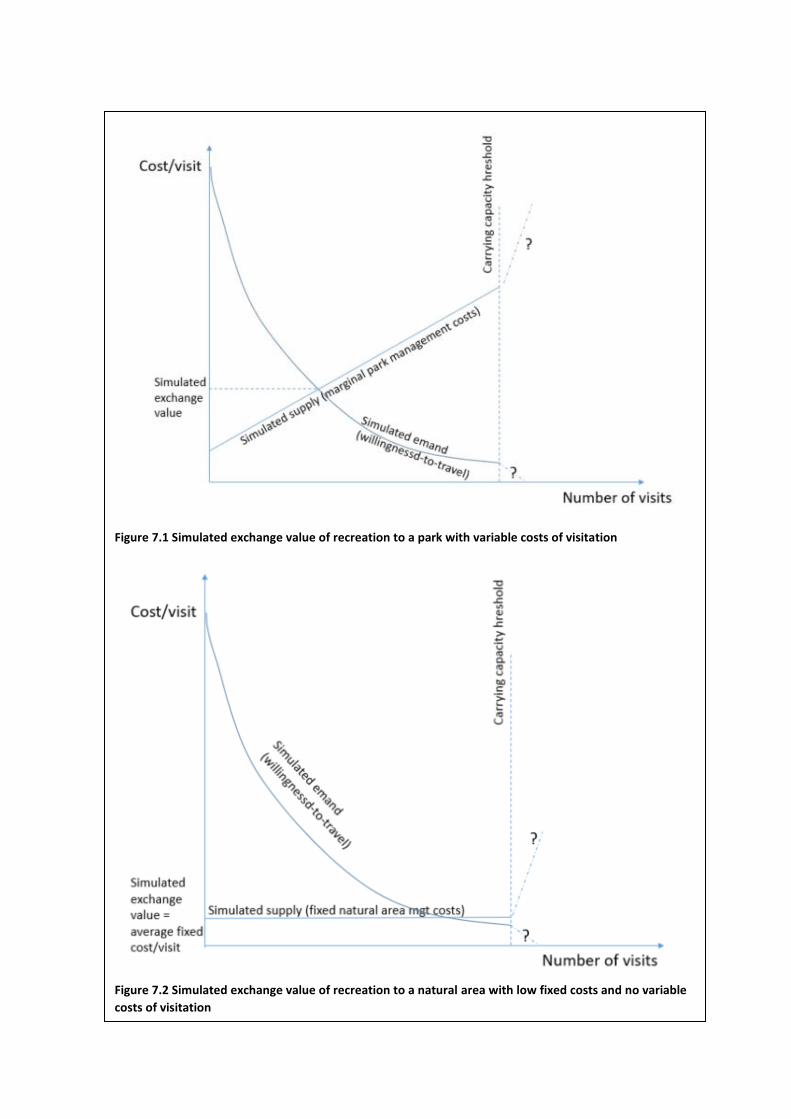
Figure 7.1 Simulated exchange value of recreation to a park with variable costs of visitation
Figure 7.2 Simulated exchange value of recreation to a natural area with low fixed costs and no variable
costs of visitation
An ‘accounting appropriate’ simulated exchange method for public open access low-management
green spaces suffers from similar challenges to the ‘zero residual rent’ problem seen for public utilities.
It is intuitively clear that the recreational service of the peri-urban forest has large total public benefits.
The peri-urban ecosystems support a large user population, but the marginal exchange value is low.
This should open up a space for reinterpretation of the production boundary with regards to value of
household time, and/or other methods than those currently cited in the SEEA EEA TR.
Another conceptual critique concerns the intention to value the benefits of an ecosystem service as
directly as possible. Time spent in recreation areas is a service with mental and physical health
benefits. The value of these benefit to the economy could be estimated in terms of preventive
expenditure, avoided health costs, or expected income of quality adjusted life years. This would
require considerable additional epidemiological information and additional assumptions. Although it
has some conceptual flaws, the opportunity cost of time would seem a more straightforward marginal
exchange value, which can be based on national statistics, with no epidemiological assumptions.
3.3 On the relevance of monetary ecosystem accounting for municipal decision-
making
Several themes have run through the discussion of the valuation examples from Oslo. How reliable
and accurate are the valuation methods? Are the values observed significant – i.e. “big numbers” - in
the municipal policy context? Do accounting standards exclude reliable and significant valuation
estimates? Are valuation estimates that are inappropriate for accounting still useful for municipal
policy making?
We have discussed several examples:
- The willigness-to-pay for maintenance of street trees as a public utility using contingent valuation is inappropriate for accounting. However, the demand curve information could be useful for the city in setting financially feasible maintenance levels for the future.
- Quality-adjusted restoration costs of street trees is not appropriate for accounting because it values a bundle of ecosystem services. However, the restoration cost method has already been adopted by the municipality as a damage assessment method used to set fines. When used for accounting it also reveals “big numbers”, which have been used for awareness raising by the municipality8.
- Hedonic pricing is appropriate for accounting, reveals “big numbers” as aggregates for the city. But the method is not accurate in terms of predicting the values of non-maringal changes in the supply of green spaces in particular neighbourhoods. While resesarch is ongoing, ecosystem asset values derived from hedonic pricing are currently not robust to different model specifications.
- Simple valuation methods such as opportunity cost of time in nature recreation are reliable, but possibly inappropriate with regards to the production boundaries in SNA. Alternative valuation methods that have been proposed for valuing urban nature recreation are expected to also have weaknesses such as deriving theoretically correct, but low or zero exchange values. Nevertheless, we observe tens of millions of hours of recreation in urban parks and forests every year.
8 http://www.openness-project.eu/sites/default/files/osloopeness_insight.pdf
A tentative conclusion from our case examples is that ecosystem accounting criteria for monetary
valuation excludes information that is policy relevant. Accounting compatible methods – such as
hedonic pricing – may require a large number of assumptions, making values sensitive to specification
error and/or inappropriate for impact assessments at local level. However, despite low accuracy and
context sensitivity, they may be useful at aggregate scales, at low spatial resolutions and for awareness
raising purposes. Information from stated preference methods may be used to estimate accounting
compatible values, but economic values measured by consumer surplus may be relevant for awareness
raising or priority-setting using benefit-cost analysis.
Valuation of local nature recreation using consumer surplus based methods does not capture health
effects, nor the cultural significance of green spaces. Physical accounting data – such as visitation rates
- provides decision-relevant information, especially when monetary valuation methods are lacking.
The importance of monetary accounting information lies in being able to ascribe whether the change
in relative value is due to a change in extent or in exchange value per unit. How much does accurate
measurement of an absolute (rather than relative) magnitude of exchange values matter for policy?
If exchange based values are a subset of welfare economic values, which are a subset of societal
welfare, then exchange values alone cannot be used to prioritise policy or project decisions at
municipal level. In that case, the magnitude of exchange values is less important than monitoring the
change in value of ecosystem assets over time, as long as the valuation methods chosen are applied
consistently over time.
4. Conclusions
SEEA-EEA technical recommendations are being tested at the municipal level within the metropolitan
area of greater Oslo, Norway, but the URBAN EEA project9. We are testing how the SEEA-EEA
framework can identify the economic contributions that urban ecosystems make to the municipal,
household and commercial sectors in greater Oslo.
Local and city governments already make use of landuse mapping and thematic environmental and
socio-cultural indicators to inform impact assessments, municipal planning and zoning. Ecosystem
accounting offers a complementary set of indicators to municipal government in Oslo to make
fragmented urban nature and blue-green infrastructure more visible in city planning. Characteristics
of cities in general limit the scope of monetary ecosystem accounts in the assessment of municipal
policy targets:
- For example, urban green structures can be small and hard to identify in GIS (but havea a high per unit area value). Remnant and constructed urban nature is highly spatially fragmented.
- Mixed-use density of green spaces is high and highly localised. This makes it challenging to identify marginal values of particular green space qualities and ecosystem services from transactions in the property market.
- Municipal utilities such as water supply, rainwater management, sewage treatment and solid waste management operate according to cost-recovery. This means that the residual resource rent attributable to ecosystems is low or zero.
- Recreational time use in neighbourhood public spaces is very high relative to travel expenses to use the areas, leaving little trace in market transactions.
9 Urban Experimental Ecosystem Eccounting.
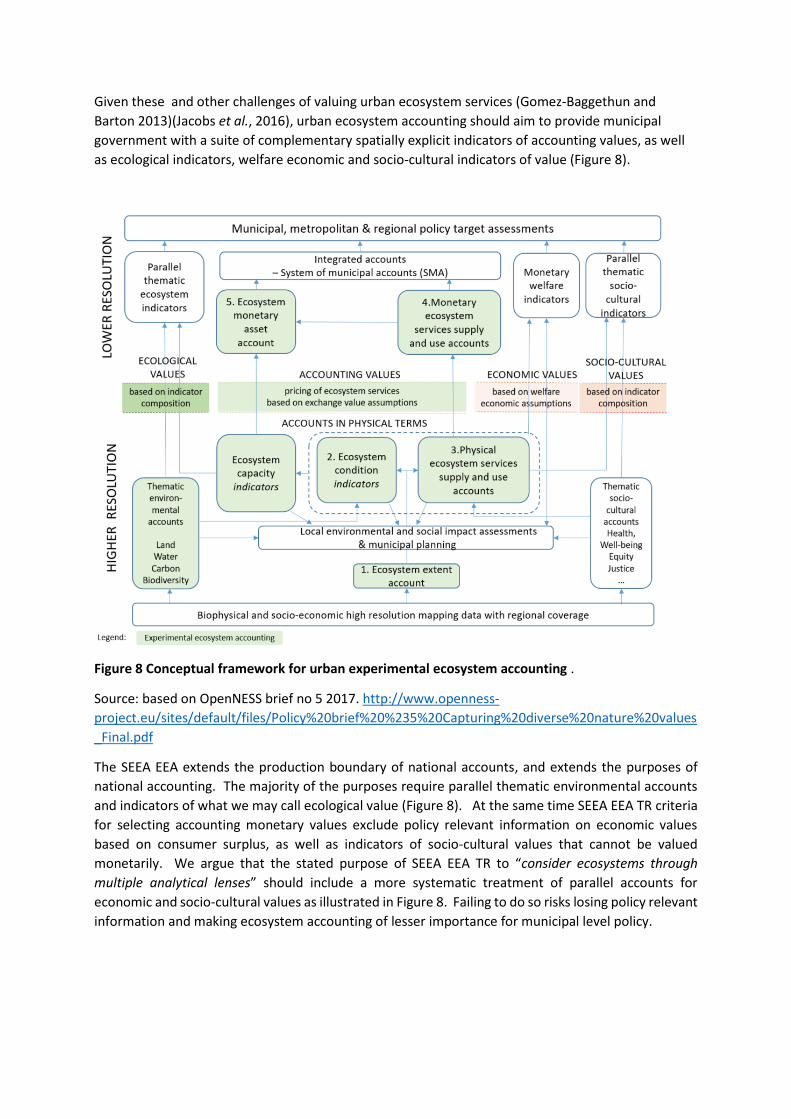
Given these and other challenges of valuing urban ecosystem services (Gomez-Baggethun and
Barton 2013)(Jacobs et al., 2016), urban ecosystem accounting should aim to provide municipal
government with a suite of complementary spatially explicit indicators of accounting values, as well
as ecological indicators, welfare economic and socio-cultural indicators of value (Figure 8).
Figure 8 Conceptual framework for urban experimental ecosystem accounting .
Source: based on OpenNESS brief no 5 2017. http://www.openness-
project.eu/sites/default/files/Policy%20brief%20%235%20Capturing%20diverse%20nature%20values
_Final.pdf
The SEEA EEA extends the production boundary of national accounts, and extends the purposes of
national accounting. The majority of the purposes require parallel thematic environmental accounts
and indicators of what we may call ecological value (Figure 8). At the same time SEEA EEA TR criteria
for selecting accounting monetary values exclude policy relevant information on economic values
based on consumer surplus, as well as indicators of socio-cultural values that cannot be valued
monetarily. We argue that the stated purpose of SEEA EEA TR to “consider ecosystems through
multiple analytical lenses” should include a more systematic treatment of parallel accounts for
economic and socio-cultural values as illustrated in Figure 8. Failing to do so risks losing policy relevant
information and making ecosystem accounting of lesser importance for municipal level policy.
5. References Barton, D.N., 2016. Monetary valuation of urban ecosystem services-operationalization or tragedy of
well-intentioned valuation? An illustrated example. Ecosystem services : concepts, methodologies and instruments for research and applied use / Sergi Nuss-Girona, Mita Castañer (eds.). – Girona : Documenta Universitaria, 2015. -- p. ; cm. – (Quaderns de medi ambient ; 6) ISBN 978-84-9984-308-7.
Barton, D.N., Stange, E., Blumentrath, S., Traaholt, N.V., 2015. Economic valuation of ecosystem services for policy. A pilot study on green infrastructure in Oslo. . p. 77.
Czembrowski, P., Kronenberg, J., 2016. Hedonic pricing and different urban green space types and sizes: Insights into the discussion on valuing ecosystem services. Landscape and Urban Planning, 11-19.
Gómez-Baggethun, E., Barton, D.N., 2013. Classifying and valuing ecosystem services for urban planning. Ecol Econ 86, 235 – 245.
Haavardsholm, O.J.N., 2015. Valuing Urban Ecosystem Services: A Contingent Valuation Study on Street Trees in Oslo. M.Sc. thesis. Department of Economics, University of Oslo
Hein, L., Obst, C., Edens, B., Remme, R.P., 2015. Progress and challenges in the development of ecosystem accounting as a tool to analyse ecosystem capital. Curr Opin Env Sust 14, 86-92.
Heyman, A., Chen, X., Nowell, M., Manum, B., Barton, D.N., 2017. Attributes of location and housing prices in Oslo: A monetary valuation with spatial configuration in mind Proceedings of the 11th Space syntax symposium, Lisbon pp. 68.61 – 68.15
IPBES, 2015. Preliminary guide regarding diverse conceptualization of multiple values of nature and its benefits, including biodiversity and ecosystem functions and services (deliverable 3 (d)). Intergovernmental Science-Policy Platform on Biodiversity and Ecosystem Services.
Jacobs, S., Dendoncker, N., Martin-Lopez, B., Barton, D.N., Gomez-Baggethun, E., Boeraeve, F., McGrath, F.L., Vierikkoh, K., Geneletti, D., Sevecke, K.J., Pipart, N., Primmer, E., Mederly, P., Schmidt, S., Aragao, A., Baral, H., Bark, R.H., Briceno, T., Brogna, D., Cabral, P., De Vreese, R., Liquete, C., Mueller, H., Peh, K.S.H., Phelan, A., Rincon, A.R., Rogers, S.H., Turkelboom, F., Van Reeth, W., van Zanten, B.T., Wam, H.K., Washbourne, C.L., 2016. A new valuation school: Integrating diverse values of nature in resource and land use decisions. Ecosystem Services 22, 213-220.
OECD, 2002. Handbook on measurement of the non-observed economy. OECD, IMF, ILO, CIS STAT. Oviedo, J., Campos, P., Caparrós, A., 2010. Simulated Exchange Value Method: Applying Green National
Accounting to Forest Public Recreation. Instituto de Políticas y Bienes
Públicos CCHS-CSIC, Madrid, Spain. Remme, R.P., Edens, B., Schroter, M., Hein, L., 2015. Monetary accounting of ecosystem services: A
test case for Limburg province, the Netherlands. Ecol Econ 112, 116-128. Schröter, M., Barton, D.N., Remme, R.P., Hein, L., 2014. Accounting for capacity and flow of ecosystem
services: A conceptual model and a case study for Telemark, Norway. Ecol Indic 36, 539-551. Soy Massoni, E., Rusch, G., Barton, D.N., Gundersen, V., in press. Bigger, more diverse and better?
Mapping structural diversity and its recreational value in urban green spaces. Ecosystem Services.
Sumarga, E., Hein, L., Edens, B., Suwarno, A., 2015. Mapping monetary values of ecosystem services in support of developing ecosystem accounts. Ecosystem Services 12, 71-83.
Sælen, H., Ericson, T., 2013. The recreational value of different winter conditions in Oslo forests: A choice experiment. Journal of Environmental Management 131, 426-434.

Vågnes Traaholt, N., 2014. Valuing Urban Recreational Ecosystem Services in Oslo -A hedonic pric-ing study. Master Thesis, Department of Food and Resource Economics, Faculty of Science. Uni-versity of Copenhagen.