Monetary Policy Rules, Macroeconomic Stability, and Inflation: A … · 2009-03-10 · increase in...
26
Monetary Policy Rules, Macroeconomic Stability, and Inflation: A View from the Trenches Author(s): Athanasios Orphanides Source: Journal of Money, Credit and Banking, Vol. 36, No. 2 (Apr., 2004), pp. 151-175 Published by: Blackwell Publishing Stable URL: http://www.jstor.org/stable/3839015 Accessed: 10/03/2009 16:38 Your use of the JSTOR archive indicates your acceptance of JSTOR's Terms and Conditions of Use, available at http://www.jstor.org/page/info/about/policies/terms.jsp. JSTOR's Terms and Conditions of Use provides, in part, that unless you have obtained prior permission, you may not download an entire issue of a journal or multiple copies of articles, and you may use content in the JSTOR archive only for your personal, non-commercial use. Please contact the publisher regarding any further use of this work. Publisher contact information may be obtained at http://www.jstor.org/action/showPublisher?publisherCode=black. Each copy of any part of a JSTOR transmission must contain the same copyright notice that appears on the screen or printed page of such transmission. JSTOR is a not-for-profit organization founded in 1995 to build trusted digital archives for scholarship. We work with the scholarly community to preserve their work and the materials they rely upon, and to build a common research platform that promotes the discovery and use of these resources. For more information about JSTOR, please contact [email protected]. Blackwell Publishing is collaborating with JSTOR to digitize, preserve and extend access to Journal of Money, Credit and Banking. http://www.jstor.org
Transcript of Monetary Policy Rules, Macroeconomic Stability, and Inflation: A … · 2009-03-10 · increase in...

Monetary Policy Rules, Macroeconomic Stability, and Inflation: A View from the TrenchesAuthor(s): Athanasios OrphanidesSource: Journal of Money, Credit and Banking, Vol. 36, No. 2 (Apr., 2004), pp. 151-175Published by: Blackwell PublishingStable URL: http://www.jstor.org/stable/3839015Accessed: 10/03/2009 16:38
Your use of the JSTOR archive indicates your acceptance of JSTOR's Terms and Conditions of Use, available athttp://www.jstor.org/page/info/about/policies/terms.jsp. JSTOR's Terms and Conditions of Use provides, in part, that unlessyou have obtained prior permission, you may not download an entire issue of a journal or multiple copies of articles, and youmay use content in the JSTOR archive only for your personal, non-commercial use.
Please contact the publisher regarding any further use of this work. Publisher contact information may be obtained athttp://www.jstor.org/action/showPublisher?publisherCode=black.
Each copy of any part of a JSTOR transmission must contain the same copyright notice that appears on the screen or printedpage of such transmission.
JSTOR is a not-for-profit organization founded in 1995 to build trusted digital archives for scholarship. We work with thescholarly community to preserve their work and the materials they rely upon, and to build a common research platform thatpromotes the discovery and use of these resources. For more information about JSTOR, please contact [email protected].
Blackwell Publishing is collaborating with JSTOR to digitize, preserve and extend access to Journal of Money,Credit and Banking.
http://www.jstor.org

ATHANASIOS ORPHANIDES
Monetary Policy Rules, Macroeconomic Stability, and Inflation: A View from the Trenches
I estimate a forward-looking monetary policy reaction function for the Federal Reserve for the periods before and after Paul Volcker's appointment as Chairman in 1979, using information that was available to the FOMC in real time from 1966 to 1995. The results suggest broad similarities in policy and point to a forward-looking approach to policy consistent with a strong reaction to inflation forecasts during both periods. This contradicts the hypothesis, based on analysis with ex post constructed data, that the instability of the Great Inflation was the result of weak FOMC policy responses to expected inflation. A difference is that prior to Volcker's appointment, policy was too activist in reacting to perceived output gaps that retrospectively proved overambitious. Drawing on contemporaneous ac- counts of FOMC policy, I discuss the implications of the findings for alternative explanations of the Great Inflation and the improvement in macroeconomic stability since then.
JEL codes: E3, E52, E58 Keywords: monetary policy rules, real-time data, Greenbook forecasts, stagflation.
THE PERFORMANCE of the U.S. economy during the past two decades has been impressive. From the early 1980s to the end of the 1990s, the economy steadily expanded (but with a brief interruption in 1990), while inflation remained fairly stable and subdued. The 1980s marked what was the longest peace- time expansion on record, only to be followed by the longest expansion ever. The "Long Boom" aptly describes this exceptionally long period of stability and growth (Taylor, 1998). By contrast, the essence of the 15 or so years before the Long
I would like to thank Robert Barro, Richard Clarida, Mark Gertler, Greg Hess, Eric Leeper, David Lindsey, Dick Porter, Chris Sims, John Williams, Michael Woodford, and participants at presentations at the Bank of England, the Sveriges Riksbank, the European Central Bank, the IMF, and the NBER for useful comments and discussions. The opinions expressed are those of the author and do not necessarily reflect views of the Board of Governors of the Federal Reserve System.
ATHANASIOS ORPHANIDES is in the Division of Monetary Affairs, Board of Governors of the Federal Reserve System. E-mail: [email protected] Received January 10, 2001; and accepted in revised form October 22, 2002.
Journal of Money, Credit, and Banking, Vol. 36, No. 2 (April 2004) Published by The Ohio State University, 2004

152 : MONEY, CREDIT, AND BANKING
Boom, in one word, "stagflation." This single word describes both the perception of stagnation throughout the 1970s and also the Great Inflation, which started in the mid-1960s and became increasingly more virulent during the 1970s.
What accounts for this dramatic change in economic outcomes, from the instability of the Great Inflation, to the steady expansion of the Long Boom? Broadly, explana- tions fall into two not mutually exclusive strands, those emphasizing possible changes in the structure of the economy and those emphasizing changes in policy.1 From a policy perspective, explanations that emphasize the role of policy are of particular interest. To the extent a change in policy has contributed to such a drastic improve- ment in economic well-being, proper identification of the policy mistakes that were presumably corrected, or more generally, of the characteristics of policy during the period of superior performance, would be of great economic significance. After all, the single most significant contribution of historical policy analysis is perhaps to identify and help avoid the repetition of past mistakes.
A number of alternative hypotheses for how a policy change may have contributed to the improvement in macroeconomic performance during the Long Boom have been advanced. One widely known view is the result of recent influential studies on monetary policy rules, notably Clarida, Gali, and Gertler (2000) (henceforth CGG) and Taylor (1999a).2 This view emphasizes the important insight that success- ful monetary policy requires a strong response to expected inflation, such that an increase in expected inflation prompts a more than proportional increase of short- term nominal interest rates. CGG and Taylor argue that the difference in performance from the Great Inflation to the Long Boom can be squarely traced to a shift in this response associated with Paul Volcker's appointment as Chairman of the Federal Reserve in 1979. In essence, these authors argue that during the Great Inflation the Federal Reserve pursued a policy that accommodated inflation and induced instability in the economy by lowering real interest rates when expected inflation increased and vice versa. This perverse practice, they suggest, ended with Volcker's appointment as Chairman, thus restoring monetary stability in the economy.3
An alternative view on how policy may have improved since the Great Inflation identifies changes in the response of policy to economic activity, as opposed to expected inflation. In this view, policy was excessively activist during the Great Inflation, a result of policymaker's overconfidence in their ability to stabilize
1. Ahmed, Levin, and Wilson (2001), Blanchard and Simon (2001), and Kahn, McConnell, and Perez-Quiros (2001), among others, emphasize helpful changes in the structure of the economy or a reduction in the frequency of disruptive disturbances as the primary sources of the improvement. Blanchard and Simon identify a decline in volatility starting in the 1950s-interrupted in the 1970s and early 1980s. Kahn et al. stress improvements in information technologies since about 1984. Ahmed et al. identify a reduced variance of exogenous shocks since about that time as the most important but not the only source of improvement.
2. See Blinder (1979), De Long (1997), Mayer (1999), and references therein for earlier investigations of the role of policy for the unfavorable outcomes associated with the Great inflation.
3. Other studies, some building directly on the CGG empirical results, have advanced related argu- ments. For example, Christiano and Gust (2000) emphasize that a high inflation expectations trap can arise if policy accommodates inflation as suggested by CGG for the 1970s. Because of the attention that has been received by the CGG results, in particular, I focus my discussion here on that analysis.
ATHANASIOS ORPHANIDES : 153
deviations of output from the economy's potential supply-the output gap.4 As shown by Orphanides (2003a), if policymakers mistakenly adopt policies that are
optimal under the presumption that their understanding of the state of the economy is accurate when, in fact, such accuracy is lacking, they inadvertently induce instabil-
ity in both inflation and economic activity.5 According to this view, the instability associated with the Great Inflation was the unintended outcome of excessively activist
policies chasing output targets that proved overambitious, retrospectively. By the end of the 1970s, the instability and inflationary impetus of these activist policies was finally recognized and policy subsequently improved by becoming less activist.
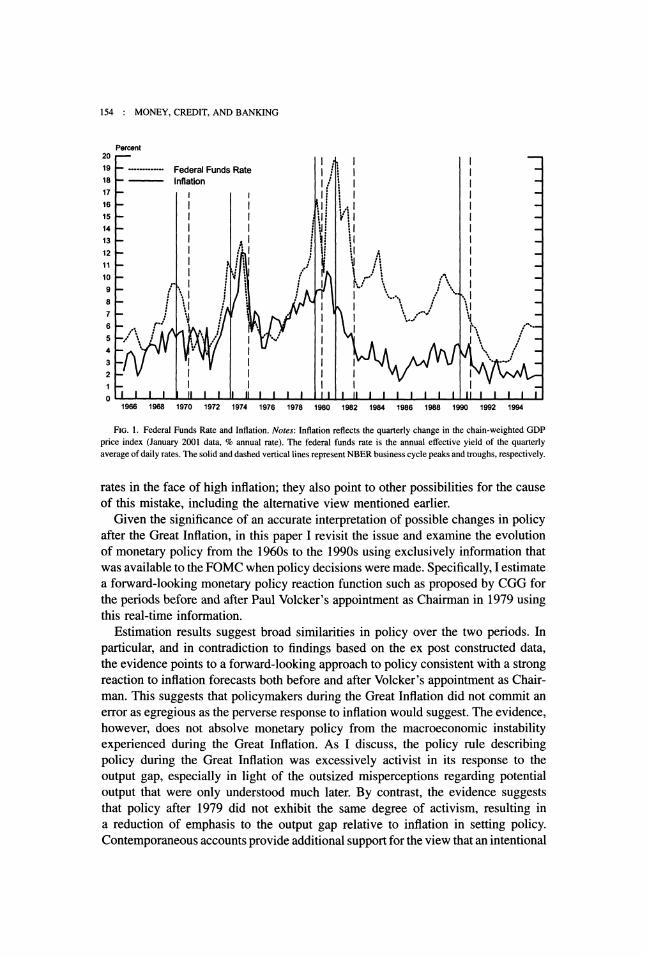
The behavior of inflation since the 1960s offers indisputable evidence that mone- tary policy was highly accommodative during the Great Inflation but much less so afterward. Figure 1 compares the behavior of inflation and the federal funds rate from 1966 to 1995. As is evident, the federal funds rate was consistently much higher than inflation since the late 1970s than it was earlier. This change is suggestive of a dramatic reversal in policy at that time. It also confirms an important element of both hypotheses mentioned above. To identify more precisely whether and how
monetary policy differed before and after Volcker's appointment, CGG estimate and
compare forward-looking monetary policy rules responding to the outlook of inflation and economic activity for each era. Their estimation also suggests that, even after
controlling for policy responses to economic activity, the Federal Reserve adjusted real interest rates in a perverse manner prior to Volcker's appointment but not after. In their estimation, however, CGG do not employ information that was available to the Federal Open Market Committee (FOMC) when monetary policy decisions were made but instead rely on ex post constructed data as proxies. As they carefully acknowledge, this raises some questions regarding the interpretation of the results.6 Indeed, CGG conclude that the fundamental problem they raise for the Great Inflation is that the Federal Reserve maintained persistently low short-term real interest
4. This concern is based on the well-known monetarist criticism against activist control of the economy-the "monetarists" versus "activists" debate. See the essays collected in Friedman (1953) for early expositions of the issue and Meltzer (1987) for a more recent exposition. Its potential for understanding the improvement in macroeconomic performance since the Great Inflation has been recently investigated in the context of interest rate policy rules by Orphanides (2000, 2003a, 2003b). The problems associated with designing monetary policy without adequate treatment of uncertainty regarding real- time assessments of the output gap (and the closely related "unemployment gap") have been recently emphasized in a number of studies, including, Estrella and Mishkin (1999), McCallum (2001), McCallum and Nelson (1999), Orphanides et al. (2000), Smets (2002), and Wieland (1998).
5. The empirical evidence, briefly reviewed in Section 2, indicates that assessments of the economy's productive potential have historically been quite inaccurate. During the 1970s, in particular, mispercep- tions regarding adverse shifts in trend productivity resulted in outsized errors and overoptimistic assess- ments of the economy's potential.
6. In particular, this practice can lead to misleading descriptions of historical policy and obscure the behavior suggested by information available to policymakers in real time. For a detailed discussion of these pitfalls in the context of policy rules such as those examined by Taylor and CGG see Orphanides (2001). Briefly, the main difficulty arises from the fact that monetary policy decisions are based on and reflect policymaker perceptions of the state of the economy at the time policy is made. As a result, to correctly identify behavior, it is imperative to account for the evolution of these perceptions in real time and not simply rely on the actual evolution of the state of the economy as recognized ex post. Obviously, when perceptions and reality match closely, the distinction may be inconsequential. On the other hand, when perceptions prove incorrect for a period of time, the distinction becomes crucial.
154 : MONEY, CREDIT, AND BANKING
Percent 201 --- -
19 . - .----..-. Federal Funds Rate 18 - Inflation / ' - 17 - 16- l , i 15- I .ll . -
12- II I I I -
13 - I ! i
:: n .y Tr I\A :
10 -
1O I I I \ -
1966 1968 1970 1972 1974 1976 1978 1980 1982 1984 1986 1988 1990 1992 1994I I I I I
1966 1968 1970 1972 1974 1976 1978 1980 1982 1984 1986 1988 1990 1992 1994
FIG. 1. Federal Funds Rate and Inflation. Notes: Inflation reflects the quarterly change in the chain-weighted GDP
price index (January 2001 data, % annual rate). The federal funds rate is the annual effective yield of the quarterly average of daily rates. The solid and dashed vertical lines represent NBER business cycle peaks and troughs, respectively.
rates in the face of high inflation; they also point to other possibilities for the cause of this mistake, including the alternative view mentioned earlier.
Given the significance of an accurate interpretation of possible changes in policy after the Great Inflation, in this paper I revisit the issue and examine the evolution of monetary policy from the 1960s to the 1990s using exclusively information that was available to the FOMC when policy decisions were made. Specifically, I estimate a forward-looking monetary policy reaction function such as proposed by CGG for the periods before and after Paul Volcker's appointment as Chairman in 1979 using this real-time information.
Estimation results suggest broad similarities in policy over the two periods. In particular, and in contradiction to findings based on the ex post constructed data, the evidence points to a forward-looking approach to policy consistent with a strong reaction to inflation forecasts both before and after Volcker's appointment as Chair- man. This suggests that policymakers during the Great Inflation did not commit an error as egregious as the perverse response to inflation would suggest. The evidence, however, does not absolve monetary policy from the macroeconomic instability experienced during the Great Inflation. As I discuss, the policy rule describing policy during the Great Inflation was excessively activist in its response to the output gap, especially in light of the outsized misperceptions regarding potential output that were only understood much later. By contrast, the evidence suggests that policy after 1979 did not exhibit the same degree of activism, resulting in a reduction of emphasis to the output gap relative to inflation in setting policy. Contemporaneous accounts provide additional support for the view that an intentional

ATHANASIOS ORPHANIDES : 155
reduction in policy activism along these lines followed Paul Volcker's appointment as Federal Reserve Chairman. The policy record suggests that rapidly changing economic developments during 1979 forced a critical reconsideration of policy that
year. This subtle policy improvement in the aftermath of the Great Inflation contrib- uted to the improved macroeconomic performance of the Long Boom.
1. FORWARD-LOOKING POLICY RULES
1.1 Specification I consider a family of simple linear rules with the federal funds rate as the
policy instrument. Briefly, these rules specify that monetary policy decisions are mainly driven by two factors, the outlook for inflation, as measured by the rate of change of the output deflator, and the outlook for real economic activity, as measured by the deviation of output from the economy's potential supply-the output gap. This family of rules was first examined in detail in the policy regime evaluation project reported in Bryant, Hooper, and Mann (1993). As they explained, this specification was motivated by the "stated dual objective of many central banks to achieve a sustainable growth in real activity while avoiding inflation," (p. 225), which also broadly describes the stated policy objectives of the Federal Reserve over the past several decades. Following an influential study by Taylor (1993), these rules are commonly referred to as "Taylor rules." Over the past several years, a vast literature has spawned examining various variants of these policy rules from theoretical and empirical perspectives and their usefulness remains an area of active research.7 For the purposes of this study, I limit my attention to simple forward-looking variants along the lines examined by CGG, which have served as the focus of recent historical policy comparisons.8
Let ft* denote the notional target for the federal funds rate for quarter t, Ytlt the outlook for the output gap for quarter t, as perceived during the quarter, and nt,ilt the outlook for inflation, specifically for the average rate of inflation from quarter t to quarter t + i, also as perceived during quarter t.9 The rules I examine specify
7. See Ball (1999), CGG (1999), Hetzel (2000), McCallum (1999), Taylor (1999b), Williams (1999), Woodford (2002), and references therein. Particularly relevant for forward-looking variants of these policy rules, such as examined here, is the work of Amato and Laubach (1999), Batini and Haldane (1999), Batini and Nelson (2000), Levin, Wieland, and Williams (1999, 2000), Nessen (1999), Rudebusch and Svensson (1999), and Smets (2000). These forward-looking rules also provide a useful analytical frame- work for the inflation targeting approach to policy, as discussed in Bernanke and Mishkin (1997), Bernanke et al. (1998), and Svensson (1997, 1999).
8. This sidesteps a number of possibly important issues relating to the specification of the rule. For example, it rules out the presence of nonlinearities, such as suggested from time to time by FOMC members themselves and examined, among others by, Blinder (1997), CGG (1999), Orphanides and Wilcox (2002), and Orphanides and Wieland (2000). Also, it does not address differences in specification within linear rules which may influence interpretations of historical policy changes. For example, Sims (1999) and Fair (2001) suggest that the evidence for a policy change associated with Volcker's appointment as Chairman is weak, based on the policy rule specifications they examine.
9. For any variable X, I use the notation X, to denote perceptions of the value of the variable for quarter t held at quarter r. For inflation and output data, this involves a forecast when r < t and actual data (though always subject to revision) for T > t.
156 : MONEY, CREDIT, AND BANKING
that the notional target for the federal funds rate evolves according to:
ft* = ( + -
PItilt + YYtltr
Here, 3 reflects the responsiveness of policy to expected inflation and y the respon- siveness of policy to real economic activity. As can be easily seen, P > 1 reflects a policy that raises real rates with inflation, a response that is generally stabilizing, while P < 1 indicates the perverse response of reducing real rates when expected inflation rises, which is generally destabilizing.10 The role of the remaining parame- ter, a, is most clearly seen by noting that in steady state, inflation is equal to the policy target, c*, and the output gap is equal to zero. Letting r* denote the equilibrium real interest rate, the policy rule above implies: a = r - ( - 1 )*. Thus, a reflects a linear combination of the equilibrium real rate and the inflation target, and is equal to the equilibrium real rate in the special case of a zero inflation target.
The actual federal funds rate for the quarter, ft, reflects movements of the notional target, ft*, possibly with a degree of inertia:
ft = (1- P)ft* + p(L)ft-l + t,
where p(L) = Pl + p2L + *.. + p,Ln-1 and p =p(l).ll This specification follows CGG (2000), who report results with n = 2. It nests the simplest partial adjustment case, n = 1, used by CGG (1998) and others.
The error, rt, is assumed to reflect other factors that might influence the federal funds rate during the quarter, independent of the inflation and economic activity outlook. Combining the notional target and partial adjustment equations yields the
following policy reaction function:
ft = (1 - p)( + P,ilt + yYtlt) + p(L)ft-_ + lt. (1)
1.2 Real-Time Information In estimating a policy reaction function such as Equation (1), the objective is to
describe how policy responded over time to the outlook of inflation and economic
activity as understood when policy decisions were made. Ideally, to capture the intent of policy as closely as possible, estimation of Equation (1) should be based on consistent forecasts of inflation and the output gap, as formed by policymakers themselves, and reflecting concepts of these variables with uniform meanings over time. In practice, several complications need to be addressed. Monetary policy in the United States is decided by the Federal Open Market Committee. Although individual members of the Committee have sometimes offered their views of
10. Stability conditions differ depending on model-specific details. In some models, stability is possible with values of P slightly smaller than one and y > 0. See Christiano and Gust (2000), CGG (1999), Kerr and King (1996), Rotemberg and Woodford (1999), and Woodford (2003), for examinations in alternative models with optimizing behavior.
11. Here, p can be interpreted as an indicator of interest rate smoothing. See Sack and Wieland (2000) for a discussion of theoretical justifications for such smoothing.

ATHANASIOS ORPHANIDES : 157
the outlook, there does not exist a consistent record of the "Committee's" quantitative assessment of the economic outlook at the time most decisions are made. However, a detailed record of policy discussions and information presented to the Committee by Federal Reserve Board staff at regularly scheduled meetings is available. Since the end of 1965, when the staff started the systematic preparation of quarterly forecasts for the FOMC, discussion of the outlook of the economy has been organized around these forecasts. Thus, to reflect information regarding the economic outlook as available to the FOMC as closely as possible, I rely on these forecasts and information associated with them. Specifically, for each quarter from 1966Q1 to 1995Q4, I collected information corresponding to the Greenbook prepared during (or, when not available by) the middle month of the quarter.12 For each quarter, I collected information regarding the concepts of "nominal output," "real output," and "potential output" or "output gap," which I used to construct time series for ,,It and Ytlt. This requires some additional specificity because the exact definitions of these con- cepts have changed over time and, at times, multiple concepts have been put forth. The guiding principle I employed was to use, in each quarter, concepts corresponding to the headline concept for real output as defined by the Commerce Department during that quarter. Thus, the data reflect shifts in the concept of nominal output from GNP to GDP during the sample and various redefinitions of real output to correspond to alternative deflators over time.
For potential output, I use the official government estimates corresponding to the relevant concept of real output as available to Federal Reserve staff until 1980 and internal Federal Reserve staff estimates since then. The official government estimates were originally published by the Council of Economic Advisers and the Commerce Department from the early 1960s until 1981. From 1968 to 1976, in particular, monthly updates of the output gap were published in the Commerce Department's publication Business Conditions Digest. For several quarters from 1978 to 1981, when I could compare directly the quarterly output gaps at the Federal Reserve to the official government estimates, the data confirmed that the Federal Reserve Board staff relied on the official estimates as long as they were available. The occasional numerical references to the output gap during FOMC meetings in earlier years also correspond to the official government estimates. (See Orphanides (2000, 2003b) for examples from the Memorandum of Discussion of FOMC meetings.) The evolution of these estimates is described in greater detail in Orphanides (2003b). In general, the underlying model for potential output during my sample was a segmented/time- varying trend. The specific construction methods and assumptions varied over time. During the 1960s and until 1976, the starting point was Okun's (1962) analysis, though the estimates themselves underwent several revisions, as documented in various issues of the Economic Report of the President. From 1977 onward, the starting point was Clark's (1979) analysis (which was originally done in late 1976)
12. I start in 1966Q1 because systematic one-quarter ahead forecasts were not presented in the Greenbook before December 1965. I end in 1995Q4 because more recent forecasts were not available to the public at the time the dataset for this study was constructed (in February 2001).
158 : MONEY, CREDIT, AND BANKING
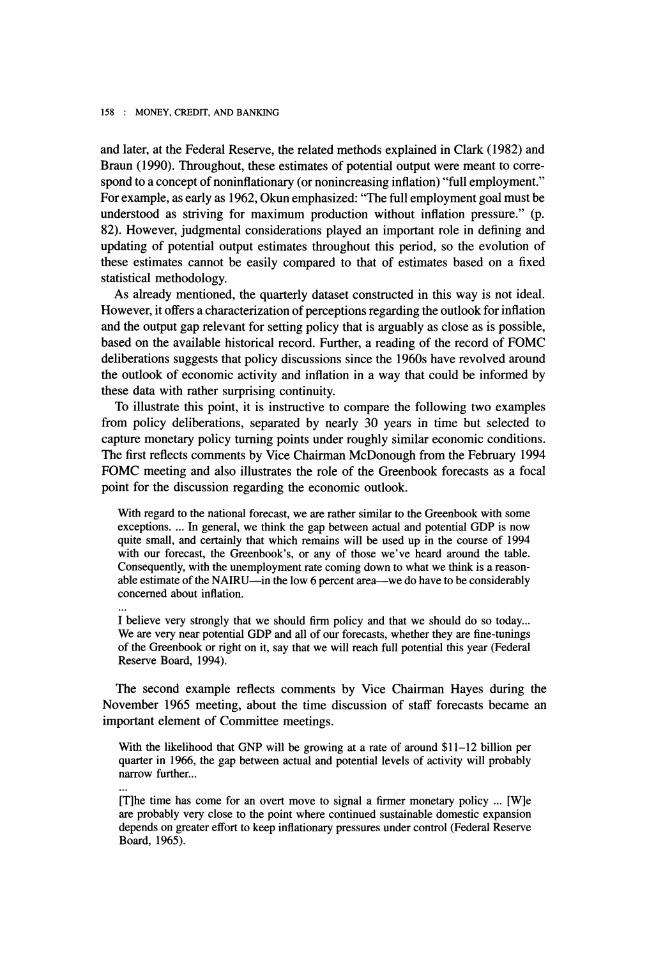
and later, at the Federal Reserve, the related methods explained in Clark (1982) and Braun (1990). Throughout, these estimates of potential output were meant to corre- spond to a concept of noninflationary (or nonincreasing inflation) "full employment." For example, as early as 1962, Okun emphasized: "The full employment goal must be understood as striving for maximum production without inflation pressure." (p. 82). However, judgmental considerations played an important role in defining and updating of potential output estimates throughout this period, so the evolution of these estimates cannot be easily compared to that of estimates based on a fixed statistical methodology.
As already mentioned, the quarterly dataset constructed in this way is not ideal. However, it offers a characterization of perceptions regarding the outlook for inflation and the output gap relevant for setting policy that is arguably as close as is possible, based on the available historical record. Further, a reading of the record of FOMC deliberations suggests that policy discussions since the 1960s have revolved around the outlook of economic activity and inflation in a way that could be informed by these data with rather surprising continuity.
To illustrate this point, it is instructive to compare the following two examples from policy deliberations, separated by nearly 30 years in time but selected to capture monetary policy turning points under roughly similar economic conditions. The first reflects comments by Vice Chairman McDonough from the February 1994 FOMC meeting and also illustrates the role of the Greenbook forecasts as a focal point for the discussion regarding the economic outlook.
With regard to the national forecast, we are rather similar to the Greenbook with some exceptions. ... In general, we think the gap between actual and potential GDP is now quite small, and certainly that which remains will be used up in the course of 1994 with our forecast, the Greenbook's, or any of those we've heard around the table. Consequently, with the unemployment rate coming down to what we think is a reason- able estimate of the NAIRU-in the low 6 percent area-we do have to be considerably concerned about inflation.
I believe very strongly that we should firm policy and that we should do so today... We are very near potential GDP and all of our forecasts, whether they are fine-tunings of the Greenbook or right on it, say that we will reach full potential this year (Federal Reserve Board, 1994).
The second example reflects comments by Vice Chairman Hayes during the November 1965 meeting, about the time discussion of staff forecasts became an important element of Committee meetings.
With the likelihood that GNP will be growing at a rate of around $11-12 billion per quarter in 1966, the gap between actual and potential levels of activity will probably narrow further...
[T]he time has come for an overt move to signal a firmer monetary policy ... [W]e are probably very close to the point where continued sustainable domestic expansion depends on greater effort to keep inflationary pressures under control (Federal Reserve Board, 1965).
ATHANASIOS ORPHANIDES 159
Despite some differences, the considerations and rationale for taking policy action in these two instances would appear to be remarkably similar.
These examples also point to the forward-looking nature of policy, confirming that forward-looking specifications for a policy rule are likely most appropriate for describing policy throughout this period. The appropriate horizon is less clear, especially for the early period, so I estimate Equation (1) for four horizons, i = 11,... ,4 . Because early Greenbooks only reported very short-run forecasts, how- ever, the coverage of data for the 1960s and early 1970s is increasingly less complete as the horizon lengthens. Data are missing for 2, 10, 18, and 26 observations respectively for the one-, two-, three- and four-quarter ahead horizons.
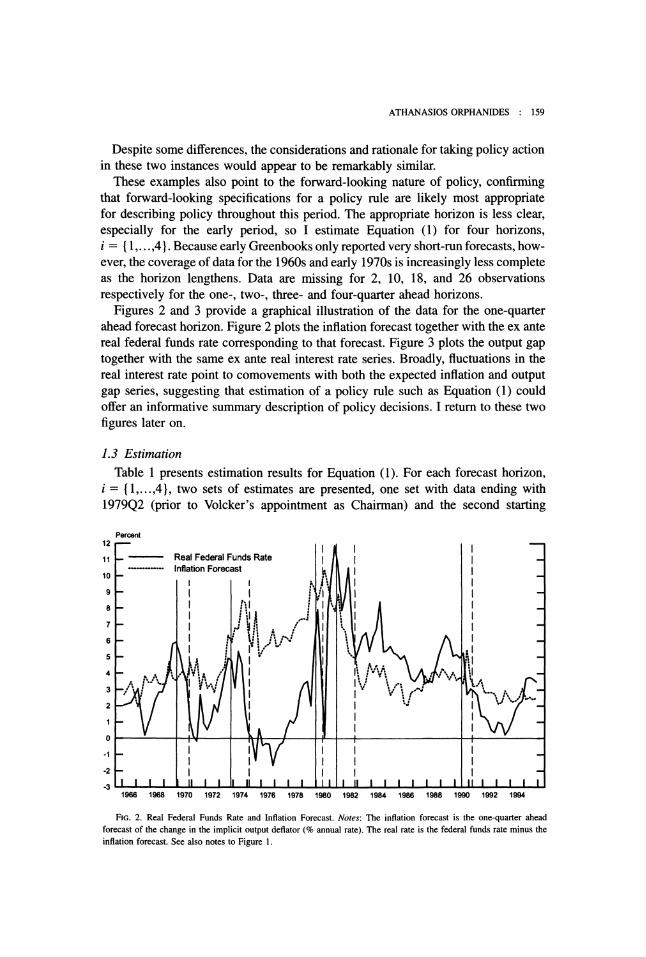
Figures 2 and 3 provide a graphical illustration of the data for the one-quarter ahead forecast horizon. Figure 2 plots the inflation forecast together with the ex ante real federal funds rate corresponding to that forecast. Figure 3 plots the output gap together with the same ex ante real interest rate series. Broadly, fluctuations in the real interest rate point to comovements with both the expected inflation and output gap series, suggesting that estimation of a policy rule such as Equation (1) could offer an informative summary description of policy decisions. I return to these two figures later on.
1.3 Estimation Table 1 presents estimation results for Equation (1). For each forecast horizon,
i = . 1,...,4}, two sets of estimates are presented, one set with data ending with 1979Q2 (prior to Volcker's appointment as Chairman) and the second starting
Percent 12 I.-
11 - Real Federal Funds Rate - ............. Inflation Forecast j 1
9 - 8- II I_
5I -
A IV ?i"t,.~ n'~~~Il - 3 ?v~I
-2 I -
- 3 II I I I II I I ! I I I II I I I I I I I II 1966 1968 1970 1972 1974 1976 1978 1980 1982 1984 1986 1988 1990 1992 1994
FIG. 2. Real Federal Funds Rate and Inflation Forecast. Notes: The inflation forecast is the one-quarter ahead forecast of the change in the implicit output deflator (% annual rate). The real rate is the federal funds rate minus the inflation forecast. See also notes to Figure 1.

160 : MONEY, CREDIT, AND BANKING
Percent 12 -
10 -
8 -
6 -
4 -
2
0 A-\
-2 -
-4 -
-6-
-8 -
-10 -
-12 -
-14 -
-16 -
-18 1 I I I
II I. I ~ i -,
I, ^-V- ( \i / - j _ t,
r
IW e I I I I,,. ' I v / I :1 rI 'I eI: '. I _
I . l Real Rate - I i ............. OutputGap I
I I I I I I I I I I I I II I I I I I I I II I I I I r h i il i i ii l i a a a a a a al a a a a a ii a l I F
1966 1968 1970 1972 1974 1976 1978 1980 1982 1984 1986 1988 1990 1992 1994
FIG. 3. Real Federal Funds Rate and Output Gap. Notes: The output gap shown is based on within-quarter forecasts
for the quarter shown. See also notes to Figures 1 and 2.
with 1979Q3. Following CGG (2000), the estimates in Table 1 are based on a
specification with two lags of the federal funds rate (n = 2). Similar results (not shown) are obtained with n = 1 and also with larger n. The last column, p, shows the
p-value of the Breusch-Godfrey test for serial correlation. Three observations are in order. First, for both samples, the estimated policy rules
fit the data about as well and suggest rather similar policy responses to the output gap and expected inflation for the alternative forecast horizons. Second, concentrating on the estimated response to inflation, P, the estimates exceed one in both samples and are only somewhat higher in the sample starting with Volcker's appointment. In this sense, the policy response to expected inflation appears broadly similar in both periods. Third, concentrating on the estimated response to the output gap, y, estimates for the 1960s and 1970s are more than twice as large as the corresponding estimates for the sample starting with Volcker's appointment.13 In this sense, policy appears to have been more activist during the Great Inflation than later.
To examine more precisely whether and how the policy rules for the two periods differ in a statistically significant sense, I estimated Equation (1) for the whole sample and examined restrictions on the constancy of some or all of the policy rule parameters in the two periods. Results are reported in Table 2. Examining all
parameters (first row in the table) suggested rejections of the joint constancy hypothe- sis. Examining the parameters one at a time, while restricting remaining parameters to be constant across periods (rows 2-5), suggested a significant difference in only
13. Similar results are obtained if the reserve targeting period, 1979-82, is excluded from the sample.

ATHANASIOS ORPHANIDES : 161
TABLE 1
ESTIMATED POLICY RULES
a 5 Y P P2 SEE p2
i= 1 1966:1-1979:2 1.95 1.49 0.46 0.68 -0.26 0.86 0.87 0.02
(1.27) (0.38) (0.13) (0.07) (0.14) 1979:3-1995:4 1.20 1.89 0.18 0.77 -0.08 1.37 0.89 0.56
(2.10) (0.64) (0.20) (0.10) (0.19) i=2 1966:1-1979:2 2.40 1.54 0.53 0.66 -0.21 0.87 0.87 0.06
(1.43) (0.39) (0.12) (0.08) (0.09) 1979:3-1995:4 0.92 1.97 0.18 0.76 -0.06 1.37 0.89 0.57
(2.04) (0.60) (0.20) (0.09) (0.12) i=3 1966:1-1979:2 2.19 1.59 0.53 0.68 -0.22 0.96 0.85 0.20
(1.82) (0.43) (0.15) (0.08) (0.12) 1979:3-1995:4 0.60 2.04 0.15 0.74 -0.04 1.35 0.89 0.90
(1.77) (0.52) (0.19) (0.06) (0.12) i=4 1966:1-1979:2 3.36 1.48 0.57 0.71 -0.12 1.08 0.83 0.17
(2.02) (0.47) (0.26) (0.10) (0.13) 1979:3-1995:4 0.30 2.12 0.14 0.73 -0.04 1.32 0.90 0.89
(1.61) (0.48) (0.18) (0.05) (0.10)
NOTES: The table presents NLLS estimates of: f = (1 - p)(a + Pnt,il, + yYtlt) + p(L)f,- + %rt for i E {1,2,3,4}. Robust standard errors in parentheses. p(L) = pi + p2L and p = Pi + P2 f, is the federal funds rate (annual effective yield, % per year), y,lt the output gap estimate for quarter t (%), and T,il, the forecast of inflation from quarter t to quarter t + i (% per year). All regressions for the 1979:3-1995:4 sample have 66 observations. For the 1966:1-1979:2 sample, 52, 44, 36, and 28 observations are available for the one-, two-, three- and four-quarter ahead forecast horizons, respectively.
one parameter, y. Allowing y to vary, and examining the remaining parameters individually (rows 6-8) did not suggest evidence for a difference in additional parameters. Based on these results, Table 3 presents the results from estimation of Equation (1) with fixed parameters over the 1966:1-1995:4 period, allowing only for variation on y. As can be seen, for all horizons, the response to the output
TABLE 2
p-VALUES OF SUBSAMPLE STABILITY TESTS
Forecast horizon
Parameters 1 2 3 4
1 All 0.034 0.033 0.010 0.016 2 a 0.076 0.176 0.077 0.084 3 P 0.129 0.185 0.079 0.061 4 y 0.005 0.003 0.001 0.000 5 p 0.211 0.134 0.220 0.564 6 a (y varies) 0.999 0.518 0.645 0.862 7 P (y varies) 0.964 0.732 0.842 0.831 8 p (y varies) 0.734 0.546 0.746 0.804
NOTES: The entries reflect p-values of parameter stability tests across the subsamples 1966:1-1979:2 and 1979:3-1995:4. Columns correspond to the four alternative forecast horizons examined. For each horizon, row 1 examines the hypothesis of joint constancy of all parameters as shown in Table 1. Rows 2-5 examine the hypothesis that the specific parameter shown is constant, under the assumption that remaining parameters are constant. Rows 6-8 examine the hypothesis that the specific parameter shown is constant when y is allowed to vary and remaining parameters are constant.

162 : MONEY, CREDIT, AND BANKING
TABLE 3
ESTIMATED POLICY RULES 1966:1-1995:4
a a Y P P2 SEE R2 p
= 1 1.41 1.77 0.61 -0.52 0.73 -0.14 1.16 0.90 0.37 (1.57) (0.46) (0.16) (0.19) (0.07) (0.15)
i = 2 1.34 1.86 0.64 -0.52 0.72 -0.11 1.18 0.89 0.30 (1.57) (0.44) (0.14) (0.18) (0.06) (0.11)
i= 3 0.93 1.94 0.64 -0.54 0.72 -0.09 1.21 0.89 0.58 (1.46) (0.42) (0.14) (0.16) (0.05) (0.11)
i = 4 0.64 2.04 0.63 -0.51 0.73 -0.05 1.23 0.89 0.29 (1.43) (0.42) (0.14) (0.15) (0.04) (0.09)
NOTES: The table presents NLLS estimates of: f, = (1 - p)( + Pjt,il, + (y + Dy)y,t,) + p(L)f_- + 'l,, where D is a dummy variable that equals zero until 1979Q2 and one afterward. See also notes to Table 1.
gap was significantly smaller in the sample starting with Volcker's appointment as Chairman.
Figure 4 plots the notional targets implied by the parameter estimates for the one- quarter ahead inflation. These permit a counterfactual comparison of the suggested setting for the federal funds rate, conditioning on the outlook for inflation and eco- nomic activity perceived at each quarter from 1966Q1 to 1995Q4. One interesting observation is that the two rules are not very different in the first few and last several years in the sample. They do differ substantially from about 1974 to about 1985, with the rule estimated for the pre-Volcker period providing systematically easier policy prescriptions. The main difference, again, is that the rule estimated for the period
Percent 20
19 - Federal Funds Rate 18 - ..---.. 1966:1-1979:2 17 - 1979:3-1995:4 16-
153 4
1 - 3
14 I
~8~~~~~ 5- 2 ... ii .Jj. i. /
I .t ..' '..
'- ^: v :~~~~~~~~~~~~~~~~~~I
1966 1968 1970 1972 1974 1976 1978 1980 1982 1984 1986 1988 1990 1992 1994
FIG. 4. Federal Funds Rate and Estimated Notional Targets. Notes: The estimated notional targets correspond to the estimates for the one-quarter ahead horizon (i = 1) shown in Table 1. The vertical line indicates the sample break
ATHANASIOS ORPHANIDES : 163
after Volcker's appointment, would not have suggested as large a policy ease as was adopted in practice in response to the severe downturn and recovery associated with the 1974 recession. Similarly, it did not suggest as large a policy ease as the earlier rule would have suggested in response to the downturn and recovery associ- ated with either the 1980 or 1982 recessions. This tighter policy, of course, was the driving force behind the stabilization of inflation in the early 1980s.
In summary, the estimated policy rules suggest broad similarities in policy before and after Volcker's appointment as Chairman in 1979, with only a rather subtle (though not unimportant) difference, a reduced response to perceived output gaps.
2. INTERPRETATION
2.1 Output Gap Misperceptions Given the importance of the policy response to perceived output gaps apparent
in the estimation results above, it is useful to examine the evolution of these perceptions over time in order to gain a better understanding of the historical evolution of policy.
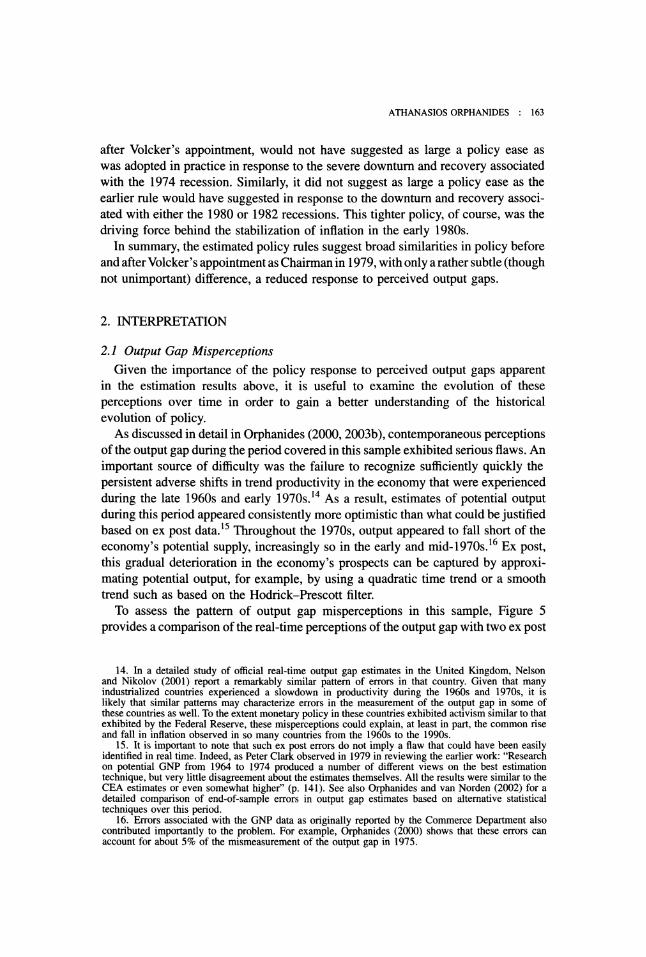
As discussed in detail in Orphanides (2000, 2003b), contemporaneous perceptions of the output gap during the period covered in this sample exhibited serious flaws. An important source of difficulty was the failure to recognize sufficiently quickly the persistent adverse shifts in trend productivity in the economy that were experienced during the late 1960s and early 1970s.'4 As a result, estimates of potential output during this period appeared consistently more optimistic than what could be justified based on ex post data.15 Throughout the 1970s, output appeared to fall short of the economy's potential supply, increasingly so in the early and mid-1970s.16 Ex post, this gradual deterioration in the economy's prospects can be captured by approxi- mating potential output, for example, by using a quadratic time trend or a smooth trend such as based on the Hodrick-Prescott filter.
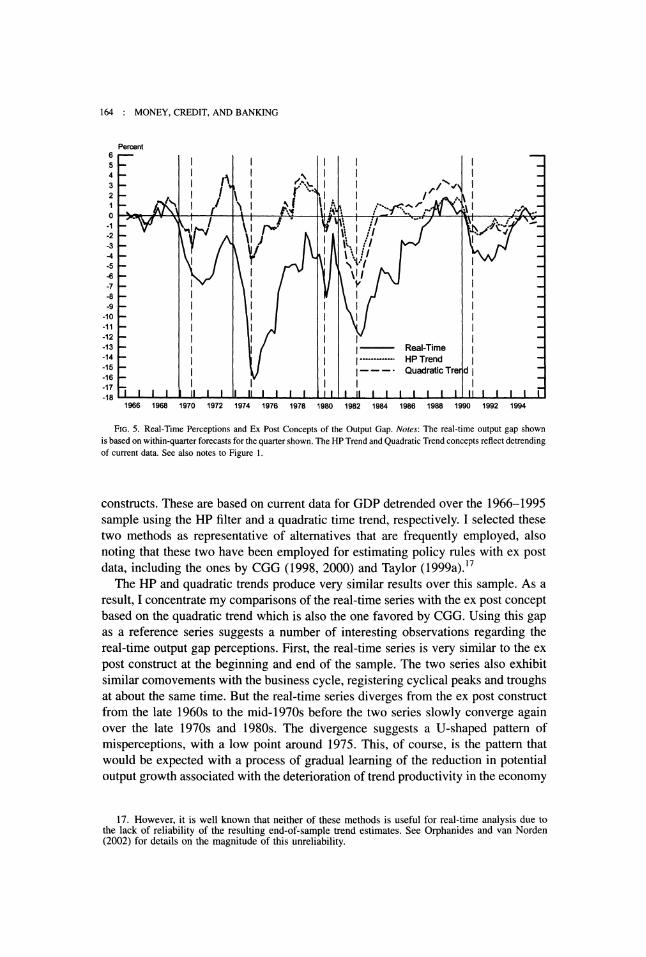
To assess the pattern of output gap misperceptions in this sample, Figure 5 provides a comparison of the real-time perceptions of the output gap with two ex post
14. In a detailed study of official real-time output gap estimates in the United Kingdom, Nelson and Nikolov (2001) report a remarkably similar pattern of errors in that country. Given that many industrialized countries experienced a slowdown in productivity during the 1960s and 1970s, it is likely that similar patterns may characterize errors in the measurement of the output gap in some of these countries as well. To the extent monetary policy in these countries exhibited activism similar to that exhibited by the Federal Reserve, these misperceptions could explain, at least in part, the common rise and fall in inflation observed in so many countries from the 1960s to the 1990s.
15. It is important to note that such ex post errors do not imply a flaw that could have been easily identified in real time. Indeed, as Peter Clark observed in 1979 in reviewing the earlier work: "Research on potential GNP from 1964 to 1974 produced a number of different views on the best estimation technique, but very little disagreement about the estimates themselves. All the results were similar to the CEA estimates or even somewhat higher" (p. 141). See also Orphanides and van Norden (2002) for a detailed comparison of end-of-sample errors in output gap estimates based on alternative statistical techniques over this period.
16. Errors associated with the GNP data as originally reported by the Commerce Department also contributed importantly to the problem. For example, Orphanides (2000) shows that these errors can account for about 5% of the mismeasurement of the output gap in 1975.
164 : MONEY, CREDIT, AND BANKING
Percent 6- - - 5- I I
413 - I N I I -
-14 - I * Trn I
-i II /' "t i eBf ?i-? rI *-
6-1 : J . /--/ Quadratic Trend:
-6
-8 -9 -
-10 -11 - -12 '-
-13 5. Real-Time -14
o w f f t q P Trend
-1s e usig te HP fir ad a uadratic Trend l -16 - -17- I I I -18 II I I I II I I I I I I I II I I I I I I I Ii
1966 1968 1970 1972 1974 1976 1978 1980 1982 1984 1986 1988 1990 1992 1994
FIG. 5. Real-Time Perceptions and Ex Post Concepts of the Output Gap. Notes: The real-time output gap shown
is based on within-quarter forecasts for the quarter shown. The HP Trend and Quadratic Trend concepts reflect detrending of current data. See also notes to Figure 1.
constructs. These are based on current data for GDP detrended over the 1966-1995 sample using the HP filter and a quadratic time trend, respectively. I selected these two methods as representative of alternatives that are frequently employed, also noting that these two have been employed for estimating policy rules with ex post data, including the ones by CGG (1998, 2000) and Taylor (1999a).17
The HP and quadratic trends produce very similar results over this sample. As a result, I concentrate my comparisons of the real-time series with the ex post concept based on the quadratic trend which is also the one favored by CGG. Using this gap as a reference series suggests a number of interesting observations regarding the real-time output gap perceptions. First, the real-time series is very similar to the ex post construct at the beginning and end of the sample. The two series also exhibit similar comovements with the business cycle, registering cyclical peaks and troughs at about the same time. But the real-time series diverges from the ex post construct from the late 1960s to the mid-1970s before the two series slowly converge again over the late 1970s and 1980s. The divergence suggests a U-shaped pattern of misperceptions, with a low point around 1975. This, of course, is the pattern that would be expected with a process of gradual learning of the reduction in potential output growth associated with the deterioration of trend productivity in the economy
17. However, it is well known that neither of these methods is useful for real-time analysis due to the lack of reliability of the resulting end-of-sample trend estimates. See Orphanides and van Norden (2002) for details on the magnitude of this unreliability.
ATHANASIOS ORPHANIDES : 165
that was experienced during the late 1960s and early 1970s.18 One would also expect that such misperceptions would lead to systematic errors in inflation forecasts. Indeed, as can be seen in Figure 6, inflation forecasts systematically underpredicted inflation during the late 1960s and early 1970s.19
Elements of this comparison prove useful as a device for reconciling differences in alternative interpretations of the historical evolution of policy and macroeco- nomic outcomes.
2.2 Correlations and Biases The estimated policy parameters of a linear policy reaction function such as
Equation (1), reflect the correlation patterns of the underlying data. One way to understand differences between the results in Table 1 and those based on ex post constructed data is to compare relevant correlations of the real-time and ex post constructs. Consider, for example, alternative estimates of the parameter 3 which is the critical parameter for the hypothesis that the policy response to inflation was perverse during the period before Volcker's appointment. To that end, compare the estimates for the one-quarter ahead inflation forecast, the case i = 1 in Table 1, with the corresponding estimates reported by CGG using quadratic trend concepts of the output gap.20 CGG (1998, p. 12) and CGG (2000, p. 160) report estimates of 0.80 and 0.75 for P, respectively. By contrast, the estimate in Table 1 above is about twice as large, 1.49.
An important difference, in this case, is associated with the correlation of the output gap with the inflation forecasts. The ex post gap based on quadratic detrending is not correlated with the inflation forecast series. The correlation coefficient in the 1966Q1-1979Q2 sample is 0.04. By contrast, the real-time output gap series exhibits a significant negative correlation with the inflation forecast series i.e., -0.54.21 The implications of this difference on estimated policy parameters are easy to see. Since [3 and Y are positive, if policymakers in real time responded strongly to both expected inflation and the output gap, omitting the real-time gap from the estimation of the policy rule would lead to a downward bias in the estimation of P. And this downward bias in estimating P3 would remain if the ex post construct were used in place of the real-time gap, since the ex post construct is uncorrelated with expected inflation. To illustrate the quantitative significance of this bias, I reestimated Equation (1) imposing the restriction y = 0, that is without the output gap, and also with the two
18. Note that because the sample ends in 1995, these data do not reflect the reversal of this deterioration in trend productivity that was experienced in the late 1990s. Of course, the quadratic detrending concept described here would be totally inappropriate for examining that reversal.
19. This is evident from comparisons of the forecasts with either current data (as shown in the figure) or first published data. Mayer (1999) offers a detailed analysis of the inflation forecast errors during this period.
20. Note that CGG use the subscript t + 1 to denote output produced during period t. Instead, I employ the usual timing convention. Thus, Ytlt refers to the output gap for quarter t which matches the output gap CGG denote with the subscript t + 1 and employ in their baseline specification.
21. This collinearity also explains the relatively large standard errors in Table 1, despite the high overall fit of the regressions.

166 : MONEY, CREDIT, AND BANKING
Percent 15- --
14 - -
13 -
12 - I I Forecast -
11 j -- -- Actual _
9 I i 8- 1 X 1 I -
1 _ I I III I I I -
6- iV
V V
0 I 0 I I I I I Ii I I I I II I II I I I I I I I II I I I I I 1966 1968 1970 1972 1974 1976 1978 1980 1982 1984 1986 1988 1990 1992 1994
FIG. 6. Inflation Forecast and Ex Post Outcomes. Notes: The one-quarter ahead forecast of inflation is from Figure 2. The ex post actual rate of inflation is that shown in Figure 1, shifted one quarter to allow a direct comparison with the forecast.
ex post gap measures. The results, presented in Table 4, show estimates of P below one, confirming the presence of a substantial downward bias in the estimation of P in this case.
Returning to Figures 2 and 3, concentrating on the movements of expected inflation, the real interest rate and the output gap up to mid-1979, provides a visual rendition of this argument. The data suggest that two forces were pulling increasingly the real interest rate in opposite directions with roughly equal force. While rising inflation suggested that the real rate should be raised, perceptions that the economy was getting further away from its potential suggested a reduction of the real rate was in order. The policy rule estimated for the Great Inflation period indicates that policy responded strongly to both of these concerns, and balanced them nearly
TABLE 4
ESTIMATION WITHOUT AND WITH EX POST OUTPUT GAP
Output gap a p y p P2 SEE R2 p
None 3.06 0.80 0.73 -0.53 0.98 0.83 0.01 (1.43) (0.33) (0.08) (0.13)
Quadratic trend 3.07 0.77 1.26 0.76 -0.19 0.83 0.88 0.11 (1.46) (0.33) (0.47) (0.07) (0.16)
HP trend 2.94 0.83 1.37 0.75 -0.17 0.82 0.88 0.24 (1.37) (0.32) (0.47) (0.07) (0.15)
NOTES: Estimation of Equation (1) over 1966:1-1979:2 sample for i = 1. See also notes to Table 1.

ATHANASIOS ORPHANIDES : 167
one for one. By contrast, the pattern of correlations in the two figures changes somewhat after mid-1979, indicative of the relatively greater emphasis on expected inflation reflected in the estimated policy rule.
2.3 Inflation and Disinflation The strong response to perceived output gaps coupled with the pattern of misper-
ceptions suggested in Figure 4, provide a straightforward explanation for the accelera- tion of inflation, especially during the 1970s. To see this, it is useful to examine how far from the inflation target, n*, the economy would settle if policy responded to an output gap persistently measured with an error equal to -x (defined so that x > 0 measures an overoptimistic assessment of the economy). Recall that in the absence of such a systematic error, the rule implies that in steady state, r* +
* = a + T*. With a persistent error, -x, the corresponding steady state rate of inflation would be 7cx such that r* + c*x = ao + P,T*x - Yx. Bringing these two together yields: n*x - (* = (y/(P - l))x. Thus, the ratio y/(P - 1) provides a useful index of the inflationary consequences of a persistent overoptimistic assessment of the economy, indicating by how much (in percent) inflation would be expected to deviate from its target if the output gap were persistently believed to be 1% below its true value.
The inflationary potential associated with sustained overoptimistic assessments of the economy's potential supply differs importantly for the rules followed during and after the Great Inflation. To illustrate the extent of these differences, Table 5 shows the values for this index corresponding to the policy reaction functions estimated in Table 1. As can be seen, the index has values around 1 for the policy rules describing the Great Inflation but only about one-quarter as high for the post- 1979 sample. (The data reject the hypothesis that the index is constant over the two samples, for all forecast horizons. A similar comparison can also be made using Table 3.) Noting that real-time misperceptions of the output gap averaged -4.9% in the sample to mid-1979 and -3.6% later on, we can use the index to obtain a rough estimate for the extent of the inflationary bias embedded in the policies followed during the two subsamples. Using the index corresponding to the one- quarter ahead forecast horizon suggests an inflationary bias of about 4.6% before
TABLE 5
POLICY ACTIVISM INDEX
Forecast horizon
1 2 3 4
1966:1-1979:2 0.94 0.98 0.90 1.19 (0.55) (0.57) (0.53) (0.88)
1979:3-1995:4 0.21 0.19 0.15 0.12 (0.24) (0.22) (0.17) (0.14)
NOTES: The index is computed as y/(p - 1). Entries are based on the parameter estimates shown in Table 1 for the corresponding forecast horizons and sample periods. Standard errors in parentheses.
168 : MONEY, CREDIT, AND BANKING
mid-1979. That is, if policymakers implemented policy aiming toward a long- run inflation target of 2%, their actions were actually pushing the economy to an inflation rate above 6%. This bias would have been much smaller, about 1%, if the
policy rule describing the post-1979 period was in place. Likewise, the inflationary bias for the post-1979 period is only 0.8%, but would have been considerably larger, about 3.4%, had the policy rule describing the pre-1979 period been in place. Thus, there were significant differences in the two policy rules which have important implications for understanding the Great Inflation and subsequent disinflation.
2.4 Stop-Go Policy Instability In addition to generating high average inflation, the excessive activism exhibited
by policy during the Great Inflation, coupled with the increasingly optimistic assess- ments of potential economic activity in the early 1970s, increased instability in the economy. Mixing these two ingredients is essential for understanding the problem. Under ideal conditions, activist policies such as followed during the Great Inflation could be efficient and result in greater stability than policies placing less emphasis on perceived output gaps. However, this requires a solid understanding of the structure of the economy and reliable assessments of the economy's potential. With that in place, deviations of actual output from potential output can, in principle at least, be a useful guide for setting policy. But what if this guide is error prone, as happened so systematically during the 1970s? Then, following the activist policies deemed efficient under the presumption of accuracy, can lead policymakers to a futile chase of the wrong target. The result is a pattern of stop-go policy reversals that retrospectively appear to be out of sync with the economic fundamentals. Retro-
spectively, policy keeps falling "behind the curve." A formal accounting of the role of persistent output gap misperceptions in generat-
ing instability, when policy follows an activist interest rate policy rule such as Equation (1), requires comparisons based on an estimated model and estimates of the persistence and magnitude of historical misperceptions. Orphanides (2003a) presents such comparisons and his results provide a useful perspective for the differences one could expect from the rules estimated here before and after Volcker's
appointment. The model is sufficiently simple so that policy rules such as Equation (1) are optimal for a policymaker who values inflation and output stability. Using the 1980s and early 1990s as a benchmark period, Orphanides shows the degree of instability induced when policy follows an activist rule that is optimal with perfect information when, in fact, mismeasurement is present, and computes efficient rules that properly account for mismeasurement. To illustrate the differences in the alternative rules, it is useful to compare how activist they are in terms of the index described earlier, y/(P - 1). For a policymaker who places equal emphasis on infla- tion and output stability, the optimal rule with perfect information has an index value of 0.84.22 This compares with 0.47 for the efficient rule in the presence of
22. This is based on the values reported in Table 3 for the preference weight o = 0.5 in Orphanides (2003a). The index monotonically increases with the relative preference toward greater output stability.
ATHANASIOS ORPHANIDES : 169
mismeasurement such as seen in the data in the 1980s and early 1990s. And while the more activist rule is by design optimal under perfect information, it yields asymptotic standard deviations for inflation and output that are about 10% higher than those corresponding to its less activist counterpart.23 These comparisons suggest that the reduction in policy activism that followed Volcker's appointment could explain, at least in part, the improved performance of the economy during the Long Boom.
An intuitive understanding of the "stop-go" problem, as it applies to the 1970s, can be gained simply by returning to Figure 5 and relating the path of policy to the output gap as perceived in real time, and as suggested by the ex post constructs. A useful starting point is the recession of 1970. At the turn of the year, as signs of a recession appeared, monetary policy started on a path of policy easings to restore economic growth. But how long could policy maintain an expansionary stance without facing a threat of worsening inflation from an overheated economy? Looking at the ex post constructs in Figure 5, by early 1972 output had returned to its trend and the expansionary stance should have been long reversed. Based on the real-time perceptions of the output gap, however, the economy did not appear overexpanded even much later. The resulting policy activism ignited inflation-the go phase of the policy error. With inflation rising, policy tightened significantly by late 1973, raising the real rate to about 4%. Also, with the economy already overextended, this action could only bring about a recession-the stop phase of the policy error.24
In retrospect, by inappropriately chasing after an output target that was too high relative to the economy's potential, policy inadvertently pushed the economy beyond its potential, fueling inflation, prompting an abrupt tightening which precipitated a recession only to start the cycle once again.
3. WHAT HAPPENED IN 1979?
The cycle of "stop-go" policy errors was to be repeated once more near the end of the 1970s. In 1977, when output had returned to its trend, according to the ex post constructs presented in Figure 5, real interest rates were about zero. Perceptions in real time, however, did not suggest that the economy was overheated. Once again,
23. The efficient degree of policy activism varies greatly with the magnitude of mismeasurement. Thus, with greater mismeasurement, such as in the 1970s, the efficient policy is even less activist and the performance loss associated with the activist rule greater. On the other hand, with better measurement more activist rules would be efficient. Thus, if a reduction in the volatility of the economy (as suggested in the studies mentioned in Note 1) reduces the variance of Ytlt and its associated measurement error, more activist rules would be efficient relative to the rules that would be efficient for the 1970s or 1980s.
24. Surely, the energy crisis and other shocks contributed importantly to the dismal outcomes of 1974 and 1975. The argument here simply points out that at least part of the inflationary problem and economic slowdown can be traced to the earlier policy mistakes. Barsky and Kilian (2001), Lansing (2001), and Orphanides (2003b) provide counterfactual model simulations that attribute a large part of the problem during this period to such policy errors. Barsky and Kilian, in particular, argue that the energy crisis itself was likely an endogenous response to the policy driven overheating of the economy.

170 : MONEY, CREDIT, AND BANKING
by responding to these perceived gaps, policy kept real interest rates too low for too long.
In the second half of 1978, the FOMC recognized that the pace of economic expansion was too rapid while inflationary pressures were not abating. A weakening dollar elevated concerns that inflation and inflation expectations would remain high even if economic growth were to be brought down in line with the economy's potential supply. Reflecting these concerns, the Committee raised interest rates in a series of policy moves, aiming to curb inflation in the following year.
The situation at the turn of the year was described in the first Humphrey-Hawkins Report, submitted to the Congress on February 20, 1979:
The narrowing of the gap between actual and potential output implies that a tighter hold on the nation's aggregate demand for goods and services is necessary if inflationary forces are to be contained.
Real GNP increased 4.3 percent from the fourth quarter of 1977 to the fourth quarter of 1978-a bit slower than the average pace over the earlier part of the expansion, but still well above the trend growth of potential output in the economy (p. 33-34).25
The Committee's outlook in the report exhibited cautious optimism, noting that "...it should be possible to slow the pace of expansion-and thereby relieve inflationary pressures-without prompting a recession." (p. 54). However, as the Record of Policy Actions for the February Meeting revealed soon after, some members harbored less sanguine views of the outlook. On one side, "a few members ... suggested that the onset of a recession before the end of the year ... was the most likely development" (p. 128). But others recognized a serious danger that inflation could intensify further.
Both risks appeared well justified. As the year progressed, the Committee was once again facing the dilemma of stagflation. Already by March, both inflation and economic weakness risks had deteriorated. The record of the March 20 meeting indicates that "many members" (as opposed to the "few members" who had expressed a similar concern in February) "believed that the chances of a recession beginning before the end of the year or in early 1980 were fairly high" (p. 138). Regarding the inflation outlook, significant disagreements became evident. One view was that the "slackening of economic activity later in the year could be expected to slow the rise of prices generally," but another view was that "inflation would remain rapid even during a recession," (p. 139). The meeting concluded with a decision not to change policy, but on a very close vote, with six votes in favor of the adopted directive, and four dissents in favor of a more restrictive policy. Incoming data prior to the April 17 and May 22 FOMC meetings continued to reinforce both concern of additional economic weakness and concerns regarding heightened inflation. In May, this resulted in an unusual split of the vote, with two dissents favoring an easing and one favoring a tightening.
25. Page numbers for references to the Humphrey-Hawkins reports, and Records of Policy Actions for FOMC meetings during 1979 refer to the Annual Report for 1979, Federal Reserve Board (1980a).

ATHANASIOS ORPHANIDES : 171
By the July 11 meeting, the situation appeared to have markedly deteriorated on both fronts. According to the record for the meeting, "no member of the Committee expressed disagreement with the staff appraisal that real gross national product had declined somewhat in the second quarter and that further declines were likely for the remaining two quarters of the year" (p. 171). The Humphrey-Hawkins Report, submitted to the Congress on July 17, noted that the consensus projection of Board members for real GNP growth for 1979 was -2 to -1/2%. Despite this dismal outlook, however, inflationary concerns were getting even worse, and started to shift the Committee's view of the balance of risks squarely in that direction. Among a number of factors cited for intensified inflationary pressures, most important was continuing unexpected increases in oil prices, and a decline in the value of the dollar.
In some ways, July 1979 marked a small but important turning point. Despite the view that the economy was likely already in recession, by the end of the month the Committee had raised the federal funds rate twice, first on July 19 and then again on July 27. Soon after, starting with Paul Volcker's first meeting as chair- man on August 14, the Committee moved even more decidedly in a tightening direction, despite the fact that the outlook for the economy appeared, if anything, even more uncertain. The Policy Record of the August 14 meeting offers a glimpse of the unpleasant choices:
In considering policy for the period immediately ahead, Committee members focused on the problems posed by emerging recession and its potential for substantial increases in unemployment, concurrent with strong monetary growth, high actual and expected rates of inflation, and an exposed position of the dollar in foreign exchange markets pending anticipated improvement in the U.S. foreign trade and current accounts. Any policy course in these circumstances necessarily involved unusual risks: prompt pursuit of a policy aimed at moderating the effects of the curtailment in output could be perceived as exacerbating inflation and thus could have perverse effects on economic activity and employment; a policy directed toward moderating inflation and lending support to the dollar in the foreign exchange markets could risk intensifying the recession (p. 183).
By moving decisively toward tightening, the Committee demonstrated that during the course of the summer policy had shifted in a subtle way, from the reluctance to raise interest rates in the face of concerns of economic weakness, to a focus on inflation. By October, the famous change in operating procedures further solidified this focus of policy toward reigning in inflation and set the economy toward a path of disinflation.
Looking back, the delay in tightening policy during the first half of the year proved a costly mistake. Despite all the fears and concerns, the widely anticipated recession that kept the Committee from tightening during the first half of the year did not arrive. Despite the pessimism and gloomy forecasts for 1979, the economy grew in every quarter. By not tightening, the Committee compounded its earlier errors, allowing inflation to accelerate further only to postpone and raise the costs of restoring stability.
But this lesson was not lost on the Committee. In his first Humphrey-Hawkins testimony, on February 19, 1980, Chairman Volcker explained the subtle policy shift that had taken place:

172 : MONEY, CREDIT, AND BANKING
In the past, at critical junctures for economic stabilization policy, we have usually been more preoccupied with the possibility of near-term weakness in economic activity or other objectives than with the implications of our actions for future inflation. To some degree, that has been true even during the long period of expansion since 1975. As a consequence, fiscal and monetary policies alike too often have been prematurely or excessively stimulative, or insufficiently restrictive. The result has been our now chronic inflationary problem, with a growing conviction on the part of many that this process is likely to continue.
The broad objective of policy must be to break that ominous pattern. That is why dealing with inflation has properly been elevated to a position of high national priority. Success will require that policy be consistently and persistently oriented to that end. Vacillation and procrastination, out of fears of recession or otherwise, would run grave risks. Amid the present uncertainties, stimulative policies could well be misdirected in the short run; more importantly, far from assuring more growth over time, by aggravating the inflationary process and psychology they would threaten more instability and unemployment. (Federal Reserve Board 1980b, p. 214)
It is easy to understate the significance of the change Volcker articulated in this testimony. As the NBER later confirmed, the economy had already peaked in January and was in recession during the first half of 1980. But by then, the Chairman was not about to recommend repeating the policy errors of the recent past. The Committee had recognized that long-term stability required setting short-run output stabilization concerns aside.
4. CONCLUSION
In retrospect, there is little doubt that monetary policy during the Great Inflation was too activist, placing too much emphasis on short-run stabilization of economic activity at the expense of the Federal Reserve's long-term price stability objective. However, policy was not flawed in an obvious manner; indeed, it would appear entirely reasonable from the perspective of many modem policy-evaluation analyses. In theory, the activist approach to monetary policy that was followed during the Great Inflation would be workable, if only policymakers could have a solid under- standing of the structure of the economy and reliable readings of the state of the economy upon which to base their actions. But what works in theory, often works in theory only. In reality, policymakers did not possess the knowledge necessary for an activist approach to monetary policy. Regrettably, they also lacked an apprecia- tion of their ignorance. Despite the best of intentions, monetary policy itself became the engine of inflation and a source of instability during the Great Inflation.
The subtle policy change in 1979 reflected a shift to more modest but attainable goals. Reducing the excessive emphasis on stabilizing the level of economic activity around its uncertain potential and concentrating instead on the inflation outlook for policy guidance provided the foundation for stable sustainable growth. This allowed the economy to progress unimpeded-the Long Boom.
ATHANASIOS ORPHANIDES : 173
LITERATURE CI'IE)
Ahmed, Shaghil, Andrew Levin, and Beth Anne Wilson (2001). "Recent U.S. Macroeconomic Stability: Good Luck, Good Policies, or Good Practices?" Federal Reserve Board.
Amato, Jeffery, and Thomas Laubach (1999). "Forecast-based Monetary Policy." Mimeo.
Ball, Laurence (1999). "Policy Rules for Open Economies." In Monetary Policy Rules, edited by J. B. Taylor, pp. 127-144. Chicago: University of Chicago.
Barsky, Robert B., and Lutz Kilian (2001). "A Monetary Explanation of the Great Stagflation of the 1970s." Mimeo.
Batini, Nicoletta, and Andrew Haldane (1999). "Forward-Looking Rules for Monetary Policy." In Monetary Policy Rules, edited by J. B. Taylor. Chicago: University of Chicago.
Batini, Nicoletta, and Edward Nelson (2000). "Optimal Horizons for Inflation Targeting." Bank of England Working Paper No. 119.
Beranke, Ben S., and Frederic S. Mishkin (1997). "Inflation Targeting: A New Framework for Monetary Policy?" Journal of Economic Perspectives 11, 97-116.
Bemanke, Ben, Thomas Laubach, Frederic Mishkin, and Adam Posen (1998). Inflation Targeting: Lessons From the International Experience. Princeton, NJ: Princeton Univer- sity Press.
Blanchard, Olivier, and John Simon (2001). "The Long and Large Decline in U.S. Output Volatility." Brookings Panel on Economic Activity 1, 135-164.
Blinder, Alan (1979). Economic Policy and the Great Stagflation. San Francisco: Aca- demic Press.
Blinder, Alan (1997). "What Central Bankers Could Learn From Academics-and Vice Versa." Journal of Economic Perspectives 11, 3-20.
Braun, Steven (1990). "Estimation of Current-Quarter Gross National Product by Pooling Preliminary Labor-Market Data." Journal of Business and Economic Statistics 8, 293-304.
Christiano, Lawrence, and Christopher Gust (2000). "The Expectations Trap Hypothesis." In Money, Monetary Policy, and Transmission Mechanisms, Bank of Canada.
Clarida, Richard, Jordi Gali, and Mark Gertler (1998). "Monetary Policy Rules and Macroeco- nomic Stability: Evidence and Some Theory." NBER Working Paper No. 6442.
Clarida, Richard, Jordi Gali, and Mark Gertler (1999). "The Science of Monetary Policy." Journal of Economic Literature 37, 1661-1707.
Clarida, Richard, Jordi Gali, and Mark Gertler (2000). "Monetary Policy Rules and Macroeco- nomic Stability: Evidence and Some Theory." Quarterly Journal of Economics (February 2000), 147-180.
Clark, Peter K. (1979). "Potential GNP in the United States, 1948-80." Review of Income and Wealth 25, 141-165.
Clark, Peter K. (1982). "Okun's Law and Potential GNP." Board of Governors of the Federal Reserve System, October.
De Long, Bradford (1997). "America's Only Peacetime Inflation: The 1970's." In Reducing Inflation: Motivation and Strategy, edited by C. Romer and D. Romer, pp. 247-276. Chicago: University of Chicago.
Estrella Arturo, and Frederic Mishkin (1999). "Rethinking the Role of NAIRU in Monetary Policy: Implications of Model Formulation and Uncertainty." In Monetary Policy Rules, edited by J. B. Taylor, pp. 405-430. Chicago: University of Chicago.
Fair, Ray C. (2001). "Actual Federal Reserve Policy Behavior and Interest Rate Rules." Federal Reserve Bank of New York Economic Policy Review (March 2001), 61-72.
Federal Reserve Board (1965). FOMC Minutes. Washington D.C.
174 : MONEY, CREDIT, AND BANKING
Federal Reserve Board (1980a). Annual Report for 1979. Washington D.C.
Federal Reserve Board (1980b). Federal Reserve Bulletin. Washington D.C.
Federal Reserve Board (1994). FOMC Transcripts. Washington D.C.
Friedman, Milton (1953). Essays in Positive Economics. Chicago: University of Chicago.
Hetzel, Robert L. (2000). "The Taylor Rule: Is it a Useful Guide to Understanding Monetary Policy?" Federal Reserve Bank of Richmond Economic Quarterly 86, 1-33.
Kahn, James, Margaret M. McConnell, and Gabriel Perez-Quiros (2001). "The Reduced Volatility of the U.S. Economy: Policy or Progress?" Mimeo.
Kerr, William, and Robert G. King (1996). "Limits on Interest Rate Rules in the IS Model." Federal Reserve Bank of Richmond Economic Quarterly 82, 47-76.
Lansing, Kevin (2001). "Learning About a Shift in Trend Output: Implications for Monetary Policy and Inflation." Federal Reserve Bank of San Francisco working paper.
Levin, Andrew, Volker Wieland, and John Williams (1999). "Robustness of Simple Monetary Policy Rules Under Model Uncertainty." In Monetary Policy Rules, edited by J. B. Taylor, pp. 263-299. Chicago: University of Chicago.
Levin, Andrew, Volker Wieland, and John Williams (2000). "The Performance of Forecast- Based Monetary Policy Rules Under Model Uncertainty." Federal Reserve Board.
Mayer, Thomas (1999). Monetary Policy and the Great Inflation in the United States: The Federal Reserve and the Failure of Macroeconomic Policy, 1965-1979. Cheltenham: Edward Elgar.
McCallum, Bennett T. (1999). "Issues in the Design of Monetary Policy Rules." In Handbook of Macroeconomics, edited by J. B. Taylor and M. Woodford, pp. 1483-1530. Amster- dam: Elsevier.
McCallum, Bennett T. (2001). "Should Monetary Policy Respond Strongly to Output Gaps?" Mimeo, Carnegie-Mellon University.
McCallum, Bennett T., and Edward Nelson (1999). "Performance of Operational Policy Rules in an Estimated Semi-classical Structural Model." In Monetary Policy Rules, edited by J. B. Taylor, pp. 15-45. Chicago: University of Chicago.
Meltzer, Allan H. (1987). "Limits of Short-Run Stabilization Policy." Economic Inquiry 25, 1-14.
Nelson, Ed, and Kalin Nikolov (2001). "A Real-Time Output Gap Series for the UK, 1965-2000: Construction, Analysis, and Implications for Inflation." Mimeo, Bank of England.
Nessen, Marianne (1999). "Targeting Inflation Over the Short, Medium and Long Term." Sveriges Riksbank.
Okun, Arthur (1962). "Potential Output: Its Measurement and Significance." In American Statistical Association 1962 Proceedings of the Business and Ecoinomic Section. Washing- ton, D.C.: American Statistical Association.
Orphanides, Athanasios (2000). "Activist Stabilization Policy and Inflation: The Taylor Rule in the 1970s." Finance and Economics Discussion Series, 2000-13, Federal Reserve Board.
Orphanides, Athanasios (2001). "Monetary Policy Rules Based on Real-Time Data."American Economic Review 91, 964-985.
Orphanides, Athanasios (2003a). "Monetary Policy Evaluation With Noisy Information." Journal of Monetary Economics 50, 605-631.
Orphanides, Athanasios (2003b). "The Quest for Prosperity Without Inflation." Journal of Monetary Economics, 50, 633-663.
Orphanides, Athanasios, and David Wilcox (2002). "The Opportunistic Approach to Disinfla- tion." International Finance, 5, 47-71.

ATHANASIOS ORPHANIDES : 175
Orphanides, Athanasios, and Simon van Norden (2002). "The Unreliability of Output Gap Estimates in Real Time." Review of Economics and Statistics 84, 569-583.
Orphanides, Athanasios, and Volker Wieland (2000). "Inflation Zone Targeting." European Economic Review 44, 1351-1387.
Orphanides, Athanasios, Richard Porter, David Reifschneider, Robert Tetlow, and Frederico Finan (2000). "Errors in the Measurement of the Output Gap and the Design of Monetary Policy." Journal of Economics and Business 52, 117-141.
Romer, Christina, and David Romer, editors (1997). Reducing Inflation: Motivation and Strategy. Chicago: University of Chicago.
Rotemberg, Julio, and Michael Woodford (1999). "Interest Rate Rules in an Estimated Sticky Price Model." In Taylor (1999c).
Rudebusch, Glenn, and Lars Svensson (1999). "Policy Rules for Inflation Targeting." In Monetary Policy Rules, edited by J. B. Taylor, pp. 203-253. Chicago: University of Chicago.
Sack, Brian, and Volker Wieland (2000). "Interest-Rate Smoothing and Optimal Monetary Policy: A Review of Recent Empirical Evidence" Journal of Economics and Business 52, 205-228.
Sims, Christopher (1999). "Drift and Breaks in Monetary Policy." Mimeo.
Smets, Frank (2000). "What Horizon for Price Stability?" European Central Bank.
Smets, Frank (2002). "Output Gap Uncertainty: Does it Matter for the Taylor Rule?" Empirical Economics 22, 113-129.
Svensson, Lars E. O. (1997). "Inflation Forecast Targeting: Implementing and Monitoring Inflation Targets." European Economic Review 41, 1111-1146.
Svensson, Lars E. O. (1999). "Inflation Targeting as a Monetary Policy Rule." Journal of Monetary Economics 43, 607-654.
Taylor, John B. (1993). "Discretion Versus Policy Rules in Practice." Carnegie-Rochester Conference Series on Public Policy 39, 195-214.
Taylor, John B., (1998). "The Long Boom." Federal Reserve Bank of St Louis Review (Novem- ber/December 1998), 3-11.
Taylor, John B. (1999a). "An Historical Analysis of Monetary Policy Rules." In Monetary Policy Rules, edited by J. B. Taylor, pp. 319-341. Chicago: University of Chicago.
Taylor, John B. (1999b). "The Robustness and Efficiency of Monetary Policy Rules as Guidelines for Interest Rate Setting by the European Central Bank." Journal of Monetary Economics 43, 655-679.
Wieland, Volker (1998). "Monetary Policy and Uncertainty about the Natural Unemployment Rate." Finance and Economics Discussion Series, 98-22, Board of Governors of the Federal Reserve System.
Williams, John C. (1999). "Simple Rules for Monetary Policy." Finance and Economics Discussion Series, 99-12, Board of Governors of the Federal Reserve System.
Woodford, Michael (2003). Interest and Prices: Foundations of a Theory of Monetary Policy. Princeton, NJ: Princeton University Press.