MONETARY POLICY REVIEW - bi.go.id · M o n e t a r y P o l i c y R e v i e w | 7 57 horticultural...
16
Monetary Policy Review | 1 MONETARY POLICY REVIEW June 2013
Transcript of MONETARY POLICY REVIEW - bi.go.id · M o n e t a r y P o l i c y R e v i e w | 7 57 horticultural...

M o n e t a r y P o l i c y R e v i e w | 1
MONETARY POLICY REVIEW
June 2013

M o n e t a r y P o l i c y R e v i e w | 2

M o n e t a r y P o l i c y R e v i e w | 3

M o n e t a r y P o l i c y R e v i e w | 4

M o n e t a r y P o l i c y R e v i e w | 5

M o n e t a r y P o l i c y R e v i e w | 6

M o n e t a r y P o l i c y R e v i e w | 7
57 horticultural products based on HS Code, 39 products included in CPI Basket (entry pint setting, security aspect, etc) 20 Horticultural products, 14 products included in CPI Basket (RIPH arrangement, temporary import closure) Onions Composit
index

M o n e t a r y P o l i c y R e v i e w | 8

M o n e t a r y P o l i c y R e v i e w | 9

M o n e t a r y P o l i c y R e v i e w | 10
5.75
0
20
40
60
80
100
120
140
160
180
200
3.6
4.1
4.6
5.1
5.6
16-M
ar-1
2
5-Ap
r-12
25-A
pr-1
2
15-M
ay-1
2
4-Ju
n-12
24-J
un-1
2
14-J
ul-1
2
3-Au
g-12
23-A
ug-1
2
12-S
ep-1
2
2-O
ct-1
2
22-O
ct-1
2
11-N
ov-1
2
1-D
ec-1
2
21-D
ec-1
2
10-J
an-1
3
30-J
an-1
3
19-F
eb-1
3
11-M
ar-1
3
31-M
ar-1
3
20-A
pr-1
3
10-M
ay-1
3
30-M
ay-1
3
Vol DF O/N (RHS) Vol PUAB O/N
BI Rate rPUAB O/N
rDF O/N
% Rp T% Rp T% Rp T% Rp T
Avg Vol DF: Rp56,5 TRRT Vol PUAB : Rp12,0 T
rPUAB : 4,16%
11
.49
11
.27
13
.58
11
.49
11
.29
13
.40
11
.45
11
.27
13
.22
11
.44
11
.24
13
.28
11
.44
11
.21
13
.22
11
12
13
14
Sb KMK Sb KI Sb KK
Dec-12
Jan-13
Feb-13
Mar-13
Apr-13
%
(rhs)
Interest rate spread :
Working Capital Investment Consumption
Weighted avg
LPS rate

M o n e t a r y P o l i c y R e v i e w | 11
Apr May Jun Jul Aug Sep Oct Nov Dec Jan Feb Mar Apr
BI Rate 5,75 5,75 5,75 5,75 5,75 5,75 5,75 5,75 5,75 5,75 5,75 5,75 5,75
Deposit Guarantee 5,50 5,50 5,50 5,50 5,50 5,50 5,50 5,50 5,50 5,50 5,50 5,50 5,50
1-month Deposit (Weighted Average) 5,42 5,35 5,39 5,39 5,42 5,40 5,49 5,42 5,58 5,49 5,43 5,51 5,42
Working Capital Credit 11,86 11,78 11,79 11,78 11,73 11,70 11,68 11,61 11,49 11,49 11,45 11,44 11,44
Investment Credit 11,56 11,51 11,46 11,42 11,35 11,36 11,29 11,24 11,27 11,29 11,27 11,24 11,21
Consumption Credit 14,10 14,03 13,90 13,92 13,69 13,67 13,60 13,53 13,58 13,40 13,22 13,28 13,22
20132012Interest Rates (%)
13.4
16.0
4
6
8
10
12
14
0
5
10
15
20
25
30
Jan-
10
Mar
-10
May
-10
Jul-1
0
Sep-
10
Nov
-10
Jan-
11
Mar
-11
May
-11
Jul-1
1
Sep-
11
Nov
-11
Jan-
12
Mar
-12
May
-12
Jul-1
2
Sep-
12
Nov
-12
Jan-
13
Mar
-13
M2 M1 BI Rate (RHS)%, yoy %, yoy
Per April 2013
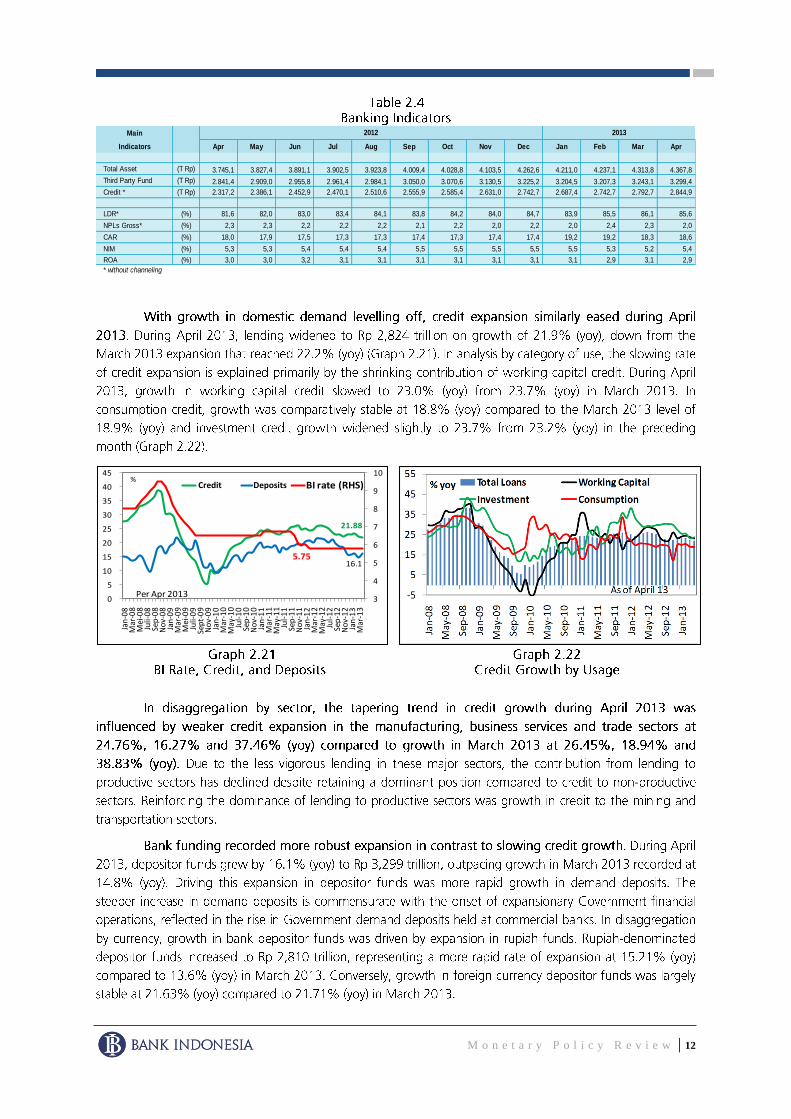
M o n e t a r y P o l i c y R e v i e w | 12
Main
Indicators Apr May Jun Jul Aug Sep Oct Nov Dec Jan Feb Mar Apr
Total Asset (T Rp) 3.745,1 3.827,4 3.891,1 3.902,5 3.923,8 4.009,4 4.028,8 4.103,5 4.262,6 4.211,0 4.237,1 4.313,8 4.367,8
Third Party Fund (T Rp) 2.841,4 2.909,0 2.955,8 2.961,4 2.984,1 3.050,0 3.070,6 3.130,5 3.225,2 3.204,5 3.207,3 3.243,1 3.299,4
Credit * (T Rp) 2.317,2 2.386,1 2.452,9 2.470,1 2.510,6 2.555,9 2.585,4 2.631,0 2.742,7 2.687,4 2.742,7 2.792,7 2.844,9
LDR* (%) 81,6 82,0 83,0 83,4 84,1 83,8 84,2 84,0 84,7 83,9 85,5 86,1 85,6
NPLs Gross* (%) 2,3 2,3 2,2 2,2 2,2 2,1 2,2 2,0 2,2 2,0 2,4 2,3 2,0
CAR (%) 18,0 17,9 17,5 17,3 17,3 17,4 17,3 17,4 17,4 19,2 19,2 18,3 18,6
NIM (%) 5,3 5,3 5,4 5,4 5,4 5,5 5,5 5,5 5,5 5,5 5,3 5,2 5,4
ROA (%) 3,0 3,0 3,2 3,1 3,1 3,1 3,1 3,1 3,1 3,1 2,9 3,1 2,9
* without channeling
20132012
21.88
16.15.75
3
4
5
6
7
8
9
10
0
5
10
15
20
25
30
35
40
45
Jan
-08
Mar
-08
Mei
-08
Juli-
08
Sep
-08
No
v-0
8Ja
n-0
9M
ar-0
9M
ei-0
9Ju
li-0
9Se
pt-
09
No
v-0
9Ja
n-1
0M
ar-1
0M
ay-1
0Ju
l-1
0Se
p-1
0N
ov-
10
Jan
-11
Mar
-11
May
-11
Jul-
11
Sep
-11
No
v-1
1Ja
n-1
2M
ar-1
2M
ay-1
2Ju
l-1
2Se
p-1
2N
ov-
12
Jan
-13
Mar
-13
Kredit DPK BI rate (RHS)%
Per Apr 2013
Credit spread :
Deposits spread :

M o n e t a r y P o l i c y R e v i e w | 13
4
5
6
7
8
9
10
11
0
1000
2000
3000
4000
5000
6000
Jan
-07
Ap
r-0
7Ju
l-0
7O
ct-0
7Ja
n-0
8A
pr-
08
Jul-
08
Oct
-08
Jan
-09
Ap
r-0
9Ju
l-0
9O
ct-0
9Ja
n-1
0A
pr-
10
Jul-
10
Oct
-10
Jan
-11
Ap
r-1
1Ju
l-1
1O
ct-1
1Ja
n-1
2A
pr-
12
Jul-
12
Oct
-12
Jan
-13
Ap
r-1
3
JCI BI RATE
0,7%
-5,7%
-12,5%
-4,4%
-3,3%
-2,2%
13,3%
5,6%
9,4%
17,1%
-15% -10% -5% 0% 5% 10% 15% 20%
IHSG
Infrastructure
Mining
Finance
Basic Industry
Misc. Industry
Consumption
Trade
Agriculture
Property
Monthly Changes

M o n e t a r y P o l i c y R e v i e w | 14
-20
-10
0
10
20
30
40
50
60
4
4,5
5
5,5
6
6,5
7
7,5
1 2 3 4 5 6 7 8 9 10 15 20 30
Apr 2013 - Mei 2013 (mtm)Apr-13May-13
%bps
Tenor
3,49
9,50
3,54 3,43
5,98
0
1
2
3
4
5
6
7
8
9
10
ThaiLand Vietnam Philippine Malaysia Indonesia
Yield SBN
Inflation
%
(1,9)
1,4
5,2 5,8 5,3 4,1
2,8
(2,9)
(11,0)
1,4
(1,6)
5,7 7,3
(5,8)
(2,9)
4,1
(3,9)
(8,6)
3,7
(7,7)
3,5
(2,0)
5,5
(2,8)
0,6 2,0
(5,6)
4,4 4,6
4,0
5,0
6,0
7,0
8,0
9,0
10,0
(15,0)
(10,0)
(5,0)
0,0
5,0
10,0
15,0
Jan
Mar
May
July
Sep
t
No
v
Jan
Mar
Mei
Juli
Sep
t
No
v
Jan
Mar
Mei
2011 2012 2013
Short Term Medium Term
Long Term 'yield SBN'

M o n e t a r y P o l i c y R e v i e w | 15

M o n e t a r y P o l i c y R e v i e w | 16
Apr Mei Juni Jul Agt Sep Okt Nov Des Jan Feb Mar Apr Mei
INTEREST RATE & STOCK
Nine Months SBI Rate 1) 3,93 4,24 4,32 4,46 4,54 4,67 4,75 4,77 5 4,84 4,86 4,87 4,89 -
One Month Deposit Rate 2) 5,42 5,35 5,39 5,39 5,42 5,40 5,49 5,42 6 5,49 5,43 5,51 5,42 -
Three Months Deposit Rate 2) 6,00 5,89 5,76 5,67 5,61 5,69 5,66 5,81 6 5,89 5,92 5,64 5,73 -
One Week JIBOR 2) 3,81 3,83 4,10 4,17 4,29 4,24 4,27 4,29 4 4,30 4,28 4,28 4,28 -
JSX Indices 3) 4.181 3.833 3.956 4.142 4.060 4.263 4.350 4.276 4.317 4.454 4.796 4.941 5.034 5.069
Monetary Aggregates (billion IDR)
Base Money 596.592 604.979 627.359 634.993 657.955 638.869 648.106 647.979 704.843 664.007 655.486 664.935 667.122 -
M1(C+D) 720.924 749.450 779.416 771.792 772.429 795.518 774.983 801.403 841.721 787.916 786.606 810.112 836.508 -
Currency (C) 290.861 294.768 314.670 315.375 327.059 325.566 326.119 327.069 361.967 326.885 321.541 331.226 328.628 -
Demand Deposit (D) 430.064 454.682 464.746 456.417 445.370 469.952 448.864 474.334 479.755 461.031 465.065 478.886 507.880 -
Broad Money (M2 = C+D+T+S) 2.927.259 2.992.057 3.050.355 3.054.534 3.089.011 3.125.533 3.161.726 3.205.129 3.304.645 3.265.869 3.277.426 3.319.468 3.318.858 -
Quasi Money (T) 2.190.885 2.227.527 2.254.329 2.269.809 2.304.474 2.318.559 2.376.102 2.393.320 2.452.503 2.467.124 2.479.959 2.497.223 2.469.449 -
Quasi Money (Rupiah) 1.887.124 1.900.824 1.915.625 1.926.046 1.960.339 1.968.062 2.009.812 2.022.975 2.092.654 2.095.427 2.105.861 2.123.999 2.100.406 -
Time Deposit 1.020.792 1.027.151 1.016.060 1.017.021 1.030.262 1.030.830 1.060.357 1.058.871 1.066.527 1.079.275 1.098.083 1.123.609 1.102.593 -
Saving Deposit (Total) 866.332 873.673 899.565 909.025 930.077 937.232 949.456 964.105 1.026.127 1.016.152 1.007.778 1.000.390 997.813 -
Foreign Currency Time Deposit 148.486 159.186 164.762 170.722 171.517 180.380 187.859 190.178 177.508 173.616 169.755 182.383 178.375 -
Foreign Currency Demand Deposit 155.275 167.516 173.942 173.041 172.617 170.117 178.430 180.166 182.341 198.081 204.343 190.841 190.669 -
Securities Other Than Shares (S) 15.450 15.081 16.610 12.932 12.108 11.457 10.640 10.406 10.420 10.829 10.861 12.132 12.902 -
Claims on Other Sectors 2.519.946 2.586.786 2.653.871 2.668.447 2.696.876 2.758.170 2.791.363 2.833.571 2.920.934 2.897.711 2.921.209 2.970.116 2.971.524 -
Claims on Business Sectors 2.230.960 2.289.504 2.361.812 2.378.914 2.406.188 2.471.071 2.504.939 2.504.347 2.584.819 2.556.620 2.571.080 2.616.046 2.601.903 -
CPI - Monthly (%, mtm) 0,21 0,07 0,62 0,70 0,95 0,01 0,16 0,07 0,54 1,03 0,75 0,63 -0,10 -0,03
CPI - Yearly (%, yoy) 4,50 4,45 4,53 4,56 4,58 4,31 4,61 4,32 4,30 4,57 5,31 5,90 5,57 5,47
IDR/USD (end of period, mid rate) 9.190 9.565 9.480 9.485 9.560 9.588 9.615 9.605 9.670 9.698 9.667 9.719 9.722 9.795
Non Oil & Gas Export (f.o.b, million USD) 4) 12.698 13.315 12.420 13.257 11.238 13.011 12.636 13.202 12.313 12.386 11.897 12.727 - -
Non Oil & Gas Import (c & f, million USD) 4) 12.381 13.363 12.918 13.249 10.366 11.733 13.053 12.479 11.715 11.608 11.619 10.969 - -
2013
GDP Growth (%, yoy) 6,2 6,1 6,0
Consumption 4,5 3,9 4,7
Investment 9,8 7,3 5,9
Changes in Stocks -9,5 94,6 10,2
Export -2,6 0,5 3,4
Import -0,2 6,8 -0,4
1) end of week
2) weighted average
3) end period closing
4) closed file
Sources : Bank Indonesia,except stock market data (BAPEPAM), CPI, export/import and GDP(BPS)
2,2
10,9
12,3
108,7
6,4
5,5
Tw.II
PRICE
EXTERNAL SECTOR
QUARTERLY INDICATORS
INDICATORS2013
Tw.I
2012
Tw.III Tw.IV
2012