
Monetary Policy Report - Bank · PDF fileMonetary Policy Report | 1 ... Externally, the...
41
Monetary Policy Report Economy, Monetary, and Finance Quarter IV 2015
Transcript of Monetary Policy Report - Bank · PDF fileMonetary Policy Report | 1 ... Externally, the...

MonetaryPolicy Report
Economy, Monetary, and Finance
Quarter IV 2015
M o n e t a r y P o l i c y R e p o r t | 1
EXECUTIVE SUMMARY
The Indonesian economy showed signs of improvement during the fourth quarter of 2015 and January 2016. Economic growth was noted to accelerate in Q4/2015, with the trend expected to persist into 2016. Stronger economic growth was accompanied by solid macroeconomic and financial system stability on the back of increased public spending, in particular linked to the realisation of infrastructure projects, despite the limited role of the private sector. On the other hand, macroeconomic stability was maintained, with low inflation and a sustainable current account deficit recorded. Furthermore, the rupiah stabilised and even rebounded in the fourth quarter of 2015 after experiencing severe depreciation due to external factors. Such favourable conditions provided ample room to ease monetary policy as risk on global financial markets also tended to dissipate. Addressing the latest developments, Bank Indonesia began to loosen its monetary policy stance in order to catalyse economic growth while maintaining macroeconomic and financial system stability. In addition, Bank Indonesia will continue to strengthen coordination with the Government to overhaul the economic structure, boost growth and maintain macroeconomic and financial system stability.
Externally, the global economic recovery remained vulnerable. Conversely, the risks on global financial markets originating from the probability of Federal Funds Rate (FFR) hike tended to subside. The US economic recovery was undermined by weak consumption figures, sluggish gains in the housing sector, and contracted manufacturing industry. The lack of a solid recovery in the United States pushed back expectations of a further FFR hike to the second semester of 2016, with a smaller increase also predicted. The European Central Bank (ECB) persisted with quantitative easing, consistent with weak growth and low inflation. Similarly, the Bank of Japan (BOJ) applied a negative policy rate. Economic moderation lingered in China due to a languid manufacturing industry and weak investment as the corporate sector continued to deleverage. Furthermore, the global oil price was predicted to continue sliding in line with greater supply and a slump in demand.
On the home front, economic growth momentum, which gained pace in the third quarter of 2015, persisted into the fourth quarter due to public spending. Economic growth in Q4/2015 was recorded at 5.04% (yoy), surpassing the 4.74% (yoy) posted in the previous period. Growth accelerated on public consumption and infrastructure spending, coupled with local elections contested nationwide. In contrast, the role of the private sector remained limited, reflecting weak household consumption and non-construction investment. Externally, the export slump continued due to a lacklustre global economic recovery and protracted international commodity price slide. By sector, imbalances remained in terms of domestic economic growth, relying on the construction and services sectors. Stronger economic growth is projected for 2016 in the range of 5.2-5.6% (yoy), supported by fiscal stimuli in the form of increased infrastructure project development. Furthermore, private investment is also expected to pick up after recent deregulation through government policy packages along with looser monetary policy, while maintaining macroeconomic stability.
Monetary Policy Report Quarter IV 2015
M o n e t a r y P o l i c y R e p o r t | 2
The Indonesia balance of payments (BoP) noted improvements in the reporting quarter, bolstered by a growing capital and financial account surplus. The capital and financial account surplus exceeded the current account deficit in the fourth quarter of 2015, hence occasioning the BoP surplus. The larger capital and financial account surplus was attributed to an influx of foreign capital flows as uncertainty eased on global financial markets and confidence in the domestic economic outlook was restored. The current account deficit swelled, however, to 2.4% of GDP despite domestic economic momentum and weak global demand. In 2015, the current account deficit stood at 2.06% of GDP, far below the 3.09% recorded in 2014. Furthermore, Indonesia’s trade balance rebounded to register a surplus in January 2016, supported by a narrower oil and gas trade deficit. Consequently, the position of official reserve assets at the end of January 2016 stood at USD102.1 billion, equivalent to 7.5 months of imports or 7.2 months of imports and servicing public external debt, which is well above international adequacy standards of around three months of imports. Moving forward, Bank Indonesia predicts the BoP to improve further, with the current account deficit managed at below 3% of GDP.
The rupiah was stable and tracked an upward trend as foreign capital inflows surged in line with less risk on global financial markets and restored confidence in domestic economic fundamentals. Point-to-point, the rupiah appreciated 6.27% (ptp) to close at a level of Rp13,785 per USD. Furthermore, rupiah appreciation persisted into the new year, gaining 0.1% (ptp) to close at a level of Rp13,775 per USD at the end of January 2016. The rupiah appreciated as foreign capital flowed to domestic instruments, particularly tradeable government securities (government bond). Investor perception of the domestic economic outlook was restored after the BI Rate was lowered and the government took steps to deregulate the investment climate, while infrastructure projects were implemented effectively. In addition, risk on global financial markets eased, reflecting a more dovish FFR path, which triggered further rupiah appreciation. Looking ahead, Bank Indonesia will continue to maintain exchange rate stability in line with the currency’s fundamental value.
Inflation in January 2016 decelerated, thereby supporting the prospect of achieving the inflation target in 2016 of 4±1%. CPI inflation was recorded at 0.51% (mtm), down from 0.96% (mtm), with deflation of administered prices and relatively low core inflation contributing to the decline. Administered price deflation was driven by lower fuel prices, airfares and 12kg LPG prices. Meanwhile, core inflation was considered low at just 0.29% (mtm) or 3.62% (yoy), supported by anchored inflation expectations and weak demand-side pressures. On the other hand, inflation of volatile foods was controlled despite the ongoing severe El Nino weather phenomenon. Furthermore, the downward oil price trend is expected to suppress inflationary pressures at home. Therefore, Bank Indonesia predicts inflation around the midpoint of the 4±1% range in 2016. The inflation target will be achieved with the help of sound policy coordination with the Government, specifically to control inflationary pressures on food.
Financial system stability was maintained, underpinned by banking system resilience and relatively stable financial markets. In December 2015, the Capital Adequacy Ratio (CAR) was recorded at 21.2%, while non-performing loans (NPL) stood at 2.5% (gross) or 1.2% (net). In terms of the intermediation function, credit growth accelerated from 9.8% (yoy) the month earlier to 10.5% (yoy). In contrast, deposit growth slowed from 7.7% (yoy) to 7.3% (yoy) over the same period. Bank Indonesia will monitor liquidity conditions in the economy to support further credit distribution. In addition, the
M o n e t a r y P o l i c y R e p o r t | 3
term structure of interest on monetary operations was also lowered to support policy rate easing in line with liquidity conditions in each tenor.
Projecting forward, the pace of economic growth in 2016 and 2017 is expected to accelerate as domestic demand increases and the global economy gains momentum on the previous year. Investment is predicted to pick up, primarily in the form of infrastructure development and gains in revenues accompanied by controlled inflation, which will intensify domestic demand as the main driver of domestic growth in 2016 and 2017. By sector, the manufacturing industry as well as the transportation and communications sector are projected to gain momentum, while remaining the locomotives of the domestic economy in line with the gradual global economic recovery and solid domestic economic improvements. In addition, significant progress is predicted in the construction sector after government-announced infrastructure projects are implemented. Meanwhile, inflation in 2016 and 2017 is projected to remain under control within the target corridor, supported by anchored expectations, relatively low international commodity prices and a stable exchange rate.
Bank Indonesia will remain vigilant of internal and external risks to macroeconomic stability that could undermine growth. Globally, economic uncertainty will linger due mainly to economic moderation in China and the oil price slump. Conversely, risk associated with future FFR hikes is relatively low. In China, risks will emanate from an economic downshift along with uncertain financial markets. Spillover from the global economic slowdown will reduce demand for goods, which will perpetuate the international commodity price slide, including oil. Domestically, effective fiscal stimuli are the key to improvements in the short-term economic outlook.
Considering the latest developments as well as the future prospects and risks, the BI Board of Governors agreed to lower the BI Rate 25 basis points (bps) to 7%, with the Deposit Facility and Lending Facility rates dropped to 5% and 7.5% respectively. The Board of Governors also decided to reduce the rupiah denominated primary reserve requirement by 1%, from 7.5% to 6.5%, effective from 16th March 2016. The move is consistent with greater room to ease monetary policy on the back of solid macroeconomic stability, especially in terms of less intense inflationary pressures in 2016 as well as less uncertain global financial markets. The dual policy of lowering the BI Rate and primary reserve requirement is expected to strengthen efforts to boost ongoing economic gains. In addition, Bank Indonesia will continue to strengthen coordination with the Government to control inflation, stimulate growth and accelerate structural reforms, thereby supporting sustainable economic growth moving forward, while maintaining macroeconomic stability.

M o n e t a r y P o l i c y R e p o r t | 4
This page intentionally left blank

M o n e t a r y P o l i c y R e p o r t | 5
THE ECONOMY AND MONETARY POLICY
Economic growth accelerated during the fourth quarter of 2015, with the trend projected to continue into the first quarter of 2016, while macroeconomic and financial system stability are maintained. Economic momentum was supported by greater public consumption and construction investment. Meanwhile, private consumption remained robust, driven by non-profit institutions serving households (NPISH) as local elections were contested nationwide in December 2015. Economic gains in Q4/2015 are expected to persist into the newyear. Meanwhile, solid financial system stability is expected to endure, underpinned by a resilient banking system and relatively stable financial markets.
The Global Economy
Externally, the global economic recovery remained at risk. Conversely, risk on global financial markets originating from the proposed Federal Funds Rate (FFR) hike tended to subside. The US economic recovery was undermined by weak consumption figures, sluggish gains in the housing sector and a manufacturing industry contraction. The lack of a solid recovery in the United States pushed back expectations of a further FFR hike to the second half of 2016, with a smaller increase also predicted. The European Central Bank (ECB) persisted with quantitative easing, consistent with weak growth and low inflation. Similarly, the Bank of Japan (BoJ) applied a negative policy rate. Economic moderation lingered in China due to a languid manufacturing industry and weak investment as the corporate sector continued to deleverage. Furthermore, the global oil price was predicted to continue sliding in line with greater supply and a slump in demand.
Global financial market risk linked to further Federal Funds Rate (FFR) hikes eased. Accordingly, the VIX Spot Index fell and the US stock market rallied after the FOMC meeting in January 2016 (Graph 1.1 and Graph 1.2). Furthermore, future risk perception is projected to decrease, reflecting a drop in the VIX Future Index for June 2016 that was below the VIX Spot Index.
Graph 1.1. VIX Index: Spot and Forward
Graph 1.2. US Stock Exchange Index
1 1
Source : Bloomberg Source : Bloomberg

M o n e t a r y P o l i c y R e p o r t | 6
The US economic recovery was undermined by weak consumption figures, sluggish gains in the housing sector and a manufacturing industry contraction. Weak consumption was indicated by flat retail sales and personal expenditure (Graph 1.3), while housing sector gains slowed on the back of a slump in house sales despite lower mortgage rates. Meanwhile, the manufacturing sector contracted, evidenced by declines in the Manufacturing PMI, industrial production and production capacity (Graph 1.4 and Graph 1.5). In addition, PCE inflation came in well below target (Graph 1.6).
Graph 1.3. Retail Sales and Personal Expenditure
Graph 1.4. PMI Manufacturing and
Orders Breakdown
Graph 1.5. Industrial Production and Capacity
Graph 1.6. US inflation
The lack of a solid recovery in the United States pushed back expectations of a further FFR hike to the second half of 2016, with a smaller increase also predicted. The FOMC in January 2016 and Yellen testimony before the Congress on 10th February 2016 indicated that gradual FFR hikes would come after assessments of economic and global financial market risks that could affect the US economic outlook. According to the latest Bloomberg survey of 73 economists, an FFR hike of just 50bps is expected in 2016, lower than the 75bps predicted in January 2016 (Table 1.1). In fact, the FFR implied probability indicated no potential increase to the Federal Funds Rate (FFR) in 2016 (Table 1.2).
Source : Bloomberg Source : Bloomberg
Source : Bloomberg Source : Bloomberg

M o n e t a r y P o l i c y R e p o r t | 7
Table 1.1. Bloomberg Survey FFR Level
(As of February 11, 2016) Table 1.2. Implied Current Prob FFR Level
(per 11 Feb'16)
The European Central Bank (ECB) persisted with quantitative easing, consistent with weak growth and low inflation. The European Central Bank (ECB) is expected to expand QE policy in March 2016 in line with the Governing Council (GC) Meeting in December 2015 that relayed concerns over low inflation due to sliding oil and commodity prices (Graph 1.7). Inflation in Europe in December 2015 was recorded at 0.2%, which was below expectations. In addition, the Euro was at risk of depreciation and the markets started to lose confidence in the ECB’s attempts to hit the inflation target (Graph 1.8 and Graph 1.9).
Graph 1.7. European Inflation Rate
Graph 1.8. Exchange Rate USD / EUR
Graph 1.9. Euro Zone Inflation Forecast
Feb. Survey Q1 16 Q2 16 Q3 16 Q4 16 Q1 17 Q2 17
Median Forecast 0.5 0.75 0.75 1 1.25 1.5Average Forecast 0.54 0.74 0.88 1.1 1.28 1.5
High Forecast 0.75 1 1.5 2 2.25 2.75
Low Forecast 0.5 0.5 0.5 0.25 0.25 0.25
Responses 76 76 74 75 64 60
% of Responses 100 100 97 99 84 79
Jan. Survey Median 0.75 0.75 1 1.25 1.5 1.75
Change in Medians ‐0.25 0 ‐0.25 ‐0.25 ‐0.25 ‐0.25
Source : Bloomberg Source : Bloomberg
Source : Bloomberg
Source : Bloomberg
M o n e t a r y P o l i c y R e p o r t | 8
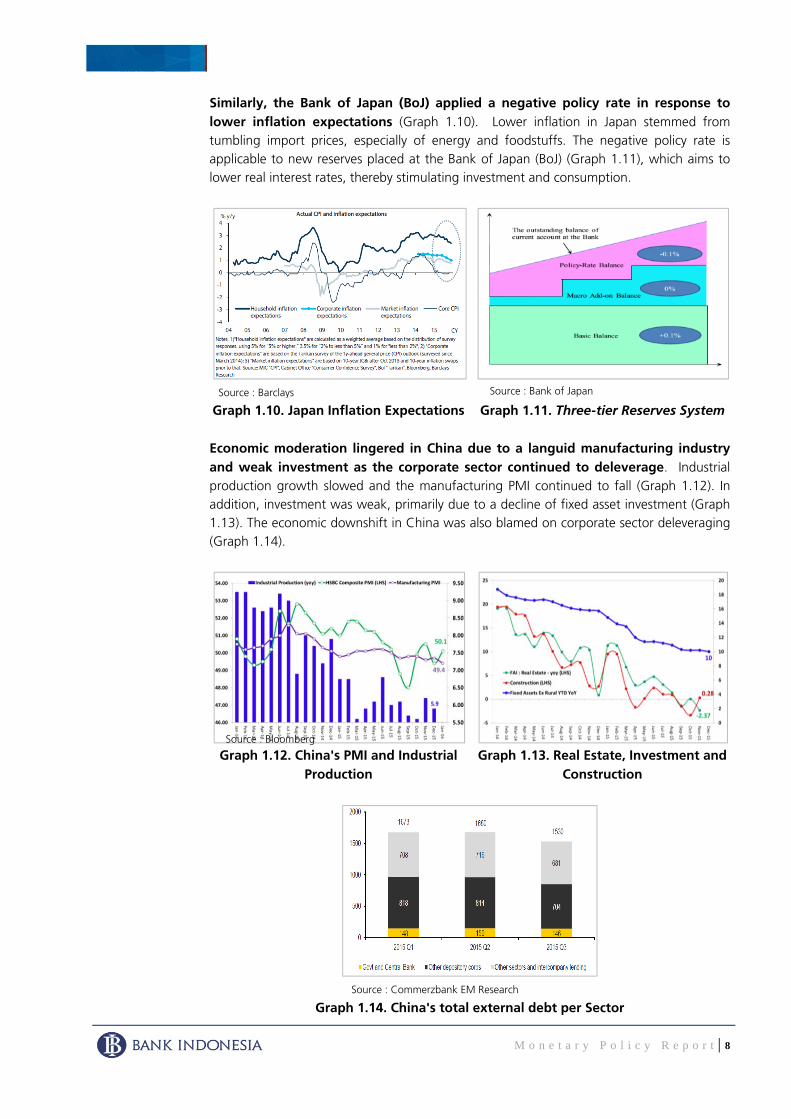
Similarly, the Bank of Japan (BoJ) applied a negative policy rate in response to lower inflation expectations (Graph 1.10). Lower inflation in Japan stemmed from tumbling import prices, especially of energy and foodstuffs. The negative policy rate is applicable to new reserves placed at the Bank of Japan (BoJ) (Graph 1.11), which aims to lower real interest rates, thereby stimulating investment and consumption.
Graph 1.10. Japan Inflation Expectations
Graph 1.11. Three-tier Reserves System Economic moderation lingered in China due to a languid manufacturing industry and weak investment as the corporate sector continued to deleverage. Industrial production growth slowed and the manufacturing PMI continued to fall (Graph 1.12). In addition, investment was weak, primarily due to a decline of fixed asset investment (Graph 1.13). The economic downshift in China was also blamed on corporate sector deleveraging (Graph 1.14).
Graph 1.12. China's PMI and Industrial Production
Graph 1.13. Real Estate, Investment andConstruction
Graph 1.14. China's total external debt per Sector
Source : Barclays Source : Bank of Japan
Source : Commerzbank EM Research
Source : Bloomberg
M o n e t a r y P o l i c y R e p o r t | 9
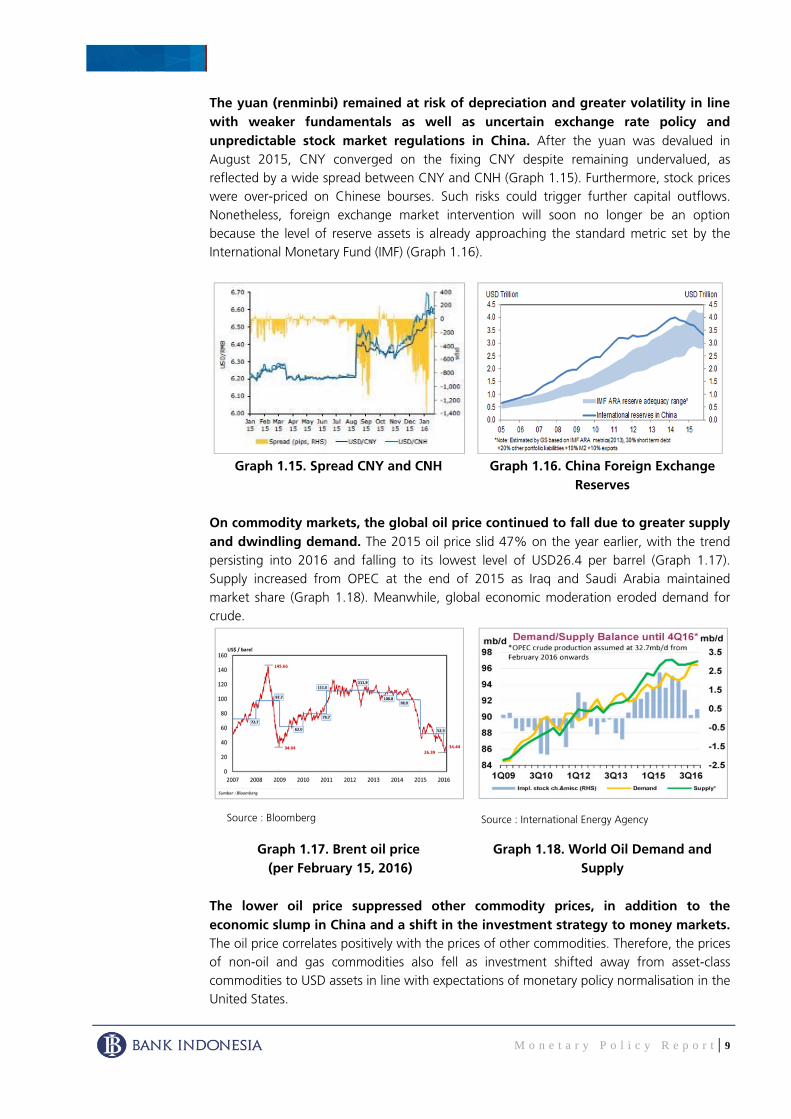
The yuan (renminbi) remained at risk of depreciation and greater volatility in line with weaker fundamentals as well as uncertain exchange rate policy and unpredictable stock market regulations in China. After the yuan was devalued in August 2015, CNY converged on the fixing CNY despite remaining undervalued, as reflected by a wide spread between CNY and CNH (Graph 1.15). Furthermore, stock prices were over-priced on Chinese bourses. Such risks could trigger further capital outflows. Nonetheless, foreign exchange market intervention will soon no longer be an option because the level of reserve assets is already approaching the standard metric set by the International Monetary Fund (IMF) (Graph 1.16).
Graph 1.15. Spread CNY and CNH Graph 1.16. China Foreign Exchange Reserves
On commodity markets, the global oil price continued to fall due to greater supply and dwindling demand. The 2015 oil price slid 47% on the year earlier, with the trend persisting into 2016 and falling to its lowest level of USD26.4 per barrel (Graph 1.17). Supply increased from OPEC at the end of 2015 as Iraq and Saudi Arabia maintained market share (Graph 1.18). Meanwhile, global economic moderation eroded demand for crude.
Graph 1.17. Brent oil price
(per February 15, 2016)
Graph 1.18. World Oil Demand and Supply
The lower oil price suppressed other commodity prices, in addition to the economic slump in China and a shift in the investment strategy to money markets. The oil price correlates positively with the prices of other commodities. Therefore, the prices of non-oil and gas commodities also fell as investment shifted away from asset-class commodities to USD assets in line with expectations of monetary policy normalisation in the United States.
Source : Bloomberg Source : International Energy Agency

M o n e t a r y P o l i c y R e p o r t | 10
Economic Growth
On the home front, economic growth momentum, which gained pace in the third quarter of 2015, persisted into the fourth quarter due to public spending. Economic growth in Q4/2015 was recorded at 5.04% (yoy), surpassing the 4.74% (yoy) posted in the previous period. Growth accelerated on public consumption and infrastructure spending, coupled with local elections held nationwide. In contrast, the role of the private sector remained limited, reflecting weak household consumption and non-construction investment. Externally, the export slump continued due to a lacklustre global economic recovery and protracted international commodity price slide. By sector, imbalances remained in terms of domestic economic growth, relying on the construction and services sectors.
Public consumption accelerated from 7.11% (yoy) last period to 7.31% (yoy) in Q4/2015. The increase was due to greater absorption of spending on goods, which demonstrates the growing role of government in driving economic growth despite weak public spending at the beginning of 2015 due to nomenclature restructuring.
Investment growth, particularly construction investment, also accelerated in the reporting period, which further buoyed economic growth. In general, investment growth increased from 4.79% (yoy) in Q3/2015 to 6.90% (yoy) on a wave of construction investment in line with greater public infrastructure project implementation. Indicatively, sales of cement also increased (Graph 1.19). In contrast, the role of the private sector remained limited, reflecting soft non-construction investment growth of 3.1% in Q4/2015 due to the wait-and-see attitude of investors, consistent with prevailing business sentiment (Graph 1.20). Corporate performance and resilience also deteriorated, while corporate revenues and sales experienced negative growth (Graph 1.21). Although weak, non-construction investment began to rebound on investment in machinery and equipment, motor vehicles and equipment, as well as imports of capital goods.
%Y-o-Y, 2010 Price
I II III IV I II III IVPrivate Consumption* 5.44 5.59 5.48 5.14 4.99 5.29 4.72 4.68 4.98 4.99 4.84
Government Consumption 6.75 6.06 -1.84 1.17 0.87 1.16 2.91 2.61 7.11 7.31 5.38
Investment 5.01 5.16 4.08 4.48 4.59 4.57 4.63 3.88 4.79 6.90 5.07
Building Investment 6.74 5.51 4.91 4.52 7.10 5.52 5.47 4.82 6.25 8.21 6.23
Non-Building Investment 0.63 4.24 1.88 4.39 -2.03 2.03 2.35 1.32 0.73 3.10 1.87
Export 4.17 3.16 1.37 4.84 -4.59 1.00 -0.62 -0.01 -0.60 -6.44 -1.97
Import 1.86 5.04 0.41 0.28 3.23 2.19 -2.19 -6.97 -5.90 -8.05 -5.84
GDP 5.56 5.14 4.96 4.97 5.04 5.02 4.73 4.66 4.74 5.04 4.79
Source : BPS
* including consumption of Non-Profit Institutions Servings Households
Table 1.3
2014 20152013
Economic Growth - Demand Side
Component2014 2015

M o n e t a r y P o l i c y R e p o r t | 11
Graph 1.19. Cement Sales Graph 1.20. Business Sentiment Index
Private consumption enjoyed moderate gains in the reporting period, primarily driven by non-profit institutions serving households (NPISH). Household consumption growth increased from 4.98% (yoy) to 4.99% (yoy) due to non-profit institutions serving households (NPISH), which accelerated from 6.56% (yoy) to 8.32% (yoy) as local elections were contested nationwide in December 2015. Conversely, limited non-food consumption was symptomatic of sluggish household consumption growth (Graph 1.22). Furthermore, sales of cars and motorcycles continued to contract despite early signs of stronger motorcycle sales in December 2015. Growth of consumer loans, which typically bolster public purchasing power, also continued to decelerate.
Graph 1.21. Corporate Sales Revenue Graph 1.22. Growth of Household Consumption
In the external sector, exports continued to decline as the global economy moderated and the prolonged commodity price slide persisted. Exports in Q4/2015 contracted at 6.44% (yoy), which was deeper than the contraction recorded in the previous period in line with a lower world trade volume, especially to emerging market countries, and lower international commodity prices as the global oil price tracked a downward trend. The export decline primarily affected non-oil and gas exports. Mining exports continued to contract (Graph 1.23), particularly shipments of coal due to the low price and weak demand, especially from China. Manufacturing exports also contracted slightly on consignments of crude palm oil (CPO) after recording positive growth for three consecutive quarters. By contrast, agricultural exports enjoyed solid gains on shipments of fish, coffee beans as well as herbs and spices.
Imports contracted in response to limited export performance and consumption. The import contraction deepened from 5.90% (yoy) last period to 8.05% (yoy) in Q4/2015 due to oil and gas imports, while the non-oil and gas import contraction began to ease as imports of capital goods spiked (Graph 1.24) in line with the proliferation of government infrastructure projects in 2015.

M o n e t a r y P o l i c y R e p o r t | 12
Graph 1.23. Real Growth of Non-Oil and Gas Export
Graph 1.24. Real growth of non-oil and Bas Imports
By sector, economic growth remained imbalance. Solid economic gains were attributed to the construction sector as a result of infrastructure projects, and the services sector, while other sectors, including the manufacturing industry, remained sluggish (Table 1.4). Greater government infrastructure project implementation buoyed the construction sector, while the services sector benefitted from growth in the government administration subsector, as public spending accelerated, and the financial services subsector. Meanwhile, the manufacturing industry slump lingered in line with weak private consumption and dwindling manufacturing exports towards yearend. Such conditions were corroborated by the HSBC Purchasing Mangers Index (PMI) that remained in negative territory. By industry, performance declines mainly affected the chemical industry as demand for exports dwindled. Nonetheless, oil and gas refineries enjoyed a significant boost to performance that offset a deeper decline in the manufacturing industry.
By region, the islands of Java and Sumatra contributed to domestic economic momentum in the reporting period. Economic growth on Java was observed to accelerate from 5.5% (yoy) to 5.9% (yoy) (Figure 1.1) as large-scale public infrastructure project implementation was ramped up, including the construction of reservoirs, seaports, airports and mass transit systems. Likewise, the economy of Sumatra was noted to
%Y-o-Y, 2010 Price
I II III IV I II III IVAgriculture 4.20 5.16 4.88 3.60 3.32 4.24 4.01 6.86 3.34 1.57 4.02Mining and Quarrying 2.53 -1.00 1.15 1.16 1.51 0.72 -1.32 -5.20 -5.66 -7.91 -5.08Manufacturing Industries 4.37 4.46 4.83 4.98 4.18 4.61 4.01 4.11 4.51 4.35 4.25Electricity and Gas Supply 5.23 3.29 6.47 5.95 6.50 5.57 1.73 0.76 0.56 1.81 1.21Water Supply 3.32 4.91 5.77 5.88 6.87 5.87 5.39 7.76 8.75 6.77 7.17Construction 6.11 7.22 6.46 6.53 7.67 6.97 6.03 5.35 6.82 8.24 6.65Trade and Car Repair 4.81 6.05 4.99 5.18 4.48 5.16 4.12 1.70 1.39 2.77 2.47Transportation and Warehousi 6.97 6.99 7.56 7.70 7.20 7.36 5.78 5.92 7.26 7.67 6.68Accommodation, Food and W 6.80 6.44 6.35 5.78 4.57 5.77 3.37 3.75 4.48 5.79 4.36Information and Communicati 10.39 9.79 10.46 9.80 10.33 10.10 10.09 9.66 10.74 9.74 10.06Financial Services 8.76 3.60 5.46 1.90 7.87 4.68 8.57 2.63 10.36 12.52 8.53Real Estate 6.54 4.66 4.93 5.07 5.30 5.00 5.26 5.03 4.78 4.25 4.82Business Services 7.91 10.27 9.99 9.30 9.69 9.81 7.36 7.64 7.63 8.13 7.69Government Administration 2.56 2.66 -2.49 2.38 6.84 2.38 4.73 6.29 1.27 6.70 4.75Education Services 7.44 4.62 4.48 6.29 6.62 5.55 5.03 11.71 8.08 5.32 7.45Health Services 7.96 7.64 8.74 9.63 6.03 7.96 7.14 7.48 6.33 7.44 7.10Other Services 6.40 8.37 9.46 9.50 8.38 8.93 7.98 8.06 8.11 8.15 8.08GDP 5.56 5.14 4.96 4.97 5.04 5.02 4.73 4.66 4.74 5.04 4.79Source: BPS
20152015
Table 1.4Economic Growth - Supply Side
20132014
2014Sector
M o n e t a r y P o l i c y R e p o r t | 13
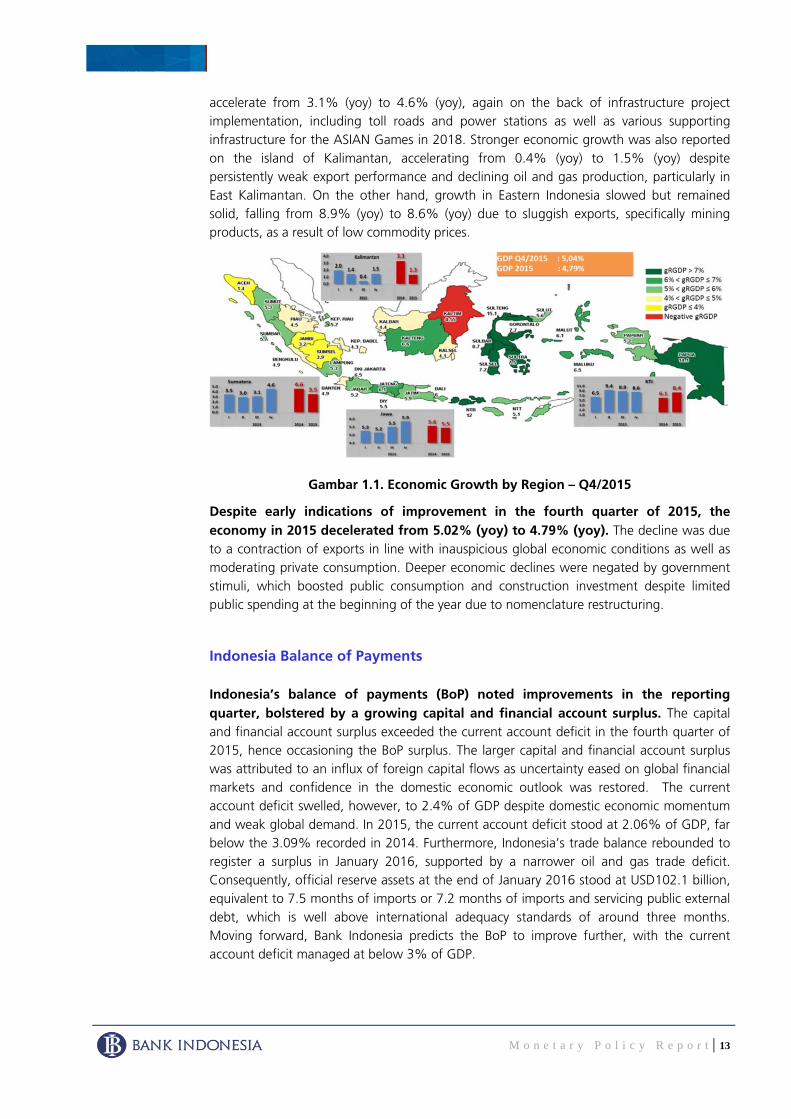
accelerate from 3.1% (yoy) to 4.6% (yoy), again on the back of infrastructure project implementation, including toll roads and power stations as well as various supporting infrastructure for the ASIAN Games in 2018. Stronger economic growth was also reported on the island of Kalimantan, accelerating from 0.4% (yoy) to 1.5% (yoy) despite persistently weak export performance and declining oil and gas production, particularly in East Kalimantan. On the other hand, growth in Eastern Indonesia slowed but remained solid, falling from 8.9% (yoy) to 8.6% (yoy) due to sluggish exports, specifically mining products, as a result of low commodity prices.
Gambar 1.1. Economic Growth by Region – Q4/2015
Despite early indications of improvement in the fourth quarter of 2015, the economy in 2015 decelerated from 5.02% (yoy) to 4.79% (yoy). The decline was due to a contraction of exports in line with inauspicious global economic conditions as well as moderating private consumption. Deeper economic declines were negated by government stimuli, which boosted public consumption and construction investment despite limited public spending at the beginning of the year due to nomenclature restructuring.
Indonesia Balance of Payments
Indonesia’s balance of payments (BoP) noted improvements in the reporting quarter, bolstered by a growing capital and financial account surplus. The capital and financial account surplus exceeded the current account deficit in the fourth quarter of 2015, hence occasioning the BoP surplus. The larger capital and financial account surplus was attributed to an influx of foreign capital flows as uncertainty eased on global financial markets and confidence in the domestic economic outlook was restored. The current account deficit swelled, however, to 2.4% of GDP despite domestic economic momentum and weak global demand. In 2015, the current account deficit stood at 2.06% of GDP, far below the 3.09% recorded in 2014. Furthermore, Indonesia’s trade balance rebounded to register a surplus in January 2016, supported by a narrower oil and gas trade deficit. Consequently, official reserve assets at the end of January 2016 stood at USD102.1 billion, equivalent to 7.5 months of imports or 7.2 months of imports and servicing public external debt, which is well above international adequacy standards of around three months. Moving forward, Bank Indonesia predicts the BoP to improve further, with the current account deficit managed at below 3% of GDP.

M o n e t a r y P o l i c y R e p o r t | 14
Indonesia’s balance of payments (BoP) recorded a surplus in Q4/2015 of USD5.1 billion, contrasting the USD4.6 billion deficit registered in the previous period (Graph 1.25). A capital and financial account surplus of USD9.5 billion, which exceeded the current account deficit of USD5.1 billion (2.39% of GDP), contributed to the BoP surplus.
The current account deficit swelled as the domestic economy improved and global demand remained weak. The current account deficit stood at 2.4% of GDP in Q4/2015, up from 1.94% of GDP, due to a narrower oil and gas trade surplus after non-oil and gas imports achieved growth of 7.5% (qtq) on the back of growing domestic demand towards yearend (Graph 1.26). Imports of capital goods enjoyed the strongest gains, followed by consumer goods and raw materials. Meanwhile, non-oil and gas exports contracted 4.2% (yoy) due to sluggish global demand and the ongoing commodity price slide. On the other hand, the oil and gas trade deficit also narrowed on declines in oil import volume and global crude prices. The current account deficit was recorded at 2.06% of GDP in 2015, a much healthier position than the 3.09% of GDP reported in 2014.
Graph 1.25. Balance of Payments Indonesia
Graph 1.26. Trade Balance Q4 2015
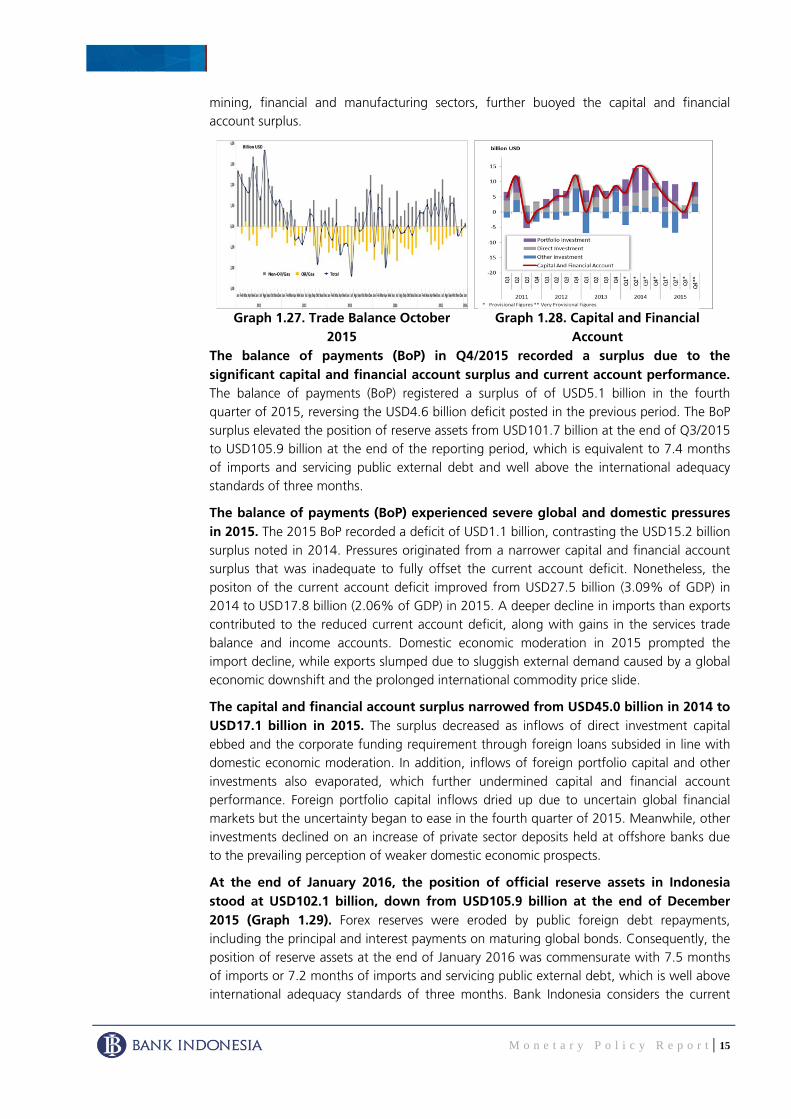
Indonesia’s trade balance recorded a surplus of USD0.05 billion in January 2016, reversing the USD0.16 billion deficit registered the month earlier (Graph 1.27). A narrower oil and gas trade deficit, shrinking from USD0.50 billion in December 2015 to USD0.11 billion in January 2016, contributed to the trade surplus. Oil and gas imports decreased 32.10% (mtm) in the reporting period, which overshadowed the 14.81% (mtm) drop in corresponding exports. Meanwhile, the non-oil and gas trade balance continued to record a surplus, despite shrinking from USD0.34 billion to USD0.16 billion, as non-oil and gas exports contracted more deeply (11.52%, mtm) than non-oil and gas imports (10.22%, mtm). The non-oil and gas export decline tended to affect shipments of animal/vegetable fats and oils, mineral fuels, not-knitted clothing, metal ore, crust and dust as well as tin. Meanwhile, imports of mechanical machinery, electrical machinery, iron and steel, organic chemicals as well as jewellery/gems contributed to the decline of non-oil and gas imports in January 2016.
The capital and financial account surplus increased significantly as uncertainty eased on global financial markets and confidence in the domestic economic outlook was restored. The capital and financial account surplus in Q4/2015 stood at USD9.52 billion, far exceeding the USD0.28 surplus posted in the previous period (Graph 1.28). The increase stemmed from a deluge of portfolio investment inflows to government bonds, specifically global bonds. Furthermore, other investments also surged as withdrawals of deposits held offshore increased along withdrawals of foreign loans to fund public infrastructure projects. An influx of foreign direct investment (FDI), primarily to the
M o n e t a r y P o l i c y R e p o r t | 15
mining, financial and manufacturing sectors, further buoyed the capital and financial account surplus.
Graph 1.27. Trade Balance October 2015
Graph 1.28. Capital and Financial Account
The balance of payments (BoP) in Q4/2015 recorded a surplus due to the significant capital and financial account surplus and current account performance. The balance of payments (BoP) registered a surplus of of USD5.1 billion in the fourth quarter of 2015, reversing the USD4.6 billion deficit posted in the previous period. The BoP surplus elevated the position of reserve assets from USD101.7 billion at the end of Q3/2015 to USD105.9 billion at the end of the reporting period, which is equivalent to 7.4 months of imports and servicing public external debt and well above the international adequacy standards of three months.
The balance of payments (BoP) experienced severe global and domestic pressures in 2015. The 2015 BoP recorded a deficit of USD1.1 billion, contrasting the USD15.2 billion surplus noted in 2014. Pressures originated from a narrower capital and financial account surplus that was inadequate to fully offset the current account deficit. Nonetheless, the positon of the current account deficit improved from USD27.5 billion (3.09% of GDP) in 2014 to USD17.8 billion (2.06% of GDP) in 2015. A deeper decline in imports than exports contributed to the reduced current account deficit, along with gains in the services trade balance and income accounts. Domestic economic moderation in 2015 prompted the import decline, while exports slumped due to sluggish external demand caused by a global economic downshift and the prolonged international commodity price slide.
The capital and financial account surplus narrowed from USD45.0 billion in 2014 to USD17.1 billion in 2015. The surplus decreased as inflows of direct investment capital ebbed and the corporate funding requirement through foreign loans subsided in line with domestic economic moderation. In addition, inflows of foreign portfolio capital and other investments also evaporated, which further undermined capital and financial account performance. Foreign portfolio capital inflows dried up due to uncertain global financial markets but the uncertainty began to ease in the fourth quarter of 2015. Meanwhile, other investments declined on an increase of private sector deposits held at offshore banks due to the prevailing perception of weaker domestic economic prospects.
At the end of January 2016, the position of official reserve assets in Indonesia stood at USD102.1 billion, down from USD105.9 billion at the end of December 2015 (Graph 1.29). Forex reserves were eroded by public foreign debt repayments, including the principal and interest payments on maturing global bonds. Consequently, the position of reserve assets at the end of January 2016 was commensurate with 7.5 months of imports or 7.2 months of imports and servicing public external debt, which is well above international adequacy standards of three months. Bank Indonesia considers the current

M o n e t a r y P o l i c y R e p o r t | 16
position of reserve assets adequate to maintain external sector resilience and sustainable domestic economic growth moving forward.
Graph 1.29. Foreign Exchange Reserves
Additionally, Bank Indonesia will remain vigilant of global developments that could influence BoP performance. Moreover, Bank Indonesia predicts BoP performance to continue improving and that the current account deficit will be managed below 3% of GDP in 2016.
Rupiah Exchange Rate
The rupiah was stable and tracked an upward trend as foreign capital inflows surged in line with less intense risks on global financial markets and restored confidence in domestic economic fundamentals. The rupiah appreciated as foreign capital flowed to domestic instruments, particularly tradeable government securities (government bond). Investor perception of the domestic economic outlook was restored after the BI Rate was lowered and the government took steps to improve the investment climate, while infrastructure projects were implemented effectively. In addition, risk on global financial markets eased, reflecting a more dovish FFR path, which triggered further rupiah appreciation. Looking ahead, Bank Indonesia will continue to maintain exchange rate stability in line with the currency’s fundamental value.
Point-to-point, the rupiah appreciated 6.27% (ptp) to close at a level of Rp13,785 per USD in Q4/2015. In terms of externalities, the rupiah appreciated as uncertainty eased on global financial markets after the FOMC relayed a dovish announcement in September 2015, while the markets fully anticipated the proposed FFR hike on 17th December 2015 and the Federal Reserve announced that the normalisation of monetary policy in the United States would be instituted gradually. On the home front, markets were upbeat on the promising economic outlook after the government launched a series of policy packages and Bank Indonesia intervened on the foreign exchange market to stabilise the rupiah. Consequently, foreign capital flowed back on to the tradeable government securities (government bond) market, which further strengthened the rupiah (Graph 1.30).

M o n e t a r y P o l i c y R e p o r t | 17
Graph 1.30. Rupiah exchange rate
The rupiah gained further ground on the USD in January 2016. The currency appreciated 0.1% (ptp) to close at a level of Rp13,775 per USD at the end of January 2016 (Graph 1.31). A net inflow of foreign capital returned in January 2016, primarily to tradeable government securities (government bond). Externally, the influx was triggered by expectations of a delayed Federal Funds Rate (FFR) hike until the second half of 2016, with a smaller increase also predicted, combined with the maintained loose policy stances of the Bank of Japan (BOJ) and European Central Bank (ECB). Domestic investors showed renewed optimism in the economy, with confidence boosted by the BI Rate reduction (January 2016), the government’s policy package to stimulate investment and tangible progress in terms of public infrastructure project implementation, which also served to bolster rupiah appreciation.
Graph 1.31. Rupiah exchange rate Graph 1.32. Regional Exchange Rates
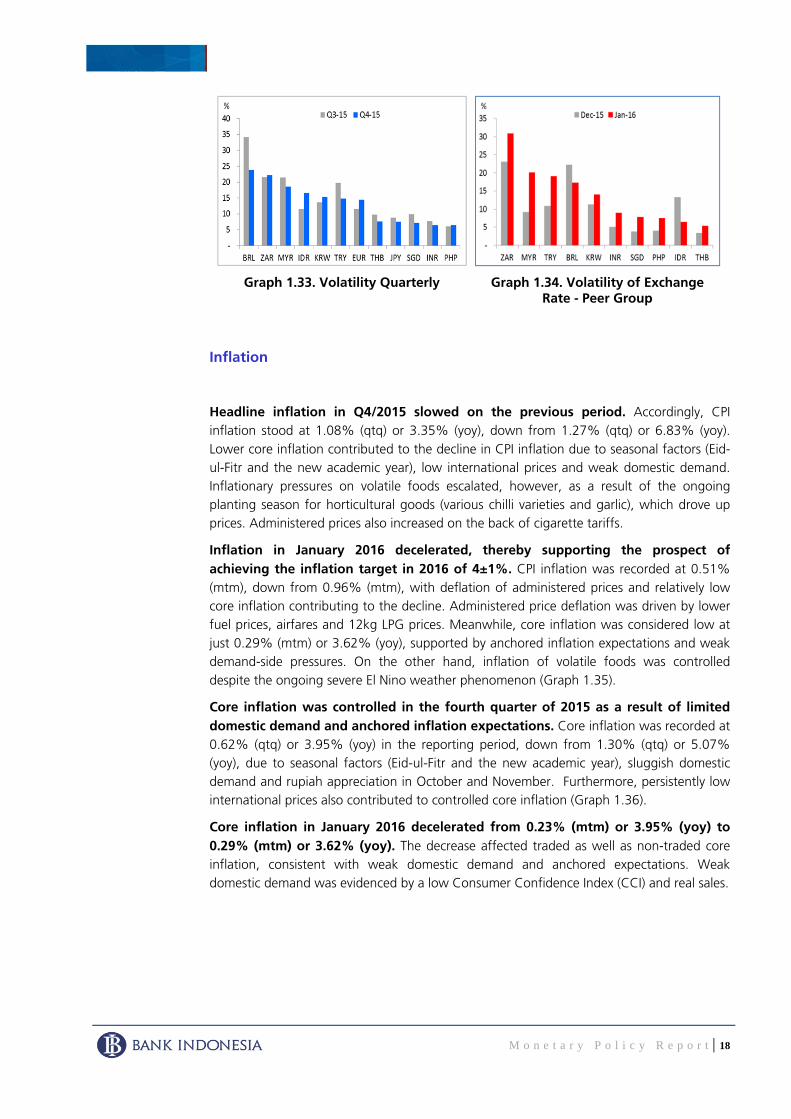
Despite intensifying in the fourth quarter of 2015, rupiah volatility eased in January 2016. Rupiah volatility escalated in Q4/2015, triggered by rupiah appreciation in October after external risk factors eased. Notwithstanding, rupiah volatility during the reporting period was lower than that of the Brazilian real, South African rand and Malaysian ringgit (Graph 1.33). Rupiah volatility dissipated in January 2016and was well mitigated compared to the rand, ringgit, lira, real, won, rupee and peso (Graph 1.34).
Bank Indonesia will continue to maintain rupiah stability in line with the currency’s fundamental value. Furthermore, Bank Indonesia will constantly monitor a range of externalities, including financial market conditions in China and the global oil price, as well as domestic factors.
M o n e t a r y P o l i c y R e p o r t | 18
Graph 1.33. Volatility Quarterly Graph 1.34. Volatility of Exchange Rate - Peer Group
Inflation
Headline inflation in Q4/2015 slowed on the previous period. Accordingly, CPI inflation stood at 1.08% (qtq) or 3.35% (yoy), down from 1.27% (qtq) or 6.83% (yoy). Lower core inflation contributed to the decline in CPI inflation due to seasonal factors (Eid-ul-Fitr and the new academic year), low international prices and weak domestic demand. Inflationary pressures on volatile foods escalated, however, as a result of the ongoing planting season for horticultural goods (various chilli varieties and garlic), which drove up prices. Administered prices also increased on the back of cigarette tariffs.
Inflation in January 2016 decelerated, thereby supporting the prospect of achieving the inflation target in 2016 of 4±1%. CPI inflation was recorded at 0.51% (mtm), down from 0.96% (mtm), with deflation of administered prices and relatively low core inflation contributing to the decline. Administered price deflation was driven by lower fuel prices, airfares and 12kg LPG prices. Meanwhile, core inflation was considered low at just 0.29% (mtm) or 3.62% (yoy), supported by anchored inflation expectations and weak demand-side pressures. On the other hand, inflation of volatile foods was controlled despite the ongoing severe El Nino weather phenomenon (Graph 1.35).
Core inflation was controlled in the fourth quarter of 2015 as a result of limited domestic demand and anchored inflation expectations. Core inflation was recorded at 0.62% (qtq) or 3.95% (yoy) in the reporting period, down from 1.30% (qtq) or 5.07% (yoy), due to seasonal factors (Eid-ul-Fitr and the new academic year), sluggish domestic demand and rupiah appreciation in October and November. Furthermore, persistently low international prices also contributed to controlled core inflation (Graph 1.36).
Core inflation in January 2016 decelerated from 0.23% (mtm) or 3.95% (yoy) to 0.29% (mtm) or 3.62% (yoy). The decrease affected traded as well as non-traded core inflation, consistent with weak domestic demand and anchored expectations. Weak domestic demand was evidenced by a low Consumer Confidence Index (CCI) and real sales.

M o n e t a r y P o l i c y R e p o r t | 19
Graph 1.35. Annual Inflation Graph1.36. Core inflation
Core inflation in the fourth quarter of 2015 was also mitigated by well-anchored inflation expectations at the retailer and consumer levels. According to the monthly Consensus Forecast (CF), average inflation expectations dropped from 4.9% (yoy) in December 2015 to 4.7% (yoy) in January 2016 stemming from a correction to energy prices that precipitated lower fuel prices and electricity rates. In the near term (six months), however, respondents predicted inflationary pressures to reappear in line with the holy fasting month and Eid-ul-Fitr (Graph 1.37 and Graph 1.38).
Graph 1.37. Retailer Inflation Expectations
Graph 1.38. Consumer Inflation Expectations
Volatile foods recorded inflation of 2.62% (qtq) or 4.84% (yoy) in the fourth quarter of 2015, up from 1.82% (qtq) or 8.52% (yoy) in the previous quarter. Volatile food inflation accelerated on rising horticultural prices (chilli and garlic) in line with limited supply as the planting season persisted (Graph 1.39).
In January 2016, volatile foods experienced inflation of 2.40% (mtm) or 6.77% (yoy). Inflationary pressures originated from rising prices of strategic commodities, including shallots as well as chicken meat and eggs. The prices of chicken meat and eggs increased due to limited supply of feed linked to import policy for corn. Furthermore, intense inflationary pressures on shallots lingered as a result of limited supply in the ongoing planting season. Nonetheless, further inflationary pressures on volatile foods was negated by controlled rice prices, which increased just moderately despite the ongoing severe El Nino weather phenomenon. Rice supply was maintained through imports. In addition, rice supply was also maintained by ongoing harvests in a number of regions, including Central Java and East Java, as well as harvests last month (Table 1.5).

M o n e t a r y P o l i c y R e p o r t | 20
Table 1.5. Contributors Volatile Foods Inflation
Graph 1.39 Volatile Foods Inflation
Administered prices in the fourth quarter of 2015 recorded inflation of 1.09% (qtq) or 0.39% (yoy), accelerating from 0.80% (qtq) or 11.26% (yoy). Inflationary pressures on administered prices were compounded by cigarette prices after enforcement of Ministry of Finance Regulation No. 20 of 2015 that required excise duties to be paid in December 2015 (Graph 1.40).
In January 2016, administered prices experienced deflation of -0.55% (mtm) or 3.48% (yoy). The decline was due to lower fuel prices, airfares and 12kg cylinders of liquefied petroleum gas (LPG). In the same month, the Government reduced the price of petrol to Rp9,950 per litre (non-Jamali) and diesel to Rp5,650 per litre. Consequently, the Government also lowered intercity and interprovincial travel fares by 5%. Furthermore, consistent with the correction to global gas prices, the Government also lowered the price of 12kg cylinders of LPG by Rp5,600 or Rp467 per kilogram (Table 1.6).
Table 1.6. Contributors Inflation Administered Prices
Graph 1.40. Administered Prices Inflation
By region, inflation in Kalimantan stood at 0.33% (mtm) in January 2016, followed by Java and Sumatra at 0.50% (mtm) respectively. Less intense inflationary pressures in Kalimantan were supported by price corrections to chicken meat and red chillies along with airfares in all provinces. The correction to chicken meat prices was due to local government initiatives to maintain supply channels through market intervention, amongst others. The easing of inflationary pressures on Java was not as pronounced as in other areas due to relatively high inflation in Banten and East Java. Meanwhile, Jakarta, which has a relatively large weight in the calculation of inflation for Java, recorded comparatively low inflation, thereby alleviating inflationary pressures from other provinces on Java. Inflation in Eastern Indonesia was the highest recorded in the county at 0.73% (mtm). Notwithstanding, inflation in Eastern Indonesia would have been even higher had it not been for deflation recorded in a number of regions, including Gorontalo, Central Sulawesi, North Sulawesi and West Sulawesi, primarily affecting bird’s eye chilli and fresh fish (Figure 1.2).
No Volatile Food (%,mtm) Contribution
(%,mtm)
1 Chicken Meat 7.19 0.09
2 Red Onion 16.33 0.08
3 Eggs 7.72 0.06
4 Potatoes 18.05 0.03
5 Red Chilli 6.47 0.03
6 Onion 14.15 0.03
1 Bean (21.27) (0.01)
2 Long Bean (8.78) (0.01)
3 Cucumber (9.52) (0.01)
Inflation
Deflation
No. Administered Prices (%, mtm)Contribution
(%, mtm)
Deflation
1 Gasoline (3.79) (0.15)
2 Air transport (5.32) (0.05)
3 Diesel Fuel (13.67) (0.02)
4 Household Fuel (0.57) (0.01)
Inflation
1 Electricity rate 2.60 0.09
2 Filter cigarettes 0.99 0.02
3 Cigarettes 0.71 0.01

M o n e t a r y P o l i c y R e p o r t | 21
Gambar 1.2. Regional Inflation (%, mtm)
Monetary Developments
Liquidity on the interbank money market was observed to tighten marginally but was maintained in general. The position of the Deposit Facility (DF) fell from Rp92.1 trillion in Q3/2015 to Rp79.2 trillion in Q4/2015. The average overnight (O/N) interbank rate increased from 5.85% (qtq) to 5.97% (qtq) during the same period (Graph 1.14) due, amongst others, to greater demand for liquidity in December. Nonetheless, liquidity conditions in general were maintained, reflecting an increase in average total interbank money market volume from Rp10.85 trillion to Rp12.39 trillion. Money market liquidity began to rebound in January 2016 as currency flowed back into the banking system and fiscal operations were expanded.
Graph 1.41. BI Rate, DF Rate and Interest Rate Interbank ON
The deposit rate was relatively stable in Q4/2015, while banks lowered their lending rates. The average weighted deposit rate was stable in the reporting period at 7.94% (yoy) despite being raised 7bps in December 2015 due to seasonal factors that pushed up demand for liquidity at Christmas and New Year, coupled with contractive fiscal operations. Meanwhile, banks lowered the weighted average lending rate 8bps to 12.83% (yoy) from 12.91% (yoy) previously (Graph 1.42). Lower rates primarily affected working capital credit and investment credit, dropping 12bps and 7bps respectively to 12.46% (yoy) and 12.12% (yoy). Consequently, the spread between lending and deposit rates narrowed from 495bps the month earlier to 489bps (Graph 1.43).
Inf>3,0% 2,0%<Inf≤3,0% 1%<Inf≤2% 0,5%<Inf≤1% 0%<Inf≤0,5% Inf≤0%
National Inflation 0.51% (mtm)

M o n e t a r y P o l i c y R e p o r t | 22
Liquidity growth in the economy (M2) decelerated in Q4/2015 due to quasi-money. M2 growth slowed to 8.95% (yoy) from 12.43% (yoy) in the same period as solid M1 growth was inadequate to compensate the decline in M2. Growth of quasi-money fell from 12.53% (yoy) last quarter to 8.37% (yoy), while M1 growth accelerated from 8.51% (yoy) to 11.59% (yoy). Robust growth of private rupiah demand deposits (corporate and individual) contributed to M1 growth. Such growth momentum of currency was indicative of economic gains in the reporting period.
Graph 1.42. Loan Rates Graph 1.43. Banking Interest Rate
Based on its determinants, slower M2 growth stemmed from Net Foreign Assets (NFA) and Net Domestic Assets (NDA) (Graph 1.44). A drop in the Net Foreign Assets (NFA) of Bank Indonesia precipitated the overall NFA decline. Meanwhile, the NDA decrease was attributed to slower credit growth and net claims on central government (NCG) due to a surge in government placements at Bank Indonesia in the form of 2016 budget prefunding.
Graph 1.44. M2 growth and the influence factors (%, yoy)
The Banking Industry
Financial system stability was maintained, underpinned by banking system resilience and relatively stable financial markets. Banking industry resilience remained sound, with credit, liquidity and market risks well mitigated, bolstered by a solid capital base.
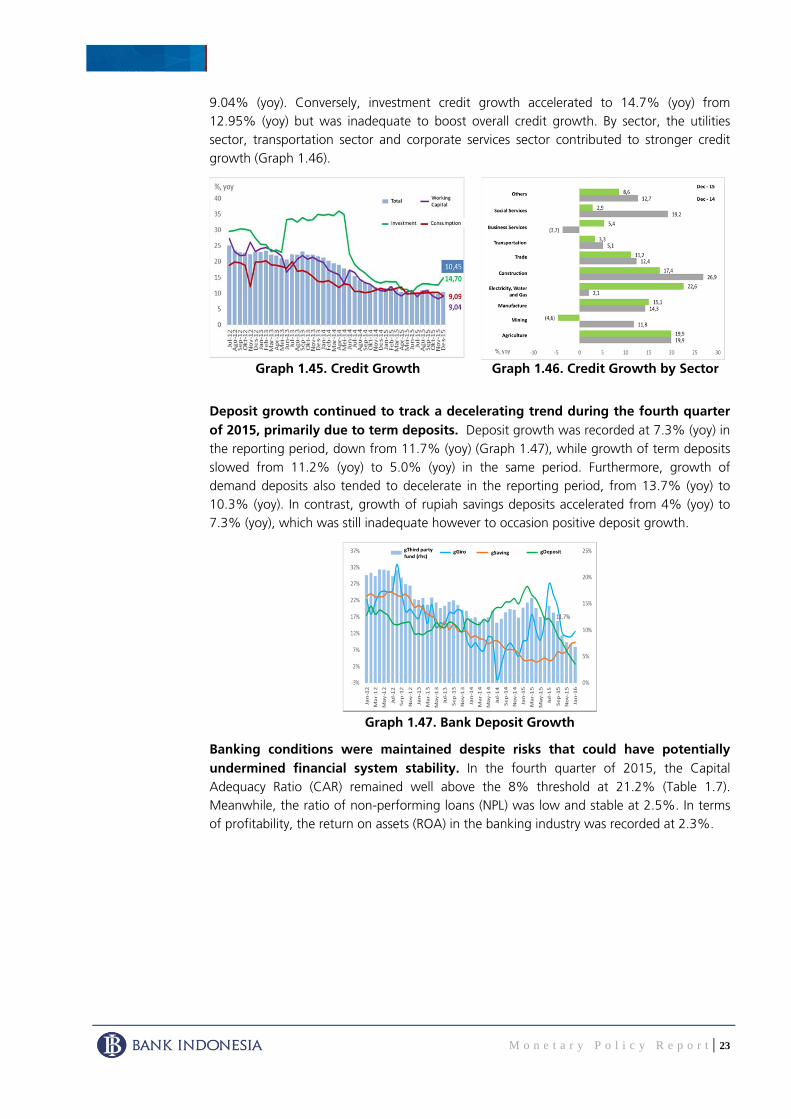
Credit growth continued to track a downward trend in the fourth quarter of 2015. Credit growth1 decelerated from 11.1% (yoy) to 10.45% (yoy) in the reporting period (Graph 1.45), in particular affecting working capital credit that fell from 10.72% (yoy)
1 According to the banking concept.
M o n e t a r y P o l i c y R e p o r t | 23
9.04% (yoy). Conversely, investment credit growth accelerated to 14.7% (yoy) from 12.95% (yoy) but was inadequate to boost overall credit growth. By sector, the utilities sector, transportation sector and corporate services sector contributed to stronger credit growth (Graph 1.46).
Graph 1.45. Credit Growth Graph 1.46. Credit Growth by Sector
Deposit growth continued to track a decelerating trend during the fourth quarter of 2015, primarily due to term deposits. Deposit growth was recorded at 7.3% (yoy) in the reporting period, down from 11.7% (yoy) (Graph 1.47), while growth of term deposits slowed from 11.2% (yoy) to 5.0% (yoy) in the same period. Furthermore, growth of demand deposits also tended to decelerate in the reporting period, from 13.7% (yoy) to 10.3% (yoy). In contrast, growth of rupiah savings deposits accelerated from 4% (yoy) to 7.3% (yoy), which was still inadequate however to occasion positive deposit growth.
Graph 1.47. Bank Deposit Growth
Banking conditions were maintained despite risks that could have potentially undermined financial system stability. In the fourth quarter of 2015, the Capital Adequacy Ratio (CAR) remained well above the 8% threshold at 21.2% (Table 1.7). Meanwhile, the ratio of non-performing loans (NPL) was low and stable at 2.5%. In terms of profitability, the return on assets (ROA) in the banking industry was recorded at 2.3%.

M o n e t a r y P o l i c y R e p o r t | 24
Table 1.7. Banking Indicators
The Stock Market and Government Securities The domestic stock market rallied during the final quarter of 2015. The IDX Composite climbed 8.7% (qtq) to close at 4,593.01 on 31st December 2015 (Graph 1.48), bolstered by bullish domestic and external sentiment. Externally, risks associated with the FFR hike eased. On the home front, positive sentiment stemmed from controlled inflation and restored confidence in the domestic economic outlook in line with the policy package introduced by the Government combined with Bank Indonesia intervention on the foreign exchange market to stabilise the rupiah. The Indonesia Stock Exchange outperformed other ASEAN bourses in Q4/2015 as well as Hong Kong and India.
Graph 1.48. JCI and Global Stock Index Q4 2015
Government Bond market performance improved in the fourth quarter of 2015, reflecting a drop in the yields of all tenors. Mirroring the stock market, tradeable government securities (Government Bond) were influenced by positive domestic and external sentiment. In general, Government Bond yield fell 73bps from 9.55% to 8.82%, with the yields of short, medium and long-term tenors falling respectively by 66bps, 71bps and 84bps to 8.54%, 8.88% and 9.09%. Meanwhile, the yield of the benchmark 10-year tenor fell 84bps from 9.60% to 8.76% (Graph 1.49). In the fourth quarter of 2015, non-resident investors booked a net buy totalling Rp34.1 trillion, with foreign holdings accounting for 36.54% (Graph 1.50).
Sep Oct Nop Dec Jan Feb Mar Apr Mei Jun Jul Agust Sep Oct Nop Dec
Total Asset (T Rp) 5,418.8 5,445.7 5,511.1 5,615.1 5,622.0 5,683.2 5,784.0 5,792.7 5,837.7 5,933.2 5,925.7 6,010.7 6,147.5 5,997.3 6,022.9 6,132.8 Third Party Fund (T Rp) 3,995.8 4,011.4 4,054.7 4,114.4 4,105.9 4,151.4 4,198.6 4,217.6 4,232.1 4,319.7 4,328.8 4,366.6 4,464.1 4,370.4 4,367.0 4,413.2 Credit* (T Rp) 3,561.3 3,558.1 3,596.6 3,674.3 3,634.3 3,665.7 3,679.9 3,711.6 3,757.1 3,828.0 3,833.7 3,881.3 3,956.5 3,923.4 3,950.7 4,058.1 LDR* (%) 89.13 88.70 88.70 89.30 88.52 88.30 87.65 88.00 88.78 88.62 88.56 88.9 88.6 89.8 90.5 92.0 NPLs Gross* (%) 2.29 2.35 2.36 2.16 2.35 2.43 2.40 2.48 2.58 2.56 2.70 2.8 2.7 2.7 2.7 2.5 CAR (%) 19.40 19.64 19.62 19.38 20.84 21.09 20.73 20.55 20.28 20.13 20.56 20.5 20.4 20.8 21.1 21.2 NIM (%) 4.2 4.2 4.2 4.1 4.1 4.0 5.1 5.2 5.2 5.2 5.2 5.2 5.2 5.2 5.2 5.2 ROA (%) 2.8 2.8 2.8 2.8 2.7 2.4 2.6 2.5 2.4 2.2 2.2 2.2 2.2 2.2 2.3 2.3 * without channeling
Primary Indicators
2014 2015

M o n e t a r y P o l i c y R e p o r t | 25
Graph 1.49. Change in Government Bond Yield Fourth Quarter 2015
Graph 1.50. Government Bond Yield and net foreign buy / sell (quarterly)
In January 2016, the domestic stock market recorded positive performance. The IDX Composite rallied 22 points (0.48%) to close at 4,615.16 on 29th January 2016. Externalities drove the gains, namely the oil price rebound in the fourth week of January, expectations of a smaller and delayed FFR hike until the second half of the year and the loose policy stance maintained by the Bank of Japan (BoJ) and European Central Bank (ECB). Domestically, however, investors were upbeat on economic performance in Indonesia in line with the BI Rate reduction, government deregulation to enhance the investment climate, and the effective implementation of various infrastructure projects. Solid IDX Composite performance was further evidenced by positive growth at a time when other regional bourses were experiencing corrections, including China (-23.4%) and Singapore (-8.9%) (Graph 1.51).
The Government Bond market also performed well in January 2016. Congruous with the stock market, positive domestic and external sentiment served to boost Government Bond market performance. In general, yield dropped 50bps from 8.82% to 8.32%, with the yields of short, medium and long-term tenors falling respectively by 66bps, 47bps and 36bps to 7.88%, 8.41% and 8.72%. Meanwhile, the yield of the benchmark 10-year tenor fell 50bps from 8.76% to 8.26% (Graph 1.52). In January 2016, non-resident investors booked a net buy totalling Rp19.8 trillion, with foreign holdings therefore accounting for 37.3%.
Graph 1.51. JCI and Global Stock Index
in January 2016 (mtm) Graph 1.52. Government Bond Yield and
net foreign buy / sell (monthly)

M o n e t a r y P o l i c y R e p o r t | 26
Nonbank Financing Nonbank economic financing increased in the reporting period. Total financing in Q4/2015 through initial public offerings (IPO), rights issues, corporate bonds, medium-term notes (MTN), promissory notes and other financial instruments increased to Rp41.6 trillion from Rp17.6 trillion in the previous quarter (Table 1.8). A significant bump in initial public offerings (IPO) from Rp5.3 trillion last quarter to Rp29.1 trillion contributed to the increase.
Table 1.8. Non-Bank Financing
The Payment System
The rupiah currency was managed in accordance with domestic economic performance, particularly in terms of household consumption. Average daily currency in circulation in the fourth quarter of 2015 amounted to Rp586.8 trillion, growing 11.0% (yoy), compared to Rp518.3 trillion, or 9.4% (yoy), in the previous quarter (Graph 1.53). Greater demand for currency in circulation stemmed from an intensification of economic activity in the fourth quarter, including large currency withdrawals in December 2015 to coincide with Christmas and end-of-year holidays.
Graph 1.53. Money in Circulation (yoy)
Against a backdrop of more currency in circulation, Bank Indonesia also enhanced the quality of the currency circulated. In the fourth quarter of 2015, as many as 1.7 billion banknotes unfit for circulation, with a value of Rp44.0 trillion, were destroyed and replaced with currency fit for circulation. In comparison, 1.5 billion banknotes were
Rp Trillion
Q1 Q2 Q3 Q4 Total Q1 Q2 Q3 Q4 Total
Nonbank 18.2 39.2 8.2 44.5 110.1 22.3 47.7 17.6 41.6 129.2
Stocks 8.6 17.7 0.0 21.2 47.6 4.7 14.5 5.3 29.1 53.6
o/w Financial sector issuers 5.5 4.1 0.0 3.1 12.8 0.0 0.0 0.1 0.0 0.1
Bonds 8.0 17.5 6.8 15.1 47.5 12.8 26.2 9.5 7.0 55.5
o/w Financial sector issuers 5.5 9.5 5.5 9.8 30.3 12.1 9.9 7.5 5.7 35.2
MTN and Promissory Notes + NCD 1.6 3.8 1.4 8.1 14.9 4.8 7.0 2.9 5.6 20.3
o/w Financial sector issuers 1.2 3.2 1.2 3.5 9.2 3.3 6.2 1.2 3.4 14.1
Source: OJK and BEI (processed)
20152014

M o n e t a r y P o l i c y R e p o r t | 27
removed from circulation and destroyed, amounting to Rp41.9 trillion, in the previous quarter. The high destruction rate was in line with a surge of inflow from the banking industry to Bank Indonesia coupled with a higher standard or fitness level.
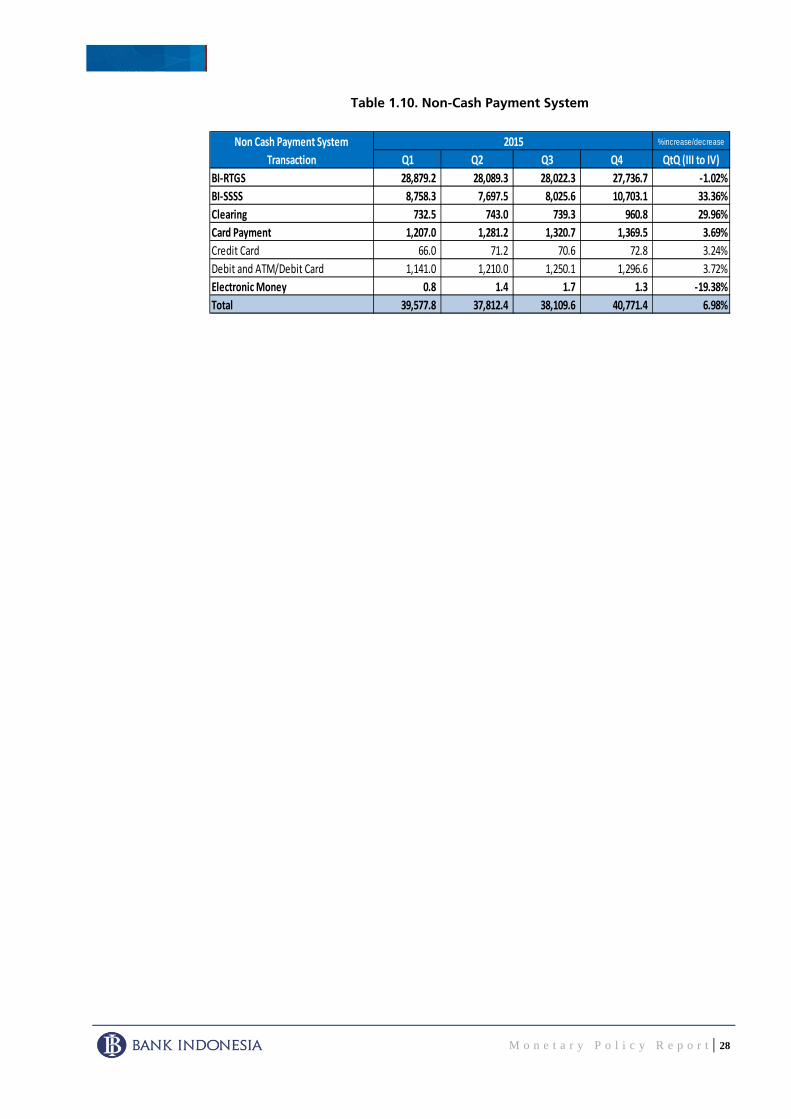
The payment system remained secure and uninterrupted throughout the fourth quarter of 2015. Compared to the previous period, noncash payment system transactions increased in terms of both value and volume. Transaction volume was observed to rise 2.06% (yoy) or by 29,354.23 transactions, while transaction value climbed 6.98% (yoy) or Rp2,661.81 trillion (Tables 1.9 and 1.10). In general, card-based payment instruments continued to dominate payment system transaction volume, accounting for 1.3 trillion transactions, with growth at 4.9% (qtq) on the previous period. The increase in card-based payment volume reflected broader use of noncash payment instruments amongst the public. Nonetheless, the largest increase in transaction volume was noted to affect the Bank Indonesia – Scripless Securities Settlement System (BI-SSSS), amounting to 12.1 thousand transactions or 30.5% (qtq). Based on value, however, the increase primarily stemmed from the Bank Indonesia – Scripless Securities Settlement System (BI-SSSS) and the National Clearing System (SKNBI). BI-SSSS transactions jumped Rp2,677.4 trillion or 33.4% (qtq) and SKNBI transactions were up Rp221.5 trillion or 30.0% (qtq) on the previous period.
Table 1.9. Volume Non-Cash Payment System
Despite a backdrop of increasing transaction value and volume in the noncash payment system, payment transactions settled through the Bank Indonesia – Real Time Gross Settlement (BI-RTGS) system actually decreased in terms of both value and volume. In general, the decline in RTGS transactions was the result of new policy that raised the floor limit on transactions settled through the Bank Indonesia – Real Time Gross Settlement (BI-RTGS) system to Rp500 million. Consequently, payment system transaction volume settled through the Bank Indonesia – Real Time Gross Settlement (BI-RTGS) system fell 19.32% to 2,371.24 thousand transactions, which was accompanied by a commensurate 1.02% decrease in transaction value to Rp27,736.73 trillion in the reporting period.
Volume (Thousand)%increase/decrease
Q1 Q2 Q3 ∆Q3‐Q2 QtQ (III to IV)
BI‐RTGS 2,814.82 2,917.79 2,939.05 2,371.24 ‐19.32%
BI‐SSSS 45.60 46.36 39.78 51.91 30.51%
Clearing 27,120.50 27,868.97 27,855.16 30,688.25 10.17%
Card Payment 1,142,496.20 1,203,569.01 1,224,670.52 1,284.98 4.92%
Credit Card 65,662.44 70,286.39 71,179.69 74,197.00 4.24%
Debit and ATM/Debit Card 1,076,833.76 1,133,282.61 1,153,490.84 1,210,780.00 4.97%
Electronic Money 80,265.97 143,092.96 172,725.50 139,495.00 ‐19.24%
Total 1,252,743.10 1,377,495.09 1,428,230.01 1,457,584.24 2.06%
2015Non Cash Payment System
Transaction
M o n e t a r y P o l i c y R e p o r t | 28
Table 1.10. Non-Cash Payment System
%increase/decrease
Q1 Q2 Q3 Q4 QtQ (III to IV)
BI‐RTGS 28,879.2 28,089.3 28,022.3 27,736.7 ‐1.02%
BI‐SSSS 8,758.3 7,697.5 8,025.6 10,703.1 33.36%
Clearing 732.5 743.0 739.3 960.8 29.96%
Card Payment 1,207.0 1,281.2 1,320.7 1,369.5 3.69%
Credit Card 66.0 71.2 70.6 72.8 3.24%
Debit and ATM/Debit Card 1,141.0 1,210.0 1,250.1 1,296.6 3.72%
Electronic Money 0.8 1.4 1.7 1.3 ‐19.38%
Total 39,577.8 37,812.4 38,109.6 40,771.4 6.98%
Non Cash Payment System
Transaction
2015
M o n e t a r y P o l i c y R e p o r t | 29
ECONOMIC OUTLOOK
Bank Indonesia projects growth in 2016 to outperform that posted in 2015 in the range of 5.2-5.6%. Stronger growth will be supported by fiscal stimuli, in particular the accelerated implementation of infrastructure projects. Private investment is also projected to pick up due to the Government’s recent policy packages, coupled with additional room to gradually ease monetary policy, while maintaining macroeconomic stability. Meanwhile, the net negative contribution of exports will be exacerbated by sluggish external conditions and a surge of imports to support infrastructure project realisation.
At the same time, inflation is projected at the midpoint of the 4±1% inflation target. Demand-side inflationary pressures are expected to escalate as production capacity utilisation increases. Inflation expectations will, however, remain anchored through policy support and coordination between Bank Indonesia and the Government. On the other hand, minimal external inflationary pressures are predicted due to limited increases in terms of international commodity prices, the downward oil price trend and more stable exchange rates.
Bank Indonesia will remain vigilant of various risks that could overshadow future economic rebalancing. Globally, the risks are linked to a lacklustre global recovery, the ongoing international commodity price slide, including oil, as well as economic moderation and bearish financial markets in China. Domestically, potential inflation of volatile foods will be monitored, amongst others.
Global Economic Outlook
Economic growth projections for 2016 have been revised down. Projected global GDP growth in 2016 was revised down to 3.4% (yoy). The correction assumes weaker growth in the United States and emerging market countries. The US economy is projected to rebound, albeit not solid. Furthermore, the recovery in Europe will persist gradually, while the economy of Japan is expected to remain fragile. Economic moderation in China is projected to endure, while the economy of India will remain robust on the back of domestic demand.
Economic growth in the United States is predicted at a slower pace than previously assumed. Actual US growth in the fourth quarter of 2015 was recorded below the forecast at 1.8% (yoy) due to sluggish consumption, a weak housing sector and a contraction of the manufacturing industry. The favourable impact of the lower oil price on US consumption as a net oil importer was offset, however, by household deleveraging along with non-financial corporations. Meanwhile, housing sales remained in negative territory despite lower mortgage rates. Furthermore, the manufacturing industry continued to contract in response to minimal export growth. Consequently, US growth projections for 2016 were revised down from 2.7% to 2.6%.
2

M o n e t a r y P o l i c y R e p o r t | 30
The recovery persisted in Europe, supported by quantitative easing. The European Central Bank (ECB) is expected to expand QE in March 2016 due to stubbornly low inflation and the risk of euro appreciation. Such conditions have eroded market confidence in the ECB’s ability to hit the inflation target. Meanwhile, exports from Europe continue to track a downward trend despite early indications of a potential rebound. The Purchasing Mangers Index (PMI) also continued to fall but remained in the expansive zone.
The economy continues to gradually recover in Japan. Growth in Japan is driven by consumption and government stimuli. Nonetheless, future consumption gains will be stifled by the ageing population. Consequently, households have a greater propensity to save. Furthermore, export growth remains negative and falling in line with low industrial production. Inflation in Japan has also begun falling again, consistent with lower import prices. In response to lower inflation expectations, the Bank of Japan (BoJ) proposes to adopt a negative policy rate in February 2016.
Economic moderation persists in China. The slowdown is the result of weak investment and production as well as corporate deleveraging. Economic growth in China is projected to decelerate to 6.3% (yoy) in 2016 from 6.9% in 2015. The yuan remains volatile and vulnerable to depreciation as a result of fundamental risks and uncertain exchange rate policy as well as stock market regulations. Moving forward, risks to economic growth will originate from the tertiary and manufacturing sectors. Services sector growth, reflecting economic rebalancing in China, is at risk of decline due to government policy to restrict shadow banking, coupled with the resultant potential decline of retail sales. Meanwhile, the manufacturing sector continues to show signs of moderation, including the industrial profit data released in December 2015 that indicated a contraction and the manufacturing Purchasing Mangers Index (PMI) in January 2016, which is predicted at a lower level than in the previous period.
Robust economic growth is predicted to endure in India during 2016 in line with previous projections. The economy of India is supported by solid domestic demand, evidenced by the upward trend of motor vehicle sales. Furthermore, inflation rose in December 2016 on more expensive food prices but remained below the 6% target set by the Reserve Bank of India (RBI). Meanwhile, business sentiment was eroded by concerns over fiscal sustainability after the introduction of fuel subsidies by the Government to expand liquefied petroleum gas (LPG) utilisation in rural areas.
Congruous with lower global economic projections, world trade volume (WTV) and commodity prices were also revised down. For 2016, WTV growth was corrected to 2.9%, while the Indonesia Crude Price (ICP) also faced a deep correction. An increase in supply from OPEC and dwindling global demand while inventory remains high contributed to low oil prices. The price of Brent is predicted to remain south of USD50 per barrel until 2017. Consequently, the downward Indonesia Export Price Index (IHKEI) trend is projected to continue in 2016. Furthermore, lower commodity prices are expected primarily to affect metals in line with less production activity in China and pressures from low oil prices.
Domestic Economic Outlook
Economic growth in 2016 is projected to accelerate in the range of 5.2-5.6%. Growth in 2016 will be supported by fiscal stimuli, in particular through the accelerated implementation of infrastructure projects. Private investment is also set to pick up after the

M o n e t a r y P o l i c y R e p o r t | 31
Government introduced a series of policy packages and Bank Indonesia gradually loosens monetary policy, while maintaining macro stability. Inflation at yearend 2016 is projected around the midpoint of the inflation target, namely 4±1%.
In general, household consumption is predicted in the 5.0-5.4% range in 2016. Stable household consumption is the result of a growing working-age population, thereby swelling the workforce. In 2016, public purchasing power is also expected to improve as minimum wages are raised by an average of 10.8% nationally and civil servants receive salary bonuses. Inflation, which is predicted at around 4%, should also help to maintain public purchasing power. Furthermore, growth of job opportunities, in particular linked to infrastructure projects, will also create a source of income against a backdrop of limited export performance.
Investment growth in 2016 is projected to outperform that achieved in 2015 within the range of 7.2-7.6%. The accelerated realisation of infrastructure projects is expected to boost investment, supported by a more efficient tender process. Private investment is also set to accelerate after the Government introduced a series of policy packages and Bank Indonesia gradually loosens monetary policy, while maintaining macro stability
Export growth is projected down on the previous year. The decline in export will stem from the sluggish global economy, particularly China and the United States as the main export markets for Indonesia. The prices of export commodities from Indonesia are also predicted in negative territory during 2016. Consequently, real exports are also projected to contract in 2016. Measures to improve competitiveness, through market and product diversification, amongst others, are expected to restore long-term export growth.
Imports in 2016 are forecasted to continue contracting, albeit not as deeply as in 2015 due to domestic demand, especially consumption and investment. Imports of capital goods and raw materials are expected to surge to support public infrastructure projects and private investment.
%Y-o-Y, 2010 Price
I II III IVPrivate Consumption* 5.29 4.72 4.68 4.98 4.99 4.84 5.00 - 5.40
Government Consumption 1.16 2.91 2.61 7.11 7.31 5.38 6.40 - 6.80
Investment 4.57 4.63 3.88 4.79 6.90 5.07 7.20 - 7.60
Export 1.00 -0.62 -0.01 -0.60 -6.44 -1.97 -5.50 - -5.10
Import 2.19 -2.19 -6.97 -5.90 -8.05 -5.84 -5.10 - -4.70
GDP 5.02 4.73 4.66 4.74 5.04 4.79 5.20 - 5.60
Source : BPS
* including consumption of Non-Profit Institutions Servings Households
^ Bank Indonesia's Projection
Table 2.1Economic Growth - Demand Side
2015Component 2014 2015 2016^
M o n e t a r y P o l i c y R e p o r t | 32
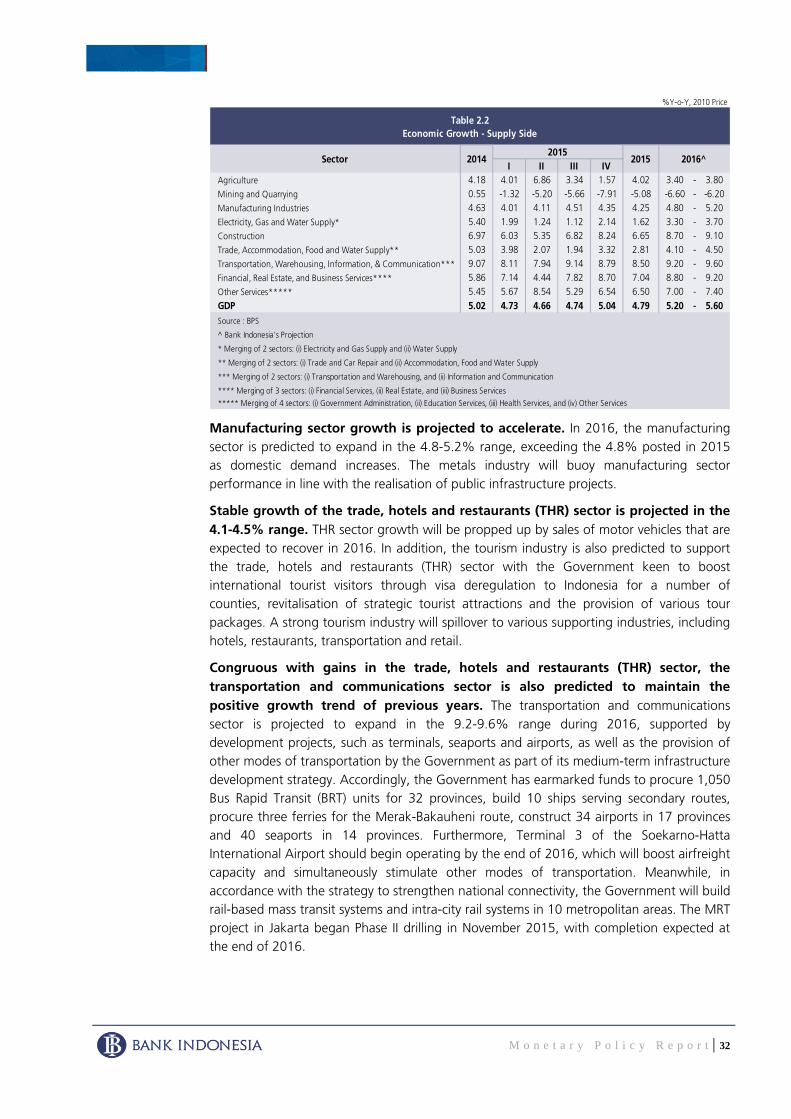
Manufacturing sector growth is projected to accelerate. In 2016, the manufacturing sector is predicted to expand in the 4.8-5.2% range, exceeding the 4.8% posted in 2015 as domestic demand increases. The metals industry will buoy manufacturing sector performance in line with the realisation of public infrastructure projects.
Stable growth of the trade, hotels and restaurants (THR) sector is projected in the 4.1-4.5% range. THR sector growth will be propped up by sales of motor vehicles that are expected to recover in 2016. In addition, the tourism industry is also predicted to support the trade, hotels and restaurants (THR) sector with the Government keen to boost international tourist visitors through visa deregulation to Indonesia for a number of counties, revitalisation of strategic tourist attractions and the provision of various tour packages. A strong tourism industry will spillover to various supporting industries, including hotels, restaurants, transportation and retail.
Congruous with gains in the trade, hotels and restaurants (THR) sector, the transportation and communications sector is also predicted to maintain the positive growth trend of previous years. The transportation and communications sector is projected to expand in the 9.2-9.6% range during 2016, supported by development projects, such as terminals, seaports and airports, as well as the provision of other modes of transportation by the Government as part of its medium-term infrastructure development strategy. Accordingly, the Government has earmarked funds to procure 1,050 Bus Rapid Transit (BRT) units for 32 provinces, build 10 ships serving secondary routes, procure three ferries for the Merak-Bakauheni route, construct 34 airports in 17 provinces and 40 seaports in 14 provinces. Furthermore, Terminal 3 of the Soekarno-Hatta International Airport should begin operating by the end of 2016, which will boost airfreight capacity and simultaneously stimulate other modes of transportation. Meanwhile, in accordance with the strategy to strengthen national connectivity, the Government will build rail-based mass transit systems and intra-city rail systems in 10 metropolitan areas. The MRT project in Jakarta began Phase II drilling in November 2015, with completion expected at the end of 2016.
%Y-o-Y, 2010 Price
I II III IVAgriculture 4.18 4.01 6.86 3.34 1.57 4.02 3.40 - 3.80Mining and Quarrying 0.55 -1.32 -5.20 -5.66 -7.91 -5.08 -6.60 - -6.20Manufacturing Industries 4.63 4.01 4.11 4.51 4.35 4.25 4.80 - 5.20Electricity, Gas and Water Supply* 5.40 1.99 1.24 1.12 2.14 1.62 3.30 - 3.70Construction 6.97 6.03 5.35 6.82 8.24 6.65 8.70 - 9.10Trade, Accommodation, Food and Water Supply** 5.03 3.98 2.07 1.94 3.32 2.81 4.10 - 4.50Transportation, Warehousing, Information, & Communication*** 9.07 8.11 7.94 9.14 8.79 8.50 9.20 - 9.60Financial, Real Estate, and Business Services**** 5.86 7.14 4.44 7.82 8.70 7.04 8.80 - 9.20Other Services***** 5.45 5.67 8.54 5.29 6.54 6.50 7.00 - 7.40GDP 5.02 4.73 4.66 4.74 5.04 4.79 5.20 - 5.60Source : BPS
^ Bank Indonesia's Projection
* Merging of 2 sectors: (i) Electricity and Gas Supply and (ii) Water Supply
** Merging of 2 sectors: (i) Trade and Car Repair and (ii) Accommodation, Food and Water Supply
*** Merging of 2 sectors: (i) Transportation and Warehousing, and (ii) Information and Communication
**** Merging of 3 sectors: (i) Financial Services, (ii) Real Estate, and (iii) Business Services
2015 2016^2015
***** Merging of 4 sectors: (i) Government Administration, (ii) Education Services, (iii) Health Services, and (iv) Other Services
2014
Table 2.2Economic Growth - Supply Side
Sector

M o n e t a r y P o l i c y R e p o r t | 33
Against a backdrop of rapid technological advancement and the flourishing middle class, demand for communications data and traffic will continue to expand. Consequently, the Government is constantly striving to extend broadband coverage throughout the archipelago through cooperation with third parties such as Google to provide telecommunications networks in remote areas. Furthermore, the development of new communications technology, namely 4G, is projected to catalyse additional data usage in Indonesia.
The financial, real estate and corporate services sector is projected to grow at 8.8-9.2% in 2016. The outlook for the banking industry is expected to improve, consistent with ongoing momentum from the reduction to the BI Rate, which will be ultimately be transmitted to lower lending rates and thus boost credit growth. Lower lending rates should bolster various economic sectors, including the property sector that slumped in 2015. A vibrant property sector is indicative of greater economic activity therein, such as the production of building materials and construction services.
The mining and quarrying sector contraction is projected to continue. The sector is predicted to grow negatively in the range of -6.6% to -6.2% in 2016 in line with the listless global economic recovery and persistently low mineral commodity prices.
Moderate growth of the utilities sector (electricity, gas and clean water) is projected in 2016. The sector is predicted to achieve growth in the 3.3-3.7% range, which is relatively stable on the previous year. Several projects remain in the execution phase, including the development of a 35,000MW power station and construction of a drinking water supply network (SPAM).
The construction sector is projected to grow stably in the 8.7-9.1% range in 2016. Implementation of recently announced government-led infrastructure projects will support construction sector growth, especially after the release of Presidential Decree No. 3 of 2016 concerning National Strategic Projects. In 2016, the Government is expected to commence construction of several large-scale projects in eight sectors, namely air transportation, telecommunications and informatics, sea transportation, railways, electricity and energy, land transportation and roadways, housing as well as water resources. The projects include construction of Terminal 3 at Soekarno-Hatta International Airport, construction of Kertajati Majalengka International Airport, construction of Achmad Yani International Airport in Semarang, construction of Kalibaru Priok Port Terminal, construction of a multipurpose terminal at Teluk Lamong, construction of the Trans Java Toll Road (Cikampek-Palimanan, Bawen-Salatiga, Solo-Ngawi-Kertosono) and construction of the Trans Sumatra Toll Road (Bakauheni-Tegineneng, Pekanbaru-Dumai, Kayuagung-Betung).
The agricultural, livestock, forestry and fisheries sector is projected to track an upward trend. Growth of the agricultural, livestock, forestry and fisheries sector in 2016 is predicted in the 3.4-3.8% range. The severe El Nino weather phenomenon that befell the country throughout 2015 delayed the planting season until the beginning of 2016. Furthermore, the monsoon season during the months of January and February 2016 is not expected to be sufficient to adequately supply the planting season, thus delaying the harvesting season until April-September. Consequently, growth should be strongest in the second quarter of the year. Despite pressures on agricultural performance stemming from the ongoing El Nino event, the weather phenomenon has boosted fisheries production, thus the agricultural, livestock, forestry and fisheries sector is predicted to maintain positive growth overall. In addition, the livestock subsector is also expected to buoy performance
M o n e t a r y P o l i c y R e p o r t | 34
through proposed public investment to reinforce domestic livestock supply (strengthening livestock breeds and providing special livestock transportation vessels).
Growth of the services sector is projected to improve on the previous year in the range of 7.0-7.4%. The main contributor to growth of the tertiary sector will be household and individual services as government infrastructure projects and programs are implemented that require consultancy services, expertise, project managers and project supervisors. A number of government ministries, including the Ministry of Agriculture, the Ministry of Public Works and Housing as well as the Ministry of Transportation, have already procured consultants and experts as well as project supervisors for placement in 2016.
In 2017, economic growth is projected to accelerate again as global economic growth momentum is maintained and international commodity prices rebound. In terms of domestic demand, infrastructure development will remain the foremost contributor to economic growth against a backdrop of limited global growth. Regarding consumption, public purchasing power should be maintained, while inflation is controlled within the inflation target corridor of 4±1%.
Inflation Outlook
Inflation in 2016 is projected around the midpoint of the target corridor. At home, demand-side inflationary pressures will escalate as economic growth approaches its potential. Notwithstanding, inflation expectations should remain anchored through policy support and coordination between Bank Indonesia and the Government. Conversely, intense external inflationary pressures are not expected to manifest due to limited increases of international commodity prices in line with the gradual global economic recovery, lower oil prices and relatively stable exchange rates.
Moderate core inflationary pressures are forecasted for 2016. Externally, core inflation will be mitigated by limited gains in international commodity prices congruous with the gradual global economic recovery and relatively stable exchange rates. Domestically, stronger demand will be met through increased production capacity, evidenced by a level of GDP growth that remains below potential. Consequently, demand-side inflationary pressures will intensify slightly, albeit minimally. In addition, inflation expectations will be anchored by a sound policy mix and coordination between Bank Indonesia and the Government.
Inflationary pressures on volatile foods are predicted to remain under control despite increasing modestly. In 2016, volatile food inflation will be offset by production gains and uninterrupted distribution combined with improved food trade regulation.
Administered prices, however, will be the main contributor to lower inflation. In 2016, inflation of administered prices is projected at a lower level than the previous year due to sliding crude prices on the international market, leading to cheaper energy prices.
In 2017, inflation is projected within the target corridor of 4±1% due to the panoply of policies instituted to control inflationary pressures. The main source of inflation in 2017 will likely be increasing domestic demand. Core inflation will be controlled in line with anchored expectations. Furthermore, pressures on volatile foods should ease as

M o n e t a r y P o l i c y R e p o r t | 35
production is ramped up and food management improves. Meanwhile, administered prices should mirror international prices in terms of limited gains.

M o n e t a r y P o l i c y R e p o r t | 36
MONETARY POLICY RESPONSE
The BI Board of Governors agreed on 17 th and 18th February 2016 to lower the BI Rate 25 bps to 7%, as well as the Deposit Facility rate and the Lending Facility rate, to 5% and 7.5%, respectively. Bank Indonesia also concurred to reduce the rupiah denominated primary reserve requirement by 1%, from 7.5% to 6.5%, effective from 16 th March 2016.
The move is consistent with greater room to ease monetary policy on the back of solid macroeconomic stability, especially in terms of less intense inflationary pressures in 2016 as well as less uncertain global financial markets. The dual policy of lowering the BI Rate and primary reserve requirement is expected to strengthen efforts to boost the ongoing economic growth. In addition, Bank Indonesia will continue to strengthen coordination with the Government to control inflation, bolster growth stimuli and accelerate structural reforms, thereby supporting sustainable economic growth moving forward, while maintaining macroeconomic stability
.
3

M o n e t a r y P o l i c y R e p o r t | 37
Box: Resilient Household Consumption
Household consumption was resilient during 2015 despite declining income growth. Case studies from several countries have shown that moderating economic growth will be followed by weaker non-food consumption. Nonetheless, slower economic growth often triggers greater food consumption. In Indonesia, resilient household consumption has been evidenced by an increase in the percentage of households with income adequate to meet daily necessities, demonstrating the positive influence of social assistance programs. Furthermore, consumption was also maintained through borrowing and/or dipping into savings.
Economic moderation has differing effects on food consumption amongst low-income households. Against a backdrop of economic moderation in Indonesia, household consumption was maintained, especially in terms of food. For low-income earners, foods represent inferior goods, thus evoking the phenomenon of Engel’s Law (Graph 1). The theory motivated economists to classify consumer goods based on income and price elasticity. The consumption of consumer goods classified as inferior goods, therefore, will decline as income rises. Such a trend is not only found in Indonesia but also in advanced countries such as the United States (Graph 2). In contrast, household non-food consumption will also emulate overall consumption growth.
Graph 1. Indonesia Consumption Graph 2. US ConsumptionThe proportion of income spent on food also falls as public purchasing power increases. For households spending less than Rp2 million per month, the proportion of food consumption accounts for around 60% of total expenditure.1 The proportion declines, however, for households spending more than Rp2 million monthly (Graph 3).
1 Data on household expenditure was taken from the National Socio-Economic Survey (Susenas). According to Susenas, expenditure is a proxy of income.
‐10
‐5
0
5
10
15
20
123412341234123412341234123412341234123412341234123412341234
2001 2002 2003 2004 2005 2006 2007 2008 2009 2010 2011 2012 2013 2014 2015
%FoodNon‐FoodCp
NBER Recession
NBER Recession
NBER Recession
‐5
0
5
10
15
20
M J S D M J S D M J S D M J S D M J S D M J S D M J S D M J S D M J S D M J S D
1978 1979 1980 1981 1982 1983 1984 1985 1986 1987
%FoodNon‐FoodCp
NBER Recession
NBER Recession

M o n e t a r y P o l i c y R e p o r t | 38
In Indonesia, resilient household consumption has been evidenced by the increase in the percentage of households with income adequate to meet daily necessities. Susenas data showed that in 2011, 72% of survey respondents acknowledged that their income was adequate to meet daily expenditure. That figure jumped to 76% in 2014 (Graph 4).
Graph 3. The proportion of food and non-food in the Household
Expenditure
Graph 4. Adequacy of Household Consumption
The increase in the percentage of households with income adequate to meet daily needs demonstrates the positive influence of social assistance. Government social assistance programs have become increasingly targeted over time. Without taking into account the effect of providing social assistance programs, the number of households that feel their income is adequate has increased. Notwithstanding, by omitting households that receive social assistance, the number of households that feel their income is adequate drops from 58% in 2011 to 43% in 2014 (Graph 5). The benefit of targeted social assistance programs can be observed from the decline in the percentage of residents who feel their income is insufficient and also do not receive social assistance.
Resilient consumption was also maintained through borrowing or using savings. Households with insufficient income to meet their daily necessities strive to borrow and use savings. As many as 41% of households with insufficient income to meet their daily needs borrow from family. In addition to borrowing from family, 33% borrow from friends or neighbours, 10.8% use savings, 8.1% sell their possessions and 6.9% borrow from various other sources as well as pawn their possessions. In comparison to 2011, household efforts to meet their daily needs were dominated by borrowing from friends/neighbours as well as family (Graph 6). In 2015, however, efforts to maintain consumption were met through savings, in particular for low-income earners, which was evidenced by slower growth of savings deposits of less than Rp100 million (Graph 7).

M o n e t a r y P o l i c y R e p o r t | 39
Graph 5. Recipients Profile of Social Assistance Program
Graph 6. Consumption Compliance Alternative Outside Income
Consumption and saving are influenced by public expectations. Furthermore, households are known to undertake consumption smoothing in order to maintain consumption when income declines. Congruous with lower income, the proportion of income saved also decreases (Graph 8), indicating the public’s proclivity to maintain their current level of consumption in line with optimism concerning future economic conditions. Such behaviour emphasises the importance of boosting economic performance in order to maintain future household optimism and resilience.
Graph 7. Deposits Growth Based on Value
Graph 8. Portions of Use Revenue

M o n e t a r y P o l i c y R e p o r t | 40
The Monetary Policy Report is published on a quarterly basis after the Board of Governors’ (RDG) meetings held in February, May, August, and November. In addition to fulfilling the mandate of article 58 of Act Number 23 of 1999, concerning Bank Indonesia, amended by Act No. 3 of 2004 and Act. No. 6 of 2009, the report has two main purposes: (i) to function as a tangible product of a forward-looking working framework in which formulation of monetary policy is based on economic and inflation forecasts; and (ii) as a medium for the Board of Governors of Bank Indonesia to present to the public the various policy considerations underlying its monetary policy decisions.
For further information: Policy Regulation and Communication Division Monetary Policy Group Monetary and Economic Policy Department Telp: +62 21 2981 6836/5726 Fax: +62 21 345 2489 Email: [email protected] Website: http//www.bi.go.id
The Board of Governors:Agus D.W. Martowardojo – Governor Mirza Adityaswara – Senior Deputy Governor Ronald Waas – Deputy Governor Perry Warjiyo – Deputy Governor Hendar – Deputy Governor Erwin Rijanto – Deputy Governor