Monetary Policy February 2018 - t792ae.c2.acecdn.net · CONCLUSION ... The Bank’s plastic money...
56
JANUARY 2018 2018 MONETARY POLICY STATEMENT ENHANCING FINANCIAL STABILITY TO PROMOTE BUSINESS CONFIDENCE RESERVE BANK OF ZIMBABWE BY DR. J P. MANGUDYA GOVERNOR
Transcript of Monetary Policy February 2018 - t792ae.c2.acecdn.net · CONCLUSION ... The Bank’s plastic money...

JANUARY 2018
2018 MONETARY POLICY STATEMENT
ENHANCING FINANCIAL STABILITY TO PROMOTE
BUSINESS CONFIDENCE
RESERVE BANK OF ZIMBABWE
BY DR. J P. MANGUDYA
GOVERNOR

2
CONTENTS
SECTION 1 ............................................................................................................................. 4
INTRODUCTION AND EXECUTIVE SUMMARY .......................................................... 4
SECTION 2 .............................................................................................................................. 7
EVALUATION OF 2017 MONETARY POLICY INTEVENTIONS ............................... 7
SECTION 3 ........................................................................................................................... 20
GLOBAL AND REGIONAL ECONOMIC DEVELOPMENTS ..................................... 20
SECTION 4 ........................................................................................................................... 23
BALANCE OF PAYMENTS DEVELOPMENTS ............................................................ 23
SECTION 5 ........................................................................................................................... 28
MONETARY AND INFLATION DEVELOPMENTS .................................................... 28
SECTION 6 ............................................................................................................................ 35
FINANCIAL SECTOR DEVELOPMENTS ..................................................................... 35
SECTION 7 ............................................................................................................................ 45
POLICY MEASURES TO ENHANCE FINANCIAL STABILITY AND TO
PROMOTE BUSINESS CONFIDENCE IN THE ECONOMY ..................................... 45
SECTION 8 ............................................................................................................................ 55
CONCLUSION ..................................................................................................................... 55

3
LIST OF FIGURES
Figure 1: Distribution of Payments Systems Volumes 2017 .................................................. 11Figure 2: Payment Systems Values for 2017 ......................................................................... 11Figure 3: Total RTGS Transactional Activities from 2009 to 2017 ....................................... 12Figure 4: Total Electronic Transactional Payments from 2009 to 2017 ................................. 12Figure 5: SIRESS Transaction Values (ZAR billion) ............................................................. 14Figure 6: Cumulative Credit Redistry Inquiries as at 31 Dec 2017 ........................................ 18Figure 7: Commodity Price Indices (2010=100): 2012 to November 2017 ........................... 21Figure 8: Merchandise Exports and Imports (US$ m) ............................................................ 23Figure 9: Balance of Payments Developments: 2009-2017 .................................................... 24Figure 10: Monetary Developments ....................................................................................... 28Figure 11:Composition of Broad Money ................................................................................ 29Figure 12: Average Monthly RTGS Account Balances ......................................................... 30Figure 13: Annual Inflation Profile (%) ................................................................................. 31 Figure 14: Sectoral Distribution of Loans as at 31 December 2017…………..……………..36
Figure 15: Trend in Non-Performing Loans 2011 – December 2017 ..................................... 39Figure 16: Prudential Liquidity Ratio Trend (%) ................................................................... 40Figure 17: Growth of Active & Women Clients ..................................................................... 44
LIST OF TABLES
Table 1: Cumulative Export Incentives (5 May 2016 – 31 December 2017) ........................... 8Table 2: Payment System Transactional Activities for 2016 and 2017 .................................. 10Table 3: Payment Access Points and Devices for 2016 and 2017 .......................................... 13Table 4: Gold Deliveries to FPR from January to December 2017 ........................................ 15Table 5: Financial Inclusion Indicators Dec 2016-2017 ......................................................... 15Table 6: Global Economic Growth and Outlook (%) ............................................................. 20Table 7: Foreign Currency Receipts (2016-2017) .................................................................. 25Table 8: Foreign Payments 2016-2017 (US$ millions) .......................................................... 26Table 9: ZSE Indices as at 31 December 2017 ....................................................................... 30Table 10: Regional & International Annual Inflation Trends ................................................. 32Table 11: Architecture of the Banking Sector ........................................................................ 34Table 12: Other Operating Institutions ................................................................................... 34Table 13: Financial Soundness Indicators .............................................................................. 35Table 14: Banking Sector Capitalisation (US$ millions) ....................................................... 37Table 15: Projected Housing Development ............................................................................ 38 Table 16: Deposit insurance Payments as at 31 December 2017.............................................41 Table 17: Microfinance Performance Indicators, Sept 2016-Sept 2017…………………..…43

4
SECTION 1 INTRODUCTION AND EXECUTIVE SUMMARY This Monetary Policy Statement is issued in terms of Section 46 of the Reserve Bank of
Zimbabwe Act [Chapter 22:15] which requires the Bank to issue a statement containing a
description of the monetary policy to be followed by the Bank during the next succeeding six
months, and a statement of the reasons for those policies; a statement of the principles that
the Bank proposes to follow in the implementation of the monetary policy; and an evaluation
of the monetary policy and its implementation for the last preceding six months.
The Statement comes at a time when the economy is experiencing renewed hope and
confidence ushered in by the new economic dispensation, following the formation of a new
leaner cabinet by His Excellency, the President, in November 2017. This renewed hope and
confidence would need to be supported by going back to basics to restore business
confidence and to foster discipline within the national economy. Accordingly, this Monetary
Policy Statement seeks to buttress this confidence trajectory by putting in place measures that
gradually liberalise the foreign currency market in order to indicate that the country is ‘open
for business’.
The Bank has continued to make concerted efforts to address cash shortages, which are a
direct reflection of the tight foreign currency macro-economic environment that is
exacerbated by the transmission impact of the persistent fiscal deficit on the financial sector.
Addressing this current macro-economic imbalance requires a sharp rise in foreign exchange
reserves and an improvement in the fiscal balance. It is against this backdrop that the
interventions by the Bank in the foreign exchange market through nostro stabilisation
facilities have greatly assisted the economy to meet the ever growing demand for foreign
exchange and, in doing so, stabilising parallel market activities and sustaining the financing
of critical imports such as fuel, electricity, cash, medicines and essential consumer goods. In
addition, policy interventions to promote exports continue to bear fruit as evidenced by the
continued narrowing of the current account deficit. In this regard, Zimbabwe’s current
account balance is now within the international best practice range and also consistent with
macroeconomic convergence targets under the SADC and COMESA guidelines.

5
This, notwithstanding, the country’s high import dependency continues to exert pressure on
foreign exchange earnings, thus fueling parallel market activities for foreign exchange. This
economic situation is compounded by the growing fiscal deficit which remains the major
driver of increased deposits or money supply in the banking sector, creating foreign currency
liquidity shortages in the economy and causing inflationary pressures through domestic
monetary emission on the RTGS platform.
Opening up of the economy to business is therefore the most sustainable cure for the major
challenges the country is facing. Opening Zimbabwe for business means attracting
investment, foreign and domestic, that is required to increase production, jobs, fiscal space,
exports and eventually the happiness index for Zimbabweans. It moves the economy beyond
stabilisation. Opening up the economy also calls for local business to improve on their
efficiencies and competitiveness in order to brace for competition from foreign investors.
The Bank is convinced that by opening up the economy for business, the country has struck
the right chord for the sustainable transformation of the economy. It is in this optimistic
context that the Bank is coming up with measures to gradually open the foreign currency
market in order to restore investor confidence within the economy under the new narrative to
open Zimbabwe for business. Specifically the measures presented in this Statement are
meant to address the following:
i. Further promoting the use of mobile and electronic payment systems (plastic money);
ii. Enhancing the use of the local generated RTGS funds to generate exports;
iii. Improving the foreign currency market;
iv. Enhancing rewards to exporters and reducing cost of doing export business;
v. Providing generators of forex assurances of ease of access to foreign currency;
vi. Enhancing foreign currency retention threshold;
vii. Enhancing nostro stabilisation facilities to provide assurances to foreign exchange
earners of forex availability and to meet the import requirements of essential
commodities;
viii. Improving ease of access to productive facilities;
ix. Addressing the needs of the diasporans;
x. Reinforcing the arrears clearance and re-engagement programme;

6
xi. Providing guidance on the continuation of the multi-currency system;
xii. Providing guidance on the Presidential Amnesty on externalised assets and funds; and
xiii. Providing update on the acceptability of the 99-year land leases as collateral at banks.
The rest of this Monetary Policy Statement is organised as follows: Section 2 reviews the
previous monetary policy actions and policy interventions. Section 3 reviews the global and
regional economic developments. Section 4 looks at the balance of payments developments,
Section 5 discusses monetary and inflation developments. Section 6 gives developments in
the financial sector. Section 7 presents new measures to enhance financial stability and
confidence within the economy, while Section 8 is the conclusion of the Statement.

7
SECTION 2
EVALUATION OF 2017 MONETARY POLICY INTEVENTIONS
a) Nostro Stabilisation Facilities
The intervention by the Bank in the foreign exchange market through drawdowns from the
nostro stabilisation facilities amounting to US$1.1 billion during 2017 immensely assisted to
stabilise the forex market and to sustain financing of critical imports such as fuel, electricity,
medicines, fertilisers, agro-chemicals, soya crude oil for cooking oil, cash imports and raw
materials for industry. Drawdowns from these facilities together with the utilization of bond
notes in an amount of $290 million as at end December 2017 went a long way to stabilise
shortages of cash in the country. The worst could have happened especially in September
2017 had it not been for the positive impact of the nostro stabilisation facilities on the
economy.
A good number of firms in the manufacture of food products, packaging, fertilisers, agro-
chemicals and fuel distribution have greatly benefitted from the nostro stabilisation facilities
and the Statutory Instrument that was put in place by Government to support local
production.
b) Performance and Impact of the Export Incentive Scheme
In order to ensure that Zimbabwean exports are competitive under the auspices of a
dollarized economy, the Bank established the US$200 million and US$300 million export
incentive facilities which are monetised by bond notes. Since its inception in 2016, the export
incentive scheme has enhanced competitiveness of Zimbabwe’s exports and this has
significantly contributed to the growth of exports which grew by 36% from US$2.8 billion in
2016 to US$3.8 billion in 2017
Table 1 shows the cumulative export incentive and bond notes disbursed, and export receipts
generated since inception of the export incentive scheme in May 2016.

8
Table 1: Cumulative Export Receipts & Incentive Amounts (5 May 2016 – 31 Dec 2017)
Sector Export Receipts (USD)
Incentive Amounts
(USD)
Bond Notes issued to
Banks (USD)
Mining excluding Gold 2,645,809,356 58,268,089 56 000 000
Services 744,571,608 37,233,513 35 000 000
Agriculture excluding greenleaf Tobacco 426,171,579 21,308,579
20 000 000
Manufacturing 342,711,939 18,016,967 17 500 000
Other 37,152,463 1,857,624 1 800 000
Subtotal 4,196,416,945 136,684,772
130,300,000
Tobacco Growers 1,202,247,760 59,700,402 59 700 402
Gold - Producers 1,282,023,093 59,313,208
59 200 000
Diaspora Remittances 782,193,277 41,504,573
40 999 600
Grand Total 7,462,881,075 297,202,955
290,200,000
Source: RBZ
c) Afreximbank Backed Interbank Market Facility (AFTRADES)
The Bank has continued to use Aftrades as its Lender of Last Resort window and for
promoting interbank finance facility. The Aftrades facility, which was established in 2015 at
a limit of US$200 million went a long way in alleviating liquidity shortages during 2017. The
facility will run for another two years until February 2019. Total trades amounted to
US$399.5 million in 2017.
d) Savings Bonds
The Bank introduced 7% tax-free Savings Bonds in September 2017 to mop up excess
liquidity within the market and, in so doing, providing investors with a platform for
increasing savings within the country.

9
As at the end of 2017, a total of US$165 million had been raised through Savings Bonds. The
Bank enhanced the features of the Savings Bonds in December 2017 to include Prescribed
Asset Status it order to enhance its marketability.
e) Usage of Electronic and Mobile Banking Systems (Plastic Money)
The Bank is encouraged by the quantum leap in the usage of electronic and mobile banking
systems (plastic money) by the Zimbabwean banking public.
The Bank’s plastic money policy thrust has been a resounding success in the economy as
exhibited by the unprecedented increases in values, volumes, devices and access points. This
is largely attributable to collaborative efforts, commitment, action and market innovation
which have continued to drive the plastic money revolution.
The growth in the use of plastic money, away from cash transactions, was phenomenal in
2017 to the extent that more than 96% of the $97.5 billion - from the 1 billion transactions -
processed in the entire country in 2017 were through electronic and mobile banking systems
as shown in Table 2 below. Figures 1 and 2 show the distribution of payment systems by
value and volume, respectively.
Mobile payments constituted the bulk of payment streams in volume terms in 2017. In value
terms, the RTGS constituted the largest contribution at more than 63% as shown in Table 2.
On a comparison basis aggregate electronic means of payments in terms of values and
volumes grew significantly by 41% and 164%, respectively, in 2017. This growth can be
attributed to the high usage, increased infrastructure and diversity of innovative payment
systems products or services approved during the period under review.

10
Table 2: Payment System Transactional Activities for 2016 and 2017
PAYMENT STREAMS 2016
%age 2017 Proportion of Total 2017
Values
RTGS 48,109,325,214.79
69.51%
61,719,667,657.05 63.28%
CHEQUE 113,083,273.59
0.16%
69,437,643.79 0.07%
POS 2,898,437,870.85
4.20%
6,635,840,710.92 6.77%
ATMS 2,283,533,146.98
3.32%
427,973,605.99 0.44%
CASH WITHDRAWALS 74,83687,051
10.84% 3647133052 3.69%
MOBILE 5,815,862,225.76
8.38%
18,020,733,457.33 18.46%
INTERNET 2,503,914,145.97
3.61%
7,021,588,382.39 7.29%
TOTAL VALUE
69,207,842,928.94
100%
97,542,374,509.48 100.00%
Volumes
RTGS 2,901,664
0.76%
5,903,136 0.58%
CHEQUE 347,735
0.09%
320,341 0.03%
POS 52,407,464
13.65%
214,857,784 21.22%
CASH 16,252,259
4.25% 24,675,581 2.43%
ATMs
12,332,547
3.20%
8,098,497 0.79%
MOBILE
298,586,190
77.78%
754,742,123 74.52%
INTERNET
1,110,366
0.27%
4,248,650 0.43%
TOTAL
383,938,226
100%
1,012,846,112
100%

11
Real Time Gross Settlement (RTGS) System
A total of 5.9 million transactions valued at US$61.7 billion were processed through the
RTGS system during the year 2017. The RTGS volumes and values increased by 103% and
28%, respectively, compared to the same period in 2016. Figure 3 illustrates the RTGS
activities over the past nine years.
Figure 1: Distribution of Payment Systems Volumes 2017
Source: RBZ
Figure 2: Payment Systems Values for 2017
Source: RBZ
RTGS, 0.60% CHEQUE, 0.03%
POS, 21.74%
ATMs, 0.82%
MOBILE , 76.38%
INTERNET , 0.43%
VOLUMES 2017
RTGS CHEQUE POS ATMs MOBILE INTERNET
RTGS 65.73%
CHEQUE 0.07%
POS 7.07%
ATMS 0.46% MOBILE
19.19%
INTERNET 7.48%
RTGS CHEQUE POS ATMS MOBILE INTERNET

12
Figure 3: Total RTGS Transactional Activities from 2009 to 2017
Figure 4: Total Electronic Transactional Payments from 2009 to 2017
The number of point of sale (POS) deployed increased significantly by 84% to 59,939 in
2017. All access points recorded a positive growth during the year under review except
ATMs as shown in Table 3.
0.0
1.5
3.0
4.5
6.0
'-
17,500,000,000
35,000,000,000
52,500,000,000
70,000,000,000
2009 2010 2011 2012 2013 2014 2015 2016 2017
VolumesinM
illions
Billion
s
ANNUAL RTGS VALUES
'-
250,000,000
500,000,000
750,000,000
1,000,000,000
0
25
50
75
100
2009 2010 2011 2012 2013 2014 2015 2016 2017
Millions
Billion
s
Values Volumes

13
Table 3: Payment Access Points and Devices for 2016 and 2017
Payment Systems Access Points % Change for
2016/17 2016 2017
Difference
Mobile Money Agents 40,590 44,793 4,203 10%
ATMs 569 563 -6 -1%
POS 32,629 59,939 27,310 84%
NFC - 6,063 5,902
QR Code 1065 7,075 6,010 564%
Payment Systems Access Devices
Debit Cards 3,127,153 4,281,683 1,154,530 37%
Credit Cards 16,030 17,411 1,381 9%
Prepaid Cards 43,288 63,987 20,699 48%
Mobile Payment Subscribers 3,279,049 4,611,608 1,332,559 41%
Internet Banking Subscribers 168,339 277,674 109,335 65%
The value of Mobile Financial Services (MFS) transactions for the year stood at US$18
billion, an increase of 210% from the US$5.8 billion recorded in 2016. The volume of MFS
transactions also increased by 153% to 754.7 million in 2017 from the 298.6 million recorded
in 2016.
Regional Payments Developments
The Central Bank is committed to regional payment system initiatives and has encouraged
banks and other payment service providers to utilise the SADC Integrated Regional
Electronic Settlement System (SIRESS) platform to settle regional cross-border transactions.

14
Since the implementation of SIRESS in July 2013, the number of local banks participating on
SIRESS has risen to 15 whilst transactional values have also increased as shown in Figure 5.
Figure 5: SIRESS Transaction Values (ZAR billion)
Notwithstanding, the positive developments in the transactional activities on SIRESS, more
still needs to be done to increase customer awareness and understanding of the payment
platform’s benefits. Accordingly, financial institutions are urged to implement the
appropriate education and awareness programs to bolster the use of the SIRESS platform.
f) Financial Inclusion & Sustainable Economic Development Facilities
In the 2017 Mid-term Monetary Policy, the Bank introduced nine (9) productive finance
facilities earmarked for promoting production (exports, gold, tourism, horticulture) business
linkages and empowerment facilities (youth, women, people with disabilities, tertiary
students). These financial inclusion and empowerment facilities targeting groups such as
women, SMEs and youth have played a significant role in ensuring access to formal financial
services by these marginalised groups in support of the National Financial Inclusion Strategy.
2.30
8.92
11.88
11.56
- 5.00 10.00 15.00
2014 2015
2016 2017
Billions

15
As at the end of 2017, total disbursements under all the facilities amounted to US$122
million, with over 50% being for capital expenditure. Disbursement under the gold support
facility amounted to US$74 million. This facility together with the periodic onsite
monitoring by the Gold Mobilisation Technical Committee greatly contributed to the increase
in gold deliveries to Fidelity Printers and Refiners (FPR) from 21.439 tonnes in 2016 to
24.843 tonnes in 2017, with small scale gold producers accounting for 53% of total gold
output as shown in Table 4.
Table 4: Gold Deliveries (Kgs) to FPR from January to December 2017
2017
Primary Small Scale Total
Jan 923.00 713.51 1,636.51
Feb 768.38 686.61 1,454.99
March 862.54 682.83 1,545.36
April 866.95 622.39 1,489.34
May 1,045.33 874.99 1,920.32
June 908.11 1,045.97 1,954.08
July 963.62 1,127.73 2,091.15
August 1,109.91 1,466.39 2,576.30
September 1,045.97 1,448.98 2,494.95
October 1,098.51 1,672.11 2,770.62
November 1,021.78 1,288.92 2,310.70
December 1,053.40 1,546.16 2,599.56
TOTAL 11,667.50 13,176.37 24,843.87
Source: Fidelity Printers and Refiners
The support for tobacco through the Tobacco Industry and Marketing Board (TIMB)
amounted to $28 million. This support is expected to produce 44 million kilograms of
tobacco.

16
These facilities which are priced at all-in interest rates ranging between 7.5% for exporters
and 10% for non-exporting activities have had significant impact in supporting production for
both local consumption (import substitution) and export generation. The funded activities
have been instrumental in developing various value chains particularly in agriculture
including horticulture, mining, manufacturing and tourism. Encouragingly the facilities have
resulted in improvement in financial inclusion indicators as shown in Table 5.
Table 5: Financial Inclusion Indicators - Dec 2016-17
Indicator Dec 2016 Dec 2017 Change %
Value of loans to SMEs ($ m) 131.69 146.22 11.03%
Percentage of loans to SMEs over total loans
3.57% 3.75% 0.18%
Number of SMEs with bank accounts 71,730 76,524 6.68%
Number of Women with Bank Accounts 769,883 935,994 21.58%
Value of Loans to Women ($ m) 277.30 310.78 12.07%
Number of Loans to Youth 38,400 61,529 60.23%
Value of Loans to Youth ($ m) 58.41 138.93 137.85%
Total number of Bank Accounts 1.49 m 3.07 m 106.04%
Number of Low Cost Accounts 1.20 m 3.02 m 151.67%
Further, in line with the financial inclusion thrust, a number of banking and microfinance
institutions have up-scaled their financial support to some irrigation schemes which were
rehabilitated by Government. Notable impact has been recorded in Manicaland,
Matabeleland, Midlands and Mashonaland provinces in respect of banana production,
livestock production, mining and horticulture, respectively.
The Credit Guarantee Scheme, which is managed under the Export Credit Guarantee
Company, is now fully operational. As part of efforts to strengthen the role of microfinance
in the economy and up-scale the capacity of the sector to manage the empowerment facilities,

17
the Bank embarked on capacity building of microfinance institutions on risk management,
corporate governance and compliance, among others.
Most banking institutions have embraced the low cost accounts model. The number of ‘no
frills’ accounts with minimum affordable requirements in the banking sector recorded a
151.67% increase from 1.20 million as at 31 December 2016 to 3.02 million as at 31
December 2017.
g) Financial Literacy
Financial literacy is key in raising awareness of financial services among economic agents
particularly the marginalised groups; ensuring responsible access to and usage of financial
services; and in promoting adequate protection of consumers of financial services. As part of
increasing awareness of the integrated approach to financial education and financial
inclusion, the Bank in collaboration with development partners, conducted a number of
financial literacy stakeholders workshops during 2017. As at end December 2017, around
75% of the population was financially literate
Financial literacy capacity building programs will continue during 2018, with the assistance
of development partners, including the World Bank and the International Labour
Organisation. In view of the low levels of financial literacy across the population, the Bank
will roll-out targeted financial education programs, which will be implemented through
various delivery channels such as print and electronic media. Further, cognisant of the
critical need to embed financial literacy from early childhood development in building a
financially literate nation, the Bank has initiated engagement processes with stakeholders to
promote appropriate financial literacy content in the education curricula.
h) Credit Infrastructure
The Bank has made significant progress in enhancing the credit infrastructure through the
establishment of a Credit Registry and operationalising the Collateral Registry. The
improvement in the credit reporting environment is expected to improve the general credit
culture across economic sectors.
18
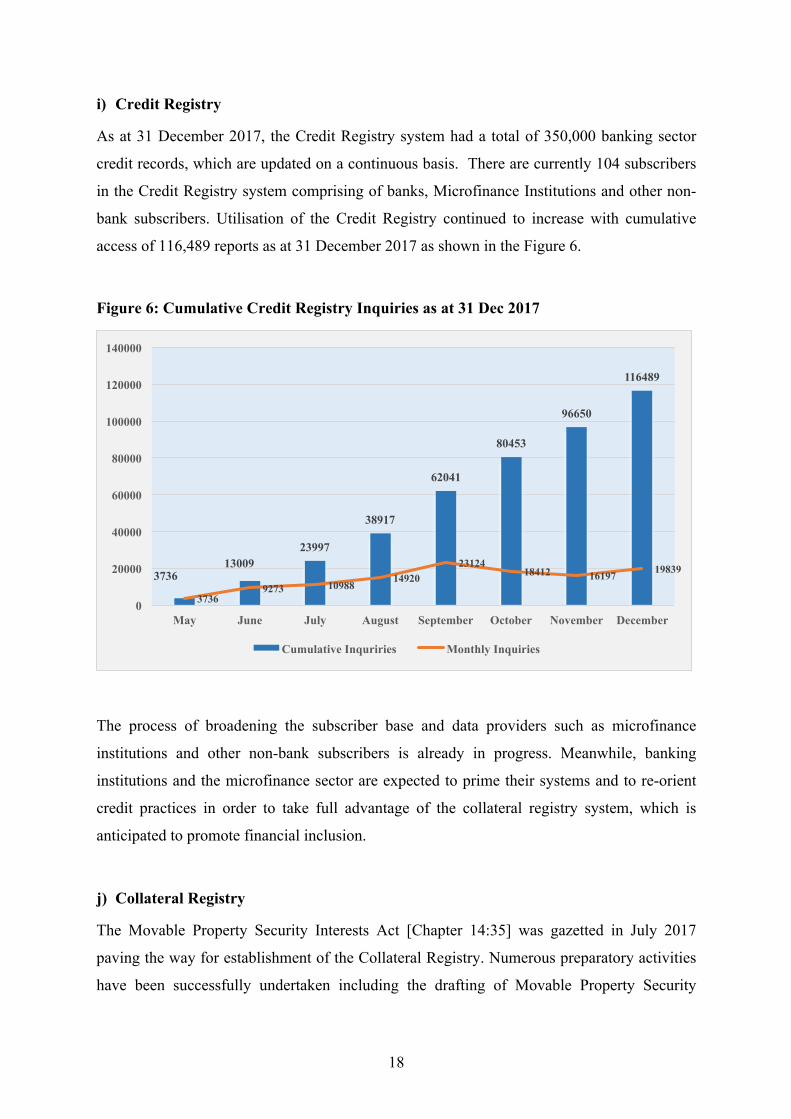
i) Credit Registry
As at 31 December 2017, the Credit Registry system had a total of 350,000 banking sector
credit records, which are updated on a continuous basis. There are currently 104 subscribers
in the Credit Registry system comprising of banks, Microfinance Institutions and other non-
bank subscribers. Utilisation of the Credit Registry continued to increase with cumulative
access of 116,489 reports as at 31 December 2017 as shown in the Figure 6.
Figure 6: Cumulative Credit Registry Inquiries as at 31 Dec 2017
The process of broadening the subscriber base and data providers such as microfinance
institutions and other non-bank subscribers is already in progress. Meanwhile, banking
institutions and the microfinance sector are expected to prime their systems and to re-orient
credit practices in order to take full advantage of the collateral registry system, which is
anticipated to promote financial inclusion.
j) Collateral Registry
The Movable Property Security Interests Act [Chapter 14:35] was gazetted in July 2017
paving the way for establishment of the Collateral Registry. Numerous preparatory activities
have been successfully undertaken including the drafting of Movable Property Security
3736 13009
23997
38917
62041
80453
96650
116489
3736 9273 10988
14920 23124
18412 16197 19839
0
20000
40000
60000
80000
100000
120000
140000
May June July August September October November December
Cumulative Inquriries Monthly Inquiries

19
Interests Regulations. It is anticipated that the Regulations shall be gazetted during the first
quarter of 2018 and the Collateral Registry will be operational by 30 June 2018.
k) Developmental Financial Institutions (DFIs)
Developmental financial institutions play a critical role in the provision of long-term
financing for the reconstruction and expansion of the physical and social infrastructure.
Against this background, the Bank is pleased to note the significant progress in the
transformation of Industrial Development Corporation of Zimbabwe (IDCZ) into a
development financial institution as a critical factor in the re-industrialisation agenda through
provision of industrial financing and enterprise development for small, medium and large
enterprises.
The transformation of IDCZ is expected to complement initiatives by commercial banks,
which are also expected to re-orient their lending in line with the developmental thrust
enunciated in the National Budget Statement for 2018.
l) Basel II/III Implementation
The Bank continued to provide tailored technical assistance to banking institutions to
capacitate the sector in the implementation of Basel II. Meanwhile, the Basel Committee on
Bank Supervision concluded the outstanding components of the Basel III framework in
December 2017. In this regard, the Reserve Bank is in the process of developing the Basel
III capital and liquidity frameworks to improve the quality, consistency and transparency of
capital and reduce pro-cyclicality, as well as, enhance liquidity management.
m) International Financial Reporting Standard (IFRS) 9
The Bank made significant progress in the adoption and implementation of IFRS9. A
quantitative impact assessment conducted during the course of 2017 on the impact on capital
levels, showed that all banking institutions remain adequately capitalized. As part of the final
phase of IFRS 9 implementation, banking institutions are required to submit IFRS 9
compliant financial statements as at 31 December 2017 to the Bank by 31 March 2018.

20
SECTION 3 GLOBAL AND REGIONAL ECONOMIC DEVELOPMENTS The global upswing in economic activity, which started in the second half of 2016 is
strengthening, supported by robust growth in emerging economies. As a result, global
economic activity is projected to improve from a growth of 3.2% registered in 2016 to 3.7%
in 2017 and 3.9% in 2018. Table 6 shows global economic growth developments for selected
regions and countries.
Table 6: Global Economic Growth & Outlook (%)
2014 2015 2016 Est.
2017 Proj.
2018 Proj.
World Output 3.4 3.2 3.2 3.7 3.9
Advanced Economies 1.9 2.1 1.7 2.3 2.3
US 2.4 2.6 1.5 2.3 2.7
Euro Area 0.9 2.0 1.8 2.4 2.2
Japan 0.0 1.2 0.9 1.8 1.2
Emerging & Developing Economies
4.6 4.1 4.4 4.7 4.9
China 7.3 6.9 6.7 6.8 6.6
India 7.2 7.6 7.1 6.7 7.4
Sub-Saharan Africa 5.1 3.4 1.4 2.7 3.3
Zimbabwe* 3.8 1.1 0.7 3.7 4.5
Latin America Caribbean
1.3 0.1 -0.7 1.3 1.9
Source: IMF World Economic Outlook Update (January2018), *Ministry of Finance and Economic Development and RBZ projections

21
Despite this development, growth remains weak in some countries, with inflation below
target in most advanced economies. Growth in China, India and other parts of emerging Asia
remains strong, while several commodity dependent economies in Latin America and sub-
Saharan Africa show some signs of improvement.
In sub-Saharan Africa, growth is estimated at an average of 2.7 percent in 2017, up from 1.4
percent recorded in 2016. Growth is expected to further increase to 3.3 percent in 2018, with
sizable differences across countries. This growth remains below the previous growth rates of
above 5% recorded in 2014. There are, however, mounting vulnerabilities in the region,
notably, rising public debt, financial sector strains and low external buffers. Public debt is
high not only in oil exporting countries but in many fast-growing economies as well.
The improved global economic performance in 2018 has spill over effects on demand for
Zimbabwean commodities and hence increased economic activity in the domestic economy.
Commodity Price Developments
International commodity prices continued their recovery from the rock-bottom levels
registered at the beginning of 2016, although they remained depressed compared to the levels
that were attained in 2012. More specifically, energy, base metals, precious metals and
agricultural commodity prices showed some resilience in 2017 due to strong demand,
particularly from China’s property, infrastructure, and manufacturing sectors and amid
various supply bottlenecks globally. Figure 7 shows trends in commodity price indices.
Figure 7: Commodity Price Indices (2010 = 100): 2012 to November 2017

22
Source: World Bank
Precious Metal Prices
Gold prices rallied in 2017, mainly on account of their safe haven status amid geopolitical
tensions and the weakening of the U.S. dollar. On the other hand, platinum prices largely
traded unchanged in 2017, on the back of weak investment demand.
Base Metal and Crude Oil Prices
Base metal prices firmed in 2017, underpinned by strong demand from China, on account of
positive economic growth outlook for the Asian’s giant economy, the world’s largest
consumer of base metals. Furthermore, supply concerns in some of the world’s base metal
producers supported international prices for base metals.
Crude oil prices also firmed, buoyed by declining global inventories as a result of efforts by
OPEC to curb production. In addition, supply concerns in the Middle East that emanated
from geopolitical tensions between oil rich countries and strong global demand, supported oil
prices.
30.
62.5
95.
127.5
160.
2012
M02
2012
M05
2012
M08
2012
M11
2013
M02
2013
M05
2013
M08
2013
M11
2014
M02
2014
M05
2014
M08
2014
M11
2015
M02
2015
M05
2015
M08
2015
M11
2016
M02
2016
M05
2016
M08
2016
M11
2017
M02
2017
M05
2017
M08
2017
M11
Energy Agriculture Base Metals Precious Metals

23
SECTION 4 BALANCE OF PAYMENTS DEVELOPMENTS Consistent with developments in the sub-Saharan African economies, the country’s external
sector position is showing signs of improvement, on account of policy measures being taken
by Government and the Reserve Bank to boost exports and contain the import demand.
Merchandise Trade Developments
Over the period January to November 2017, total merchandise trade (exports and imports)
stood at US$8,408.5 million, representing a 15.8% increase from US$7,262.5 million
recorded over the corresponding period in 2016. The increase was on account of increases in
merchandise exports and imports of 36.8% and 4.5%, respectively. Consequently, for the
period under review, the country’s trade deficit narrowed from US$2,181.6 million in 2016 to
US$1,456.7 million in 2017. A narrowed trade deficit reduces pressure on foreign exchange
reserves.
Merchandise exports for the period January to November 2017 increased by 36.8%, from
US$2,540.4 million realized in 2016 to US$3,475.9 million in 2017, as illustrated in Figure 8.

24
The increase in the year on year merchandise exports was mainly on account of increases in
exports of nickel (mattes, ores & concentrates), gold, ferrochrome and black tea. Exports
composition remained unchanged showing Zimbabwe’s dependence on the export of
commodities.
Figure 8: Merchandise Exports and Imports (US$ m)
Source: ZIMSTAT
Gold, flue-cured tobacco, nickel (mattes, ores & concentrates) ferrochrome and diamonds
dominated the country’s exports, contributing about 80% of total export earnings. The
country’s exports were mainly destined for the SADC region with South Africa and
Mozambique absorbing 62.8% and 10.5%, respectively. The country’s major exports to
South Africa include platinum group of metals (PGMs), gold and nickel. These commodities
are further exported to their final destination by South Africa.
Total merchandise imports for the period January to November 2017 amounted to
US$4,932.6 million, a 4.5% increase from US$4,722.0 million realized over the
corresponding period in 2016. The increase in merchandise imports was mainly attributable
to increases in importation of energy (fuel and electricity), maize seed, machinery, fertilizers
and medicines. The country sourced its imports mainly from South Africa (40.5%),
Singapore (22.4%), China (8.8%), Zambia (2.5%) and Japan (2.5%).
Reflecting the combined effects of positive developments on merchandise trade in 2017 and
the need to boost domestic production for both export and local consumption through
0
150
300
450
600
Jan FebMarAprMay Jun Jul Aug Sep Oct Nov
MonthlyMERCHANDISEExports:2017
0
125
250
375
500
Jan FebMarAprMayJun Jul AugSep OctNov
2017MonthlyMerchandiseImports

25
importation of raw materials and intermediate goods, the current account deficit is estimated
to have slightly increased from US$591.3 million in 2016 to US$618.1 million in 2017.
Figure 9: Balance of Payments Developments: 2009- 2017
Source: RBZ
International Money Transfers
For the year 2017, inward international remittances amounted to US$1.4 billion compared to
US$1.6 billion received in 2016 representing an 11% decrease. Of the US$1.4 billion,
Diaspora remittances amounted to US$698.9 million. The Bank is encouraged by the trend
where Authorised Dealers are investing in enabling technologies that broaden financial
inclusion, reduce remittances cost and increase remittance access points for the convenience
of senders and recipients. These efforts towards formalization of remittances is key in
building sufficient capacity for leveraging on the developmental impact of remittances.
Foreign Currency Receipts on a Cash Basis
Consistent with improvement in export generation, global foreign currency receipts, on a
cash basis, for the year 2017 amounted to US$5.6 billion, compared to US$5.5 billion
received during the same period in 2016, representing a 1.4% increase in foreign currency
receipts into the economy. Table 7 shows the breakdown of foreign currency receipts by
source.
-3938
-2625
-1313
0
1313
2625
2009 2010 2011 2012 2013 2014 2015 2016 2017 CurrentAccount CapitalAccount FinancialAccount OverallBalance

26
Table 7: Foreign Currency Receipts (2016 and 2017)
Type of Receipt 2017 US$ millions
2016 US$ millions
% Change
Export Proceeds 3,519.70 2,994.00 17.6%
International Remittances 1,412.01 1,589.96 -11.2%
Loan Proceeds 545.49 519.49 5.0%
Income receipts 58.87 332.70 -82.3%
Foreign Investment 26.98 48.97 -44.9%
TOTAL 5,563.05 5,485.12 1.4%
Source: RBZ
Foreign Currency Utilisation on a Cash Basis
While total foreign currency receipts increased and remain comparable relative to receipts in
other countries in the region, the benefits of such receipts continue to be outweighed by the
country’s huge import bill. In 2017, global foreign payments amounted to US$4.81 billion,
representing a 6% decline from US$5.14 billion recorded in 2016. Table 8 shows foreign
payments for 2016 and 2017.
Table 8: Foreign Payments 2016 and 2017(US$ Millions)
Category 2017 2016 Change % Contribution 2017
Merchandise Imports (excl. energy) 2,641.9 2,587.3 2% 55%
- Consumption Goods 1,055.9 1,310.1 -19% 22%
- Capital Goods 802.6 664.6 21% 17%
- Intermediate Goods 783.3 612.7 28% 16%
Energy (Fuel & Electricity) 735.9 757.0 -3% 15%
Service Payments 782.1 1,091.9 -28% 16%
- Technical, Professional & 286.4 527.7 -46% 6%

27
Category 2017 2016 Change % Contribution 2017
consult
- Software 44.9 73.2 -39% 1%
- Other (tourism, education, freight etc) 450.8 490.9 -8% 9%
Income Payments (Profits, Dividends) 155.7 147.5 6% 3%
Capital Remittances (outward) 489.1 546.0 -10% 10%
- External Loan Repayments 418.7 423.2 -1% 9%
- Disinvestments 53.3 117.7 -55% 1%
- Cross Border Investment 17.1 5.1 236% 0%
Other Payments 4.2 7.8 -47% 0.1%
Total 4,808.8 5,137.5 -6% 100%
Source: RBZ
Although there was a decline in foreign payments in 2017 relative to 2016, payments for
capital and intermediate goods increased, against a notable decline in payments for
consumption/manufactured goods. This development points to efficient utilisation of foreign
currency towards the productive sectors of the economy, in line with various Government
strategies anchored on promoting domestic production. The Bank shall, therefore, continue to
enhance the current compliance-monitoring framework to ensure continued allocation of
foreign exchange in terms of the Foreign Exchange Priority List Guideline towards the
productive sectors in order to increase exports whilst at the same time providing assurances
to the earners of foreign exchange of the availability of their funds on demand.
Financial Account Developments
The financial account balance continued to narrow down in 2017, on account of declining
inflows of short and long term debt, subdued foreign direct and portfolio investment inflows.
Net debt creating inflows declined from US$1,014.1 million in 2015 to US$544.7 million in
2016 and US$315.6 million in 2017. Similarly, net foreign direct investment into the country

28
is estimated to have declined from US$343 million in 2016 to US$235.4 million in 2017,
while net portfolio investment inflows declined from - US$80 million to - US$41 million.
Government is putting in place measures to promote both foreign direct investment and
portfolio investment.
SECTION 5 MONETARY AND INFLATION DEVELOPMENTS Monetary conditions have generally remained accommodative and supportive of real
economic activity. Broad money1 recorded an annual growth of 47.97%, from $5 420.01
million in November 2016 to $8 020.03 million in November 2017. The growth was reflected
in increases in transferable (demand) deposits, 58.99%; and negotiable certificates of deposits
(NCDs)2, 51.57%. Time deposits, however, declined by 1.18%.
1 Beginning January 2017, broad money is redefined using IMF’s Monetary and Financial Statistics Manual of 2000. The major change is the exclusion of Government deposits held by banks from broad money. 2 NCDs are also referred to as securities included in broad money

29
Figure 10: Monetary Developments
Source: Reserve Bank of Zimbabwe, 2017 Transferable or transitory deposits, at 77.11% of total deposits, continued to dominate money
supply. These are made up of demand and savings deposits. During the period under review,
broad money was made up of transferable or transitory deposits, 77.11%; time deposits,
18.08%; currency in circulation, 3.98% (bond notes and coins); and negotiable certificates of
deposits, 0.83%.
Figure 11: Composition of Broad Money
-16
0
16
31
47
63
'-
2.3
4.5
6.8
9.0
41365 Oct-13 Apr-14 Oct-14 Apr-15 Oct-15 Apr-16 Oct-16 Apr-17 Oct-17
%
US$
BIL
LIO
NS
M3 M3 Annual Growth rate

30
Source: Reserve Bank of Zimbabwe, 2017
Domestic Credit
Bank lending to local economic agents grew by 44.31%, from $7 554.07 million in
November 2016 to $10 637.23 million in November 2017. Of this growth, net credit to
Government rose by 70.45% to $6 271.02 million, while credit to the private sector rose by
6.97% to $3 705.5 million. The increase in credit to Government continues to reflect
increased reliance by Government on the banking sector to finance its budget deficit.
The substantial increase in money supply is therefore a reflection of the expansionary fiscal
stance which has continued to increase RTGS money from $954 in 2016 to US$1,732 million
in 2017 as shown in Figure 12.
The increase in the RTGS position was largely driven by increased Government financing
through the overdraft at the central bank and the issuance of Treasury Bills and Bonds, which
increased from $3.2 billion in 2016 to $5.2 billion at the end of 2017. The increase of around
$2 billion largely arose from securities issued for Government projects which include the
financing of grain producers as well as for financing agriculture.
Figure 12: Average Monthly RTGS Account Balances
TransferableDeposits77.11%
OtherDeposits(Time)18.08%
NCDs0.83%
BondNotesandCoins3.98%

31
Under dollarization financing of the deficit should ideally be from foreign sources in order to
mitigate the domestic creation of money which is not matched by foreign exchange. It is in
this context that the Bank will continue to ensure that the level of money supply is supportive
of the desired inflation target of between 3-7%, consistent with the SADC macroeconomic
convergence target for inflation.
Developments on Zimbabwe Stock Exchange (ZSE)
Bullish trends were experienced on the local bourse during 2017 as the mainstream industrial
index gained by 130.4% to 333.02 points whilst the resources index put on 143.42% to 142.4
points. Speculative tendencies largely drove the resurgence of the stock market in 2017.
Reflecting this, the total market capitalization rose to well over US$15.2 billion in November
2017, before retreating to US$9.6 billion by year end. The stock market, however,
experienced net capital outflow of US$101 million from foreigners.
Table 9: ZSE Indices as at 31 December 2017
31-Dec-16 31-Dec-17 CHANGE (%)
Industrial Index 144.53 333.02 130.42
Mining Index 58.50 142.40 143.42
Market Capitalisation (US$m) 4,007.96 9,580.57 139.04
Inflation Developments
'-
600,000,000.00
1,200,000,000.00
1,800,000,000.00
2,400,000,000.00
January March May July September November
Billion
s
2016 2017

32
Since climbing out of deflation in February 2017, annual headline inflation has remained in
the acceptable range to close the year at 3.46%. The average inflation for 2017 was 1%.
Figure 13: Annual Inflation Profile (%)
Source: Zimstat, 2018 The positive rate of inflation, as reflected in increases in prices of most commodities, was on
the back of speculative and profiteering tendencies; pass-through effects of parallel market
premiums on foreign exchange; shortages of some imported basic commodities; as well as
some external factors such as firming South African rand and strengthening oil prices.
Food Inflation
Food inflation surged from -0.30% in January 2017 to 5.65% in November 2017, before
accelerating further to 6.60% in December 2017. The increase in food inflation was largely
driven by prices of meat; vegetables; and fish. Decline in the prices of bread and cereals,
responding to the 2016/17 bumper harvest, however, partially offset the price increases in
other categories.
The increase in food inflation was partly due to supply factors, particularly in relation to
meat, poultry and fish, while the sourcing of foreign exchange on alternative markets
escalated the production costs. Reduced livestock slaughters due to improved pastures and
the impact of the avian flu on poultry production, negatively affected the supply of beef, pork
and chicken.
-5.
-2.25
0.5
3.25
6.
1/1/
14
3/1/
14
5/1/
14
7/1/
14
9/1/
14
11/1
/14
1/1/
15
3/1/
15
5/1/
15
7/1/
15
9/1/
15
11/1
/15
1/1/
16
3/1/
16
5/1/
16
7/1/
16
9/1/
16
11/1
/16
1/1/
17
3/1/
17
5/1/
17
7/1/
17
9/1/
17
11/1
/17
Food Inflation Non-Food Inflation All Items

33
Non-Food Inflation
Annual non-food inflation also accelerated from -0.82% in January 2017 to close the year at
2.0%, largely driven by increases in the furniture and household equipment; recreation and
culture; and clothing and footwear subcategories. Increases in non-food prices were largely
induced by the parallel market premiums on foreign exchange.
Regional Inflation Developments
Zimbabwe’s inflation rate, hitherto the lowest in SADC, is now comparable with low
inflation countries such as Botswana and Tanzania, as shown in Table 10.
Table 10: Regional and International Annual Inflation Trends
Zim SA Bots Moz Tanz Zamb Mal USA
Jan -0.1 6.6 3.1 20.6 5.2 7.0 18.2 2.5
Feb 0.1 6.3 3.4 20.9 5.5 6.8 16.1 2.7
Mar 0.2 6.1 3.5 21.6 6.4 6.7 15.8 2.4
Apr 0.5 5.3 3.4 21.3 6.4 6.7 14.6 2.2
May 0.7 5.4 3.5 20.5 6.1 6.5 12.3 1.9
Jun 0.3 5.1 3.5 18.1 5.4 6.8 11.3 1.6
Jul 0.14 4.6 3.4 16.17 5.2 6.6 10.2 1.7
Aug 0.14 4.8 3.4 14.35 5.0 6.3 9.3 1.9
Sep 0.78 5.1 3.2 10.76 5.3 6.6 8.4 2.2
Oct 2.2 4.8 3.0 10.7 5.1 6.4 8.3 2.0
Nov 3.0 4.6 2.9 7.2 4.4 6.3 7.7 2.2
Dec 3.5 n/a 3.2 5.7 4.0 6.1 n/a 2.1
Source: ZIMSTAT, Country’s Central Banks, 2017
The annual inflation of 3.5% for December 2017 is within the SADC convergence
benchmark of between 3 to 7 %.

34
Inflation Outlook
In the outlook period, the risk of inflation would be mitigated by the positive domestic and
international goodwill, following the new economic and political dispensation in the country,
which is already having some dampening effects on speculative tendencies, as well as on
adverse inflationary expectations. On the other hand, external factors such as further
strengthening of the South African rand; the US dollar; high demand for imported goods and
services; and surge in oil prices, may continue to put pressure on domestic prices.
The Bank will, therefore continue to closely monitor price movements, and take pre-emptive
and corrective measures to contain inflation to the SADC target of between 3.7% by year-
end. Anticipated reduction in food imports and food prices, following the bumper harvest in
the 2016/17 agricultural season, and the average 2017/18 cropping season, will dampen
prices and moderate inflation during year.

35
SECTION 6 FINANCIAL SECTOR DEVELOPMENTS Nineteen banking institutions were operating as at 31 December 2017, as shown in Table 11.
Table 11: Architecture of the Banking Sector
Type of Institution Number
Commercial Banks 13
Building Societies 5
Savings Bank 1
Total Banking Institutions 19
In addition, the institutions indicated in Table 12 are also under the purview of the Reserve
Bank.
Table 12: Other Operating Institutions
Credit-only-MFIs 178
Deposit-taking MFIs 4
Development Financial Institutions (SMEDCO and IDBZ)
2
Performance of the Banking Sector
The performance of the banking sector was satisfactory over the year to 31 December 2017,
as reflected by the improvement in the key risk and performance indicators. Total assets
increased to $11.25 billion while capitalisation and profitability indicators also reflect
improved performance. The financial soundness indicators for the review period are
provided in Table 13.

36
Table 13: Financial Soundness Indicators
Key Indicators Benchm
ark Dec-16 Jun-17 Sep-17
Dec-17
Total Assets - $8.73bn $9.65bn $10.26bn $11.25bn
Total Loans - $3.69bn $3.64bn $3.73bn $3.80bn
Net Capital Base - $1.34bn $1.38bn $1.43bn $1.58bn
Total Deposits - $6.51bn $6.99bn $7.62bn $8.48bn
Net Profit - $181.06m $100.59m $160.73m $241.94m
Return on Assets - 2.26% 1.26% 1.89% 2.61%
Return on Equity - 12.64% 6.80% 11.15% 15.48%
Capital Adequacy
Ratio 12% 23.70% 26.89% 26.98% 27.63%
Loans to Deposits 70% 56.64% 52.11% 49.01% 44.81%
Non-Performing
Loans Ratio 5% 7.87% 7.95% 8.63% 7.08%
Provisions to
Adversely
Classified Loans - 68.51% 126.29% 83.37% 90.26%
Liquidity Ratio 30% 61.91% 66.87% 62.49% 62.62%
Cost to Income
Ratio 79.20% 72.50% 77.02% 75.36%

37
Banking Sector Deposits
As shown in Table 13, banking sector deposits (including inter-bank deposits) increased by
26.47%, from $6.99 billion as at 30 June 2017 to $8.48 billion as at 31 December 2017. The
notable increase in deposits was partly attributable to increased export receipts, expansionary
impact of government expenditure and multiplier effect of new deposits.
Loans and Advances
Banking sector loans and advances increased from $3.69 billion as at 30 June 2017 to $3.80
billion as at 31 December 2017. Banking institutions have continued to support the
productive sectors of the economy. Lending to the productive sectors constituted 73.64% of
total sector loans as at 31 December 2017 as shown in Figure 14.
Figure 14: Sectoral Distribution of Loans as at 31 December 2017
Capitalisation
The aggregate core capital increased by 10.48%, from $1.24 billion as at 30 June 2017 to
$1.37 billion as at 31 December 2017, on the back of improved earnings performance. All
banking institutions are in compliance with minimum capital requirements as shown in Table
14.
CONSUMPTIVE18.60%
OTHER7.76%
AGRICULTURAL15.34%
MANUFACTURING17.29%
MORTGAGES13.16%
STATEANDENTERPRISES2.12%
TRADEANDSERVICES0.91%
MINING3.18%
[CATEGORYNAME][VALUE][CATEGORYNAME]
[VALUE]
FINANCIALFIRMS8.29%
PRODUCTIVE73.64%

38
Table 14: Banking Sector Capitalisation (US$ million)
Institution
Core Capital as at 30 June 2016 (US$ million)
Core Capital as at 31 Dec 2017 (US$ million)
Prescribed Minimum Capital requirements (US$ million)
CBZ Bank* 238.9 218.41 25 Stanbic Bank 120.75 135.52 25 Barclays Bank 67.55 79.22 25 BancABC 74.35 75.96 25 Ecobank 64.86 73.95 25 Steward Bank 46.16 71.91 25 Standard Chartered Bank 66.68 71.34 25 FBC Bank 63.99 70.37 25 ZB Bank 60.32 65.16 25 NMB Bank 53.85 61.31 25 Agribank 52.35 55.54 25 MBCA Bank 50.57 54.52 25 Metbank 39.87 44.99 25
BUILDING SOCIETIES
CABS Building Society 114.44 127.75 20 FBC Building Society 43.75 47.48 20 National Building Society 20.57 43.84 20 ZB Building Society 17.36 18.38 20
SAVINGS BANK
POSB 44.88 53.83 - Total 1,241.25 1,369.48 -
* including CBZ Building Society
All banking institutions were adequately capitalised as at 31 December 2017. The average
capital adequacy and tier 1 ratios were 27.63% and 23.97%, against the required minimum of
12% and 8%, respectively.
Housing Development

39
The provision of housing is a critical pillar in the infrastructure eco-system of an economy. In
this regard, the Reserve Bank opened up the building society segment to allow other banking
institutions such as commercial banks, to offer mortgages to deepen the sector. As at 31
December 2017, the banking sector funded a total of 5,700 new housing units valued at
$172.08 million and is projected increase to 11,611 units valued at $365.63 million as at 31
December 2018 as indicated in the Table 15.
Table 15: Projected Housing Development
Actual 31.12.17 Projected 31.12.18
Category No of units Value ($) No of units Value ($)
High Density 3,843 53,299,678 7,975 207,901,869.24
Medium Density 910 42,812,586 2,820 73,464,304.54
Low Density 905 57,526,175 743 57,270,886.34
Sub-Total 5,658 153,638,439 11,537 338,637,060
Commercial 42 18,442,315 74 26,988,807.30
Grand Total 5,700 172,080,754 11,611 365,625,867
It is encouraging to note that the highest number of housing units continues to be targeted at
low income households in the high density areas. Significant imbalances, however, exist in
the housing market, wherein demand outstrips supply and to this end, the banking sector
plays a central role in bridging this gap. Against this background, banking institutions are
urged to come up with innovative affordable mortgage funding models in order to meet the
ever increasing housing demand.
Non-Performing Loans
The quality of the banking sector loan portfolios has improved over the years. The ratio of
non-performing loans (NPLs) was 7.08% as at 31 December 2017, down from 7.87% as at 31

40
December 2016 as banks continue to strengthen their credit risk management systems, in the
aftermath of balance sheet clean up through disposals of NPLs to ZAMCO.
Figure 15: Trend in Non-Performing Loans 2011 – December 2017
ZAMCO
As at 31 December 2017, ZAMCO had acquired NPLs amounting to $987 million. These
acquisitions have assisted banks to clean up their balance sheets so that they are better able to
support the economy through provision of credit. ZAMCO has now embarked on the
Resolution and Recovery phase of its operating cycle. In this phase, all efforts are devoted
towards implementing recovery strategies and collecting from the borrowers whose NPLs
have been acquired by ZAMCO.
Earnings
The net profit for the period ended 31 December 2017 amounted to $241.94 million,
representing an increase of 33.91%, from $181.06 million reported in the corresponding
period in 2016. Eighteen (18) out of 19 operating banking institutions recorded profits during
the period ended 31 December 2017.
Liquidity
7.55%
13.46%
15.92%
20.45%
15.91%
14.27%
10.81% 10.74%
7.87% 8.39% 7.95% 8.63%
7.08%
0%
6%
11%
17%
22%
2011 2013 Dec-14 Mar-16 Dec-16 Jun-17 Dec-17
Leve
l of N
PL
Rat
io

41
The average prudential liquidity ratio of 62.62% for the banking sector as at 31 December
2017, was above the regulatory requirement of 30%. All banks were compliant with the
minimum prudential liquidity ratio as at 31 December 2017. Figure 16 shows the trend in the
banking sector average prudential liquidity ratio since March 2014.
Figure 16: Prudential Liquidity Ratio Trend (%)
Notwithstanding the high average prudential liquidity ratios recorded across the sector, the
underlying foreign currency shortages due to structural challenges in the economy have also
affected the banking industry. Various measures, including the increased usage of digital
platforms, are envisaged to ease the demand for physical cash.
Deposit Insurance Payments
As at 31 December 2017, a total of 11,744 out of 54,909 depositors by number had been
compensated out of the Deposit Protection Fund in respect of the failed contributory
institutions under liquidation. In monetary terms $3.2 million was paid, which represents
50% of the total exposure of $6.4 million. Table 16 provides a synopsis of deposit insurance
payments for the period under review.
38.0840.86 39.99
37.18 36.6138.14
43.1345.43
49.6352.47
61.91
66.87
62.49 62.62
25.
36.25
47.5
58.75
70.
Mar-14 Jun-14Sept-14Dec-14Mar-15 Jun-15Sept-15Dec-15Mar-16 Jun-16 Dec-16 Jun-17Sept-17Dec-17

42
Table 16: Deposit Insurance Payments as at 31 December 2017
Total Depositors
Gross Deposits ($ m)
Exposure (Deposits payable at $500)
No. of Depositors Paid to Date
Value of Deposits paid ($'000)
% Paid to Exposure
Royal Bank
5,453 2.57 472,207 3,105 356 75.5%
Trust Bank 2,958 11.48 328,516 415 146 44.6%
Genesis 86 1.43 11,810 62 9 74.7%
Allied Bank
9,228 14.32 1,248,307 1,529 534 42.8%
Interfin Bank
13,021 137.34 918,814 682 260 28.3%
AfrAsia 24,163 18.56 3,439,276 5,951 1,936 56.3%
Total 54,909 185.69 6,418,930 11,744 3,241 50.5%
The deadline for Genesis depositors to receive compensation from the deposit protection fund
lapsed on 30 June 2017 in terms of section 38(5b) of the Deposit Protection Corporation Act
[Chapter 24:29]. Payments in respect of liquidation will, however, remain in force in
accordance with the framework and parameters as provided in the Companies Act [Chapter
24:03] as read together with the Insolvency Act [Chapter 6:04].
Financial Stability Stress Tests
As part of measures to promote financial sector stability, the Reserve Bank in collaboration
with the World Bank and other financial sector regulators, shall assess the effectiveness of
existing frameworks to respond to crisis situations in line with international best practices,
during the first quarter of 2018. Further, in keeping with its mandate of promoting financial
stability, the Reserve Bank shall conduct comprehensive financial stability stress tests on the
banking sector in September 2018 to assess impact and resilience of their portfolios and
ultimately capital and liquidity.

43
OTHER DEVELOPMENTS IN THE BANKING SECTOR
Barclays Bank of Zimbabwe Limited
FMB Capital Holdings Plc of Malawi acquired 81% of Barclays Bank Plc Shares in Afcarme
in October 2017, resulting in an effective shareholding of 42.68% in Barclays Bank of
Zimbabwe.
Time Bank of Zimbabwe Limited
The Bank and Time Bank of Zimbabwe Limited have had historical disputes, which have
been the subject of various litigation and Time Bank has not been operating as a banking
institution. A resolution has since been reached and Time Bank will resume banking
operations subject to prior inspections by the Bank to ensure that the institution puts in place
the necessary capital and banking systems and structures.
Zimbabwe Women Microfinance Bank
The Women’s Bank, which was licenced on 14 September 2017 as a deposit-taking
microfinance institution, is finalising the relevant processes, systems and infrastructure in
preparation for a pre-opening assessment by the Bank before the institution is authorised to
open its doors to the public. It is envisaged that the institution will contribute towards the
financial inclusion agenda and play an important role of engendering a savings culture among
low-income groups.
Legal Developments
The Bank, in collaboration with the Ministry of Finance is working on a Microfinance
Amendment Bill. The Bill seeks to address the following among other issues:
a) provide for perpetual licences for deposit-taking microfinance institutions, subject to
cancellation in the event of breach of the law, in the same manner as other banking
institutions;
b) extend the tenure of the licence for credit-only microfinance institutions from the current
one year to five years; and

44
c) enhance corporate governance systems and risk management practices within the
microfinance sector.
Performance of the Microfinance Sector The performance of the microfinance sector remained largely stable over the year, in terms of
both outreach and loan portfolio growth. The performance of the sector is expected to
improve on the back of anticipated improvements in operating environment in the outlook
period. A comparison of the key microfinance sector indicators for December 2016 and 2017
is provided in Table 17.
Table 17: Microfinance Performance Indicators, Sept 2016 – Sept 2017
Indicator Sept 16 Dec 16 Mar 17 Jun 17 Sept 17
Number of Licensed Institutions 169 185 180 187 189
Total Loans (US$m) 200.80 206.28 215.24 229.44 238.60
Total Assets (US$m) 255.32 275.04 291.89 297.85 341.17
Total Deposits (DTMFIs) (US$m) 2.10 4.19 5.12 6.62 5.65
Number of Savings Accounts (DTMFIs) 1,060 1,411 1,993 2,265 2,848
Portfolio at Risk (PaR>30 days)* (%) 6.11 8.34 7.52 6.46 7.68
Number of Active Clients 263,806 290,552 257,498 322,728 254,094
Number of Outstanding Loans 279,148 352,225 620,728 372,837 295,547
Number of Branches 595 659 648 698 681
* Portfolio at Risk [30] days-The value of all loans outstanding that have one or more instalments of
principal past due more than [30] days. This includes the entire unpaid principal balance, including both
the past due and future instalments, but not accrued interest. It also includes loans that have been
restructured or rescheduled.
The microfinance sector registered a 33.68% growth in total assets over the year from
$255.21 million as at 30 September 2016 to $341.17 million as at 30 September 2017. The

45
four (4) operational DTMFI had a market share of 25.32% of the total microfinance sector
loans as at 30 September 2017. Women continue to benefit from facilities that are targeted at
the marginalized and low income, with loans to the women accounting for 38.36% of the
total sector loan book. Figure 17 indicates the trend in microfinance women borrowers.
Figure 17: Growth of Active & Women Clients
For the nine months ended 30 September 2017, credit only microfinance institutions posted
an aggregate profit of $13.34 million while the deposit taking microfinance institutions’ sub-
sector recorded $1.27 million. A total of forty-six credit-only microfinance institutions
posted losses largely due to unsustainably high cost structures and high levels of delinquent
loans, while in the DTMFI subsector, one (1) institution posted losses largely due to the
absorption of start-up costs. The industry Operating Self Sufficiency ratio 123.95% is above
the break-even point of 100%, indicating that the microfinance sector in Zimbabwe is
sustainable.
58,325
96,749
150,188
205,282 205,940
290,552
254,094
16,159 31,453
54,622 67,536 71,811
128,337
97,470
'-
75,000
150,000
225,000
300,000
375,000
31-Dec-11 31-Dec-12 31-Dec-13 31-Dec-14 31-Dec-15 31-Dec-16 30-Sept-17
Number of total clients Number of female clients

46
SECTION 7 POLICY MEASURES TO ENHANCE FINANCIAL STABILITY AND TO PROMOTE BUSINESS CONFIDENCE IN THE ECONOMY In order to enhance business confidence and credibility under the ‘Zimbabwe is open for
business’ narrative, supportive monetary and fiscal measures are essential to walk the talk to
improve the monetary environment which is characterized by tight foreign currency liquidity.
The panacea for the challenge of tight foreign currency is to increase production, exports,
foreign direct investment, diaspora remittances, loans and putting in place measures to
protect investors’ funds. In line with this narrative and to enhance the ease of doing business
in the economy, the following measures are being put in place with immediate effect to
gradually liberalise the foreign currency market and promote business confidence.
1. Enhancing the Nostro Stabilisation Facilities to Support Foreign Payments
The Bank is enhancing the Nosto Stabilisation facilities by US$400 million to support the
following:
a) To provide assurances that international remittances and individual foreign
currency inflows received through normal banking channels are available for use
when required by the owners;
b) To meet the foreign exchange requirements for the importation of essential
requirements that include fuel, medications, electricity, cash imports, and
industrial raw materials for the manufacture of cooking oil, other food products,
packaging, exports, etc.
c) Refining the operation of the Portfolio Investment Fund by ensuring that all
portfolio investment inflows are ring-fenced to meet the portfolio investment
outflows which shall be processed by giving priority to capital before capital
appreciation (profits) and dividends. This policy measure is necessary to augment
the current US$5 million that has been provided in the Fund as seed capital and to
further provide assurances to investors that Zimbabwe is open for business.

47
2. Provision of Investment Guarantees to Protect Investors’ Funds
The Bank is working with the African Export-Import Bank (Afreximbank) to put in place a
US$1.5 billion facility that is earmarked for the provision of guarantees (US$1 billion) to
investments coming into the country and for liquidity support (US$500 million). Such
guarantees and liquidity support are necessary to protect investors’ funds from country risk,
and in doing so, enhancing investor confidence.
3. Provision of 7% tax-free savings bonds on non-resident transferable funds
In order to provide return on remittable funds currently held in Non-Resident Transferrable
Accounts in respect of in-country funds such as dividends and profits due to non-residents
that cannot be immediately remitted as a result of the current foreign currency shortages, such
funds can now be invested in tax-free savings bonds at a coupon rate of 7%. This
compensation process is necessary to assure investors of returns on their idle funds seated at
banks.
4. Enhanced Export Incentive Scheme for Horticulture, Cotton, Macadamia and Gold
The economy’s foreign currency inflows are on a positive trajectory, largely on account of
increasing export receipts that grew by 36% in 2017 from the 2016 level. It is therefore
important to sustain this momentum for increased foreign currency inflows. Accordingly, the
current export incentive scheme that is funded by bond notes shall be maintained to promote
export competitiveness at the current thresholds. The scheme which was adjusted to 12.5%
for tobacco growers starting this year shall be tweaked to 10% for horticulture, cotton,
macadamia and gold producers.
5. Increasing tobacco and gold support facilities
In order to enhance foreign currency inflows from tobacco and gold production, the tobacco
input finance facility has been increased from the $28 million disbursed in 2017 to $70
million, while the gold support facility has been increased from $74 million (disbursed to 255
entities) in 2017 to $150 million.
Financing tobacco and gold and other exportable products such as horticulture, mining,
tourism, etc, using RTGS funds seated at banks is beneficial for generating foreign exchange
for the country. Further, and in line with the tobacco finance order, deserving tobacco

48
merchants shall be granted authority by the Bank to use RTGS money to purchase tobacco
from the auction floors. This dispensation shall also apply to deserving cotton merchants.
6. Establishment of Offshore Financial Service Centre
The Bank is currently working on a legal framework to operationalize the establishment of an
offshore financial service centre within the context of the Special Economic Zones (SEZ)
programme. The legal framework is built on providing investors with the supportive policy
environment and guidelines to pursue various investment options in the financial service
centre.
7. Purchase of gold for value addition
The jewellery industry remains key in promoting value addition which is in sync with
Government policy on mineral beneficiation. In order to enhance the gold industry’s
contribution to this value addition objective, priority shall be given to export oriented
jewellery production, where the jewellery manufacturer shall retain 100% of the foreign
currency generated from the value added component for use in their business operations.
Approved jewellery manufacturers to meet local demand shall be availed not more than 3 kgs
per quarter through Fidelity Printers and Refiners under a properly monitored arrangement to
guard against abuse of this facility.
8. Enhancing the Ease of Access to Productive Sector Facilities
The Bank has put in place measures to ensure ease of access to the productive sector facilities
that are earmarked for the promotion of exports, production, empowerment and business
linkages. This measure is necessitated by the need to address concerns raised by both
business and individuals on the difficulties confronted in accessing these facilities. It is
therefore necessary to ensure that final beneficiaries have ease access to funding for them to
expeditiously promote production and exports.
9. Upwards Review of Threshold for Exports by Individuals
In order to improve ease of doing export business by individuals, going forward the threshold
for value of goods that can be exported by an individual without completing export forms,
Form CD1, has been increased from the current US$1,000 to US$2,000. Sale proceeds would
need to be repatriated into the country.

49
10. Upwards Review of Foreign Currency Retention Thresholds In recognition of the need to ensure continuous generation of foreign exchange, the foreign
currency retention threshold for all services and products except gold, diamonds, platinum,
chrome and tobacco remains at 100% of export receipts for exporters’ use in their business
operations within an extended period of up to 14 days from the receipt of funds. The retention
threshold for private owned diamond firms, platinum and chrome producers has been
increased from 20% to 35% whilst that for gold, public owned diamond firms and tobacco
remain as per current policy.
11. Downward Review of Cost of Export Documents The current charges based on Exchange Control’s flagging system on the exports of non-
compliant exporters are high. Given the need to facilitate exports at the same time affording
exporters an opportunity to comply with the Presidential Amnesty on illegally externalized
foreign currency and assets, the maximum fixed administrative charge to access exports
documents has been reduced from $50 to $20 per export transaction.
12. Establishment of an Investment Desk to Cater for the Diasporans There has been increased calls for the establishment of a desk to facilitate Zimbabweans in
the diaspora to participate in the development of their country through mobilizing
investments into all sectors of the economy. Already, there has been a positive response to
these calls as evidenced by the numerous enquiries from Diasporans and international
investors. Consistent with the tenets of the ease of doing business, in an open business
environment, the Bank has established a desk to assist those in the diaspora to get involved in
the investment opportunities within the national economy.
13. Issuance of Diaspora Tobacco & Gold Production Financing Bonds Tobacco and gold exports contribute significantly to the country’s export receipts. The
tobacco and gold sectors, if sustainably and adequately funded, have the potential to generate
more foreign currency for the country. The Bank has also noted that small and start-up
companies in the tobacco sector are failing to access offshore funding in line with the tobacco
financing order.

50
In order to allow Zimbabweans in the diaspora to participate fully, or on a twinning
arrangement basis, in the turnaround of the country’s economy and exports generation, the
Bank has opened up the issuance of well secured Tobacco and Gold Production Financing
Bonds to diaspora investors.
The Diaspora Tobacco Production Financing Bond will be issued to Zimbabweans in the
diaspora to finance tobacco production. Bond holders will be paid capital plus interest as
single bullet payment at the end of the tobacco season.
The Diaspora Gold Production Financing Bond will be issued to Zimbabweans in the
diaspora to finance gold production by small scale gold miners. Coupon payments will be
made on monthly basis as gold is sold to Fidelity Printers and Refiners.
14. Incentive for Diaspora Investments Accounts in Zimbabwe In an effort to facilitate inward investments by Zimbabweans in the diaspora, going forward,
Zimbabweans in the diaspora can open Diaspora Investment Accounts with local banks of
their choice. The accounts which shall be for savings/investment purposes or for holding
funds earmarked for undertaking investment projects in Zimbabwe, shall be funded from
offshore and shall be entitled to a 7% Diaspora Remittance Incentive from the RBZ over and
above the interest offered by the bank. These accounts shall be ring-fenced against
comingling with RTGS money.
15. Payment Arrangements for the Sale of Immovable Property & Management Fees
The Bank has noted the irregular execution of Zimbabwean immovable property sales, where
settlement of funds is being done offshore. Stakeholders in the property market sector are
advised that such practices are not consistent with current Exchange Control rules and
regulations. Accordingly all receipts from the sale of immovable properties in Zimbabwe
should be received into the country and accounted for through normal banking channels.
Exceptions to this policy position require prior Exchange Control authority.

51
Similarly, the current policy that limits the annual payment of management, technical or
consultancy fees to 3% of annual revenue shall continue to apply to all businesses with
exceptions requiring prior Exchange Control approval.
16. Further Promoting the Use of Plastic Money Towards a Cash-lite Society
The Bank is further accelerating efforts towards a cash-lite society by the adoption of friendly
banking and plastic money payment platforms such as tap-and-go systems and pre-funded
cards to enhance the ease of transacting and ease of passage at tollgates within the country.
This measure is intended to further promote the use of plastic money which significantly
grew by 210% in 2017 from the 2016 position to reach a coverage of more than 80% of total
retail transactions in the country.
17. Curbing of Multi-Pricing System & Refusal of Plastic Money
Government is putting in place measures to curb the multi-pricing system within the
economy. Multi-pricing and refusal to accept plastic money is counter-productive to the
successful and unparalleled efforts achieved so far in the promotion and usage of plastic
money in Zimbabwe. Businesses will need to be reminded to show respect to consumers and
to exercise self-discipline under the new economic dispensation. It is against this background
that the 2018 Finance Bill which has now gone through Parliament and now awaits approval
by the Senate is making these malpractice of multi-pricing and the refusal of plastic money
illegal.
18. Strengthening Financial Credibility
In line with the lending powers of the Bank to Government as provided for in Section 11 1(a)
of the Reserve Bank Act [Chapter 22:15], the Bank is putting in place measures to ensure that
the lending limit to Government does not exceed the regulated 20% of the previous year’s
revenue of the State. This measure is necessary in order to comply with good corporate
governance and to mitigate the unintended consequences of excess Government overdraft on
the economy.
19. Strengthening of Liquidity Management Systems
To ensure stability of the monetary system, the Bank is strengthening its liquidity
management systems to mop RTGS money and make it more attractive for investment. The

52
Bank will achieve this through issuance of medium-term government paper to improve
monetary policy stance on the economy by signalling and developing a yield curve which
also helps in the development of a local bond market. Already the Bank has issued a 7%
savings bond, whose uptake has been satisfactory, raising $165 million in three months,
October to December 2017.
Further, the reintroduction of an auction system for Treasury Bills and Bonds will bring in
transparency as well as allow a discernible yield curve to be developed. The Bank is also
assessing the possibility of reintroducing Open Market Operation (OMO) tools during the
course of the year in order to deal with excess liquidity in the market.
20. Acceptance of 99-Year Land Leases as Security by Banks
In line with the current economic dispensation’s aspiration to transform agriculture into
viable business proposition and taking into account of the significant improvements made by
Government on the 99-year leases to enhance the security of tenure of the lease and making it
bankable and transferrable, the Bank has agreed with banking institutions for them to accept
the 99-year leases as security for accessing credit from financial institutions in line with the
provisions of the leases.
21. Policy Note on the Presidential Amnesty on Externalised Forex and Assets
Following the announcement of the Presidential Amnesty on externalised foreign currency
and assets by His Excellency, the President, the Bank is encouraged by the overwhelming
response from Zimbabweans desiring to comply with the amnesty arrangements. The
responses have been positive from both individuals and corporates in respect of foreign
currency (and not decommissioned or demonetised local currency) that was externalized by
commission or omission or under the liberalized Exchange Control framework with such
foreign currency banked offshore or used to acquire foreign assets.
The response to date demonstrates the willingness by corporates and individuals to comply
with these arrangements. Already, bank deposits have been increasing on account of funds
being channelled into the formal system, as corporates and individuals take heed of the
amnesty to repatriate externalized funds and/or deposit funds in the banking system. The

53
Bank is offering 7% tax-free savings bonds for funds to be repatriated under the amnesty
dispensation where funds were externalised under the auspices of free funds.
It is essential to note that the requirement for the disclosure of foreign assets as is required by
the Amnesty is in compliance with international best practice and is therefore not unique to
Zimbabwe. Almost all jurisdictions make such disclosures mandatory. In any case, all
payments need to be bonafide to satisfy the Know Your Customer (KYC) and Customer Due
Diligence (CDD) banking principles. The Amnesty which pertains to externalised foreign
currency and assets bought outside Zimbabwe using foreign currency that belonged to
Zimbabwe through acts or commissions as given below does not affect funds and assets
acquired by Zimbabweans in the diaspora.
i. Export of any currency above permissible thresholds;
ii. Smuggling of gold or other precious stones;
iii. Non-repatriation of export proceeds due to the country;
iv. Undervaluation of exports and overvaluation of imports and retention of funds offshore;
v. Trade mis-invoicing by importers to evade customs duties, VAT, or income taxes;
vi. Non-return of temporary exports and disguised exports of samples;
vii. Payments for imports of goods and services whose corresponding value has not been
received into the country;
viii. Remittance of funds used for investments offshore without Exchange Control approval;
ix. Offshore retention of funds realised from sale of local assets for example, shares in local
companies to foreign residents;
x. Offshore retention of investment income such as dividends, profits and management fees
due to the country;
xi. Remittance of funds for repayment of fictitious offshore loans;
xii. Fictitious and unreasonable management fees and technical fees;
xiii. Settlement of purchase prices offshore, for an immoveable property situated in
Zimbabwe;
xiv. Operation of illegal offshore bank accounts by individuals and companies funded from
Zimbabwe;

54
xv. Offshore retention of sale proceeds realised from smuggled goods or minerals; and
xvi. Any other unauthorised offshore retention of funds without Exchange Control approval.
22. Policy Note on the Continuation of the Multi-Currency System
Government’s policy stance on currency reform that pertains to de-dollarisation is well
documented as was clearly articulated by his Excellency, the President. Government is quite
aware that the most important economic fundamentals that the country would need to achieve
before any currency reform begins are a healthier foreign exchange buffer sufficient to cover
at least 3 months of imports and reducing fiscal deficit to sustainable levels as defined in the
Reserve Bank of Zimbabwe Act. These fundamentals which are critical to ensure free
convertibility are still weak or fragile for a currency reform. It is against this reality that the
country continues to use the multi-currency system.
In future, when the said economic fundamentals become strong, the road map for currency
reform in Zimbabwe will be predicated or tailor-made along the currency board (CB) and/or
gold standard (GS) mechanisms that are stringent monetary rules, the two special features of
which are high credibility of monetary authorities and the existence of self-adjustment (non-
discretionary) mechanism.
The CB and GS systems have a mechanism that links the demand and supply of money to the
balance of payments which is essential for convertibility and for the quick elimination of
imbalances within the economy. These systems basically take the form of a monetary
‘constitution’ which is characterised by a higher level of credibility and confidence.
23. Policy Note on Accelerated Arrears Clearance and Re-Engagement Programme In line with the new economic order, Government is intensifying the re-engagement process
with the international community to improve international relations and to resolve the
external payment arrears to the remaining International Financial Institutions (IFIs) as well as
bilateral creditors. In this regard, Government will follow the previously agreed process for
clearing external payment arrears to IFIs, which was endorsed by the IFIs and Bilateral
Creditors at a meeting held on the side lines of the Annual Meetings of the IMF and World
Bank in Lima, Peru, in October 2015.

55
The successful resolution of arrears to IFIs will pave way for Government to negotiate debt
restructuring mechanisms with the Paris Club creditors. The ensuing improvement in
economic activity following successful re-engagement will significantly reduce the country’s
risk premium and unlock offshore credit lines at affordable interest rates. Access to foreign
finance, which has been significantly limited over the past seventeen years now, is critical to
increase foreign currency buffer for the country.
In addition, Government will also be in a position to actively engage the donor community to
complement Government support to targeted social and developmental programmes. The
envisaged high economic growth rates to be experienced will go a long way for the country
to sustain appropriate debt levels, increase fiscal space, jobs, production and exports.

56
SECTION 8 CONCLUSION The narrative “open for business” means that Zimbabwe is ready and willing to embrace a
paradigm shift to attract investors, both local and foreign, for the total transformation of the
economy in respect of increased production, jobs, exports, fiscal space, access to capital and
foreign finance. Improvement in these economic variables will greatly benefit the monetary
environment and, in doing so, enhancing financial stability and confidence within the
national economy. A healthy foreign exchange buffer will strengthen the value of RTGS
funds and gradually reduce cash shortages.
“Open for business” is not just a narrative. It calls for a dramatic change in the conduct of
business from the business as usual approach. We need to walk the talk to re-balance the
economy through a tight rein on fiscal deficit - increasing revenue collections and holding
expenditures constant - whilst at the same time enhancing Zimbabwe’s access to foreign
finance and increasing foreign inflows from exports and international remittances. These
measures will be buttressed by accelerating the arrears clearance and re-engagement
programme under the Lima, Peru, principles of engagement with the International Financial
Institutions and Development Partners.
The policy measures enunciated in this Statement should therefore be seen as the initial move
to gradually open the foreign currency market to show that Zimbabwe is open for business.
2018 should therefore be a defining year for Zimbabwe. The future of Zimbabwe is in our
hands.
I THANK YOU
DR J. P. MANGUDYA GOVERNOR