Monday Morning Quarterback Summaryc.ymcdn.com/sites/ · Months of Inventory List Price 15 $182,725...
17
Monday Morning Quarterback Summary Week of Nov 27, 2011 Single-family existing homes Sales of single-family homes increased to 404 during the week of Nov 27, from 168 the week prior The median price of single family homes increased to $138,000, a change of 4.0% The number of single-family home foreclosure transactions increased to 74 last week, from 24 the week of Nov 20 The number of single-family home short-sale transactions increased to 141 from 67 the week prior Single-family inventory decreased by 59, and now sits at 10,618 Single-family inventory decreased by 59, and now sits at 10,618 Condos, townhomes, and villas Sales of condos, townhomes, and villas increased to 148 during the week of Nov 27, from 68 the week prior The median price of condos, townhomes, and villas decreased to $67,500, a change of -6.9% The number of condo, townhome, and villa foreclosure transactions increased to 38 last week, from 18 the week of Nov 20 The number of condo, townhome and villa short-sale transactions increased to 62 from 20 the week prior Condo inventory increased by 34, and now sits at 2,400 Detailed charts and graphs begin on page 2 of this report.
Transcript of Monday Morning Quarterback Summaryc.ymcdn.com/sites/ · Months of Inventory List Price 15 $182,725...

Monday Morning Quarterback Summary
Week of Nov 27, 2011
Single-family existing homes
Sales of single-family homes increased to 404 during the week of Nov 27, from 168 the week prior
The median price of single family homes increased to $138,000, a change of 4.0%
The number of single-family home foreclosure transactions increased to 74 last week, from 24 the week of Nov 20
The number of single-family home short-sale transactions increased to 141 from 67 the week prior
Single-family inventory decreased by 59, and now sits at 10,618Single-family inventory decreased by 59, and now sits at 10,618
Condos, townhomes, and villas
Sales of condos, townhomes, and villas increased to 148 during the week of Nov 27, from 68 the week prior
The median price of condos, townhomes, and villas decreased to $67,500, a change of -6.9%
The number of condo, townhome, and villa foreclosure transactions increased to 38 last week, from 18 the week of Nov 20
The number of condo, townhome and villa short-sale transactions increased to 62 from 20 the week prior
Condo inventory increased by 34, and now sits at 2,400
Detailed charts and graphs begin on page 2 of this report.
Months of Inventory
List Price
15
$182,725
$116,500
$728,596
Sale Price
$221,035
$199,039
817 25
$120,390 $271,157
$270,945
642 6
$673,462
$789,104 $2,414,833
$328,056
19
Short Sales / Bank Owned
$1,955,667
$138,000
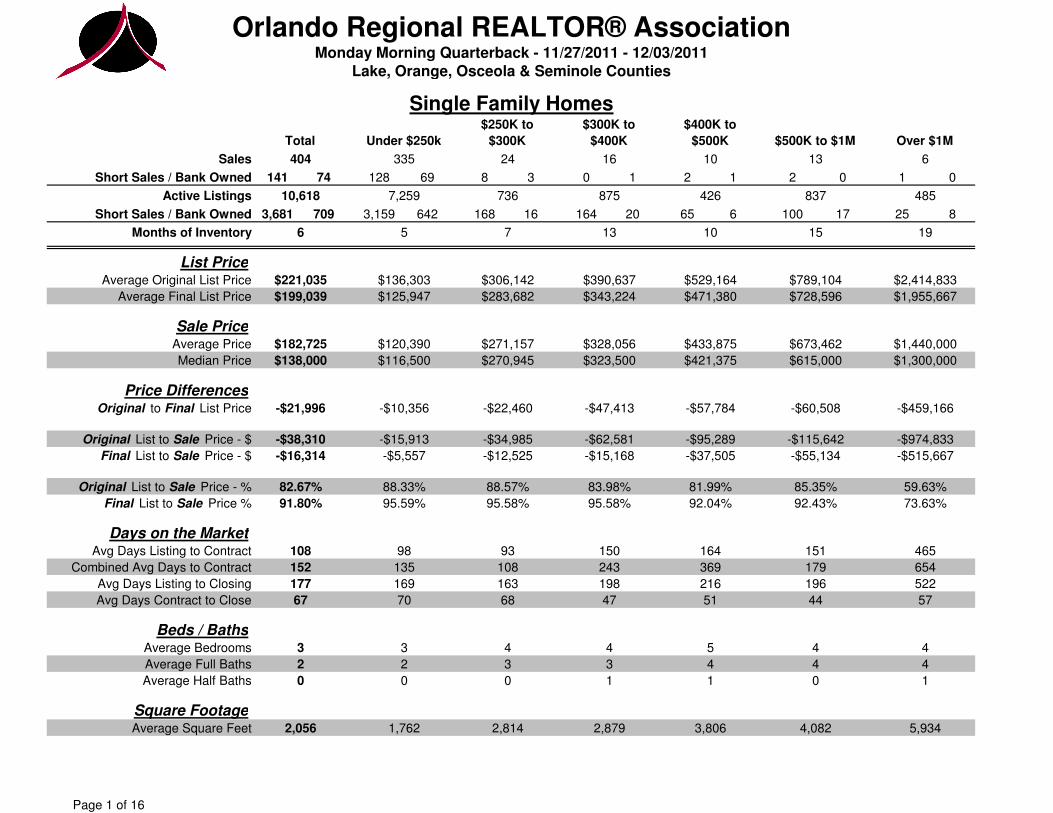
Orlando Regional REALTOR® AssociationMonday Morning Quarterback - 11/27/2011 - 12/03/2011
Lake, Orange, Osceola & Seminole Counties
Single Family Homes
1
13Sales
Under $250k
404
Total
Active Listings
$343,224
10,618
$529,164
164 65
Short Sales / Bank Owned 141 1
$250K to
$300K
24
3,159
01
485
0
Average Original List Price
Average Final List Price
8
6
Over $1M
$400K to
$500K
$300K to
$400K
875
$615,000
$1,440,000
0
16
$421,375$323,500 $1,300,000
$390,637
426
2
837
20
$500K to $1M
10
13 10
$471,380
$306,142
736
6
$125,947
163,681 709
$136,303
5
$283,682
335
7,259
3
100168
74 128 69 2
7
Average Price
Median Price
$433,875
.
179
-$55,134
-$22,460
88.33%
-$12,525
-$34,985
-$5,557
108
Average Full Baths
Average Half Baths 0
Days on the Market
Combined Avg Days to Contract
Final List to Sale Price %
Avg Days Listing to Contract
Original List to Sale Price - $
Original List to Sale Price - %
Final List to Sale Price - $
Avg Days Listing to Closing
43
68
2,879
44
1 1
177
108
82.67%
93
-$15,913
-$10,356
95.58%
654
73.63%
150
163 522
-$459,166-$60,508
43
Beds / Baths
-$95,289
135
-$515,667
151
-$115,642-$62,581 -$974,833
59.63%
465
95.58%
-$47,413
85.35%
92.43%
81.99%
369243
-$21,996 -$57,784
16498
95.59% 92.04%
3
152
47
42
Price DifferencesOriginal to Final List Price
-$38,310
88.57%
-$15,168
83.98%
-$16,314 -$37,505
91.80%
169
70 51
216198 196
5767
Average Bedrooms
00
3
1
Square Footage
Avg Days Contract to Close
0
4,082
44
4
5,9341,762Average Square Feet
4 5
2
2,814 3,8062,056
Page 1 of 16

Orlando Regional REALTOR® AssociationMonday Morning Quarterback - 11/27/2011 - 12/03/2011
Lake, Orange, Osceola & Seminole Counties
.
Single Family Homes
$100
$150
$200
$250
$300
Prices (in thousands)
215
256281
323
414
165
256232
423
212208
277
340 349
221
311
168
404
100
200
300
400
500
600
7/31 8/7 8/14 8/21 8/28 9/4 9/11 9/18 9/25 10/2 10/9 10/16 10/23 10/30 11/6 11/13 11/20 11/27
Weekly Sales
Period Average - 281
$1007/31 8/7 8/14 8/21 8/28 9/4 9/11 9/18 9/25 10/2 10/9 10/16 10/23 10/30 11/6 11/13 11/20 11/27
Orig List Price Final List Price Avg Sale Price Median Sale Price
Page 2 of 16

Orlando Regional REALTOR® AssociationMonday Morning Quarterback - 11/27/2011 - 12/03/2011
Lake, Orange, Osceola & Seminole Counties
.
Single Family Homes
49
73 74
88
150
61
89
76
137
73 79
89
109 113
72
115
67
141
51
6265
69
87
4151
62
107
36 3748
63 60
46
59
24
74
0
20
40
60
80
100
120
140
160
180
Foreclosure Sales
07/31 8/7 8/14 8/21 8/28 9/4 9/11 9/18 9/25 10/2 10/9 10/16 10/23 10/30 11/6 11/13 11/20 11/27
Short Sales Bank Owned
10%
20%
30%
40%
50%
60%
7/31 8/7 8/14 8/21 8/28 9/4 9/11 9/18 9/25 10/2 10/9 10/16 10/23 10/30 11/6 11/13 11/20 11/27
Percentage of Sales
Short Sales Bank Owned Other
Page 3 of 16

Orlando Regional REALTOR® AssociationMonday Morning Quarterback - 11/27/2011 - 12/03/2011
Lake, Orange, Osceola & Seminole Counties
.
Single Family Homes
80
100
120
140
160
180
200
220
Average Days on Market
7/31 8/7 8/14 8/21 8/28 9/4 9/11 9/18 9/25 10/2 10/9 10/16 10/23 10/30 11/6 11/13 11/20 11/27
Listing to Contract Combined Days - Listing to Contract Listing to Closing
10,906
10,84910,753 10,767
10,678
10,695 10,682
10,611
10,513 10,53810,475
10,519
10,591
10,556 10,58710,646
10,677
10,618
10,000
10,500
11,000
11,500
7/31 8/7 8/14 8/21 8/28 9/4 9/11 9/18 9/25 10/2 10/9 10/16 10/23 10/30 11/6 11/13 11/20 11/27
Total Actives
Period Average - 10,648Change since Jan 3, 2011: - 29.99% (15,167)
Page 4 of 16

Orlando Regional REALTOR® AssociationMonday Morning Quarterback - 11/27/2011 - 12/03/2011
Lake, Orange, Osceola & Seminole Counties
.
Single Family Homes
0%
10%
20%
30%
40%
50%
60%
70%
80%
Percent of Actives
0%
10%
20%
30%
40%
50%
60%
70%
80%
Percent of Actives
3,572 3,529 3,514 3,549 3,557 3,571 3,5683,541 3,474
3,415 3,386 3,412 3,446 3,476 3,510 3,593 3,643
3,681
641 598 590 598 616 625 622 604 643 654 652 664 690 702 717 733 724
709
0
500
1,000
1,500
2,000
2,500
3,000
3,500
4,000
4,500
5,000
7/31 8/7 8/14 8/21 8/28 9/4 9/11 9/18 9/25 10/2 10/9 10/16 10/23 10/30 11/6 11/13 11/20 11/27
Active Foreclosures
Short Sales Bank Owned
0%5/15
Bank Owned Short Sales Other
0%7/31 8/7 8/14 8/21 8/28 9/4 9/11 9/18 9/25 10/2 10/9 10/16 10/23 10/30 11/6 11/13 11/20 11/27
Bank Owned Short Sales Other
Page 5 of 16

Orlando Regional REALTOR® AssociationMonday Morning Quarterback - 11/27/2011 - 12/03/2011
Lake, Orange, Osceola & Seminole Counties
.
Single Family Homes
62
49
5552
4947
5156
41
46 4852
55
49 4953
41
59
23
1614 12
1012
19 18
15 1411 9
12 13
19
105
16
31
22
34
2023
26
18 17
36
18
2528
24
30
21
33
23
16
0
10
20
30
40
50
60
70
80
Temporary off Market
07/31 8/7 8/14 8/21 8/28 9/4 9/11 9/18 9/25 10/2 10/9 10/16 10/23 10/30 11/6 11/13 11/20 11/27
Short Sales Bank Owned Other
91
74
92 94
76 78
89 90
79
86
127
117 97
81
84
66 50 72
4 16
134
12 6 8 1013 10
10 12 8 7 5 27
87
86
7983
8881
68
87
90
7481
6673
101
78
80
48
88
-25
0
25
50
75
100
125
150
7/31 8/7 8/14 8/21 8/28 9/4 9/11 9/18 9/25 10/2 10/9 10/16 10/23 10/30 11/6 11/13 11/20 11/27
Withdrawn
Short Sales Bank Owned Other
Page 6 of 16

Orlando Regional REALTOR® AssociationMonday Morning Quarterback - 11/27/2011 - 12/03/2011
Lake, Orange, Osceola & Seminole Counties
.
Single Family Homes
Short Sales, 34.67%
Bank Owned, 6.68%
Short Sales, 34.90%
Bank Owned, 18.32%
6.68%
Other, 58.66%
Actives
Other, 46.78%
Sales
Page 7 of 16

Orlando Regional REALTOR® AssociationMonday Morning Quarterback - 11/27/2011 - 12/03/2011
Lake, Orange, Osceola & Seminole Counties
.
Zip
County / City
Casselberry
Longwood (East)
Oviedo
Sanford (South)
Winter Park
Orange CountyApopka (North)
Colonialtown
Pine Hills / Rosemont
Pinecastle / Belle Isle
2.0
1
$91.43
$73.441,886
$81.26
1,533
3.3
Average
Available
Average
Code
32707 $138,500
Beds
4.0 2,064
1,6022.0
$137,900
$71.801,929
1.92.0
$106.21
$66.81
1,69232792
1,508
$108.781,264
$86.45
$138,500
3.0
3.0
$138,500
$90.03
Baths
Where are the 27 Single Family Homes available for the Median Price of $138,000?
List Price
6 $137,958
List $
Seminole County
$138,500
2
1,304
3.0
$137,500
2.8
4.0
2,384
$80.821,707
32773
3.0
10
32809
$138,040
1
1
1
32808
AverageAverage
per SqFtSqFt
$58.102.0
2.04.0
3.0
$137,875
$137,500
$138,500
32765
32750
1
2.0
2.0
1 2.0
3.0
1
32712
2.03.0
1
32803
Pinecastle / Belle Isle
Hiawassee
Bithlo
Research Park
Waterford Lakes
Metro West / Orlo Vista
Osceola CountyKissimmee / Celebration
Kissimmee / Poinciana
Lake CountyGrand Island
Mount Dora
Clermont (Central)
Leesburg (West)
Leesburg (East) / Haines Creek
2,154
4
$137,500
3.0
2.0
1,6022.0
2.5
5.0
$138,000
3.0
$73.86
$137,700
1
3.0
1
$137,700
32735
34758
2
34747
2.0
$137,900
34711
$81.261
$137,625
$46.07
$105.69$137,500
$64.08
$69.20
2
1,22132835
4.0$138,000
3.0$138,000
$138,0001 3.0
32826
2.01 $113.02
$86.45$138,50032809 1
3.0
$0.001,264
3.0
2.0
32818
32820 1 $138,000
2.0
2.01
1,496
3.0
2.0
3.0
1,8652 $137,750
32828
$137,500
$92.25
1,301
3.1
$138,500
2.0
$79.88
1,552
2.0
1,987
3.0 2.0
3.0
3.0
$88.68
$70.32
$64.28
2.0
$78.55
1,692
32757 2,147
2.0 1,961
1,753
1 3,006
4.0
34748
1,724
1
9
34788
Page 8 of 16

Orlando Regional REALTOR® AssociationMonday Morning Quarterback - 11/27/2011 - 12/03/2011
Lake, Orange, Osceola & Seminole Counties
.
$300K to
$400K
$0
0
$0 $0$85,100
Average Original List Price
Months of Inventory
Short Sales * / Bank Owned
$88,962
$82,999
Average Final List Price
List Price$292,000
Total
742
38
2,138
Short Sales * / Bank Owned
Sales
Active Listings
145
Under $250k
$340,000
$368,250
$263,000
$340,000
1
$0
$400K to
$500K
77
$0$78,213
3
2
16
0 0
102
0
$0$79,906
0
8
$83,709
228
$358,250
38
7
$292,000
0
4
722
Over $1M
$0
37
62
$250K to
$300K
2
$0
10
Condos, Townhomes, Villas
30
233
0
$0
0 0 0
22
$0
0
Price Differences
Median Price
1
$66,500
2
$67,500
9
$263,000
0
148
62
$500K to $1M
Sale PriceAverage Price
$0
0
0 0
24
0
$0
0
2,400
$0
2
90.07%
0
0.00%0.00%
0
0
0
0
Original to Final List Price
0
93.43%
-$10,000 $0
$0
-$3,803
0
0
-$3,862
Avg Days Listing to Contract
Beds / Baths
Avg Days Listing to Closing
Final List to Sale Price %
0Average Full Baths
01,850
-$29,000
72
0
71
2
-$1,693
0
0
1
27
Average Bedrooms
Avg Days Contract to Close
97.53% 97.88%
92.33%
0
0
0
0.00%
0
2
0.00%
0
42
0
0
15
147
1,217
-$2,101 -$18,250
$0
96
-$28,250
0 0
2
27
93.30%
$0
0196
73 72
2
90.07%
145
Original List to Sale Price - %
145
3
$0
121
Combined Avg Days to Contract 0
0
2
354
2,001
$0
0.00%0.00%94.91%
Final List to Sale Price - $
0
Price Differences
Average Square Feet
92
3
0
-$5,963 $0
$0
Square Footage
Days on the Market
Original List to Sale Price - $
Average Half Baths
1,231
-$5,496
$0
-$29,000
Page 9 of 16

Orlando Regional REALTOR® AssociationMonday Morning Quarterback - 11/27/2011 - 12/03/2011
Lake, Orange, Osceola & Seminole Counties
.
Condos, Townhomes, Villas
$25
$50
$75
$100
$125
$150
Sale Prices (in thousands)
$257/31 8/7 8/14 8/21 8/28 9/4 9/11 9/18 9/25 10/2 10/9 10/16 10/23 10/30 11/6 11/13 11/20 11/27
Orig List Price Final List Price Avg Sale Price Median Sale Price
80
77
94
105
172
66
6980
117
97
7685
122
105
84
112
68
148
30
60
90
120
150
180
210
7/31 8/7 8/14 8/21 8/28 9/4 9/11 9/18 9/25 10/2 10/9 10/16 10/23 10/30 11/6 11/13 11/20 11/27
Weekly Sales
Period Average - 98
Page 10 of 16

Orlando Regional REALTOR® AssociationMonday Morning Quarterback - 11/27/2011 - 12/03/2011
Lake, Orange, Osceola & Seminole Counties
.
Condos, Townhomes, Villas
3530 36
42
63
26
32
26
44
30 31 31
44
41
3137
20
62
12
14
2528
37
1614
34
23
21
12
24
32
20
16
26
18
38
20
40
60
80
Foreclosure Sales
0
7/31 8/7 8/14 8/21 8/28 9/4 9/11 9/18 9/25 10/2 10/9 10/16 10/23 10/30 11/6 11/13 11/20 11/27
Short Sales Bank Owned
0%
10%
20%
30%
40%
50%
60%
7/31 8/7 8/14 8/21 8/28 9/4 9/11 9/18 9/25 10/2 10/9 10/16 10/23 10/30 11/6 11/13 11/20 11/27
Percentage of Sales
Bank Owned Short Sale Other
Page 11 of 16

Orlando Regional REALTOR® AssociationMonday Morning Quarterback - 11/27/2011 - 12/03/2011
Lake, Orange, Osceola & Seminole Counties
.
Condos, Townhomes, Villas
50
75
100
125
150
175
200
225
Average Days on Market
507/31 8/7 8/14 8/21 8/28 9/4 9/11 9/18 9/25 10/2 10/9 10/16 10/23 10/30 11/6 11/13 11/20 11/27
Listing to Contract Combined Days - Listing to Contract Listing to Closing
2,238
2,217 2,205 2,1992,144
2,180 2,173
2,2182,190
2,379 2,2522,233
2,2912,327 2,338
2,353 2,366
2,400
1,800
2,100
2,400
2,700
7/31 8/7 8/14 8/21 8/28 9/4 9/11 9/18 9/25 10/2 10/9 10/16 10/23 10/30 11/6 11/13 11/20 11/27
Total Actives
Period Average - 2,253
Change since Jan 3, 2011: - 38.13% (3,879)
Page 12 of 16

Orlando Regional REALTOR® AssociationMonday Morning Quarterback - 11/27/2011 - 12/03/2011
Lake, Orange, Osceola & Seminole Counties
.
Condos, Townhomes, Villas
10%
20%
30%
40%
50%
60%
70%
Percent of Actives
787743 733 731 683 711 714 733 703 684 698 693 701 715 715 734 728 742
146 147 168 150 157 156 159 150 159 172 179149
180
199 200 198 217
233
0
250
500
750
1,000
1,250
7/31 8/7 8/14 8/21 8/28 9/4 9/11 9/18 9/25 10/2 10/9 10/16 10/23 10/30 11/6 11/13 11/20 11/27
Active Foreclosures
Short Sales Bank Owned
0%7/31 8/7 8/14 8/21 8/28 9/4 9/11 9/18 9/25 10/2 10/9 10/16 10/23 10/30 11/6 11/13 11/20 11/27
Bank Owned Short Sales Other
Page 13 of 16

Orlando Regional REALTOR® AssociationMonday Morning Quarterback - 11/27/2011 - 12/03/2011
Lake, Orange, Osceola & Seminole Counties
.
Condos, Townhomes, Villas
14
26
29
10
16
11
1315
1113
18
1417
14
25
12
13
20
7 63
98
46
3
56
4 35
4
5
4 4 4
97
9
5
2
14
12
4
5 4
79
7 8
2
6
1412
-10
0
10
20
30
40
Temporary off Market
-107/31 8/7 8/14 8/21 8/28 9/4 9/11 9/18 9/25 10/2 10/9 10/16 10/23 10/30 11/6 11/13 11/20 11/27
Short Sales Bank Owned Other
3133 32
4036
30
36 35 36
20
68
4441
33
17
25
19
46
1
62
41
3 13
6
1 05
1
6
0
51
4
19 1922
1719
2630
32
2018
2123
2023
12
712
20
-20
0
20
40
60
80
7/31 8/7 8/14 8/21 8/28 9/4 9/11 9/18 9/25 10/2 10/9 10/16 10/23 10/30 11/6 11/13 11/20 11/27
Withdrawn
Short Sales Bank Owned Other
Page 14 of 16

Orlando Regional REALTOR® AssociationMonday Morning Quarterback - 11/27/2011 - 12/03/2011
Lake, Orange, Osceola & Seminole Counties
.
Condos, Townhomes, Villas
Short Sales, 30.92%
Bank Owned, 9.71%
Short Sales, 41.89%
9.71%
Other, 59.38%Actives
Bank Owned, 25.68%
Other, 32.43%
Sales
Page 15 of 16

Orlando Regional REALTOR® AssociationMonday Morning Quarterback - 11/27/2011 - 12/03/2011
Lake, Orange, Osceola & Seminole Counties
.
Zip
County / City
Seminole CountyAltamonte Springs (East)
Altamonte Springs / Forest City
Orange CountyConway
Williamsburg / Lake Bryan
Ventura
Waterford Lakes
Union Park / Chickasaw
Metro West / Orlo Vista
$67,000
6
32822
2.0
1
32828 1
32821
Where are the 13 Condos, Townhomes, and Villas available for the Median Price of $67,500?
List Price
Average
per SqFt
Average
SqFt
1,250
Available
1
2.5
Code
2.032701
$67,750$67,500
$56.29
Beds
Average
1,229
$60.171,118
2.0
2.0
$67,000
$67,250 1.8
2.03.0$68,000
Baths
32714
$55.13$54.00
2.0
List $
2
Average
1,208
2.23.0 2.032812 $47.62
1,013
$54.18
2.0
1,407
2.0
$68,000
$63.81
$66.14
$88.93
2.0 1,050
1,222
759
$54.83
2.0
32829
$67,000
1
1
1,255
2.0
1.01
$67,000
$67,500
2.0 2.0
1
1
32835Metro West / Orlo Vista
Osceola CountyKissimmee (West) / Pleasant Hill
Lake CountyTavares / Mt Plymouth
Clermont (Central)
Leesburg (West)
34746
2.0
$67,250
34748 3.0
1,319 $50.99$50.99
$63.812.0
2.3 1.7
1,050
1,319
1,119 $60.17
$39.62
6802.0
2.0
$68.462.0
$99.26
$67,000
2.0
3.0$67,250 3.0
1
2
32835
2.0
3
2
32778
1
$67,3332.0
1.034711
1,691
9861
$67,500
$67,500
1 $67,000
Page 16 of 16