Monday 7 - Tuesday 8 September 2015 · September 2015 Wagga Wagga RSL, Wagga Wagga, NSW. INCREASING...
92
18th Precision Agriculture Symposium Monday 7 th - Tuesday 8 th September 2015 Wagga Wagga RSL, Wagga Wagga, NSW. INCREASING THE ADOPTION OF PRECISION AGRICULTURE IN AUSTRALIA This event was made possible by the following partners @SPAA_EO #PASymposium1 5
Transcript of Monday 7 - Tuesday 8 September 2015 · September 2015 Wagga Wagga RSL, Wagga Wagga, NSW. INCREASING...

18thPrecisionAgriculture Symposium
Monday 7th - Tuesday 8th
September 2015Wagga Wagga RSL,
Wagga Wagga, NSW.
INCREASING THE ADOPTION OF
PRECISION AGRICULTURE IN AUSTRALIA
This event was made possible by the following partners
@SPAA_EO #PASymposium15

Welcome!
This gathering of the Australasian Precision Agriculture (PA) community in Wagga Wagga marks the 20th anniversary of the PA group at the University of Sydney. While the name has changed to the Precision Agriculture Laboratory (from the Australian Centre for Precision Agriculture), the group continues to work with other pioneering groups such as the Society of Precision Agriculture Australia Inc (SPAA), to provide excellent PA science and training, leading agricultural industries towards incorporating practical, sustainable precision agricultural management techniques.
Over those 20 years we have seen a long line of Australian innovators and pioneers in PA tackle this goal of improving agricultural management. GNSS vehicle navigation, reflectance-based weed detection, operational sensors, implements, software and analytical techniques are part of the legacy of this work. Today Australia remains at the forefront of the development of PA tools, and practical applications, due in no small part to our agricultural ingenuity and the unique range of production conditions.
And while the wider community, and some within the agricultural world, may not know the significant gains made along the way, the increased interest in food and soil security and awareness of global climate change impacts, provide a new opportunity to shine a spotlight on the benefits built by PA.
The big ticket benefits relating to optimising production efficiency and minimising business risk will rightly receive the most attention, but it is worth us espousing the potential benefits that the balance sheet approach to assessment has difficulty encompassing. These benefits may include:
increased speed of operations potential quality increase improved timeliness of operations options for commodity differentiation on quality improved ease and efficiency of operations
options for commodity tracking/preservation of provenance
work more hours/shift safely potentially reduced chemical storage and handling facilitating carbon auditing based on production variability
spatial recording of operations for future management use
reduced erosion potential spatial recording of operations to avoid litigation reduced environmental impact spatial recording of operations for insurance claims identifying areas for land-use change
increased farm enterprise value with spatial records
greater flexibility in use of labour increased peace of mind/management confidence
Let’s all explore how we can tell the myriad of good stories that PA brings to Agriculture.
We will all learn more of them at this Symposium, so please enjoy the unique interaction and inspiration that the event offers to all participants. Learn, Share, Connect and Be Inspired at the 18th Precision Agriculture Symposium in Australasia.
The PA Lab and SPAA teams
2015 Precision Agriculture Symposium 1

2015 Precision Agriculture Symposium2
Contents
Welcome!...........................................................................................................................
Presentation program ........................................................................................................
Positioning Australia for its farming future: Utilising the Japanese Satellite Navigation
System (QZSS) to deliver centimetre positioning accuracy across Australia .....................
Developments in proximal soil sensing ..............................................................................
Agricultural robotics and augmented decision systems .....................................................
Practical use of PA tools in precision pastoral management .............................................
SURCOMETRICS : precision soil science for plant performance (farm case studies of
furrow performance in PA) .................................................................................................
SPAA Project updates .......................................................................................................
Big picture detail on-farm ...................................................................................................
Is modern agriculture set for a big boost from UAVs? .......................................................
Remote sensing trends for high-resolution soil moisture monitoring: Exploring the
potential for farming and agriculture applications ..............................................................
Optimising precision systems in Queensland vegetable production ..................................
Quantifying yield variability of vegetable crops using load cell systems ............................
LiDAR, thermal and hyperspectral sensors for crop monitoring applications in PA ...........
PA for sustainable farming .................................................................................................
Big farms, big pictures, big solutions: the future of satellite imagery and UAVs in broad
acre farming .......................................................................................................................
Developments in on-harvester quality monitoring ..............................................................
Update on irrigation control, PA developments in sugar and augmented reality
information delivery ...........................................................................................................
Temperatures from Landsat 8: useful for PA decision-making? ........................................
Big ideas for using Data ....................................................................................................
2015 Precision Agriculture Symposium
1
4
7
14
15
17
21
23
27
31
37
41
48
54
61
62
66
73
76
84
3
2015 Precision Agriculture Symposium4
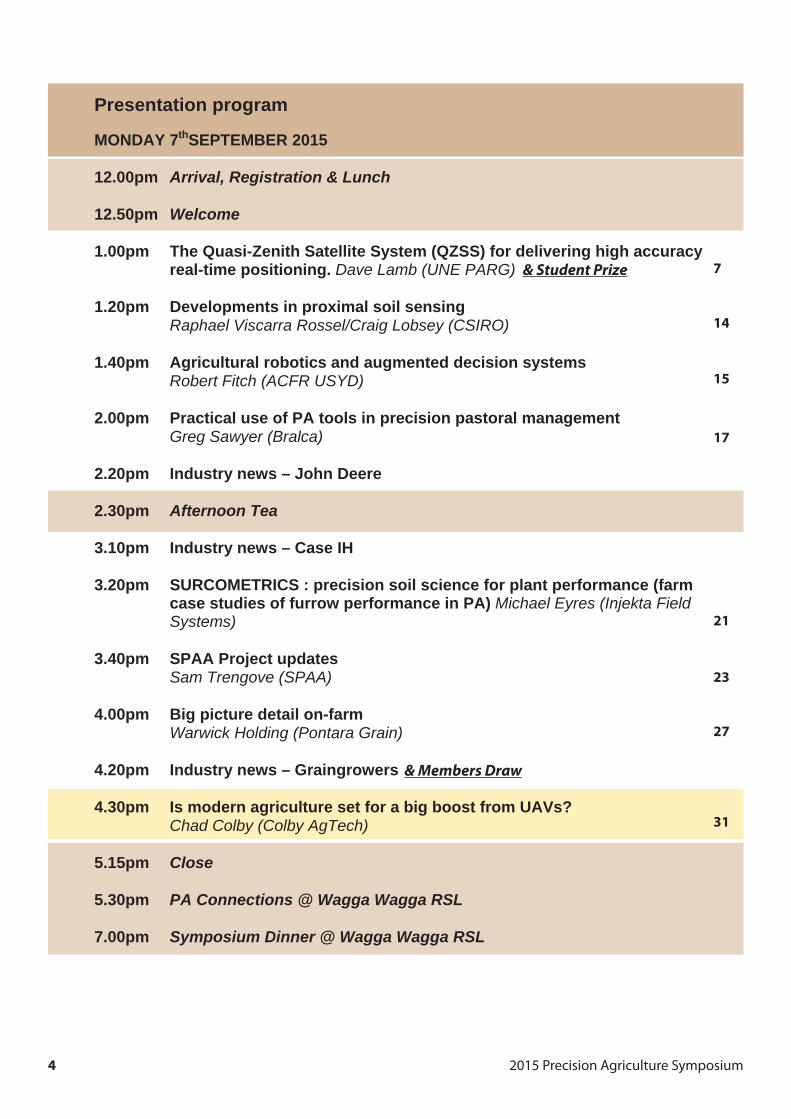
Presentation program
MONDAY 7thSEPTEMBER 2015
12.00pm Arrival, Registration & Lunch
12.50pm Welcome
1.00pm The Quasi-Zenith Satellite System (QZSS) for delivering high accuracy real-time positioning. Dave Lamb (UNE PARG)
1.20pm Developments in proximal soil sensing Raphael Viscarra Rossel/Craig Lobsey (CSIRO)
1.40pm Agricultural robotics and augmented decision systems Robert Fitch (ACFR USYD)
2.00pm Practical use of PA tools in precision pastoral management Greg Sawyer (Bralca)
2.20pm Industry news – John Deere
2.30pm Afternoon Tea
3.10pm Industry news – Case IH
3.20pm SURCOMETRICS : precision soil science for plant performance (farm case studies of furrow performance in PA) Michael Eyres (Injekta Field Systems)
3.40pm SPAA Project updates Sam Trengove (SPAA)
4.00pm Big picture detail on-farm Warwick Holding (Pontara Grain)
4.20pm Industry news – Graingrowers
4.30pm Is modern agriculture set for a big boost from UAVs? Chad Colby (Colby AgTech)
5.15pm Close
5.30pm PA Connections @ Wagga Wagga RSL
7.00pm Symposium Dinner @ Wagga Wagga RSL
7
14
15
17
21
23
27
& Members Draw
& Student Prize
31

TUESDAY 8th SEPTEMBER 2015
8.45am Welcome
9.00am Remote sensing trends for high-resolution soil moisture monitoring: Exploring the potential for farming and agriculture applications Alessandra Monerris-Belda (Monash University)
9.20am Optimising precision systems in Queensland vegetable production Ian Layden (QLD DAF)
9.40am Quantifying yield variability of vegetable crops using load cell systems Stephen Hegarty & Stephen Frahm (VNET Precision Farming)
10.00am LiDAR, thermal and hyperspectral sensors for crop monitoring applications in PA Jose Jimenez-Berni (CSIRO)
10.20am PA for sustainable farming Tim Neale (Precision Agriculture Pty Ltd)
10.40am Morning tea
11.20am Big farms, big pictures, big solutions: the future of satellite imagery and UAVs in broad acre farming Ben Boughton (Ag Maps Online )
11.40am Developments in on-harvester quality monitoring Phil Clancy (Next Instruments)
12.00pm NCEA update: PA developments in sugar, irrigation and augmented reality Steven Rees (USQ/NCEA)
12.20am Temperatures from Landsat 8: useful for PA decision-making? Ben Jones (PASource Pty Ltd)
12.40pm Big ideas for using Data Brett Whelan (PA Lab USYD)
1.00pm Evaluation, Close and Lunch
2015 Precision Agriculture Symposium 5
37
41
48
54
61
62
66
73
76
84

2015 Precision Agriculture Symposium6
FREE FUNCTIONALITY:
Digital farm mapping
Paddock record keeping
Grain storage record keeping
Paddock future planning
Grain contracts and sales management
Comprehensive operation, input and grain storage reporting
Auto-created vendor declarations
Receive recommendations from your connected adviser
5-day historical weather summary
KEY POINTS:
Free data entry tools Provided to help improve the efficiency of our farmers
Data security Hosted in GrainGrowers own secure cloud and never sold to 3rd parties
Developed by GrainGrowers Australia’s peak grains industry body
Mobile App Available from the Apple and Google Play app stores
FREECALL 1800 620 519
“I have not come across anything nearly this sophisticated in
my 15 years in weather risk management – on 3 continents!”
Norman Trethewey WILLIS AUSTRALIA LIMITED
“ProductionWise provides superior management tools
and analytics which drives our decisions and farm profitability.”
Linda Eldredge ELDREDGE & ASSOCIATES
“After 3 years using the ProductionWise system and the
APSIM model, I am confident ProductionWise provides
accurate yield forecasts.” Steve Todd
AGRONOMY PLUS LIMITED
AUSTRALIA’S MOST POWERFUL DECISION SUPPORT PLATFORM
Positioning Australia for its farming future: Utilising the Japanese Satellite Navigation System (QZSS) to deliver centimetre positioning accuracy across Australia
David Lamb1,2, Phil Collier1
1Cooperative Research Centre for Spatial Information, Carlton, Victoria 3053 2Precision Agriculture Research Group, University of New England, Armidale NSW 2351
Contact: [email protected]
Farm businesses need accurate positioning to realise many economic benefits of precision agriculture The 2010-11 Agricultural Census found that there were 135,000 farm businesses across Australia. The majority of these were involved in specialised beef cattle farming (28%), mixed grain-sheep or grain-beef cattle farming (9%), other grain growing (9%) or specialised sheep farming (8%). The total area of agricultural land in Australia in 2011 amounted to 410 million hectares, 53% of the nation’s landmass. Agriculture is a major contributor to the Australian economy. The value of agricultural production in Australia in 2010-11 was $46 billion, with the value added by the agriculture industry accounting for 2.4% of GDP. Reports by Allen Consulting (2008) and Acil-Allen (2012) forecast significant growth in the economic contribution of the agriculture sector through access to a coordinated national positioning infrastructure.
For many farmers actively embracing precision agriculture (PA), a reliable ~ 2-5 cm positioning capability is an important part of their business. Over the past 10 years research has shown a range of economic, environmental and social benefits follow from the adoption of this aspect of PA. These are particularly true in the context of controlled traffic farming (CTF) where the in-field operation of agricultural machinery is controlled autonomously to follow the same wheel tracks for every phase of the cropping process. Bowman (2008) and Yule et al., (2013) document the many benefits including improved safety, increased production, reduced inputs, less fuel consumed, less CO2 emissions, improved workflow and reduced operator fatigue.
How do we realise 2-5 cm positioning accuracy with GPS? The use of the global navigational satellite systems (GNSS - or its better known sub-group GPS) to position our machines (or at least the GNSS/GPS receiver on our machines) relies on determining the range (distance) between the receiver and a minimum of four orbiting satellites whose positions are accurately known. Spatial intersection of these distances is used to derive the 3D location of the receiver. This is a challenging process. To put it into perspective, to achieve 2-5 cm positioning accuracy, the distance to each satellite, which is more than 20,000 km away, must be determined to an accuracy of better than 2 cm.
GNSS receivers determine the range to a satellite by comparing an internally generated pseudo-random noise code with an identical code with a wavelength of approximately 300 m, coming from the satellite. Ignoring errors, the delay between the receiver’s code and that arriving from the satellite is a simple function of the range between the two.
2015 Precision Agriculture Symposium 7
2015 Precision Agriculture Symposium8
Errors impacting on these code measurements can cause the positioning accuracy to be in the order of several metres for a receiver operating autonomously, which is well short of what is needed for PA. Even differentially corrected code-based positioning, delivering accuracies of 1-2 m is not sufficient to realise the benefits of CTF.
Accuracy can be substantially improved by not using code measurements but rather measuring on the carrier wave on which the code is transmitted. The wavelength of the carrier signal is approximately 20 cm. Significant improvements in ranging, and hence positioning accuracy, can be achieved by determining the exact (integer) number of carrier cycles between the satellite and the receiver antenna. Receivers measure the fractional part of the incoming carrier signal, they cannot measure the number of full cycles. This so-called “integer ambiguity” must be derived mathematically and poses a significant computational challenge (Laurichesse et al., 2009). Resolving this integer ambiguity is a fundamental pre-requisite for centimetre level positioning accuracy. Doing so in real-time and with rigour and reliability is the ‘holy grail’ of satellite positioning.
In addition to the ambiguity resolution problem, there are a number of physical errors impacting on the measurement process, including satellite orbit and clock errors and atmospheric delays from both the ionosphere and the troposphere. An effective method of correcting for many of these errors is to use a nearby stationary base station as a reference point relying on the implicit assumption that the base and the rover receivers are subject to similar errors which then cancel out in the differential (carrier-phase) solution. This assumption holds when the base and the rover are relatively close together (10-15 km), but begins to break down over larger distances as the common errors de-correlate in spatial terms. In operational terms, this single base (RTK) approach may fail when a base station is servicing the needs of a region rather than a single farm.
A further limitation of the private base-station approach is that the user (e.g. the farmer or the cooperative organisation) assumes the material and financial risks associated with the purchase, maintenance and operation of the base station and the associated communications link that delivers the correction message to the rover.
A solution to the limitations of the single-base RTK approach is to deploy an array of Continuously Operating Reference Stations (CORS) at known locations and to operate the rover(s) within the confines of the area covered by the network. This approach is known as Network RTK (NRTK) and allows users to be several tens of kilometres from the nearest base station and still achieve centimetre accuracy in real-time. The real-time function of NRTK relies on a stable and reliable communications infrastructure to deliver the correction message from the network analysis centre to the rover. Most commonly, this is done using terrestrial (not satellite) communication channels exploiting the mobile phone network. While an attractive solution in many circumstances, the main disadvantages of NRTK in a PA context are its reliance on a dense (say 70 km spacing) CORS network and access to high speed mobile internet. These requirements sometimes inhibit NRTK adoption, particularly in the more remote parts of the country. An alternative to RTK and NRTK is a positioning methodology known as Precise Point Positioning (PPP). PPP is an enhanced single point (autonomous) positioning technique that, instead of relying on the cancellation of spatially correlated errors using
2015 Precision Agriculture Symposium 9
nearby base stations, employs enhanced physical models for the satellite orbits, clocks and other satellite biases, in addition to a complex model for the influence of the ionosphere and troposphere.
While PPP and its many variants dramatically reduce dependence on a CORS network, the practical cost is slowness in solution ‘convergence time’. It can take several tens of minutes and sometimes one to two hours for a PPP solution to achieve accuracies equivalent to NRTK. This slow convergence is a by-product of the external errors hindering the resolution of the integer ambiguities. Time is generally needed to overcome this problem.
The middle ground is to mix the PPP and NRTK approaches to overcome their respective limitations and capitalise on their advantages. This hybrid approach is known as PPP-RTK. PPP-RTK brings some level of reliance on a CORS network which allows the external error models to be more finely tuned to local needs (e.g. variations in the local atmospheric conditions). The enhanced error modelling allows a faster and more reliable determination of the integer ambiguities, allowing the PPP-RTK solution to converge in a much shorter time compared to conventional PPP. Thus the PPP-RTK approach has the same “look and feel” as NRTK, but is delivered off a much sparser ground infrastructure. Several technical challenges remain in the operational implementation of PPP-RTK, but in a PA context the reduced reliance on a CORS network is an advantage that resonates in remote and regional parts of Australia.
The remaining challenge is delivering the PPP-RTK correction message to remote users, and thereby decoupling them from dependence on the mobile phone network.
Delivering a precise positioning augmentation message across Australia requires a satellite-based communications infrastructure to deliver correction signals. Presently only 9% of the country is served by NRTK positioning services, leaving users in remote parts of the country to either build, operate and maintain their own ad hoc system (i.e. run their own RTK base stations) or to continue working without the gains and benefits real-time precise positioning can provide. To overcome the significant barriers to adoption that emerge in a vast and sparsely populated country like Australia, an alternative mode of positioning is required and the delivery mechanism of any precise positioning capability must be made uniformly and consistently available.
Japan’s Quasi-Zenith Satellite System (QZSS) is a regional Satellite Based Augmentation System for the Global Positioning System. The first QZSS satellite 'Michibiki' was launched on 11 September 2010 and is now fully operational. In February 2015, Japan's Cabinet Office announced the expansion of QZSS to a four satellite constellation by 2018 and a seven satellite system by 2023. The primary purpose of QZSS is to increase the availability of satellite positioning in Japan's major cities, where only satellites at high elevation can be routinely seen. A secondary function is to deliver augmented positioning services to enhance accuracy and reliability of satellite derived navigation solutions. The QZSS LEX signal (L-band Experimental) offers the capability to deliver a PPP augmentation message to users within the QZSS service region. It is important to appreciate that, due to their orbital configuration, QZSS satellites spend a significant proportion of their time over Australia. When fully operational, QZSS LEX will provide national 24 hour coverage. Coupling QZSS LEX with the emerging capabilities of PPP-RTK could deliver real-time centimetre accurate
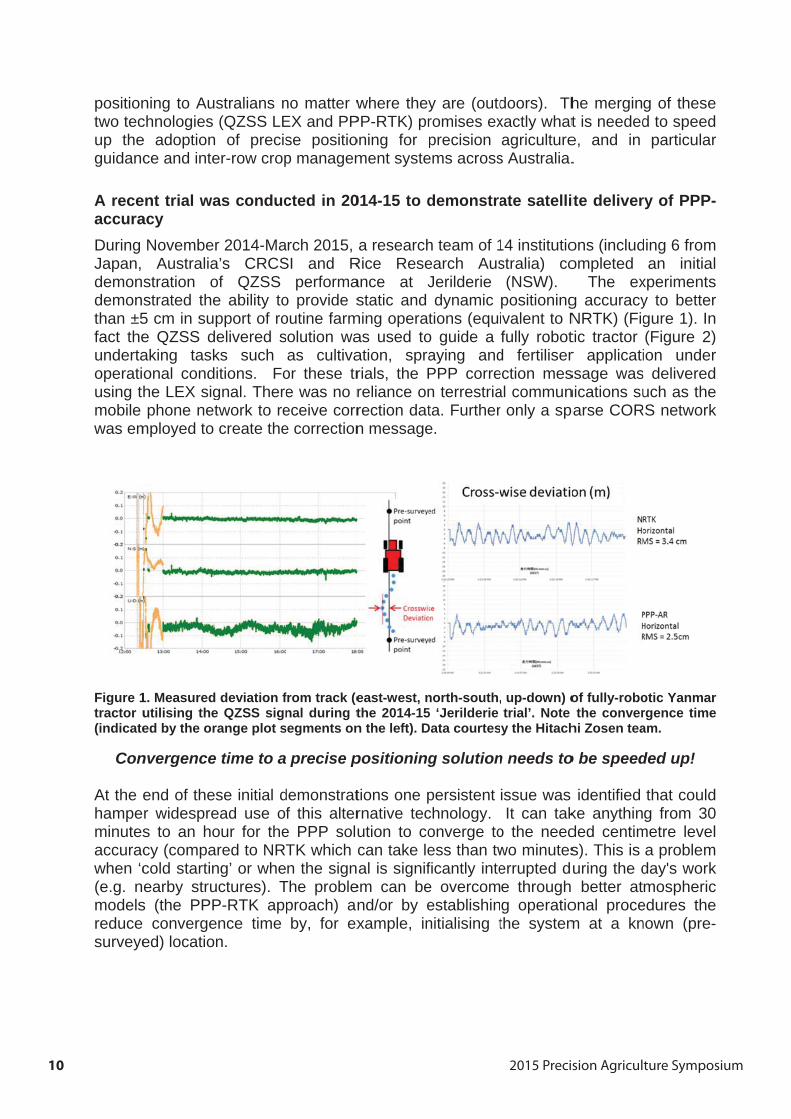
2015 Precision Agriculture Symposium10
positiontwo tecup theguidanc
A receaccuraDuringJapan,demondemonthan ±5fact theundertaoperatiusing tmobilewas em
Figure 1tractor u(indicate
Con
At the ehampeminutesaccuracwhen ‘c(e.g. nmodelsreducesurveye
ning to Auchnologies e adoptionce and inte
ent trial waacy
NovembeAustralia
stration ostrated the5 cm in sue QZSS daking taskonal condhe LEX sigphone ne
mployed to
1. Measuredutilising theed by the or
nvergence
end of ther widespres to an hocy (compacold startinearby stru
s (the PPP convergeed) locatio
stralians n(QZSS LE
n of preciser-row crop
as conduc
r 2014-Maa’s CRCSof QZSS e ability topport of ro
delivered sks such itions. Fognal. Theretwork to recreate the
d deviation fe QZSS signrange plot s
e time to a
ese initial dead use oour for theared to NRng’ or wheuctures). TP-RTK apence time n.
no matter wEX and PPse positiop managem
cted in 20
arch 2015, SI and R
performao provide soutine farmsolution waas cultiva
or these tre was no receive corre correction
from track (enal during t
segments on
precise p
demonstratf this alter
e PPP soluTK which cn the sign
The probleproach) anby, for ex
where theyPP-RTK) proning for ment syste
014-15 to d
a researchRice Reseance at Jstatic and
ming operatas used toation, sprarials, the Preliance onrection datn message
east-west, nthe 2014-15n the left). D
positioning
tions one prnative tecution to cocan take leal is signif
em can bend/or by example, in
y are (outdromises exprecision
ems across
demonstra
h team of 1earch AusJerilderiedynamic
tions (equio guide a aying andPPP corren terrestriata. Furthere.
north-south,5 ‘Jerilderie Data courtes
g solution
persistentchnology. onverge toess than twficantly intee overcomestablishinnitialising t
doors). Thxactly whatagriculture
s Australia.
ate satelli
14 institutiostralia) co(NSW).
positioningivalent to Nfully robot
d fertiliserection mesal communr only a sp
, up-down) otrial’. Note y the Hitach
n needs to
issue was It can tak
o the needwo minuteserrupted de through g operatiothe system
he mergint is needede, and in .
ite deliver
ons (includompleted The ex
g accuracyNRTK) (Figtic tractor r applicatissage wasnications suparse COR
of fully-robothe conver
hi Zosen tea
o be speed
identified ke anythinded centims). This is uring the d better at
onal procem at a kn
g of thesed to speed
particular
ry of PPP-
ding 6 froman initial
xperimentsy to bettergure 1). In(Figure 2)ion under
s delivereduch as the
RS network
otic Yanmarrgence timeam.
ded up!
that couldg from 30
metre levela problemday's workmospheric
edures thenown (pre-
edr
-
ml
srn)rdek
re
d0l
mkce-
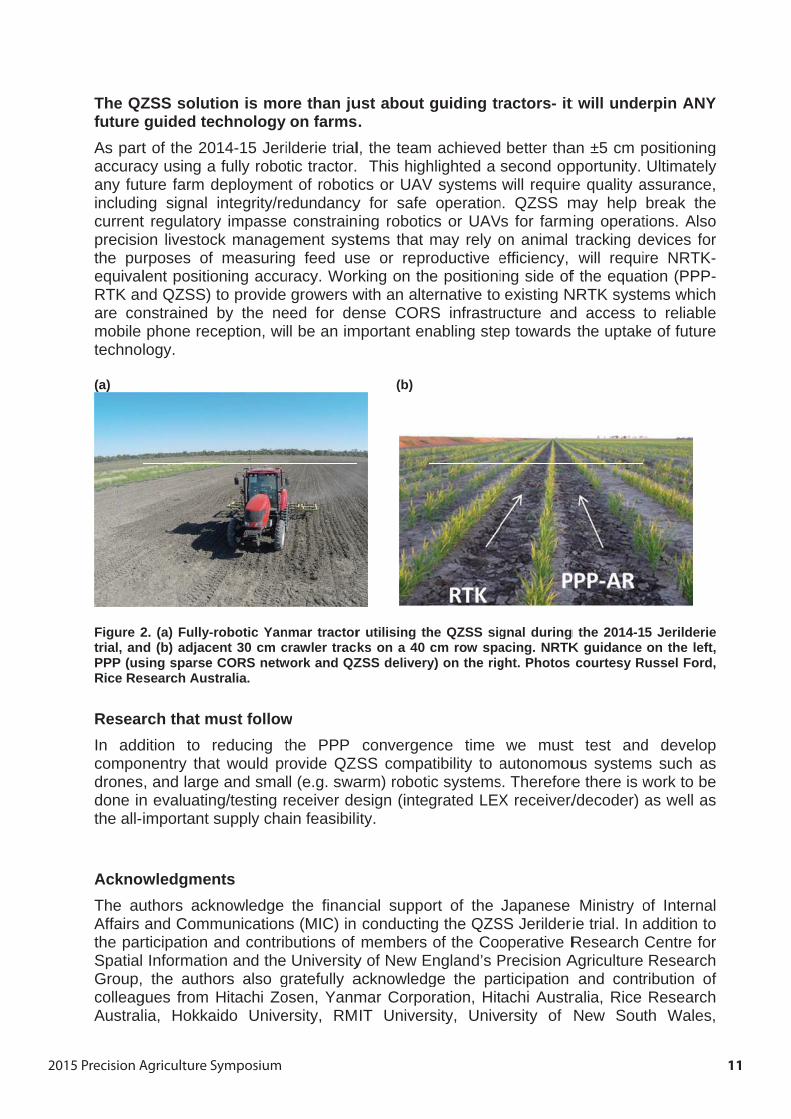
2015 Precision Agriculture Symposium 11
The QZfutureAs partaccuracany futincludincurrentprecisiothe puequivalRTK anare comobile techno
(a)
Figure 2trial, anPPP (usRice Re
ResearIn addcompodronesdone inthe all-
AcknowThe auAffairsthe parSpatialGroup,colleagAustral
ZSS solutguided tet of the 20cy using ature farm dng signal t regulatoryon livestocrposes of lent positiond QZSS) nstrainedphone reclogy.
2. (a) Fully-rd (b) adjace
sing sparse search Aus
rch that mdition to rnentry tha, and largen evaluatinimportant s
wledgmenuthors ackand Comm
rticipation a Informatio the autho
gues from ia, Hokka
tion is mochnology
014-15 Jeria fully robodeploymenintegrity/rey impasseck manage
measurinoning accuto provideby the ne
ception, wi
robotic Yanent 30 cm cCORS netwtralia.
must followreducing t
at would pre and smang/testing rsupply cha
ntsknowledgemunicationand contribon and theors also gHitachi Zo
aido Unive
ore than juon farms
ilderie trialotic tractor.nt of robotiedundancye constrainement systg feed us
uracy. Wor growers w
eed for dell be an im
nmar tractorcrawler trackwork and QZ
wthe PPP rovide QZSll (e.g. swareceiver deain feasibili
the financs (MIC) in butions of University
gratefully aosen, Yanmersity, RM
ust about .l, the team This highcs or UAV
y for safe ing robotictems that se or reprrking on thwith an alteense COR
mportant en
(b)
r utilising thks on a 40 ZSS delivery
convergenSS compaarm) robotiesign (inteity.
cial suppoconductinmembers
y of New Eacknowledgmar CorpoIT Univer
guiding tr
m achievedhlighted a V systems
operationcs or UAVmay rely oroductive ee positioniernative to
RS infrastrunabling ste
he QZSS sigcm row spay) on the rig
nce time atibility to aic systemsgrated LEX
ort of the ng the QZS
of the CooEngland’s Pge the pa
oration, Hitrsity, Univ
ractors- it
better thasecond opwill require
n. QZSS mVs for farmon animal efficiency,ing side ofexisting N
ucture andep towards
gnal duringacing. NRTKght. Photos
we mustautonomou
s. ThereforeX receiver/
Japanese SS Jerilderoperative RPrecision Articipation
tachi Austrersity of
t will unde
an ±5 cm ppportunity. re quality amay help ing operattracking dwill requi
f the equatNRTK systed access the uptak
g the 2014-1K guidance courtesy R
t test andus systemre there is wr/decoder)
Ministry orie trial. In aResearch Agriculture
and contralia, Rice New Sou
erpin ANY
positioningUltimately
assurance,break the
tions. Alsodevices forire NRTK-tion (PPP-ems whichto reliablee of future
5 Jerilderieon the left,
Russel Ford,
d develops such aswork to beas well as
of Internaladdition toCentre forResearch
ribution ofResearchth Wales,
Y
gy,eor--hee
e,,
pses
lorhfh,
2015 Precision Agriculture Symposium12
Precision Agriculture.com, Japanese Aerospace Exploration Agency, The Australian Government Department of Industry, SmartNet Australia Ltd and C.R. Kennedy Pty Ltd.
References Acil Allen (2013). Precise positioning in the agricultural sector- An estimate of the economic and social
benefits of the use of augmented GNSS services in the agricultural sector. 17 pp. Allen Consulting (2008). Economic benefits of high resolution positioning services- Final Report. 51 pp. Bowman, K. (2008) Economic and environmental analysis of converting to controlled traffic farming.
Proceedings 6th Australian Controlled Traffic Farming Conference, 12 – 14 August, Dubbo, New South Wales, 62-68.
Grinter, T. and Roberts, C. (2013). Real time precise point positioning: Are we there yet? International Global Navigation Satellite Systems Society IGNSS Symposium, Gold Coast, Qld, Australia.
Laurichesse, D., Mercier, F., Berthais, J.P., Broca, P., Cerri, L. (2009). Integer ambiguity resolution on undifferenced GPS phase measurements and its application to PPP and satellite precise orbit determination, Navigation 56(2): 135-149.
Yule, D, Thomas, E., Yates, K., Harper, P. (2013) SIARA – Spatial Information Applications in Rural Australia. Cooperative Research Centre for Spatial information Final Report (CRCSI: Australia), 55 pp.
2015 Precision Agriculture Symposium 13
If soil conditions often make short planting and harvesting windows even shorter, the
new Case IH Magnum Rowtrac can help you start sooner, work longer and enjoy higher
yield potential. Its agronomic design means reduced compaction and a better growing
environment for your crops. To find out more about this revolution in track technology,
visit www.caseih.com or talk to your local Case IH dealer.
BETTER FLOTATION. IMPROVED MANOEUVRING. MORE FLEXIBILITY.
Case IH Australia
2015 Precision Agriculture Symposium14
Developments in proximal soil sensing
Craig Lobsey, Raphael A. Viscarra Rossel CSIRO Land and Water
Contact: [email protected]
Proximal soil sensing (PSS) provides rapid and low cost soil measurements and can therefore satisfy the soil information requirements of Precision Agriculture (PA). Sensors can be used to acquire spatial and temporal data on soil attributes that affect crop growth, e.g. nutrients, water, pH, texture.
The high resolution and detailed measurements enabled by PSS can be used independently, or combined with crop and remote sensing to enable site specific management of the soil (e.g. variable rate fertiliser and lime application), crop (e.g. variable rate seeding and optimized irrigation) as well as constraints to crop growth (e.g. sodicity and compaction).
Current PSS techniques can be classified by the type of measurement (invasive [insitu or exsitu] or noninvasive), the source of energy (active or passive), their operation (stationary or mobile) and specificity (direct or indirect measurements). Although there are many commercially available sensors for stationary insitu measurement of soil water, there are few offtheshelf platforms for direct measurement of soil properties (e.g. the Veris MSP for soil pH) and optical measurement), and fewer still for measuring soil nutrients.
Many of the commercially available sensing techniques that are commonly used in PA, such as electromagnetic induction (EMI) and gamma radiometrics, provide rapid and onthego measurements of bulk soil properties, such as soil electrical conductivity or elemental potassium. The sensors are useful for characterising soil variability and delineating management zones. However sensors for direct measurement of important agronomic properties, such as plant available nutrients, are missing.
In this presentation we will provide a review of PSS, existing technologies and those that are in development. We will also provide snapshots of work towards the development of a proximal soil nutrient sensing system and a system for measuring soil carbon.
2015 Precision Agriculture Symposium 15
Agricultural robotics and augmented decision systems
Robert Fitch, Salah Sukkarieh Australian Centre for Field Robotics, The University of Sydney
Contact: [email protected]
SummaryThe Australian Centre for Field Robotics (ACFR) at The University of Sydney is one of the largest field robotics groups in the world and is recognised as one of the leaders in agricultural robotics research. We conduct research using both ground and aerial robots that is helping to shape the future of farms.
Over the last five years there has been a rapidly growing interest in the use of automated machinery and software processes amongst various agricultural and environment groups. The farm of the future will likely involve a 'system of systems' where teams of relatively small robots and sensors work together to collect information and perform mechanical tasks.
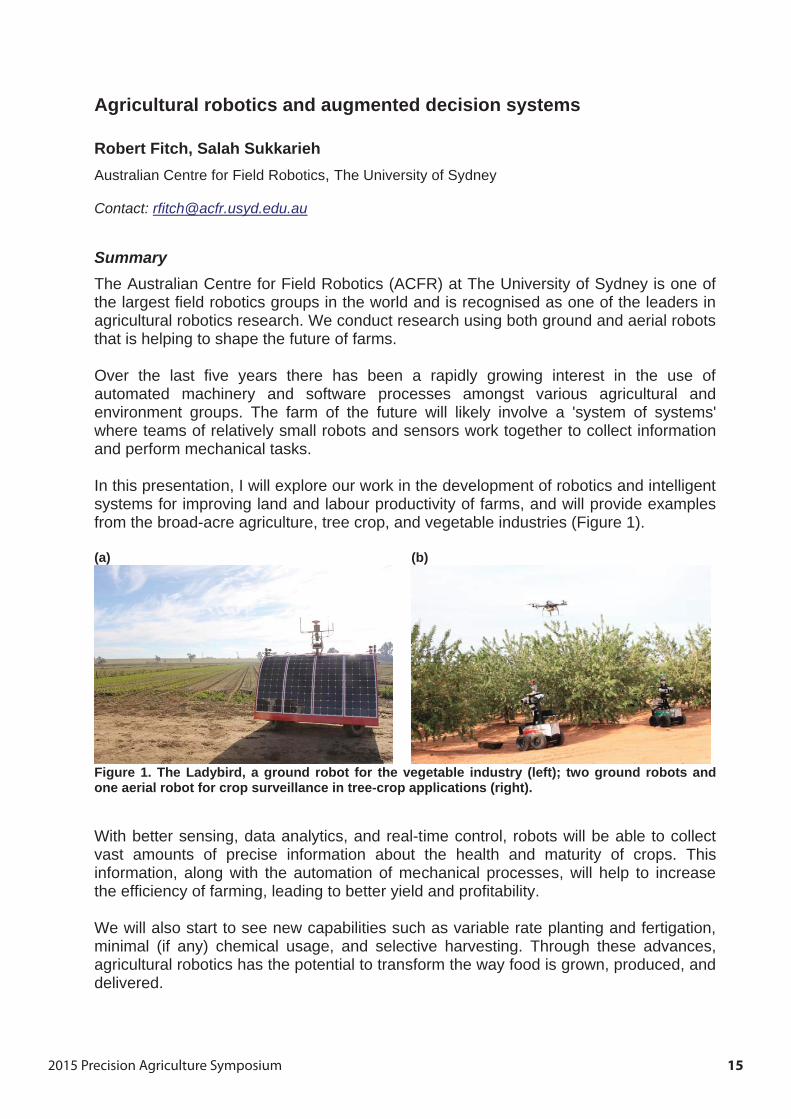
In this presentation, I will explore our work in the development of robotics and intelligent systems for improving land and labour productivity of farms, and will provide examples from the broad-acre agriculture, tree crop, and vegetable industries (Figure 1).
(a) (b)
Figure 1. The Ladybird, a ground robot for the vegetable industry (left); two ground robots and one aerial robot for crop surveillance in tree-crop applications (right).
With better sensing, data analytics, and real-time control, robots will be able to collect vast amounts of precise information about the health and maturity of crops. This information, along with the automation of mechanical processes, will help to increase the efficiency of farming, leading to better yield and profitability.
We will also start to see new capabilities such as variable rate planting and fertigation, minimal (if any) chemical usage, and selective harvesting. Through these advances, agricultural robotics has the potential to transform the way food is grown, produced, and delivered.

2015 Precision Agriculture Symposium16
High performanceLow operating cost
Five exclusive S-Series features that drive more value from harvesting:– The single rotor design is simple and reliable with few moving parts
which means lower power consumption.
– NEW: Active Concave Isolation automatically adjusts the clearance to handle heavy, dense crops without overloading the rotor.
– Powerful residue management which distributes straw across the entire chopper width to ensure high steady chopping quality and even distribution.
– Less maintenance: The S-Series combines are really easy to maintain. In fact, there are no daily grease points.
– ProDrive™ Transmission gives a real boost to performance: Higher torque across the whole speed range means better performance in muddy or hilly conditions.
JohnDeere.com.au
* Conditions apply. Finance available through John Deere Financial Limited to approved commercial applicants only. Offer is based on 30% deposit, GST back and 4 annual payments for John Deere Financial customers having a current Finance Contract with John Deere Financial. Fees and charges apply. If not amended or withdrawn earlier, the promotion expires on 31/10/2015. Other terms and rates are available.
2015 Precision Agriculture Symposium 17
Practical use of PA tools in precision pastoral management
Ben Watts Bralca
Contact: [email protected]
Summary o The ongoing pressure to realise productivity increases and labour efficiency
has challenged the thinking of precision agriculture in the grazing industry. o The team at Bralca has worked with new technologies over the past ten years
to trial, and where appropriate, embed these tools within established operations.
o A range of technologies have been applied to provide a mix of planning, operational and monitoring applications with high accuracy and reduced labour requirements.
o By working differently, not harder, it has been found that our system can improve return on investment in both intensive and pastoral zones with investments under $50,000 per farm.
The use of electronic identification (EID) of individual animals in both cattle and sheep linked to their life long performance and traits has long been understood as valuable technology, the linking of this established system to our pedigree match maker (PMMM)stations which automatically link animals with their progeny is one tool that has changed the shape of things in the paddock. Alongside (PMMM) we also utilise panel readers and weigh systems to run awl over weighing (WOW) which collects weights from animals walking over a remote platform situated near a water point or dry lick station. By collecting and monitoring ongoing individual animal weights, one can track weekly weight gains without the cost (financial and production) of removing animals from their grazing area for weighing. This system has shown to be of great use in both growing seasons when one is planning the turn off date of stock, but also in non growing seasons when managing breeding females to maintain body weight is critical. Within Bralca clients, the cost per record collected is in the range of $0.02-$0.05. For producers only collecting one or two records manually throughout the year this cost was in the range of $0.22-$0.35
The use of ultrasound pregnancy testing at early stages has proven to be a tool of great merit across our livestock industries. Bralca has worked mainly with cattle and sheep producers in the identification of pregnancies at 42 days. This allows management decisions to be made for those pregnant animals, whilst identifying animals with lower fertility to be removed from the breeding herd and finished for sale to provide cash-flow for the business. By repeatedly selecting animals which fall pregnant in their first two cycles of joining, it has been demonstrated that significant lifts in fertility can be made within the first 3 years.
In sheep flocks in NSW, Vic and SA gains of 30% lambing were observed whilst Northern QLD cattle operations have reported 20% gains over their 3 year period. Bralca provides training for producers to understand the use of ultrasound within their own business. Over the past 3 years we have trained over 220 growers who now use
2015 Precision Agriculture Symposium18
their own equipment to accurately scan animals at the time that suits them without the costs of contract scanners.
Automatic weigh boxes and scanning crates have been utilised to improve animal throughput for weighing and scanning, these units are best utilised across a number of sites so have been customised to be transportable. The crates allow for safe handling of individual animals, safe procedures for the operator, automatic collection of EID's and weight along with the drafting and recording of pregnancy status etc has increased the efficiency of operations but also ensured that valuable data is collected at each use.
UAV's (Drones) have been trialled in our operations over the past 2 years. These units are now used on a weekly basis for the monitoring of water, pastures, fence lines, crop areas and native vegetation areas.
Early work with UAVs showed great opportunity for live surveillance in rural and remote areas, however with limited automation those early systems provided little in the way of labour efficiency. Bralca has worked to become the leader in UAV systems to to provide reliable, repeatable high quality monitoring imagery using an innovative combination of leading hardware, user-friendly software and producer focused training to empower growers to operate their own systems on farm at the time to suit them day or night rather than rely on service providers.
The use of UAVs for monitoring water points, streams and livestock movement has provided additional information to growers once the imagery was reviewed. This included the change in pasture composition and density not seen from on the ground, but also the movements of stock whilst in their undisturbed sate grazing. Further work is now being undertaken in the use of UAV's for the monitoring and control of feral pests such as wild dogs and pigs.
The cropping and intensive pasture production sector has shown a real application for NDVI imagery providing information on crop health. With the use of a simple NDVI camera live reporting can be obtained to assist with informed realtime decision making. The next step in this journey has been the use of multi spectral sensors which can identify a range of specific features from moisture stress in broad acre crops, disease in stress in horticulture or viticulture crops through to specks such as blight in potato crops.
Grower applications from industry has been the driver behind this and team Bralca is continuing to create platforms that can accurately monitor our production areas. With the ability to map crops to a resolution of 1 pixel per square cm, this new level of equipment provides growers with the ability to monitor their operations at times suited to them, but more importantly it empowers the producer in remote areas to have an extra set of eyes in the sky to assist them spend their time where it is most beneficial.
Multi copters have proven to be of use in intensive operations such as monitoring of lambing ewes and calving heifers or checking water points with high clarity within areas of 100ha per flight. For larger scale operations we have used plane UAVs which provide the ability for flight distance up to 120kms or crop mapping up to 200ha per flight. Modelling of this system has shown a benefit for a pure livestock business using a UAV

2015 Precision Agriculture Symposium 19
for weekly water runs, reducing labour costs and prolonging the life of vehicles on the farm.
As growers begin to utilise their UAV in other applications such as monitoring livestock, pests and crop or pasture growth we see the real value of these units. Costs of a unit will depend on the individual operation, as a guide costs of $8.00- $12.00 per hour of flight or $0.05-$0..08 per ha monitored.
Bralca is running information courses across Australia to assist grower groups to understand and explore opportunities for the use of grower operated UAVs in their own production business. It has been the collection, management and reuse of data that is shining through as the point at which precision management within livestock business' finds its real value proposition.
For more information contact Team Bralca (www.bralca.com)
2015 Precision Agriculture Symposium20
2015 Precision Agriculture Symposium 21
SURCOMETRICS : precision soil science for plant performance (farm case studies of furrow performance in PA)
Michael Eyres, Edward Scott, Injekta Field Systems. Kent Town. South Australia.
Contact: [email protected]
AbstractSurcometrics – The science of planted furrow performance.
Evidence has emerged that conservation tillage is producing unintended consequences for soil at the paddock level. This includes the physical and chemical alteration of soil down through the soil profile, leading to new constraints for plant growth and crop yield. But perhaps more importantly, is the evident lack of industry focus on soil and complacency towards soil management, leading to a ‘blind spot’ in the farmers land management toolkit.
Soil is often now being cultivated (and fractured) to greater depth with conservation tillage than previously in conventional tillage systems where historically many tillage passes worked the soil more vigorously to a shallower depth. This is the case, certainly with knife edged tillage, using tractors with far more horsepower per tyne than ever before. This deeper tillage can lead to soil disturbance and compaction (Zhang et al. 2007), which can have positive or negative consequences depending on the soil type and condition.
The focus of some farmers is now turning back to soil management as the base of agricultural production and as a key indicator to land management performance (Valzano et al. 2005). Outlined below is a soil management tool that is being used as part of this approach.
Surcometrics is the use of individual and inter-related factors (inherent and dynamic) related to soil condition – chemical, physical and biological, soil nutrient availability and nutrient uptake potential as effective reference points for the improvement of crop productivity in individual and varying soil types. (SUE). Surcometrics is effectively an in-furrow based interpretation of soil condition and land suitability (capability) to generate field information powerful enough to effect net farm productivity.
‘SurcoMetrics’ (The science of planted furrow performance), is a term derived from the Spanish word for furrow (Surco) and the word “Metrics” which is the English word used to describe the standards of measurement by which efficiency, performance and progress can be measured and assessed. The soil science involved in comprehension of how soil condition relates to plant productivity needs to be considered by farmers far more comprehensively than in the past if conservation tillage systems are to advance. The best intervention point for plant production is as tillage implements are used to sow. Sowing equipment can be used and simply modified in a strategic manner that is suitable to soil type and soil condition, in order to capitalize on this point of intervention to manage soil conditions for plant performance and soil potential. The approach replaces the current “plants down” approach to soil management or soil adaptability with
2015 Precision Agriculture Symposium22
a “soil –up” approach that is key to further progressing agricultural productivity. This is the focus point of Surcometrics.
Many cropping systems are utilizing variable rate nutrient applications (nitrogen and phosphorus) across landscapes according to soil types. However, little consideration is given to the condition of the soil down the soil profile. When conservation tillage practices are applied to a management system the Surcometrics approach provides insight into what is known as a Vertical Rate guideline. This effectively incorporates the impact of the individual soil horizons on plant accessible water and nutrients (including oxygen and carbon dioxide).
Surcometrics is already being utilized in management strategies throughout Australian cropping systems. This has been evident in many forms and individual applications of the concept. These approaches are being proven on a case by case basis to improve soil performance, and in turn, increasing plant productivity.
Acknowledgements Peter Kitschke, Leeton Ryan, Ross Fisicaro and Hugh Ball
References
Koch et al., 2015. Monitor soil degradation or triage for soil security: an Australian paradox? Sustainability, 7, 4870-4892; doi:10.3390/su7054870.
2015 Precision Agriculture Symposium 23
SPAA Project updates
Sam Trengove1, Stuart Sherriff1, Nicole Dimos2, Hermann Leithold3, Steffen Müller3, Nick Poole4, Michael Straight4, Tracey Wylie4, Sarah Noack5, Peter Hooper5
1Trengove Consulting, 2Society of Precision Agriculture Australia, 3Agricon, 4Foundation for Arable Research Australia, 5 Hart Field Site Group
Contact: [email protected]
IntroductionSPAA is involved in several collaborative research projects. Two of these projects are
o The H-Sensor: a weed ID and mapping system o Management strategies for improved productivity and reduced nitrous oxide
emissions
This presentation will provide results generated to date from these projects.
The H-Sensor: a weed ID and mapping system Site specific weed management (SSWM) has the potential to deliver significant improvements in weed control efficiency, through the targeted application of weed control measures only to where the weeds are located. Improvements in weed control efficiency will typically be achieved through reduced herbicide usage where herbicide is not required. A key component of SSWM is to correctly identify the weed and its location.
Presently, the only commercial weed sensors are spot spray systems that are only for use in fallow situations, where all green plants are considered weeds and sprayed, such as the Weedseeker and WEEDit systems. However, numerous groups around the world have been working on sensing systems that can identify different weed species within a growing crop, including several groups in Australia, however there are no commercially available products yet.
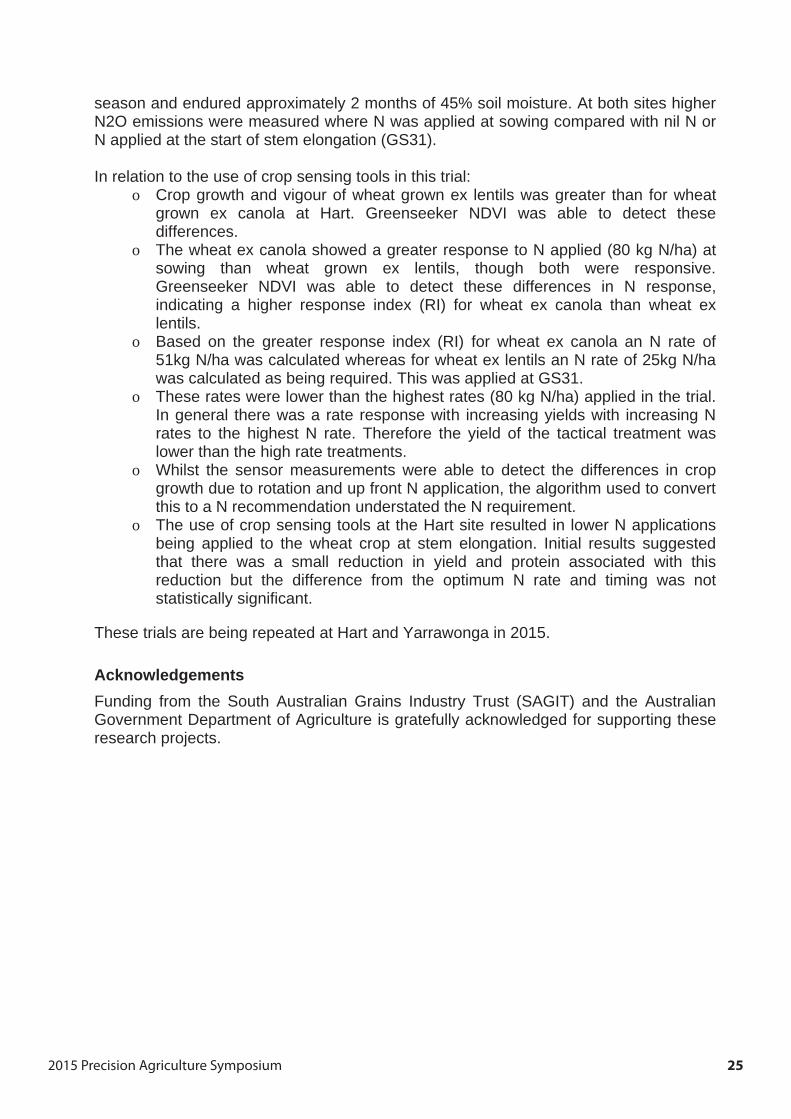
Agricon is a precision ag company in Germany that is developing and commercialising a weed ID sensor for the European market (Figure 1). This sensor uses near infrared and red imagery and leaf shape parameters to differentiate different weed types from crops. SAGIT is funding a project led by SPAA to assess this weed ID sensor in Australian crops and to produce new adapted classifiers for identifying important Australian weeds in Australian crops. This includes all the grain legumes lentils, field peas, faba beans, chickpeas and lupins which are not typically grown in Europe. Examples will be presented (Figure 2).
2015 Precision Agriculture Symposium24
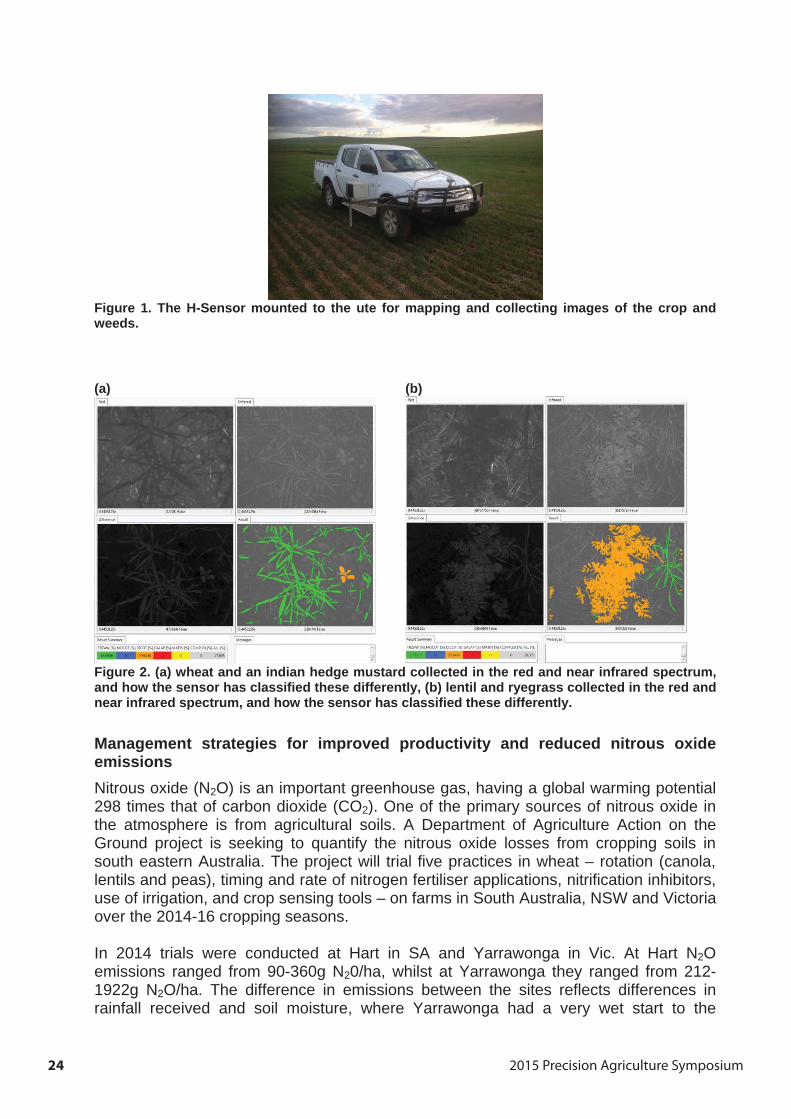
Figure 1. The H-Sensor mounted to the ute for mapping and collecting images of the crop and weeds.
(a) (b)
Figure 2. (a) wheat and an indian hedge mustard collected in the red and near infrared spectrum, and how the sensor has classified these differently, (b) lentil and ryegrass collected in the red and near infrared spectrum, and how the sensor has classified these differently.
Management strategies for improved productivity and reduced nitrous oxide emissionsNitrous oxide (N2O) is an important greenhouse gas, having a global warming potential 298 times that of carbon dioxide (CO2). One of the primary sources of nitrous oxide in the atmosphere is from agricultural soils. A Department of Agriculture Action on the Ground project is seeking to quantify the nitrous oxide losses from cropping soils in south eastern Australia. The project will trial five practices in wheat – rotation (canola, lentils and peas), timing and rate of nitrogen fertiliser applications, nitrification inhibitors, use of irrigation, and crop sensing tools – on farms in South Australia, NSW and Victoria over the 2014-16 cropping seasons.
In 2014 trials were conducted at Hart in SA and Yarrawonga in Vic. At Hart N2Oemissions ranged from 90-360g N20/ha, whilst at Yarrawonga they ranged from 212-1922g N2O/ha. The difference in emissions between the sites reflects differences in rainfall received and soil moisture, where Yarrawonga had a very wet start to the
2015 Precision Agriculture Symposium 25
season and endured approximately 2 months of 45% soil moisture. At both sites higher N2O emissions were measured where N was applied at sowing compared with nil N or N applied at the start of stem elongation (GS31).
In relation to the use of crop sensing tools in this trial: o Crop growth and vigour of wheat grown ex lentils was greater than for wheat
grown ex canola at Hart. Greenseeker NDVI was able to detect these differences.
o The wheat ex canola showed a greater response to N applied (80 kg N/ha) at sowing than wheat grown ex lentils, though both were responsive. Greenseeker NDVI was able to detect these differences in N response, indicating a higher response index (RI) for wheat ex canola than wheat ex lentils.
o Based on the greater response index (RI) for wheat ex canola an N rate of 51kg N/ha was calculated whereas for wheat ex lentils an N rate of 25kg N/ha was calculated as being required. This was applied at GS31.
o These rates were lower than the highest rates (80 kg N/ha) applied in the trial. In general there was a rate response with increasing yields with increasing N rates to the highest N rate. Therefore the yield of the tactical treatment was lower than the high rate treatments.
o Whilst the sensor measurements were able to detect the differences in crop growth due to rotation and up front N application, the algorithm used to convert this to a N recommendation understated the N requirement.
o The use of crop sensing tools at the Hart site resulted in lower N applications being applied to the wheat crop at stem elongation. Initial results suggested that there was a small reduction in yield and protein associated with this reduction but the difference from the optimum N rate and timing was not statistically significant.
These trials are being repeated at Hart and Yarrawonga in 2015.
Acknowledgements Funding from the South Australian Grains Industry Trust (SAGIT) and the Australian Government Department of Agriculture is gratefully acknowledged for supporting these research projects.

2015 Precision Agriculture Symposium26
Hutcheon & Pearce TECSight® Delivers
TECSight® is a new level of remote support from one of the leading John Deere dealers. It's a combination of John Deere Products, Technology and Hutcheon & Pearce’s remote support capabilities. Hutcheon & Pearce’s TECSight® support centre gives you access to quality trained specialists with all the necessary information, solutions, simulators and experience to talk you through the issues that may arise during your day-to-day operations. These are the issues that do not require a technician to travel to the machine but are still affecting your productivity. Having this over the phone support when and where you need it will reduce your overall costs and downtime. TECSight® also monitors your tractor and/or header remotely and can advise the operator via mobile phone, on suggested settings, screen setup, when parts need replacing or even organise servicing. Plus if you break-down you have direct access to Hutcheon & Pearce technicians who can talk you through the problem... all of this, without you leaving your tractor or header seat... this is what we call Technology Enabled Customer Support. Subscribing to TECSight® gives you access to:
Over-the-Phone Support – TECSight® Solutions Specialists are awaiting your call. Machine Optimisation – TECSight® enables peace of mind through monitoring JDLink codes and notifying owners of red alert situations and investigating low level codes. Also, the option of providing optimisation reports on machine utilisation, fuel levels and any service needs. Ag Decision Support – TECSight® aids with agronomic decisions through the correct creation, transfer and sharing of input/output data. We can facilitate the data sharing process through to agronomic consultants/advisors or third parties for data interpretation to help you implement agronomic decisions. Logistics Optimisation – TECSight® help efficiency by monitoring multiple machines in larger fleets. The support team can assist the service department to coordinate machine locations for mechanical repairs allowing quick, efficient location and decreased downtime.
Contact us on:
(02) 5924 5111
(Save us in your phone now!!) Email: [email protected]
2015 Precision Agriculture Symposium 27
Big picture detail on-farm
Warwick Holding Pontara Grain, Yerong Creek NSW
Contact: [email protected]
Take home message: CTF will improve your soil and lift your yield over time.
The team Warwick, Di and one full time employee Ryan.
The farmWe farm 2000 ha which is a mix of owned, leased and share-farmed land. We also contract farm 800 ha on neighbouring properties, doing all operations. We farm a range of soil types including sandy loam, loam, clay loam and sodic red clay. The soil pH (CaCl2) ranges from 4.5 to 5.8.
The farming system We continuously crop with no livestock and for the past 10 seasons have used a controlled traffic farming (CTF) system. We have permanent bare tracks on 3 m wheel centres in a 12 m system. It is very simple. We drive the machinery on the hard permanent wheel tracks and grow crop in the well-structured, uncompacted soil.
Using 2 cm RTK auto-steer allows us to inter-row sow most paddocks in most seasons. We sometimes have to burn stubble to allow sowing with our tine machine. In these cases we turn it into an opportunity to use pre-emergent herbicides.
We are looking at wheat varieties and/or the use of growth regulators in wheat to minimise crop height, harvest height and stubble length to improve our ability to sow with a tined machine into fully retained standing stubble. We are also considering post-harvest stubble treatments such as mulching.
Paddock records are an important part of our business allowing us to fully understand the costs and returns driving profitability. We calculate cost per tonne and per hectare and compare crop types, varieties and farms (soil types). We also use return on dollars spent as a key indicator to compare crops, farms and seasons. Fifteen years of records allows us to look at the big picture in detail. We can identify profitable rotations and also quantify the differences in profitability and sustainability between properties. We use this to underpin the profitability of lease properties and be confident in determining realistic lease rates.
Measuring and recording operations, inputs and outputs allows us to revisit the numbers and learn how our decisions around rotations, nutrition, operations and the smaller details affect the big picture – profitability.
2015 Precision Agriculture Symposium28
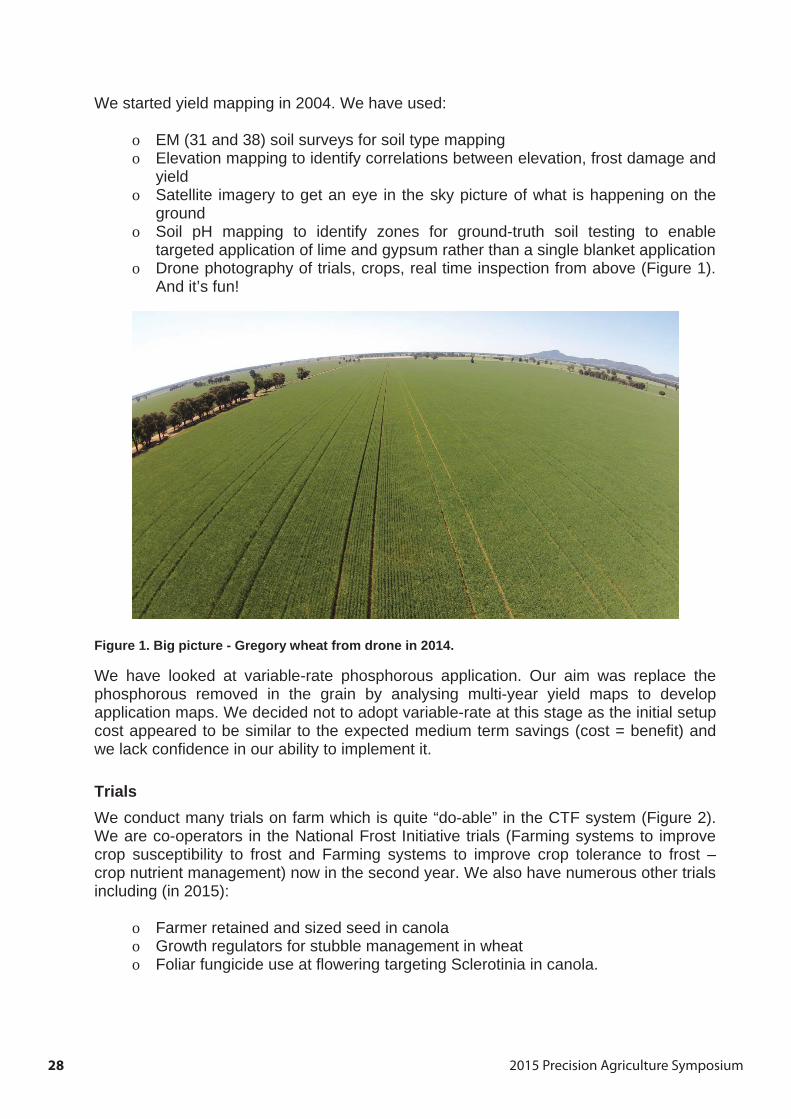
We started yield mapping in 2004. We have used:
o EM (31 and 38) soil surveys for soil type mapping o Elevation mapping to identify correlations between elevation, frost damage and
yieldo Satellite imagery to get an eye in the sky picture of what is happening on the
groundo Soil pH mapping to identify zones for ground-truth soil testing to enable
targeted application of lime and gypsum rather than a single blanket application o Drone photography of trials, crops, real time inspection from above (Figure 1).
And it’s fun!
Figure 1. Big picture - Gregory wheat from drone in 2014.
We have looked at variable-rate phosphorous application. Our aim was replace the phosphorous removed in the grain by analysing multi-year yield maps to develop application maps. We decided not to adopt variable-rate at this stage as the initial setup cost appeared to be similar to the expected medium term savings (cost = benefit) and we lack confidence in our ability to implement it.
TrialsWe conduct many trials on farm which is quite “do-able” in the CTF system (Figure 2). We are co-operators in the National Frost Initiative trials (Farming systems to improve crop susceptibility to frost and Farming systems to improve crop tolerance to frost – crop nutrient management) now in the second year. We also have numerous other trials including (in 2015):
o Farmer retained and sized seed in canola o Growth regulators for stubble management in wheat o Foliar fungicide use at flowering targeting Sclerotinia in canola.
2015 Precision Agriculture Symposium 29
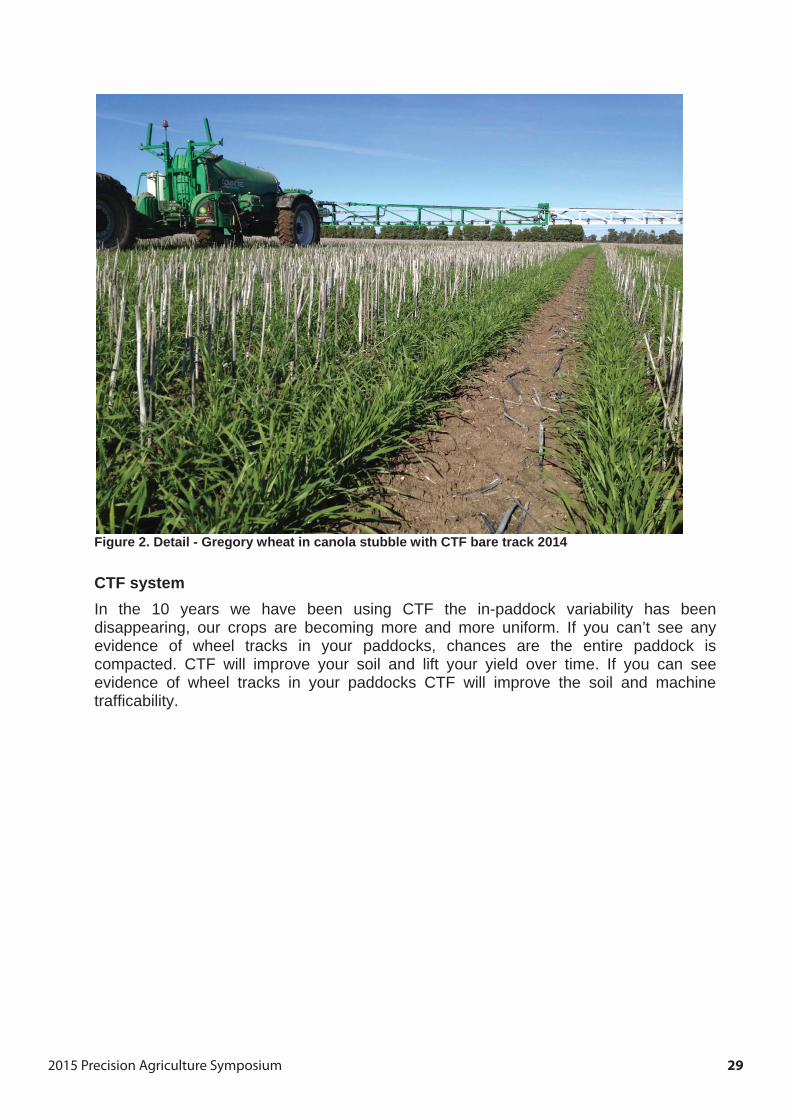
Figure 2. Detail - Gregory wheat in canola stubble with CTF bare track 2014
CTF systemIn the 10 years we have been using CTF the in-paddock variability has been disappearing, our crops are becoming more and more uniform. If you can’t see any evidence of wheel tracks in your paddocks, chances are the entire paddock is compacted. CTF will improve your soil and lift your yield over time. If you can see evidence of wheel tracks in your paddocks CTF will improve the soil and machine trafficability.
2015 Precision Agriculture Symposium30
2015 Precision Agriculture Symposium 31
Is modern agriculture set for a big boost from UAVs?
Chad Colby Colby Tech
Contact: https://www.facebook.com/thechadcolby
@TheChadColby
http://www.agtechtalk.net/
Did you know your iPad just turned 5 years old this year? Over the past 3 years I have had the honour of sharing an amazing new technology in the Agriculture Industry with industry professionals across the United States and Canada. Without question the hottest technology topic is Unmanned Aerial Systems (UAS). Visiting with growers and industry professionals I have learned so much about the status of UAS and what growers want from this new fast paced technology.
With a lifetime background in farming and aviation, in my opinion 2015 is really setting up to be the breakthrough year in UAS. Not only is the FAA beginning to show a path of commercial use with recent announcement of notice of proposed rulemaking (NPRM) but the UAS industry is moving SO fast it’s hard to even believe looking back over the past 3 short years how far it has come.
There’s been so much talk in Agriculture Industry about Unmanned Aerial Systems (UAS) over the past few years as we all know. It’s seem like, in my opinion, the industry has began to realise the important thing to the farmer is the value of the useful data.
After attending AUVSI earlier this year, I can report that the UAS industry is working hard to develop specialised technology for agricultural use. As we all know getting imagery beyond visual sight is nothing new, it’s been around over 20yrs +. The challenge has always been getting useful data in a VERY timely manner. It has just taken too long to get the data in time to make a decision from it. So many things can change in your field if you have to wait 24-48hrs for the imagery.
The biggest misconception about Unmanned Aerial Systems The biggest misconception would be that spending more money is better, but remember this, it’s NOT about how much money you spend. Too many times I hear about “first time” platforms costing $5000-$7000 or more just to carry a GoPro camera. Many amazing systems exist today for $1000-$4000.
Simply stated, the most important part of these UAS platforms is the images they create. You should expect over the next couple years some amazing advancement in this area. And it’s NOT about spending mega cash on a camera like it was just a couple of years ago. Remember when a 40 or 50” flat panel TV was $3000, and now it’s $300? It will be same with UAS. In fact, some companies are effectively converting the common GoPro cameras (Peau Productions) to create more effective images.
2015 Precision Agriculture Symposium32
What’s working well in USA Recently a couple of UAS companies, Ag Eagle Inc and Precision Hawk, have taken this technology to the next level. Both companies have developed technology to process data during flight, allowing the operator to get actual imagery beyond visual sight VERY shortly after flight. THIS is a BIG DEAL!
Recently I had a chance to visit Ag Eagle Inc in Kansas to review their new creation in person. The Ag Eagle Carbon Pro is the same proven “shape” as the Classic Ag Eagle but it’s now made with advanced aviation construction methods. Now, just like many full size aircraft, the Ag Eagle Carbon Pro uses carbon fiber wing construction. This is a HUGE deal, much lighter and much stronger. Now after several flights, I can tell you this works like a dream.
As the Ag Eagle Carbon Pro flies, images are captured at a regular interval, which means hundreds of photos are gathered while in flight. The images are assembled automatically during flight, creating a seamless aerial map. It is no longer necessary to remove the SD card from the camera, copy the images to your computer, and process them with complicated software, which can take many hours. The new Ag Eagle Carbon Pro is powered by DroneDeploy, which eliminates the long processing time, delivering stitched and geo-referenced images to your internet connected device in minutes. This technology takes the flight data (flight plan) and communicates it to the flight controller (3D Robotics) to operation the ship via cellular from your tablet or smartphone.
DroneDeploy also wi-fi links up to the sensor (standard Sony QX1 camera) and during the flight they are uploaded for processing in the cloud. Don’t worry if you don’t have service for some reason, as you can upload “old school” when you get back on the ground.
We are also looking at other sensors as well. I just purchased the new RedEdge camera from MicaSense and I can’t wait to get that camera in the air! Stay tuned for more to that story, we just need the crops get a little bigger.
Also check out the Trackimo we installed on the Ag Eagle. Trackimo is a light weight, battery powered cellular tracker and let me tell you, it worked GREAT! Trackimo uses state-of-the art GPS and cellular technology to coordinate with GPS satellites for precise tracking anywhere on the globe.
USA Rules for UAS It is going to be an amazing year in 2015, the industry is taking steps in the correct direction. It’s very important to remember today unless you have a 333 Exemption from the FAA, you cannot use this data to make ANY decisions. If you have any questions about the current rules about UAS, then check out Know Before You Fly website. (knowbeforeyoufly.org)
“Know Before You Fly” is an education campaign founded by the Association for Unmanned Vehicle Systems International (AUVSI), the Academy of Model Aeronautics (AMA), and the Small UAV Coalition in partnership with the Federal Aviation Administration (FAA) to educate prospective users about the safe and responsible operation of unmanned aircraft systems (UAS).
2015 Precision Agriculture Symposium 33
As excitement and enthusiasm continues to grow around UAS, and the regulatory framework continues to take shape, more consumers are looking to buy UAS for personal use and more businesses are looking to use UAS too. These prospective operators want to fly, and fly safely, but many don’t realise that, just because you can buy a UAS, doesn’t mean you can fly it anywhere, or for any purpose. Know Before You Fly provides prospective users with the information and guidance they need to fly safely and responsibly.
So what’s new? Ag Eagle: There’s no dispute that if you need to cover major acres you will need a fixed wing platform. The Ag Eagle product has really changed for 2015. The Rapid Ag Eagle now features DroneDeploy technology and can basically haul any type of sensor you may want now or in the future. Ag Eagle has done a good job listening to the farmer and they understand their needs, including being cost effective. Look for exciting things from Ag Eagle in the coming year.
Drone Deploy: A technology that allows a grower to upload images from a UAS platform and get crop health maps in a matter of minutes with accuracy up to 2cm/pixel. Very simple process, it manages both the flight of the platform and the image collection with no stitching drama at a very low cost. It works with many different flight systems including but not limited to, DJI, 3D Robotics and Ag Eagle. Including the simple systems like DJI Phantom 2 Vision + ($1099) or the advanced wing platform of the Ag Eagle fitted with an advanced camera like the MicaSense Red Edge multispectral system.
DJI: It has been a very exciting 6 months for the industry leader. The practical use of the Phantom series of ships has been exciting. The majority of the time the GoPro camera has been added to complete the Phantom ship, but lately DJI has been really making a strong effort to have the full package including a ship and sensor. First with the Phantom Vision, Vision Plus and Inspire 1 sensors, and now the just released Phantom 3 Profession and Advanced. Without going into all the details of these, just know that the ships with OEM cameras will not be able to add a more advanced sensor over time. The recently released Inspire 1 and Phantom 3 have an integrated sensor. A good part of this technology is that these ships work VERY well and are at a very attractive price point.
MicaSense: A new player in the sensor market over the past year, but the team has been in this industry a long time. The new Red Edge multispectral camera is one of the real exciting new achievements in sensor technology. It can be flown in anything from a DJI Phantom (although not real practical) up to a Cessna Airplane. Look for more exciting things coming soon from them.
3D Robotics: Has been around for a long time, really known in the marketplace for “do it yourself” systems. But over the past year they have really stepped up their game. With products like the IRIS + and Pixhawk autopilot they have advanced well in the market. They also have a major release coming later in this month, which will showcase a complete new platform. They also use the DroneDeploy technology to process imagery in flight w/ on board cell phone technology.
2015 Precision Agriculture Symposium34
There are many other amazing new products coming from other awesome companies who will also continue to advance UAS use in Agriculture and other industries.
o PrecisionHawk: Features a fully functional fixed wing ship called PrecisionHawk. Lots of excitement about this premium priced platform as it does offer a large selection of sensors.
o Sensefly: Has announced a new shipped call eXom coming soon with some new sensors and advanced situational awareness. They also produce a winged ship call eBee.
o Trimble: A company that is well known in the Ag Industry, and has for years had a winged UAS called UX5. Honestly it’s an amazing platform that has mainly been used overseas in the mapping and surveying of very large rock quarries. t’s now being sold for agriculture use here in the US at premium price.
o Pix4D: This state of the art software can process your images into 2D & 3D models.
o Lockheed Martin: Maker of the Indago Vtol Quad Rotor, it is worth noting they are a high end military vendor who was the 1st to offer a “consumer” based platform.
o Aeryon Labs: This company features a very high-end quad copter focusing more on the military and public safety. Recently they have announced a new sensor that features a new 20-megapixel camera with up to 30x optical zoom!
o Aerialtronics: This company also features high-end remote control systems. They are being used around the world in various venues.
o New Applications: for your smart phones and tablets are really expanding. Keep your eye on some amazing new apps to help operate these UAS systems in ways never thought of.
There are other quality companies in this technology but in my opinion the above-mentioned companies are heading forward in the right direction with this expanding technology and have the resources to continue. The trick with this technology in the very near future is a return on your investment. To accomplish that remember the real value is and always be in the imagery. Historically stitching images together has been a REAL challenge and very time consuming but companies are starting to make that very practical.
My advice is to first time buyers? Most importantly, understand the current UAS rules before you consider flying. Flying safely is most important, but just remember it’s NOT all about how much money you spend. You can buy a great ship for $1500-3000 that will amaze you. I’m looking forward to the up-coming FAA policy that will allow us to use this technology to make decisions on our farming operations. So far it’s just been a super fun hobby.
Learn more about the industry FAA Unmanned Aerial Systems https://www.faa.gov/uas/ AMA Academy of Model Aeronautics http://www.modelaircraft.org Know Before You Fly http://knowbeforeyoufly.org
2015 Precision Agriculture Symposium 35
Product Information Ag Eagle http://ageagle.com DJI http://www.dji.com Drone Deploy https://www.dronedeploy.com MisaSense http://www.micasense.com 3d Robotics http://3drobotics.com/home-2014/ Peau Productions http://www.peauproductions.com/main.html Lockheed Martin http://www.lockheedmartin.com/us/products/procerus/quad-
vtol.html senseFly https://www.sensefly.com/home.html Trimble http://uas.trimble.com PrecisionHawk http://www.precisionhawk.com Aeryon Labs http://www.aeryon.com Aerialtronics http://aerialtronics.com Pix4D http://www.pix4d.com
2015 Precision Agriculture Symposium36
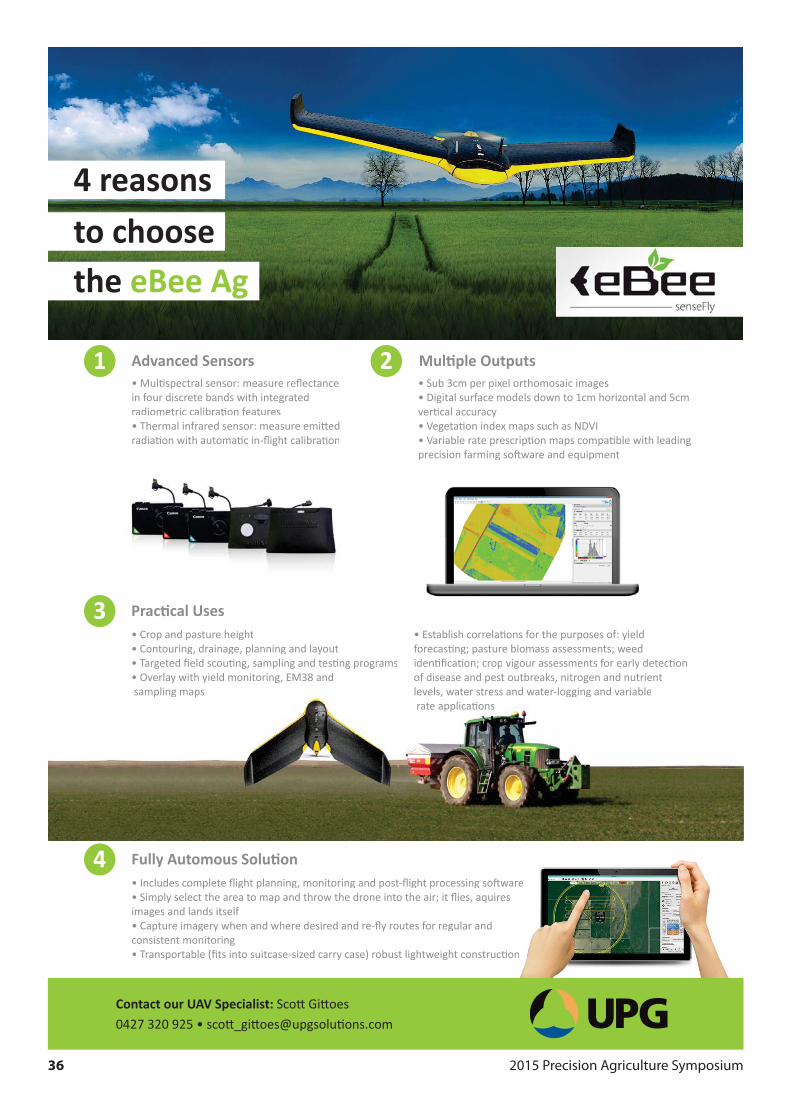
4 reasonsto choosethe eBee Ag
Advanced Sensors
• Includes complete flight planning, monitoring and post-flight processing so• Simply select the area to map and throw the drone into the air; it flies, aquirimages and lands itself• Capture imagery when and where desired and re-fly routes for regular andconsistent monitoring• Transportable (fits into suitcase-sized carry case) robust lightweight construc
• Crop and pasture height• Contouring, drainage, planning and layout
• Mul spectral sensor: measure reflectance in four discrete bands with integratedradiometric calibra on features• Thermal infrared sensor: measure emi ed radia on with automa c in-flight calibra on
• Sub 3cm per pixel orthomosaic images• Digital surface models down to 1cm horizontal and 5cmver cal accuracy• Vegeta on index maps such as NDVI• Variable rate prescrip on maps compa ble with leadingprecision farming so ware and equipment
• Establish correla ons for the purposes of: yield forecas ng; pasture biomass assessments; weed
• Targeted field scou ng, sampling and tes ng programs• Overlay with yield monitoring, EM38 and sampling maps
iden fica on; crop vigour assessments for early detec on of disease and pest outbreaks, nitrogen and nutrient levels, water stress and water-logging and variable rate applica ons
wareres
c on
1 2
3
4
Contact our UAV Specialist: Sco Gi oes 0427 320 925 • sco _gi oes@upgsolu ons.com
2015 Precision Agriculture Symposium 37
Remote sensing trends for high-resolution soil moisture monitoring: Exploring the potential for farming and agriculture applications
Alessandra Monerris, Christoph Rüdiger, Jeffrey P. Walker Department of Civil Engineering, Monash University, Clayton, Australia
Contact: [email protected]
Summary Remote sensing technologies have become an important tool in farming and agriculture practices. Regular and high-resolution soil moisture information can play a key role in precision agriculture, but available remote sensing soil moisture products were so far at a too coarse spatial resolution to make them applicable to agricultural practices. Recent developments are attempting to address this issue and to provide soil moisture products at and below 1km resolution, therefore becoming more suitable for state-of-the-art farming.
In this work, two new methodologies for high-resolution soil moisture monitoring at the farm scale are presented.
The first methodology consists of producing high-resolution maps of soil moisture, making use of a combination of coarse and high resolution satellite imagery. For such approaches, passive microwave data generally provides the soil moisture fields. However, while those are relatively accurate, their spatial resolution is low (in the order of 30-40km). To compensate for this, a number of approaches have been developed to downscale those data with high-resolution spectral data sets that are available almost coinciding with the passive microwave acquisitions. Those downscaling approaches provide soil moisture data sets at a resolution of 1km, and the first results have shown promising outcomes, with observed uncertainties of about 0.06 m3/m3. The disadvantages of this way to determine high-resolution soil moisture are that most passive microwave satellites pass over a single point in space only every 2-3 days, potentially missing significant rain events, and that the use of spectral data is limited to cloud free days, as direct observations of the land surface are not possible otherwise.
The second technique is known as GNSS-R (Global Navigation Satellite System Reflectometry) and is making use of the signals that are used for regular GPS (Global Positioning Satellite) systems. The idea behind this approach is to determine land surface properties, such as soil moisture, by measuring the difference between the direct signal received from a GPS satellite, and that which has been reflected by the land surface. This sensing technique has several advantages: the source signals from GNSS are free; the signals are available everywhere and all the time; more GNSS satellite will be available in the future, as new constellations are scheduled to be launched; and the sensor components are relatively cheap, compact, light-weight and have low power consumption.
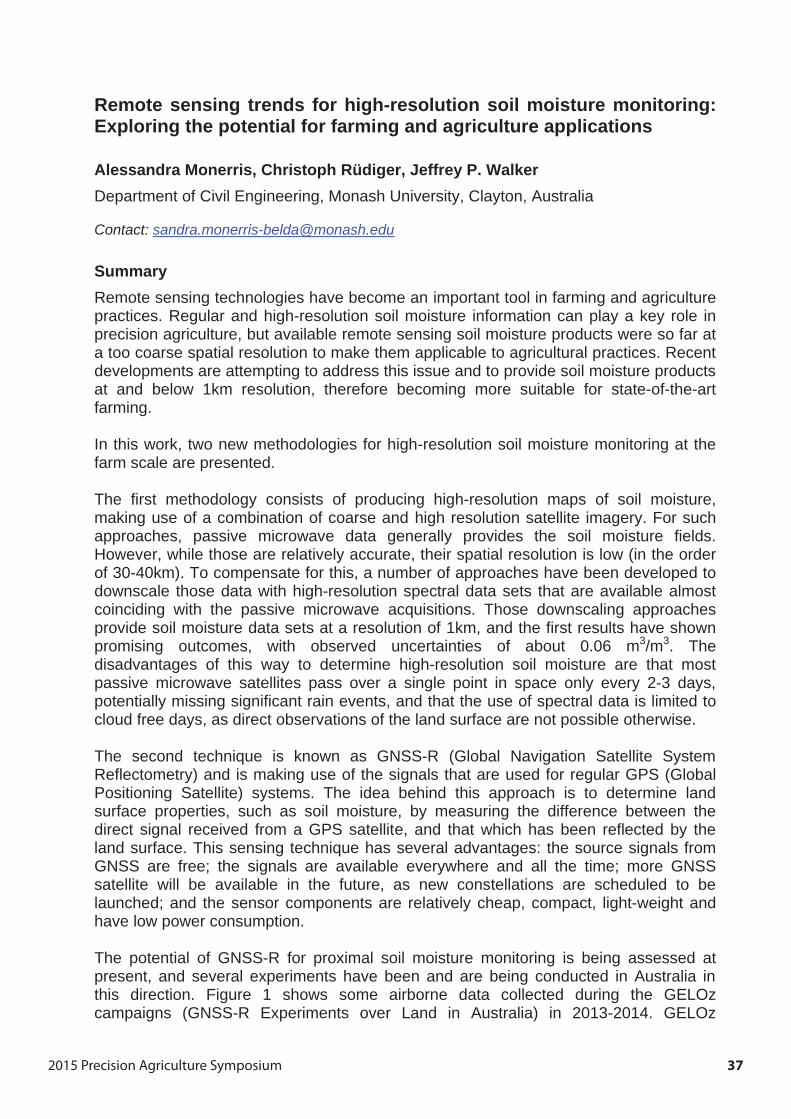
The potential of GNSS-R for proximal soil moisture monitoring is being assessed at present, and several experiments have been and are being conducted in Australia in this direction. Figure 1 shows some airborne data collected during the GELOz campaigns (GNSS-R Experiments over Land in Australia) in 2013-2014. GELOz
2015 Precision Agriculture Symposium38
comprises four field campaigns, during which a GNSS-R sensor was deployed on an aircraft (for larger scale monitoring) and a roving ground-based system (for small scale monitoring). Concurrently, ancillary in-situ soil moisture and vegetation sampling were conducted. An overview of the GNSS-R sensor used during those field campaigns, as well as preliminary results will be presented at the symposium.
Figure 1. Example of GNSS-R airborne data collected on two different dates over the Yanco experiment site, NSW, Australia. Red (blue) indicate dry (wet) soil, respectively. An accumulated rainfall of over 20 mm had been registered in the area in between both experiments.
The advantages and shortcomings of both techniques in terms of temporal and spatial resolutions, the need for ancillary data, and applicability to precision agriculture will also be discussed.

2015 Precision Agriculture Symposium 39
Acknowledgements
The authors would like to acknowledge funding from Monash University through the Faculty of Engineering Seed grants program, as well as the support by ACROSS (Advanced Remote Sensing Ground-Truth Demo and Test Facilities) and TERENO (Terrestrial Environmental Observatories) funds from the German Helmholtz-Association. Special thanks go also to Frank Winston for his technical support; Adriano Camps and Alberto Alonso-Arroyo for helping with the processing of the GNSS-R data; and the participants of the various field experiments for their assistance in collecting in-situ data. Also thanks to Olivier Merlin and Yoann Malbéteau for providing the SMOS data at 1km resolution.

2015 Precision Agriculture Symposium40
2015 Precision Agriculture Symposium 41
Optimising precision systems in Queensland vegetable production
Ian Layden1, Sarah Limpus2, Julie O’Halloran3
1Department of Agriculture and Fisheries, Maroochy Research Facility, Nambour, Queensland 4560 2Department of Agriculture and Fisheries, Bowen Research Facility, Bowen, Queensland, 4805 3Department of Agriculture and Fisheries, Gatton Research Facility, Gatton, Queensland, 4343
Contact: [email protected]
AbstractDespite a significant increase in the installation of machine guidance systems in Queensland horticulture over the last decade, evidence indicates that producers are not employing this technology and precision agriculture (PA) methodologies beyond basic guidance activities.
Intensive horticulture creates substantial challenges for producers wishing to progress beyond machine guidance into other precision applications such as soil nutrition and irrigation, crop sensing, variable rate inputs and yield monitoring. Achieving adoption requires significant optimisation and support to realise any benefits that might accrue from understanding and managing within block variability. In an effort to unlock the benefits of PA for intensive horticulture, the authors have implemented a range of PA technologies across eight Queensland vegetable farms (e.g. carrots, chilli, potato, sweet potato, tomatoes, green beans and onions).
While the majority of technologies implemented could be considered relatively mature in broad acre agriculture; intensive horticulture creates significant spatial, temporal and cultural obstacles that are critical to overcome. A key component of this work has been to develop adoption pathways and processes that address producer needs, this has required a substantial focus on implement retro-fitting, imagery timing, data acquisition platforms, producer and agronomist capacity building and data dissemination.
Initial work focused on establishing whether sufficient block or crop variability existed and understanding whether sufficient economic gains could be made from adopting spatial variability management strategies. Biomass sensing with multiple platforms is being used and variable rate inputs are responding to zonal and grid based sampling programs. Yield monitoring and mapping has been established in potato, sweetpotato and carrots. PA in horticulture is in its infancy and crop scheduling changes resulting from market pressures will be very difficult to overcome. Nonetheless these new data sources and management approaches are creating novel ways for producers and agronomists to view and manage both farm and within block variability.
2015 Precision Agriculture Symposium42
Introduction
Precision in Queensland vegetable systems Improved spatial management of horticultural production systems using a range of contemporary technologies (e.g. crop sensing, soil mapping, yield monitoring, variable rate applications) offers producers new ways in which to manage crop production and biophysical constraints to production. Given the current and future challenges associated with intensive vegetable production in tropical and sub-tropical settings (e.g. climate change, biosecurity, labour) producers can potentially gain from adopting technology that improves both the detection and management of variable soils, pest and diseases and irrigation issues.
Despite recent advances in technology targeting the agricultural sector and the prospect of these technologies to improve the detection and management of crop or block variability; the adoption of precision technology beyond machine guidance (auto-steer) remains poor. The low adoption rate may be attributable to lack of knowledge and awareness of existing technologies and whether significant soil/crop variability exists. It is likely to be also compounded by a lack of percieved or real value in adopting new and/or complex management tools. Essentially improving producer awareness and quantification of block soil and yield variability formed the basis for this current work.
In 2014, the authors commenced a program that sought to implement, optimise and develop a range of precision technologies across eight demonstration sites in the four major vegetable growing regions of Queensland (Fig.1). Precision approaches implemented include:
o Soil mapping (EM38) and strategic sampling programs o Remote and proximal biomass sensing (NDVI and multi-spectral) o Yield monitoring (load cells) on root crops (carrots, potato and sweet potato) o Variable rate input programs (nutrients, soil ameliorants, irrigation) o Mobile data access
The key areas of investigation were primarily along the lines:
o Is there farm/block variability? o Is the observed/quantified variation having an economic impact? o Can this variability be understood and managed? o Are current management practices/equipment suitable for addressing any
variation?o Will a precision approach elicit a yield/quality response?
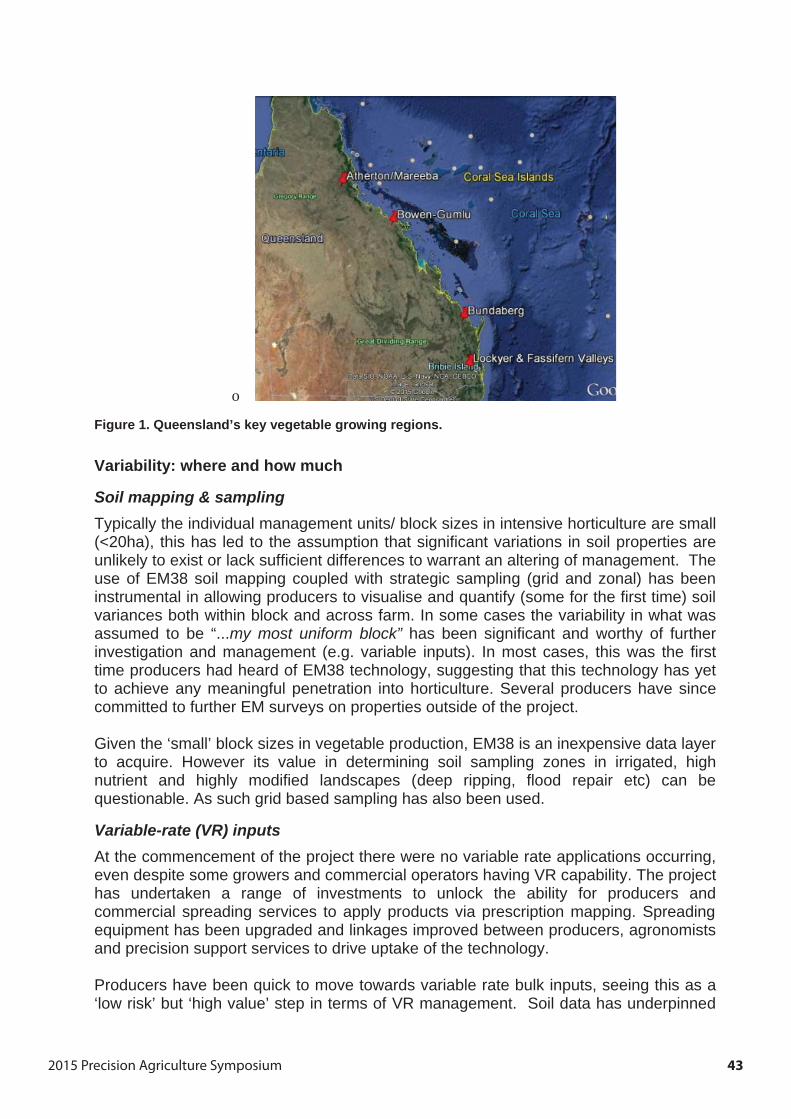
2015 Precision Agriculture Symposium 43
o
Figure 1. Queensland’s key vegetable growing regions.
Variability: where and how much
Soil mapping & sampling Typically the individual management units/ block sizes in intensive horticulture are small (<20ha), this has led to the assumption that significant variations in soil properties are unlikely to exist or lack sufficient differences to warrant an altering of management. The use of EM38 soil mapping coupled with strategic sampling (grid and zonal) has been instrumental in allowing producers to visualise and quantify (some for the first time) soil variances both within block and across farm. In some cases the variability in what was assumed to be “...my most uniform block” has been significant and worthy of further investigation and management (e.g. variable inputs). In most cases, this was the first time producers had heard of EM38 technology, suggesting that this technology has yet to achieve any meaningful penetration into horticulture. Several producers have since committed to further EM surveys on properties outside of the project.
Given the ‘small’ block sizes in vegetable production, EM38 is an inexpensive data layer to acquire. However its value in determining soil sampling zones in irrigated, high nutrient and highly modified landscapes (deep ripping, flood repair etc) can be questionable. As such grid based sampling has also been used.
Variable-rate (VR) inputs At the commencement of the project there were no variable rate applications occurring, even despite some growers and commercial operators having VR capability. The project has undertaken a range of investments to unlock the ability for producers and commercial spreading services to apply products via prescription mapping. Spreading equipment has been upgraded and linkages improved between producers, agronomists and precision support services to drive uptake of the technology.
Producers have been quick to move towards variable rate bulk inputs, seeing this as a ‘low risk’ but ‘high value’ step in terms of VR management. Soil data has underpinned
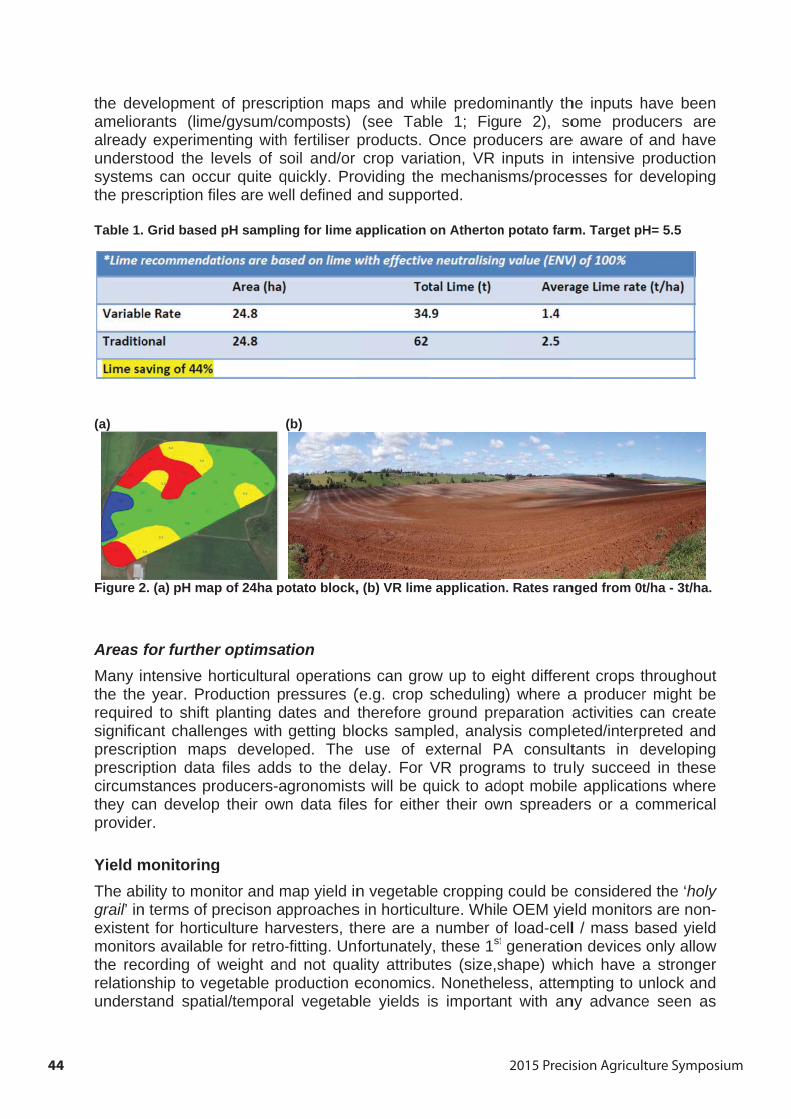
2015 Precision Agriculture Symposium44
the devamelioralreadyunderssystemthe pre
Table 1.
(a)
Figure 2
AreasMany ithe therequiresignificprescriprescricircumsthey caprovide
Yield mThe abgrail’ inexistenmonitothe recrelationunders
velopmentrants (limey experimetood the l
ms can occescription fi
. Grid based
2. (a) pH ma
for furthentensive h
e year. Proed to shift ant challenption mapption datastances pran developer.
monitoringbility to monn terms of pnt for horticrs availabl
cording of nship to vetand spati
t of prescre/gysum/centing withevels of s
cur quite qiles are we
d pH samplin
p of 24ha po
r optimsahorticulturaoduction pplanting dnges with ps develop files addsroducers-ap their ow
gnitor and mprecison aculture hare for retro-weight an
egetable pral/tempora
ription mapomposts)
h fertiliser psoil and/or quickly. Proell defined a
ng for lime a
(b)
otato block,
tional operationressures (ates and tgetting bloped. The s to the d
agronomistn data file
map yield inpproachesrvesters, th-fitting. Unf
nd not quaroduction eal vegetab
ps and wh(see Tab
products. crop varia
oviding theand suppo
application
, (b) VR lime
ns can gro(e.g. crop therefore gocks samp
use of eelay. For
ts will be qes for eithe
n vegetabls in horticuhere are afortunately
ality attribueconomics
ble yields i
hile predomble 1; FigOnce prodation, VR e mechaniorted.
on Atherton
e application
ow up to eschedulingground prepled, analyexternal PVR progra
quick to ader their ow
e croppinglture. Whil number o
y, these 1st
utes (size,ss. Nonetheis importa
minantly thure 2), soducers areinputs in sms/proce
n potato farm
n. Rates ran
ight differeg) where aeparation aysis complePA consultams to trudopt mobilewn spreade
g could be e OEM yieof load-cellt generatioshape) whless, attemnt with an
he inputs home prod
e aware ofintensive p
esses for d
m. Target pH
nged from 0t
ent crops ta produceractivities ceted/interptants in dly succeede applicatioers or a c
considereeld monitorl / mass b
on devices hich have ampting to uny advance
have beenucers areand have
productiondeveloping
H= 5.5
t/ha - 3t/ha.
throughoutr might becan createpreted anddevelopingd in theseons whereommerical
d the ‘holyrs are non-ased yieldonly allowa strongerunlock ande seen as
neeng
teedgeel
y-dwrds
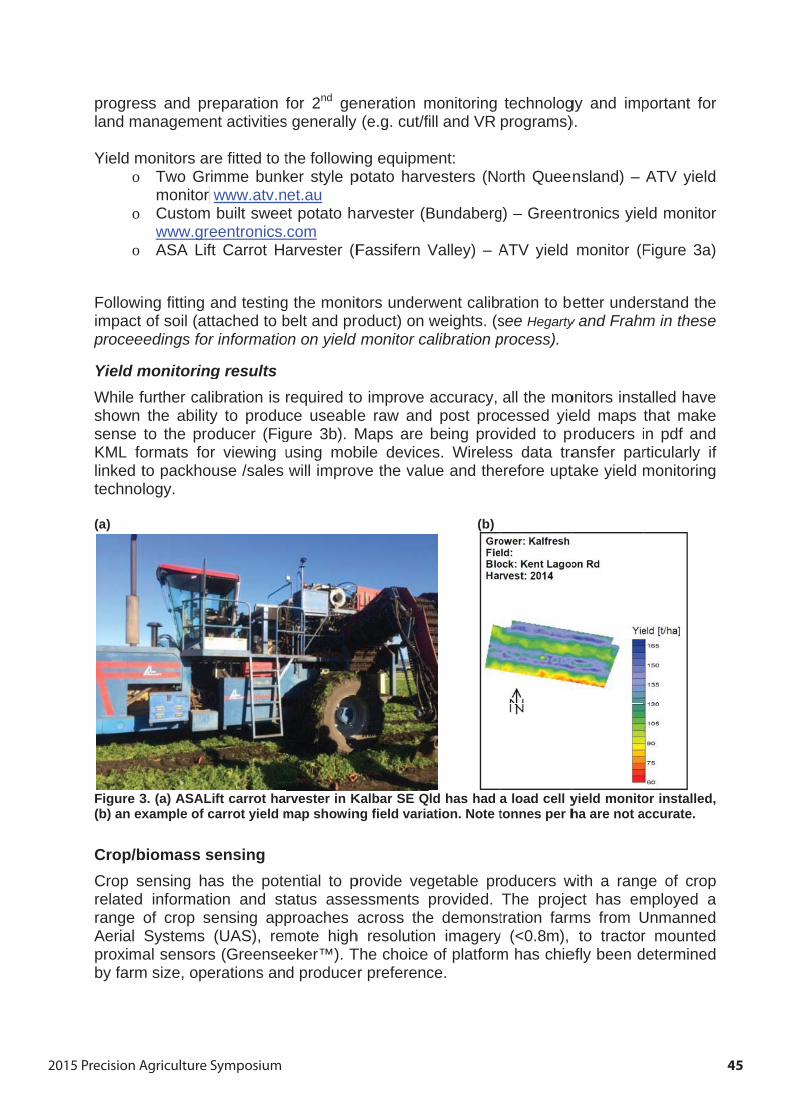
2015 Precision Agriculture Symposium 45
progresland ma
Yield mo
o
o
Followiimpactprocee
Yield mWhile fshownsenseKML folinked ttechno
(a)
Figure 3(b) an ex
Crop/bCrop srelatedrangeAerialproximaby farm
ss and preanagemen
monitors arTwo Grimonitor wCustomwww.greASA Lift
ng fitting aof soil (attedings for
monitoringfurther calithe abilityto the proormats forto packhoulogy.
3. (a) ASALixample of c
biomass ssensing ha informatioof crop seSystems al sensors
m size, ope
eparationnt activities
e fitted to tmme bunkwww.atv.nbuilt swee
eentronics.t Carrot Ha
and testingtached to br informatio
g results bration is
y to produoducer (Figr viewing uuse /sales
ft carrot hacarrot yield m
ensing as the poteon and stensing app(UAS), rem
s (Greenseerations an
for 2nd ges generally
the followinker style pet.au
et potato hacomarvester (F
g the monitbelt and pron on yield
required toce useable
gure 3b). Musing mobwill improv
rvester in Kmap showin
ential to ptatus asseproaches amote high
eeker™). Td produce
eneration m(e.g. cut/f
ng equipmpotato harv
arvester (B
Fassifern V
tors underwroduct) on monitor ca
o improve e raw andMaps are bile deviceve the valu
Kalbar SE Qng field varia
provide vegessmentsacross the
h resolutionThe choice r preferenc
monitoringill and VR
ent:vesters (No
Bundaberg
Valley) – A
went calibweights. (salibration p
accuracy,d post probeing prov
es. Wirelesue and the
(b)
ld has had ation. Note t
getable prprovided.e demonstn imageryof platform
ce.
technologprograms)
orth Quee
g) – Green
ATV yield
ration to bsee Hegartyprocess).
all the mocessed yievided to pss data traerefore upt
a load cell ytonnes per h
oducers wThe projetration farm
y (<0.8m), m has chie
gy and imp).
nsland) –
tronics yie
monitor (F
better undey and Frahm
onitors insteld maps
producers iansfer partake yield
yield monitoha are not a
with a rangect has emms from U
to tractorefly been d
portant for
ATV yield
eld monitor
Figure 3a)
erstand them in these
alled havethat makein pdf andrticularly ifmonitoring
or installed,accurate.
ge of cropmployed aUnmannedr mounteddetermined
r
d
r
)
ee
eedf
g
,
paddd
2015 Precision Agriculture Symposium46
A synopsis of the approaches employed:
o High- resolution satellite: sub-metre resolution along with a continual reduction in the cost per hectare can make it a viable crop sensing tool depending on farm size/complexity. Though widespread use will be constrained by the lead time (tasking) combined with post-processing and risk of cloud cover particularly in coastal regions.
o Unmanned Aerial Systems (UAS): still experimental in terms of commercial providers in Queensland. While ultra-high resolution (2-3cm) is possible the amount of data and post-processing requirements required by vegetable producers is beyond the reach of many existing UAS providers. With short cropping cycles potentially requiring multiple capture events to generate useable data, producers and providers are yet to establish the cost-benefit of this approach.
o Proximal sensing (Greenseeker™): due to the number /frequency of field operations required horticulture offers a lot of opportuntiy for proximal sensing applications. Spray rigs differ widely and can be challenging for mounting sensors. Spray products such as copper based solutions can also foul sensors necessitating cleaning. Given the block sizes, frequency of operations and compressed timelines, producers tend to be drawn to proximal sensing as a way foward. Real-time NDVI display (e.g. Greenseeker - Trimble FMX) appears important and a way to easily ‘check-in’ with crop status (Figure 4).
Crop sensing summary While the ‘hype’ around crop (biomass) sensing is persuasive, achieving meaningful crop sensing approaches for intensive horticulture production is perhaps one of the more difficult precision tasks to optimise and it will be a challenge for commercial operators to deliver value or for producers to implement.
Multiple crop types, growth stages, farms spread across district locations, crop sensitivity to weather, pest and disease, contract planting and harvesting provide significant obstacles. While data collection and processing are relatively straightforward, our experience is that producers require the data almost immediately (<24hrs post capture). Deriving value for time and dollars spent requires a committed ground-truthing campaign that at this time appears beyond the reach of many medium and large scale vegetable operations mainly due to other priorities. Automated approaches coupled with data analytics and perhaps machine to machine (M2M) learning will likely hold the key to successful crop sensing programs.
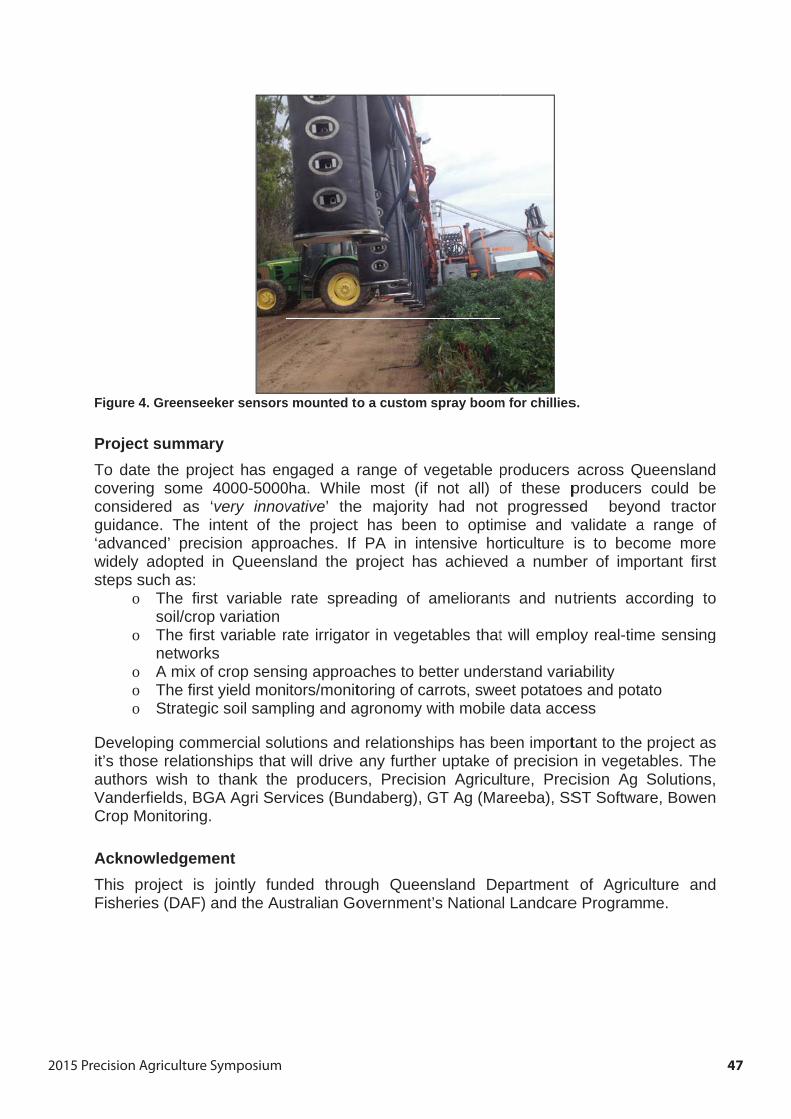
2015 Precision Agriculture Symposium 47
Figure 4
ProjecTo datecoverinconsideguidanc‘advancwidely steps s
o
o
ooo
Develoit’s thosauthorsVanderCrop M
AcknowThis pFisherie
4. Greensee
t summare the proje
ng some 4ered as ‘ce. The inced’ precisadopted i
such as: The firstsoil/cropThe firstnetworksA mix of The first Strategic
oping commse relations wish to rfields, BG
Monitoring.
wledgemeproject is jes (DAF) a
ker sensors
ryect has en4000-5000very innovntent of thsion appron Queens
t variable p variation t variable rscrop sensyield mon
c soil samp
mercial solnships that
thank theA Agri Ser
entjointly funand the Au
s mounted to
ngaged a r0ha. Whilevative’ thehe projectoaches. If sland the p
rate spre
rate irrigato
sing approaitors/monitpling and a
utions andwill drive
e producerrvices (Bun
nded throuustralian Go
o a custom
range of ve most (if e majority t has bee
PA in intproject ha
eading of
or in veget
aches to betoring of caagronomy w
d relationshany furthe
rs, Precisindaberg), G
ugh Queeovernment
spray boom
vegetablenot all) ohad not
n to optimtensive hos achieve
ameliorant
tables that
etter underarrots, swewith mobile
hips has beer uptake oon AgricuGT Ag (Ma
nsland Det’s Nationa
m for chillies
producersof these pprogresse
mise and vorticultured a numb
ts and nu
t will emplo
rstand varieet potatoee data acce
een importof precisionlture, Precareeba), SS
epartmental Landcare
s.
across Qproducersed beyovalidate ais to beco
ber of impo
utrients acc
oy real-tim
iabilityes and potaess
tant to the n in vegetacision Ag ST Softwa
of Agricue Program
ueenslandcould be
nd tractora range ofome moreortant first
cording to
me sensing
ato
project asables. TheSolutions,
are, Bowen
ulture andme.
derfet
o
g
se,n
d
2015 Precision Agriculture Symposium48
Quantifying yield variability of vegetable crops using load cell systems
Stephen Hegarty, Stephen Frahm VNET Precision Farming – Vanderfield Pty Ltd, 21 Carrington Rd, TOOWOOMBA, Qld, 4350
Contact: [email protected]
Summary The aim of this project was to quantify the degree of variability in root vegetable crops to justify possible implementation of zonal management in horticulture in the Bundaberg region. Predicting potential return on prescription management of vegetable crops is difficult without first quantifying the degree of variability in marketable yield. The primary outcome of the trial, was to determine if load cell based systems could successfully collect accurate yield data in a commercial horticultural farming system to use as an agronomic decision support tool.
The project studied yield variability in a 7 hectare sweet potato trial field at Bundaberg over one growing season. The project also worked with the grower cooperator to generate a commercial process for post-calibration of the yield data, to allow for errors from soil being measured as yield (due to variable soil moisture). This post calibration process allowed accurate gross margin analysis, needed for calculating potential return on investment from implementing prescription management of future sweet potato crops.
This paper provides a summary of the findings from one season’s data and expected next steps that will be implemented at Bundaberg by the trial cooperator and their agronomist.
Collecting vegetable yield data The cooperator’s existing commercial harvest platform was fitted with load cells, shaft speed sensors and data logger. GPS position was input from a differential GPS receiver. Due to the design of the conveyors and sorting tables on the cooperator’s harvest platform, the only suitable location for fitment of the load cells was on the tilting unload elevator. A tilt compensation sensor was also fitted to study effect of elevator angle on load cell readings.
The system corrected load cell readings, allowing for conveyor RPM versus GPS ground speed. Load cells were field calibrated by comparing harvested yield per bin, to actual yield per bin measured on scales in the packing shed. One load cell reading per second was recorded in .csv format along with corresponding GPS position and tilt data. The .csv data was then processed into a Variability Map. Post calibration allowed correction of the Variability Map to a Yield Map.
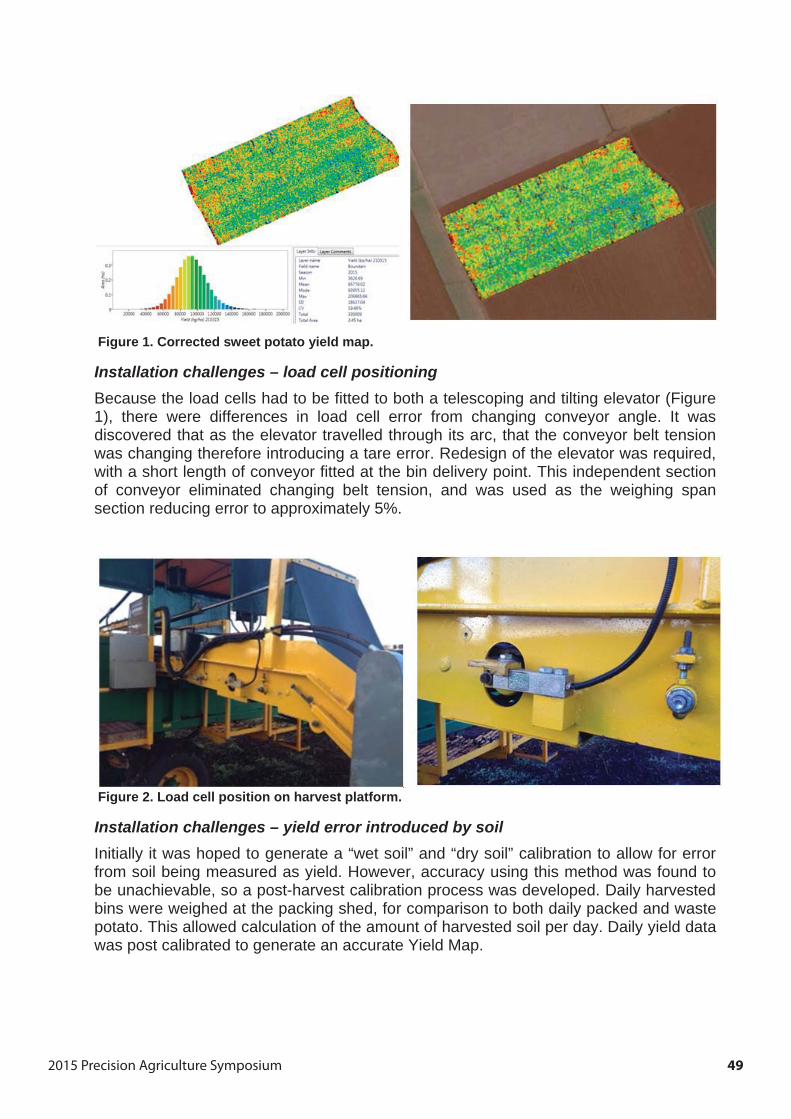
2015 Precision Agriculture Symposium 49
Figure 1. Corrected sweet potato yield map.
Installation challenges – load cell positioning Because the load cells had to be fitted to both a telescoping and tilting elevator (Figure 1), there were differences in load cell error from changing conveyor angle. It was discovered that as the elevator travelled through its arc, that the conveyor belt tension was changing therefore introducing a tare error. Redesign of the elevator was required, with a short length of conveyor fitted at the bin delivery point. This independent section of conveyor eliminated changing belt tension, and was used as the weighing span section reducing error to approximately 5%.
Figure 2. Load cell position on harvest platform.
Installation challenges – yield error introduced by soil Initially it was hoped to generate a “wet soil” and “dry soil” calibration to allow for error from soil being measured as yield. However, accuracy using this method was found to be unachievable, so a post-harvest calibration process was developed. Daily harvested bins were weighed at the packing shed, for comparison to both daily packed and waste potato. This allowed calculation of the amount of harvested soil per day. Daily yield data was post calibrated to generate an accurate Yield Map.
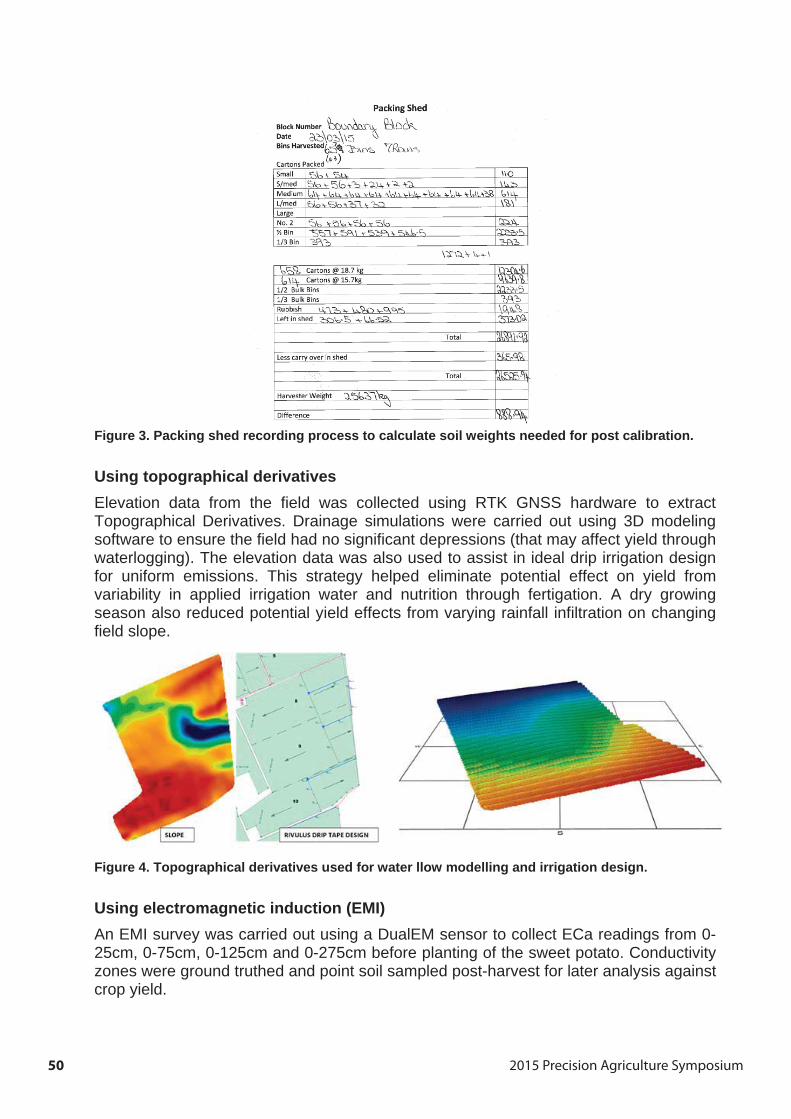
2015 Precision Agriculture Symposium50
Figure 3. Packing shed recording process to calculate soil weights needed for post calibration.
Using topographical derivatives Elevation data from the field was collected using RTK GNSS hardware to extract Topographical Derivatives. Drainage simulations were carried out using 3D modeling software to ensure the field had no significant depressions (that may affect yield through waterlogging). The elevation data was also used to assist in ideal drip irrigation design for uniform emissions. This strategy helped eliminate potential effect on yield from variability in applied irrigation water and nutrition through fertigation. A dry growing season also reduced potential yield effects from varying rainfall infiltration on changing field slope.
Figure 4. Topographical derivatives used for water llow modelling and irrigation design.
Using electromagnetic induction (EMI) An EMI survey was carried out using a DualEM sensor to collect ECa readings from 0-25cm, 0-75cm, 0-125cm and 0-275cm before planting of the sweet potato. Conductivity zones were ground truthed and point soil sampled post-harvest for later analysis against crop yield.
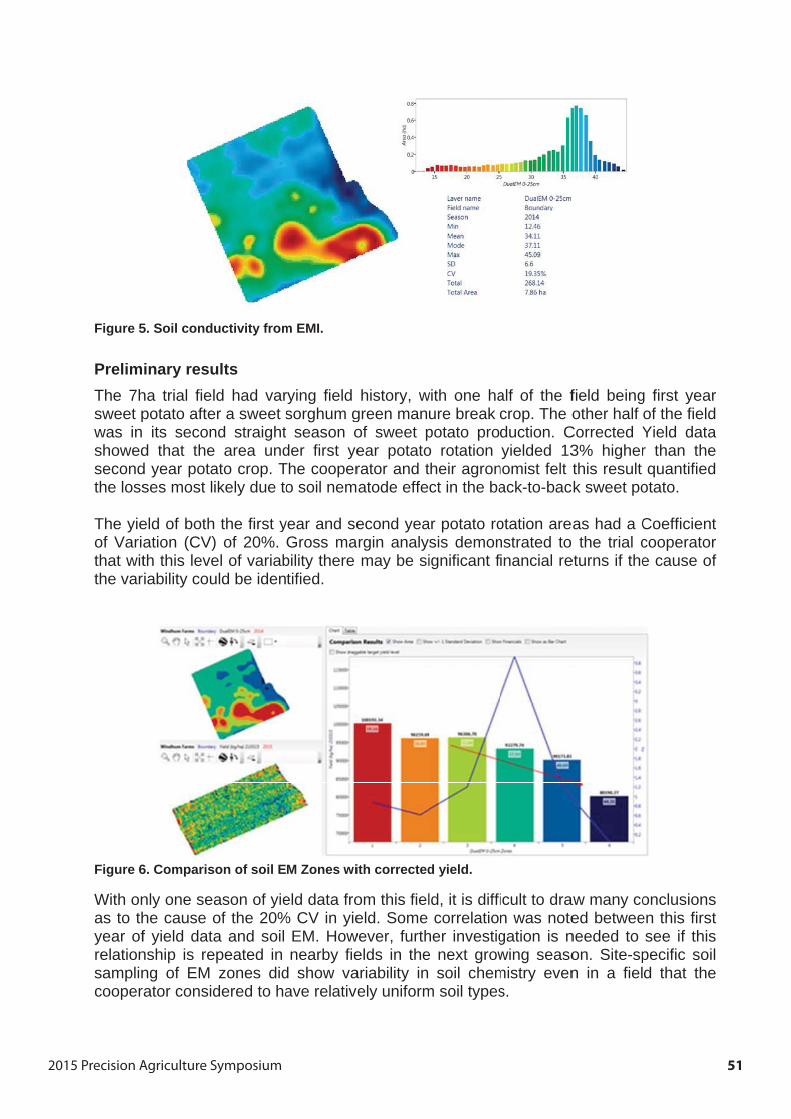
2015 Precision Agriculture Symposium 51
Figure 5
PrelimThe 7hsweet pwas in showedsecondthe loss
The yieof Varithat witthe var
Figure 6
With onas to thyear ofrelationsamplincooper
5. Soil condu
inary resuha trial fielpotato afte its second that thed year potases most li
eld of bothation (CV)th this leveriability cou
6. Comparis
nly one seahe cause of yield datanship is reng of EM rator consid
uctivity from
ultsld had var
er a sweet snd straighte area undato crop. Tikely due to
the first y) of 20%. el of variabuld be iden
on of soil E
ason of yieof the 20%a and soil
epeated in zones did
dered to ha
m EMI.
rying field sorghum gt season oder first yeThe coopero soil nem
year and seGross ma
bility there tified.
M Zones wi
eld data fro% CV in yie
EM. Hownearby fie
d show vaave relative
history, wgreen manof sweet pear potatorator and tatode effe
econd yeargin analymay be si
ith corrected
om this fieleld. Some
wever, furthelds in theariability inely uniform
with one haure break potato proo rotation their agronct in the ba
ar potato rosis demonignificant f
d yield.
ld, it is difficorrelatio
her investige next grow soil chem
m soil types
alf of the fcrop. The oduction. Cyielded 13
nomist felt ack-to-bac
otation arenstrated to inancial re
icult to dran was notegation is nwing seasomistry evens.
field beingother half
Corrected Y3% higherthis result
ck sweet po
eas had a Co the trial ceturns if the
aw many coed betwee
needed to on. Site-spn in a fiel
g first yearof the fieldYield datar than thequantified
otato.
Coefficientcooperatore cause of
onclusionsen this firstsee if this
pecific soild that the
rdaed
trf
stsl
e
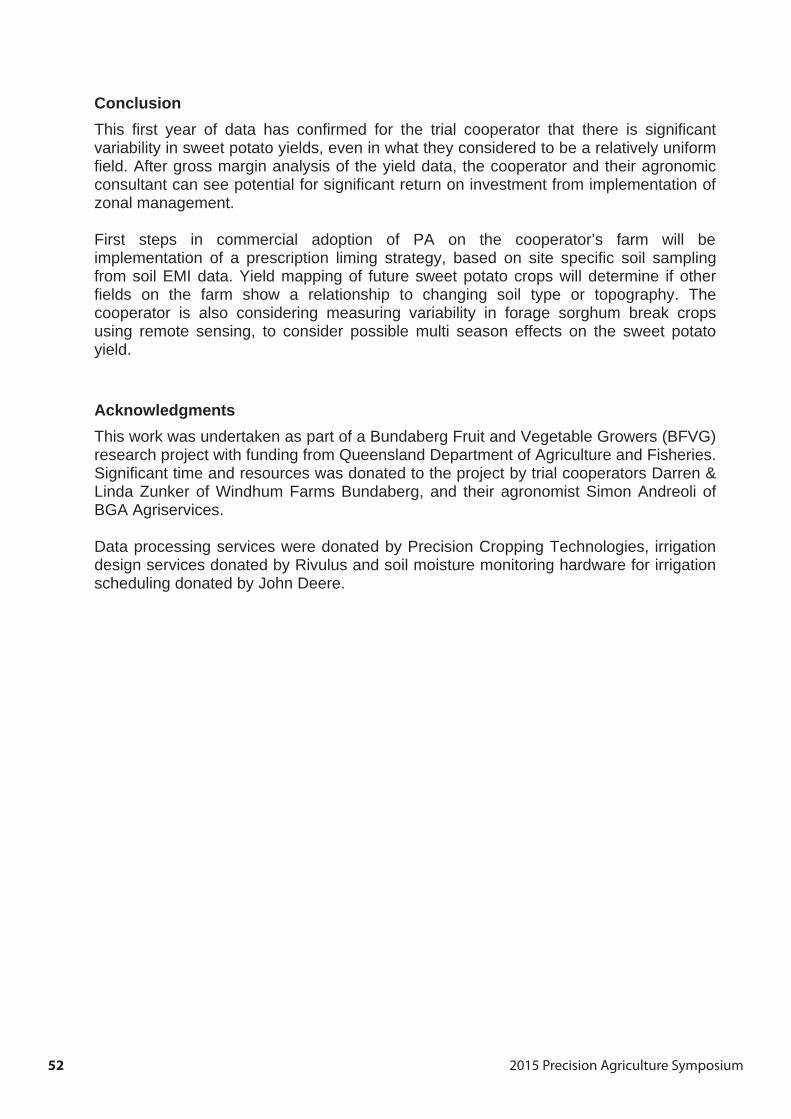
2015 Precision Agriculture Symposium52
ConclusionThis first year of data has confirmed for the trial cooperator that there is significant variability in sweet potato yields, even in what they considered to be a relatively uniform field. After gross margin analysis of the yield data, the cooperator and their agronomic consultant can see potential for significant return on investment from implementation of zonal management.
First steps in commercial adoption of PA on the cooperator’s farm will be implementation of a prescription liming strategy, based on site specific soil sampling from soil EMI data. Yield mapping of future sweet potato crops will determine if other fields on the farm show a relationship to changing soil type or topography. The cooperator is also considering measuring variability in forage sorghum break crops using remote sensing, to consider possible multi season effects on the sweet potato yield.
Acknowledgments This work was undertaken as part of a Bundaberg Fruit and Vegetable Growers (BFVG) research project with funding from Queensland Department of Agriculture and Fisheries. Significant time and resources was donated to the project by trial cooperators Darren & Linda Zunker of Windhum Farms Bundaberg, and their agronomist Simon Andreoli of BGA Agriservices.
Data processing services were donated by Precision Cropping Technologies, irrigation design services donated by Rivulus and soil moisture monitoring hardware for irrigation scheduling donated by John Deere.

2015 Precision Agriculture Symposium 53
Visit Local Land Services at the 18thPrecision Ag Symposium of AustralasiaCombined Murray & Riverina display
• Agriculture• Natural Resource Management• Emergency Services• Plant & Animal Biosecurity
2015 Precision Agriculture Symposium54
LiDAR, thermal and hyperspectral sensors for crop monitoring applications in PA
Jose Jimenez-Berni1,2; David Deery1,2
1CSIRO Agriculture, Clunies Ross St, Acton, ACT 2601 2High Resolution Plant Phenomics Centre, Clunies Ross St, Acton, ACT 2601
Contact: [email protected]
How can Phenomics help Precision Agriculture? Plant phenotyping (also known as phenomics) has become a new discipline where the use of remote and proximal sensing together with state of the art image analysis and big-data analysis algorithms are aiming to deliver value into agriculture by enabling breeders and crop physiologists to speed up the rate of yield improvement in major crops. High throughput field phenotyping is breaking the bottleneck of field monitoring of the crop performance and physiology on the individual cultivars in large scale breeding trials (Furbank & Tester, 2011).
By using technologies such as LiDAR (Light Detection And Ranging) for the measurement of the 3D canopy architecture it is possible to deliver multi temporal estimates of canopy attributes such as canopy height, ground cover, vertical distribution of leaf density, heads per unit area and ultimately biomass (Deery et al, 2014). Measuring canopy temperature by means of infrared thermography allows quantifying the water evaporation from the crop (as the crop evaporates water it cools down and the canopy temperature decreases, while under water stress and reduced transpiration the canopy temperature increases). And finally, measuring the spectral properties for the light reflected from the canopy provides an insight of the biochemical composition of the crop, including nutrition status and symptoms of biotic or abiotic stress.
Once demonstrated the effectiveness of these technologies for monitoring the crop status, these could be easily translated into management and rapidly adopted by precision agriculture (PA) in broad acre agriculture or in high value crops. In phenotyping, the accuracy of the measurements is critical for picking up the subtle differences between genotypes and avoiding the confounding effects caused by the natural differences occurring between genotypes. Even working with the same species (e.g. wheat), when screening a population one would find great differences between cultivars: presence or absence of awns, leaf dimensions, canopy architecture and height, etc. The methodologies developed in phenomics have to deal with these disparities and still sense the small differences that give a particular genotype some advantage over the others.
One of the biggest challenges for the translation from phenomics to precision agriculture applications is a matter of scale. Traditionally, even the largest field trials are relatively small compared with the farm scale and the standard extensions where PA is commonly used. Scaling up from the small trial to the farm scale will require the integration of the sensing technology into tractors, robots or aerial platforms (manned or unmanned), which should be relatively simple engineering problem. However, the volume of the data generated at these scales could become the limiting factor. The other challenge is the complexity of the technologies and methodologies used in phenomics, which normally
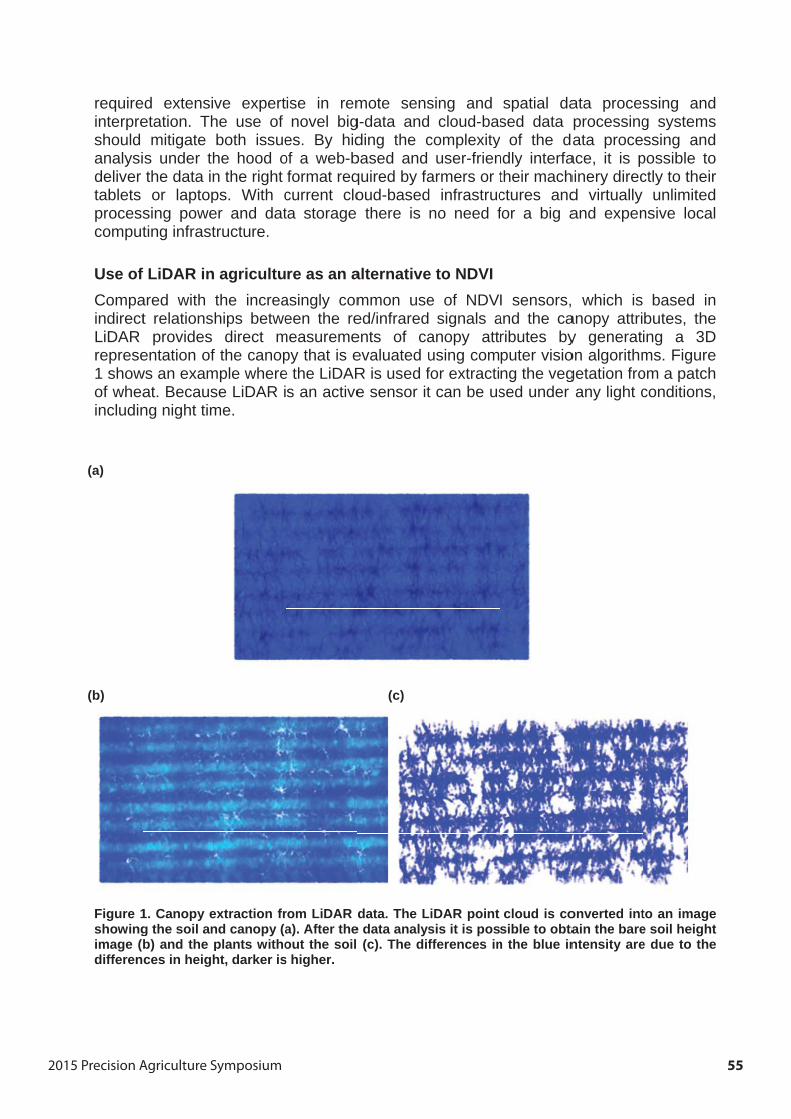
2015 Precision Agriculture Symposium 55
requireinterpreshouldanalysideliver tabletsprocesscomput
Use ofCompaindirectLiDAR represe1 showof wheaincludin
(a)
(b)
Figure 1showingimage (differen
ed extensivetation. Th
mitigates under ththe data inor laptop
sing poweting infrast
f LiDAR inared with t relations
providesentation of
ws an examat. Becausng night tim
1. Canopy eg the soil anb) and the pces in heigh
ve experthe use of both issuehe hood on the right ps. With cer and dattructure.
agricultuthe increahips betwe
direct mf the canop
mple wherese LiDAR ime.
extraction frnd canopy (aplants withoht, darker is
ise in remnovel big
es. By hidof a web-bformat reqcurrent clota storage
re as an aasingly comeen the re
measuremepy that is ee the LiDARs an active
rom LiDAR a). After theout the soil
s higher.
mote sensg-data andding the cbased and quired by faoud-based
there is
alternativemmon useed/infraredents of caevaluated uR is used fe sensor it
(c)
data. The Le data analys (c). The dif
sing and cloud-bas
complexityuser-frien
armers or td infrastrucno need f
e to NDVIe of NDV signals aanopy attusing comfor extractit can be us
LiDAR point sis it is posfferences in
spatial dased data
of the dndly interfatheir machctures andfor a big a
I sensors,and the caributes byputer visiong the vegsed under
cloud is cosible to obta
n the blue in
ata procesprocessingata proce
ace, it is phinery direcd virtually and expen
, which is anopy attriy generaton algorithmgetation froany light c
onverted intain the barentensity are
ssing andg systemsssing and
possible toctly to their
unlimitednsive local
based inbutes, theing a 3Dms. Figureom a patchconditions,
to an imagee soil heighte due to the
dsdordl
neDeh,
ete
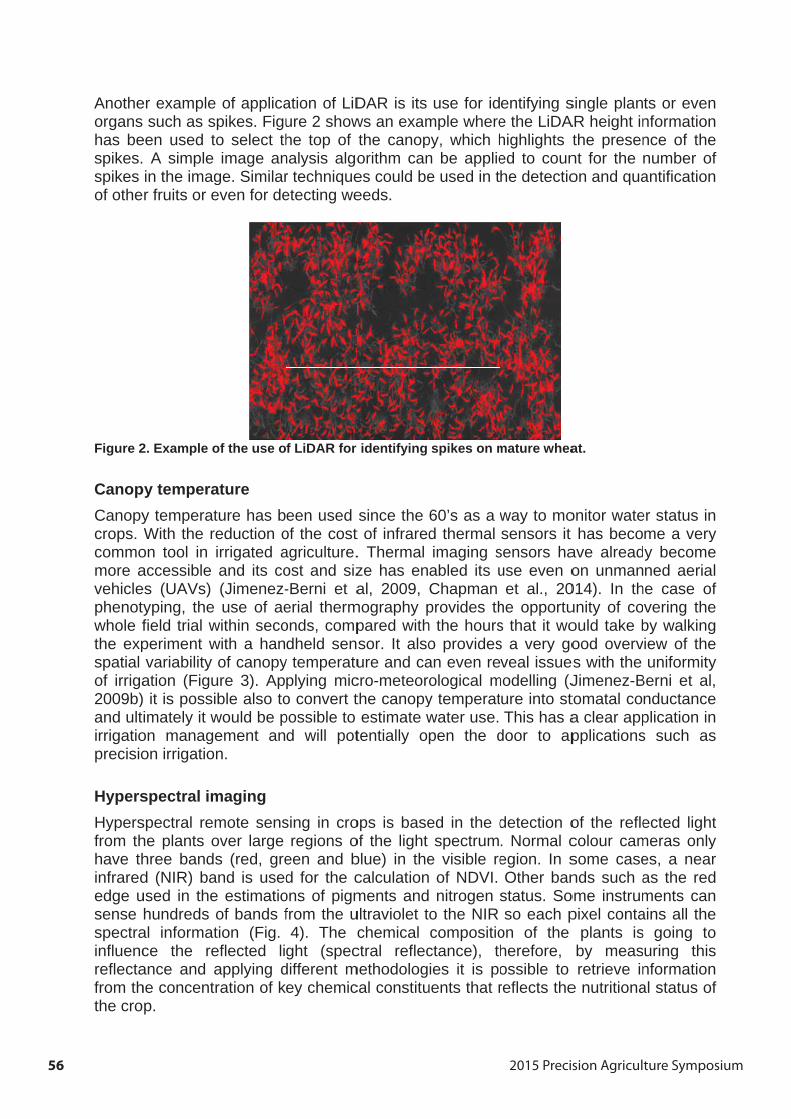
2015 Precision Agriculture Symposium56
Anotheorganshas bespikes.spikesof othe
Figure 2
CanopCanopycrops.commomore avehiclephenotwhole fthe expspatialof irriga2009b)and ultirrigatioprecisio
HypersHypersfrom thhave thinfrarededge usensespectrainfluencreflectafrom ththe cro
er example such as s
een used t A simple in the imagr fruits or e
2. Example o
py temperay temperatWith the r
on tool in accessiblees (UAVs) typing, thefield trial wperiment wvariabilityation (Figu) it is possiimately it w
on managon irrigatio
spectral imspectral rehe plants ohree bandd (NIR) baused in thehundreds
al informatce the reance and ahe concentp.
e of applicaspikes. Figuto select th
image ange. Similareven for de
of the use o
atureture has breduction oirrigated aand its co(Jimenez-
use of aewithin secowith a hanof canopy
ure 3). Apible also towould be pement ann.
magingmote sensover large s (red, gre
and is usede estimatioof bands ftion (Fig. eflected liapplying dration of k
ation of LiDure 2 showhe top of
nalysis algor techniqueetecting we
f LiDAR for
een used of the cost agriculture.ost and siz-Berni et aerial thermonds, compdheld sen
y temperatuplying mico convert tpossible to d will pot
sing in croregions o
een and bd for the c
ons of pigmfrom the u4). The c
ght (specdifferent mey chemic
DAR is its ws an examthe canoporithm canes could beeeds.
identifying
since the t of infrared. Thermal ze has enal, 2009,
mography ppared withsor. It alsoure and ca
cro-meteorthe canopyestimate w
tentially o
ops is baseof the light blue) in thecalculationments andultraviolet tchemical
ctral reflecmethodologcal constitu
use for idmple wherepy, which hn be appliee used in t
spikes on m
60’s as a wd thermal imaging sabled its uChapman provides thh the hourso providesan even reological my temperatwater use. pen the d
ed in the dspectrum
e visible re of NDVI. nitrogen o the NIR compositioctance), thies it is po
uents that r
entifying se the LiDAhighlights ed to counhe detectio
mature whea
way to mosensors it
sensors hause even oet al., 20
he opportus that it wos a very goveal issue
modelling (Jure into stThis has a
door to ap
detection o. Normal cegion. In sOther ban
status. Soso each p
on of the herefore,ossible to reflects the
single planAR height in
the presennt for the on and qua
at.
onitor watehas beco
ave alreadon unman
014). In thunity of coould take bood overv
es with the Jimenez-Btomatal coa clear apppplications
of the reflecolour camsome casends such a
ome instrumpixel conta
plants isby measretrieve in
e nutritiona
ts or evennformationnce of thenumber ofantification
er status inme a veryy becomened aerial
he case ofvering theby walkingiew of theuniformity
Berni et al,nductanceplication ins such as
ected lightmeras onlyes, a nearas the redments canains all thes going touring thisnformational status of
nnef
n
nyelfegey,ens
tyrdneosnf
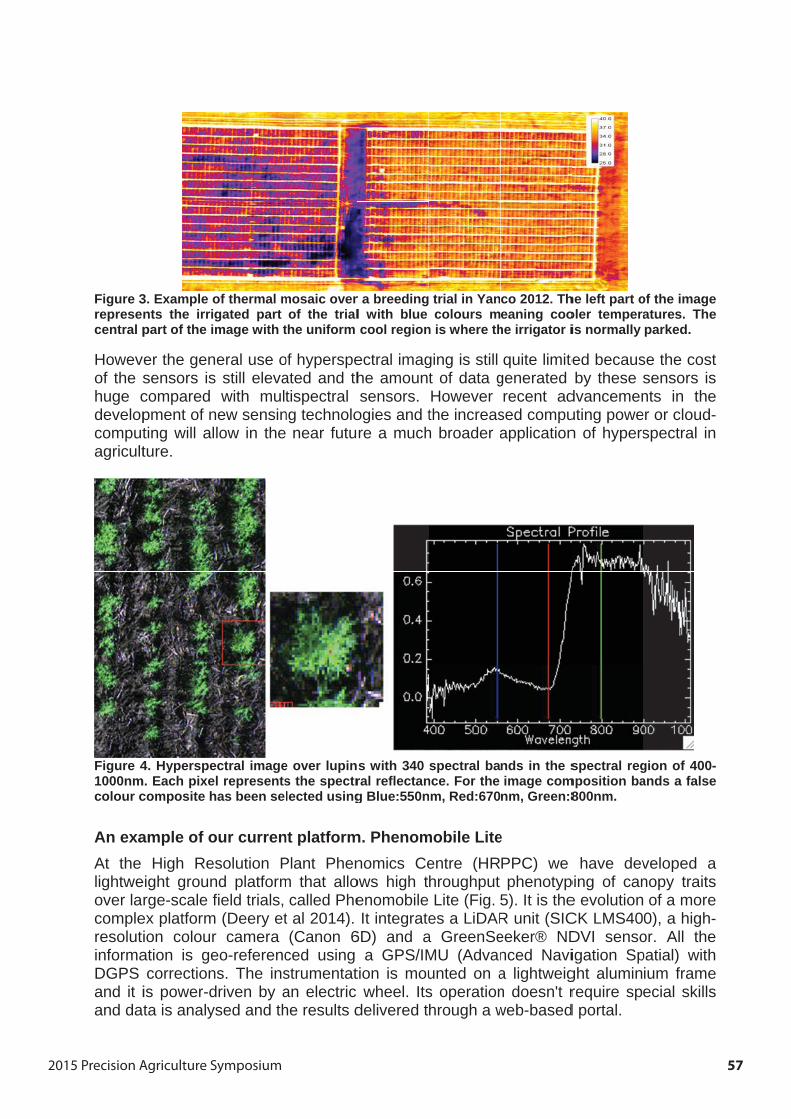
2015 Precision Agriculture Symposium 57
Figure 3represecentral p
Howevof the shuge cdevelopcomputagricult
Figure 41000nmcolour c
An exaAt the lightweover lacompleresolutinformaDGPSand it iand da
3. Example onts the irripart of the i
er the gensensors iscomparedpment of nting will alture.
4. Hyperspem. Each pixecomposite h
ample of oHigh Re
eight grounrge-scale f
ex platformion colouration is gecorrection
is power-dta is analy
of thermal mgated part mage with t
neral use os still eleva
with multnew sensinlow in the
ectral imageel representshas been se
our currensolution P
nd platformfield trials,
m (Deery etr camera eo-referencns. The insdriven by aysed and th
mosaic overof the trial
the uniform
of hyperspeated and thtispectral
ng technolo near futu
e over lupins the spectrlected using
nt platformPlant Phenm that allo
called Phet al 2014). (Canon 6
ced using strumentatan electric he results d
r a breedingl with blue cool region
ectral imaghe amounsensors.
ogies and tre a much
s with 340 ral reflectang Blue:550n
m. Phenomnomics Ceows high tenomobileIt integrate
6D) and aa GPS/IM
tion is mouwheel. Its
delivered t
trial in Yancolours m
n is where th
ging is still t of data gHowever the increash broader a
spectral bance. For the nm, Red:670
mobile Liteentre (HRhroughputLite (Fig.
es a LiDARa GreenSeMU (Advanunted on as operationhrough a w
co 2012. Theaning coo
he irrigator i
quite limitegeneratedrecent ad
sed compuapplication
nds in the simage comnm, Green:8
ePPC) we phenotyp
5). It is theR unit (SICeeker® NDnced Navia lightweign doesn't rweb-based
he left part ooler temperais normally
ed becausby these
dvancemenuting powen of hypers
spectral regmposition ba
800nm.
have devping of cane evolutionCK LMS40DVI sensoigation Spght aluminrequire sp
d portal.
of the imageatures. Theparked.
se the costsensors isnts in the
er or cloud-spectral in
gion of 400-ands a false
veloped anopy traits of a more0), a high-
or. All thepatial) withium frameecial skills
ee
tse-n
-e
ase-ehes
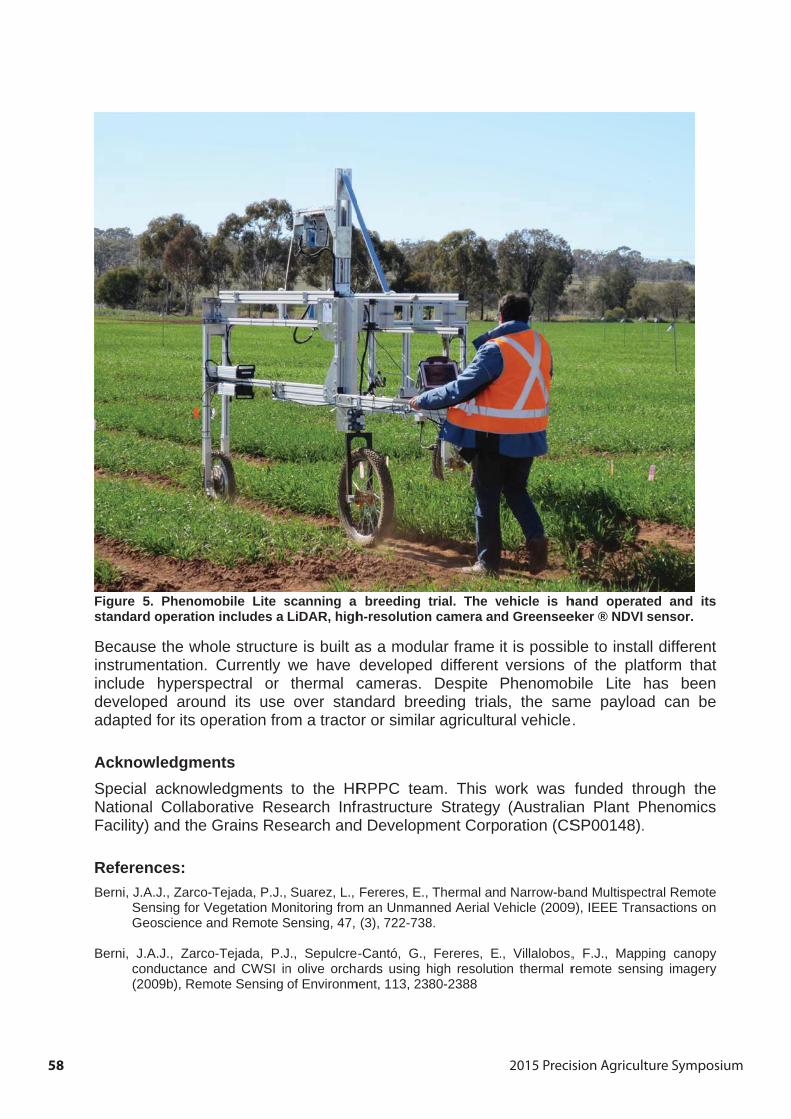
2015 Precision Agriculture Symposium58
Figurestandard
Becausinstrumincludedevelopadapte
AcknowSpeciaNationaFacility
RefereBerni, J.
SeGe
Berni, Jco(2
5. Phenomod operation
se the whomentation.e hyperspeped around for its op
wledgmenl acknowleal Collaboy) and the G
ences:A.J., Zarco-Tensing for Veeoscience an
.A.J., Zarcoonductance a2009b), Remo
obile Lite s includes a
ole structurCurrentlyectral or
nd its use peration fro
ntsedgments
orative ResGrains Res
Tejada, P.J.,egetation Mond Remote S
-Tejada, P.Jand CWSI inote Sensing
scanning a LiDAR, high
re is built awe have thermal cover stan
om a tracto
to the HRsearch Infrsearch and
Suarez, L., onitoring fromSensing, 47,
J., Sepulcren olive orchaof Environm
breeding th-resolution
as a modudevelopedcameras.ndard breeor or simila
RPPC tearastructured Developm
Fereres, E., m an Unman(3), 722-738
-Cantó, G., ards using h
ment, 113, 23
trial. The vn camera an
ular frame d different
Despite eding trial
ar agricultu
am. This we Strategyment Corpo
Thermal andned Aerial V
8.
Fereres, Ehigh resolutio80-2388
vehicle is hd Greensee
it is possibversions
Phenomobs, the samral vehicle
work was (Australia
oration (CS
d Narrow-baVehicle (2009
., Villalobos,on thermal r
hand operateker ® NDVI
ble to instaof the pla
bile Lite me payloa.
funded than Plant PSP00148).
and Multispec9), IEEE Tran
, F.J., Mappremote sens
ted and itssensor.
all differentatform thathas been
ad can be
hrough thePhenomics.
ctral Remotensactions on
ping canopysing imagery
s
tt
ne
es
en
yy

2015 Precision Agriculture Symposium 59
Deery, D.; Jimenez-Berni, J.; Jones, H.; Sirault, X.; Furbank, R. Proximal Remote Sensing Buggies and Potential Applications for Field-Based Phenotyping (2014), Agronomy, 4, 349-379.
Chapman, S.; Merz, T.; Chan, A; Jackway, P; Hrabar, S.; Dreccer, F.; Holland, E.; Zheng, B. Ling, T.; Jimenez-Berni, J.; Pheno-copter: a low-altitude, autonomous remote-sensing robotic helicopter for high-throughput field-based phenotyping. (2014). Agronomy 4 (2), 279-301
Furbank, R.; Tester, M. Phenomics - technologies to relieve the phenotyping bottleneck. (2011), Trends in plant sciences. 12, 635-44
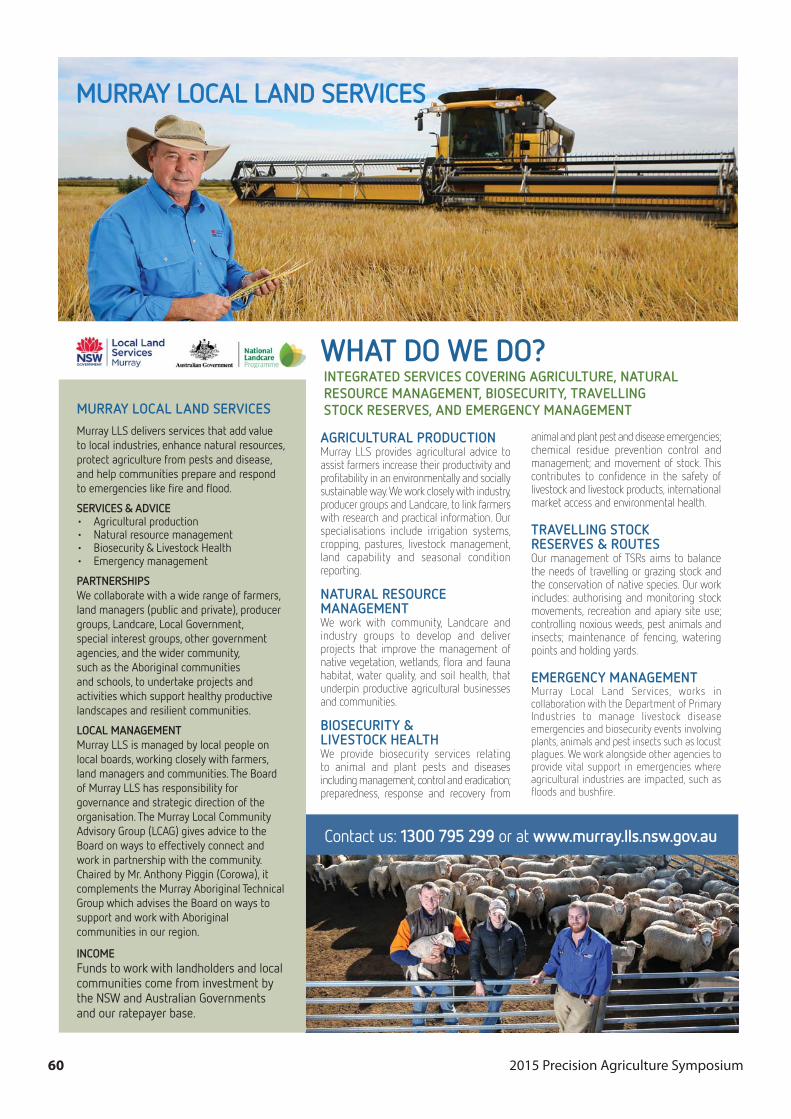
2015 Precision Agriculture Symposium60

2015 Precision Agriculture Symposium 61
PA for sustainable farming
2015 Precision Agriculture Symposium62
Big farms, big pictures, big solutions: the future of satellite imagery and UAVs in broad acre farming
Ben Boughton Grain Farmer in Moree NSW, Nuffield Scholar, Satamap founder
Contact: [email protected]
IntroductionThe unmanned aerial vehicles (UAVs) or drones trend combined with so called 'big data' has seen a renewed interest in remotely sensed data in farming. This, generally, is a positive step forward for Australian agriculture as there is increased discussion and investment into new developments and the associated enablement of similar technologies which have been around for a long time but with minimal uptake. The overarching idea is that with data we can make better decisions which improve profitability and other benefits such as environmental and social.
This article aims to give a broad overview of some current remote sensing technologies and platforms. The obvious exclusion in this article is manned aircraft which is not covered as the author has limited experience and exposure in comparison with satellite imagery and drones.
Drones
What have drones enabled? o Reduced the entry point cost for high resolution remotely sensed data o Data at spatial resolutions not seen before (e.g. 1 cm) o Increased flexibility in the type and timeliness of remotely sensed data
collectedo Sensor choices increasing rapidly o Rapid data turn around possible (roadblocks exist)
What are the real world challenges for broadacre farming?
Cost:Benefito With already tight margins in the sector there needs to be consistent results
from data – where is the gain going to come from? VRA maps? Weed location maps? DEMs?
o Data collection price still too high – the data is often better (not always) than alternative, but no-one wants it if it costs more with little extra benefit
Data movement, storage, processing etc o Drone data is very intense if stored at its native resolution, the challenge is not
so much in processing and storage any more – there are heaps of good online solutions. The issue is moving the data online in the first place.
o Telstra 4G connections are good but limited by coverage and data costs, although $10/GB for Telstra 4G now is encouraging but speeds unreliable if service is busy
o Uploading via ADSL back in office in town is too slow – 40-100kb/s maybe
2015 Precision Agriculture Symposium 63
o Express Post HDD with a weeks worth of raw images to someone with NBN/Fibre connection is still probably fastest method
o Processing in office an option but big investment and will cause more headaches than you think
Spatial accuracy o If data is collected at 1-5cm resolution to identify very small targets then the
positional accuracy needs to be just as good. This may be able to be achieved with a combination of ground control points, RTK GPS and quality processing but at what cost?
Spectral accuracy o Remote sensing is often measuring reflectance from a light source we have no
control over (sun) that has to travel through an atmosphere that we also have no control over. There are a plethora of variables that limit consistency of data especially if collected through cheap modified handheld cameras.
o This has been covered extensively here: http://agmapsonline.com/?p=830
Legalities o Exciting that we should be able to fly for any purpose under 2kg – a farmer can
go buy and fly an eBee if they want control over the whole process o To cover areas in broad acre farming at an attractive price there needs to be
allowances to fly higher and out of line of sight
Satellite Imagery
What's new in optical Satellite Imagery? o Landsat 8 archive growing – 15-30m imagery back to winter 2013 – Free
access!o Sentinel-2 in orbit and all reports are good – 10m imagery at 10 day interval,
some new red edge bands coming – Free access!o Planet Labs have launched over 100 micro satellites and plan to offer daily
imageryo 3-5m resolution, not sure of spectral bands or priceo Spot, RapidEye, QUickbird etc all existing options, price not changed
substantially
Discussion For broadacre farming, basically it comes down to drones and satellite imagery compliment each other and one is not a replacement for the other. The extra work that goes in to collecting good quality data from drones needs to be supported by a return. Landsat 8 and Sentinel-2 offer imagery that is far more course than anything from a drone (500 to 1000+ times) which means they are designed for different type of work.
Access to Landsat 8 and Sentinel-2 soon means 4-5 scenes a month, free to access raw and very cheap to access fully processed. Realistically the use case needs to be there to warrant spending extra on such high resolution imagery from other satellite or even a drone. Free/cheap satellite data gives very small number to cost in the cost

2015 Precision Agriculture Symposium64
benefit ratio so benefit only has to be small to make it worthwhile. Drones fit here when the benefit number outdoes the extra cost which will be true in some cases.
It is worth keeping a close eye on advancements in satellite imagery over the next 10 years as there is significant investment from California being sent that way but in saying that a lot of promises do come out of Silicon Valley that are not always delivered.
Drone processes will continue to improve as will our infrastructure to get data from the sensor to an online environment for processing. There is space for LOCAL innovation here.
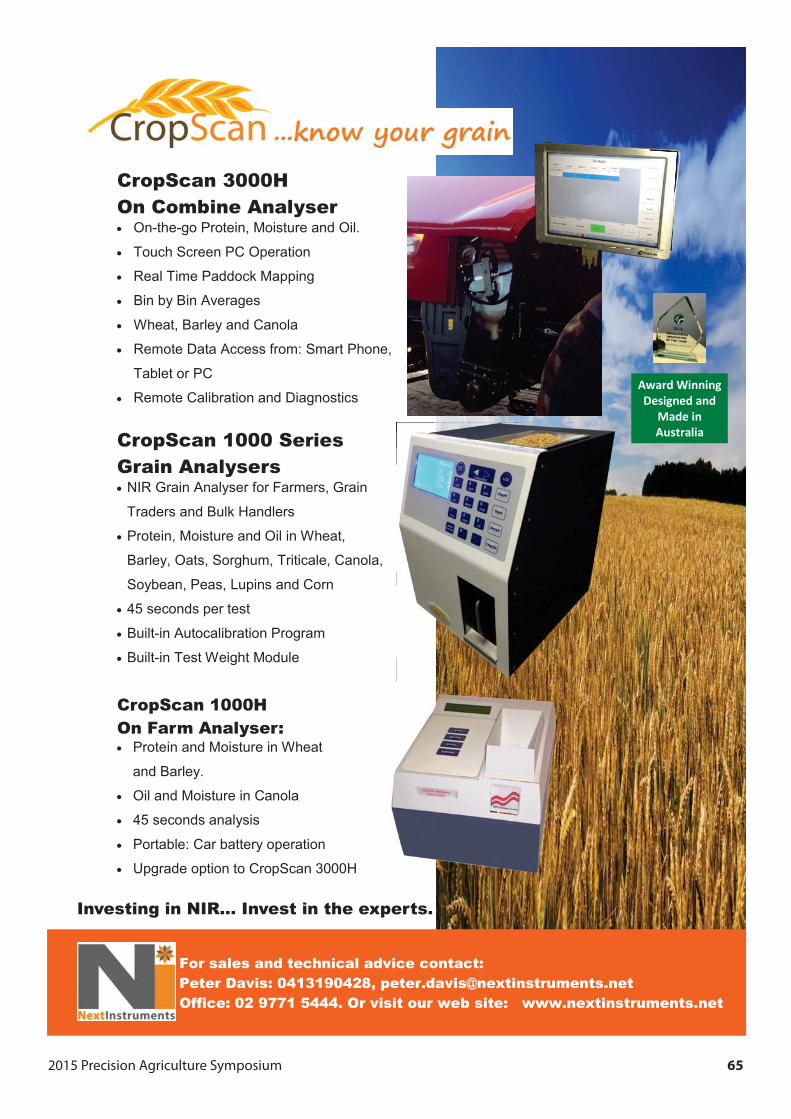
2015 Precision Agriculture Symposium 65
CropScan 1000 Series Grain Analysers
NIR Grain Analyser for Farmers, Grain
Traders and Bulk Handlers
Protein, Moisture and Oil in Wheat,
Barley, Oats, Sorghum, Triticale, Canola,
Soybean, Peas, Lupins and Corn
45 seconds per test
Built-in Autocalibration Program
Built-in Test Weight Module
For sales and technical advice contact: Peter Davis: 0413190428, [email protected] Office: 02 9771 5444. Or visit our web site: www.nextinstruments.net
Award Winning Designed and
Made in Australia
CropScan 1000H On Farm Analyser:
Protein and Moisture in Wheat
and Barley.
Oil and Moisture in Canola
45 seconds analysis
Portable: Car battery operation
Upgrade option to CropScan 3000H
CropScan 3000H On Combine Analyser
On-the-go Protein, Moisture and Oil.
Touch Screen PC Operation
Real Time Paddock Mapping
Bin by Bin Averages
Wheat, Barley and Canola
Remote Data Access from: Smart Phone,
Tablet or PC
Remote Calibration and Diagnostics
Investing in NIR… Invest in the experts.
2015 Precision Agriculture Symposium66
Developments in on-harvester quality monitoring
Phillip Clancy1, Ashley Wakefield2, Brett Whelan3
1Next Instruments Pty Ltd 2Tintara Pastoral, Urania, SA 3PA Laboratory, Faculty of Agriculture and Environment, The University of Sydney
Contact: [email protected]
Summary Near Infrared Transmission spectroscopy is used throughout the world to measure protein, moisture and oil in cereal grains and oil seeds. In recent years, there has been a growing trend amongst Australian growers to set up their own on-farm storage systems and to use portable or benchtop NIR analysers to assess the quality and therefore the value of their crops.
Over the last three years, Next Instruments, an Australian company that designs and manufactures NIR analysers for farmers and grain processors, has been finalising the development of an On-Combine NIR analyser. This system, called the CropScan 3000H On-Combine Analyser, has been designed to measure grain collected from the clean grain elevator every 11 seconds and report the protein, moisture and oil in real time on a touch screen PC located inside the combine’s cabin. By collecting the GPS readings at the same time as the NIR data is generated, then real time protein paddock maps can be displayed on the in cabin screen. This has provided users with the ability to segregate grain in the paddock as well as make decisions on which silos or bins to store their grain.
As for Precision Agriculture, the benefit of the system is to provide Protein Paddock Maps that can be compared with the yield and moisture maps in order to optimize the use of Nitrogen fertilizer through variable-rate fertilization application.
This paper presents a review of the CropScan 3000H On-Combine Analyser and provides examples of two paddocks where protein, moisture and yield data was collected using the system during the 2014 harvest.
Instrument Description Figure 1 shows a schematic of the CropScan 3000H system. The Sampling Head is a device that is mounted to the clean grain elevator so that grain falls into the top of the sample head from the up side of the elevator. Light passes through the trapped grain and is collected using a fibre optic bundle and passed back to the CropScan Near Infrared spectrometer that is located inside the cabin. The grain is released into the down side of the elevator. The protein, moisture and oil data are sent to the Touch Screen PC which also takes the GPS coordinates from a GPS transponder. This cycle is repeated at a frequency of approximately 5 times per minute, i.e. 11-14 seconds per measurement.
The data is combined to generate Protein paddock maps, real time tables showing the each protein, moisture and oil reading, a moving average and the bin average. A
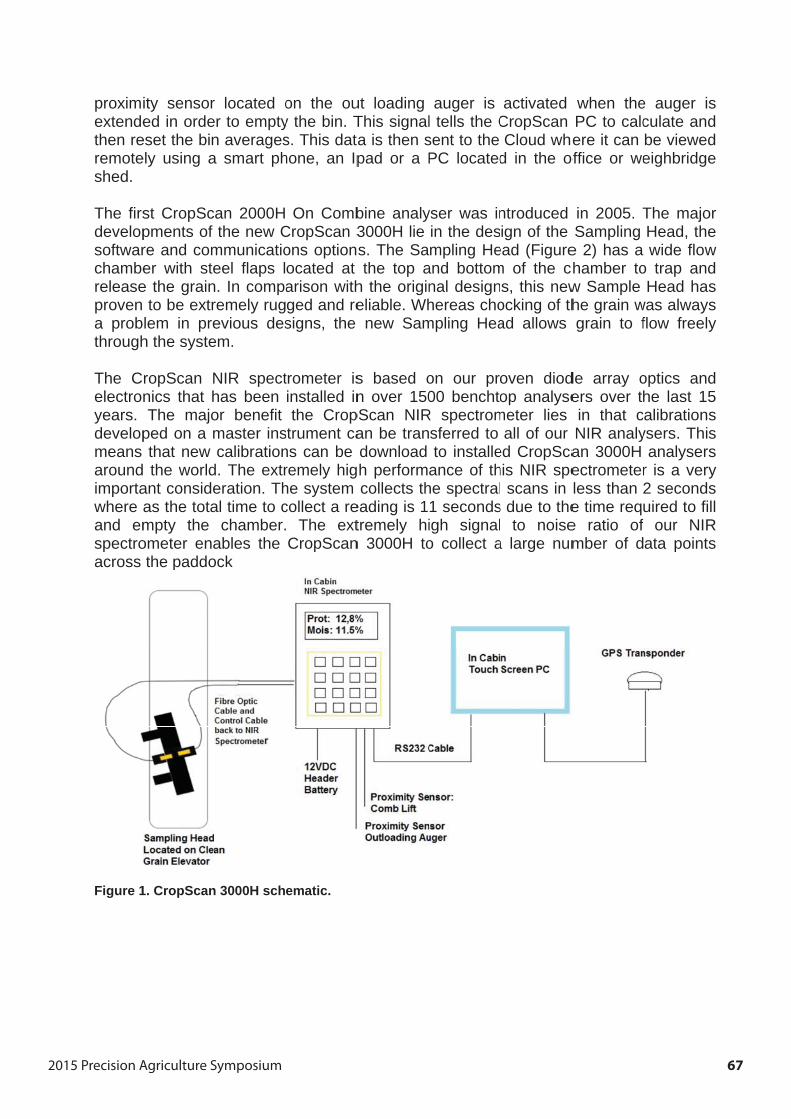
2015 Precision Agriculture Symposium 67
proximextendethen reremoteshed.
The firsdevelopsoftwarchambereleaseprovena probthrough
The Celectroyears.developmeansaroundimportawhereand emspectroacross
Figure 1
ity sensored in orde
eset the binely using a
st CropScpments of re and comer with ste
e the grain to be extrlem in preh the syste
ropScan Nnics that hThe majo
ped on a mthat new the world
ant consideas the totampty the ometer enathe paddo
1. CropScan
r located oer to emptyn averagesa smart ph
an 2000Hthe new C
mmunicatioeel flaps l
n. In comparemely rugevious desem.
NIR specthas been or benefit master inscalibration
d. The extreration. Thal time to c
chamber.ables the
ock
n 3000H sch
on the ouy the bin. Ts. This dathone, an Ip
On CombCropScan 3ons optionocated at arison withged and resigns, the
trometer isinstalled inthe Crop
strument cans can be remely highe system collect a re The extCropScan
ematic.
ut loading This signala is then spad or a P
bine analy3000H lie s. The Sathe top a
h the origineliable. Wh
new Sam
s based on over 150
pScan NIRan be trandownloadh performcollects th
eading is 1tremely hi
n 3000H to
auger is l tells the Csent to the PC located
yser was inin the desmpling He
and bottomnal designhereas cho
mpling Hea
on our pr00 benchto
R spectromsferred to to installe
ance of thhe spectral1 secondsigh signalo collect a
activatedCropScan Cloud wh
d in the o
ntroducedign of the
ead (Figurem of the c
s, this newocking of thad allows
oven diodop analyse
meter lies all of our
ed CropScahis NIR spe scans in
s due to the to noise
a large num
when thePC to calcere it can
office or we
in 2005. TSampling
e 2) has achamber tow Sample he grain wgrain to f
de array oers over tin that cNIR analyan 3000H ectrometerless than e time reqe ratio ofmber of d
e auger isculate andbe viewedeighbridge
The majorHead, thewide flow
o trap andHead has
was alwaysflow freely
optics andhe last 15
calibrationsysers. This
analysersr is a very2 secondsuired to fillf our NIRata points
sdde
rewdssy
d5sssysl
Rs
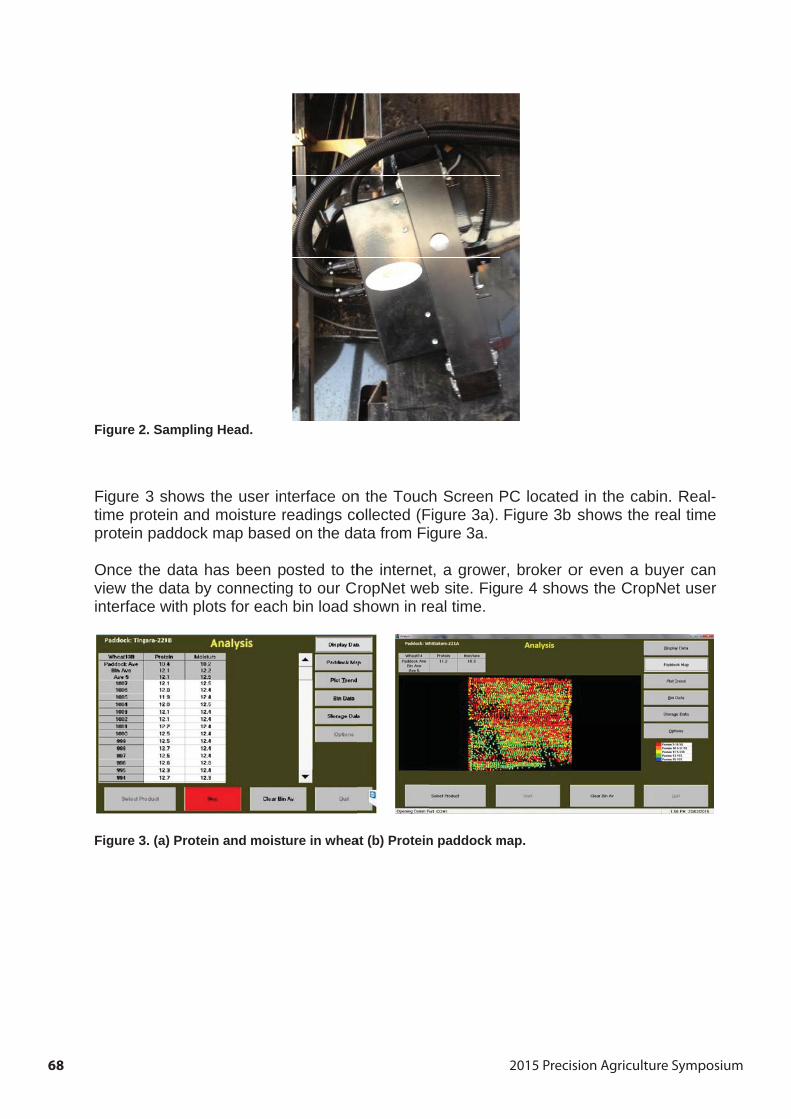
2015 Precision Agriculture Symposium68
Figure 2
Figuretime prprotein
Once tview thinterfac
Figure 3
2. Sampling
3 shows trotein and paddock m
the data hahe data by ce with plot
3. (a) Protein
Head.
the user inmoisture rmap based
as been pconnectingts for each
n and moist
nterface onreadings cod on the da
osted to thg to our C
h bin load s
ure in whea
n the Toucollected (Fata from Fi
he internetropNet weshown in re
at (b) Protein
h Screen Figure 3a). gure 3a.
t, a groweeb site. Figeal time.
n paddock m
PC locatedFigure 3b
r, broker oure 4 show
map.
d in the ca shows the
or even a ws the Cro
abin. Real-e real time
buyer canopNet user
-e
nr
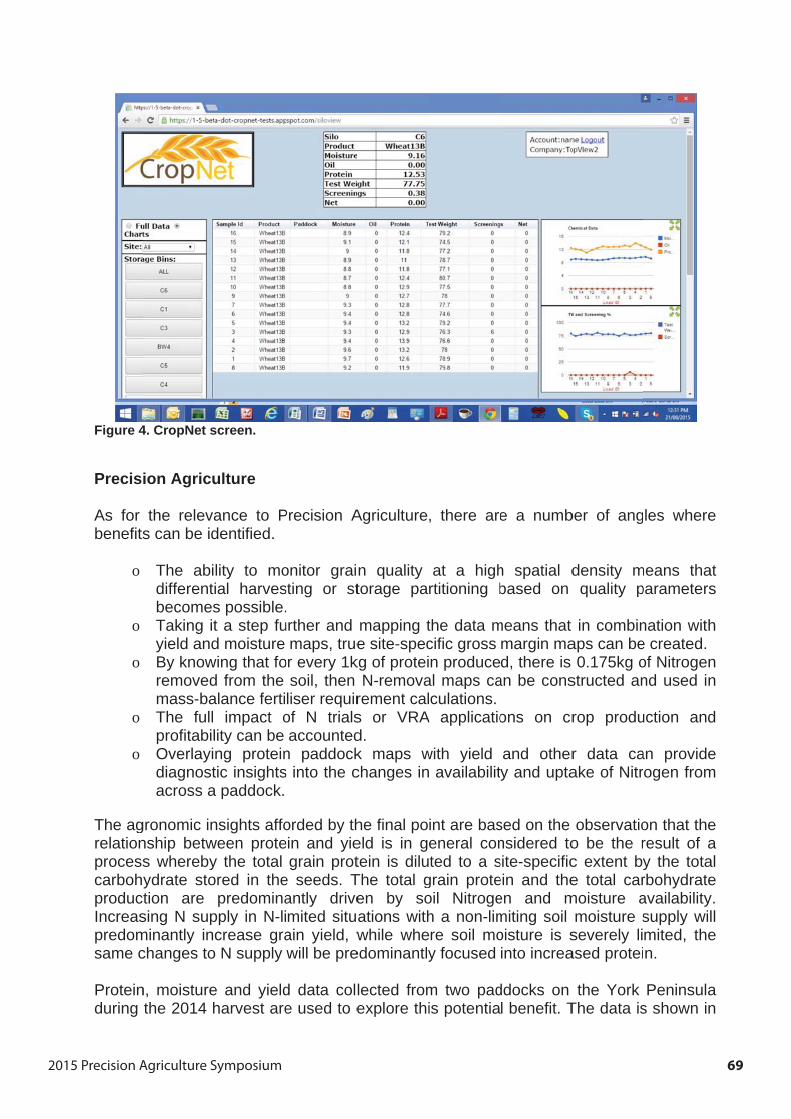
2015 Precision Agriculture Symposium 69
Figure 4
Precis
As for benefits
o
o
o
o
o
The agrelationprocesscarbohproducIncreaspredomsame c
Proteinduring
4. CropNet s
ion Agricu
the relevas can be id
The abidifferentbecomesTaking ityield andBy knowremovedmass-baThe full profitabilOverlayidiagnostacross a
gronomic innship betws wherebyydrate sto
ction are sing N supminantly inchanges to
n, moisturethe 2014 h
screen.
ulture
ance to Pdentified.
lity to moial harvess possible.t a step fud moisture
wing that fod from the alance ferti
impact olity can be ng proteintic insightsa paddock.
nsights affoween protey the total ored in the
predominapply in N-licrease gra
o N supply
e and yieldharvest are
Precision A
onitor graisting or st.
urther and maps, true
or every 1ksoil, then liser requirof N trialsaccounted
n paddocks into the c
orded by thein and yie
grain prote seeds. Tantly drivemited situain yield, wwill be pre
d data colle used to e
Agriculture
n quality torage pa
mapping te site-spec
kg of proteiN-remova
rement cals or VRAd.k maps wchanges in
he final poeld is in gtein is diluThe total gen by soations withwhile whe
edominantly
lected fromexplore thi
, there are
at a highrtitioning b
the data mcific gross n produce
al maps caculations.
A applicatio
with yield availabilit
int are baseneral conted to a s
grain proteoil Nitrogeh a non-lim
ere soil moy focused
m two padis potentia
e a numb
h spatial dbased on
means that margin mad, there is
an be cons
ons on cr
and othery and upta
sed on the nsidered tosite-specificein and theen and mmiting soil oisture is sinto increa
ddocks on l benefit. T
ber of ang
density mquality p
t in combinaps can be 0.175kg ostructed an
rop produ
r data caake of Nitr
observatioo be the rc extent be total car
moisture amoisture s
severely liased protei
the York The data is
les where
means thatparameters
nation withe created.of Nitrogennd used in
uction and
an providerogen from
on that theresult of ay the totalrbohydrateavailability.supply willmited, then.
Peninsulas shown in
e
ts
h
nn
d
em
eal
e.l
e
an
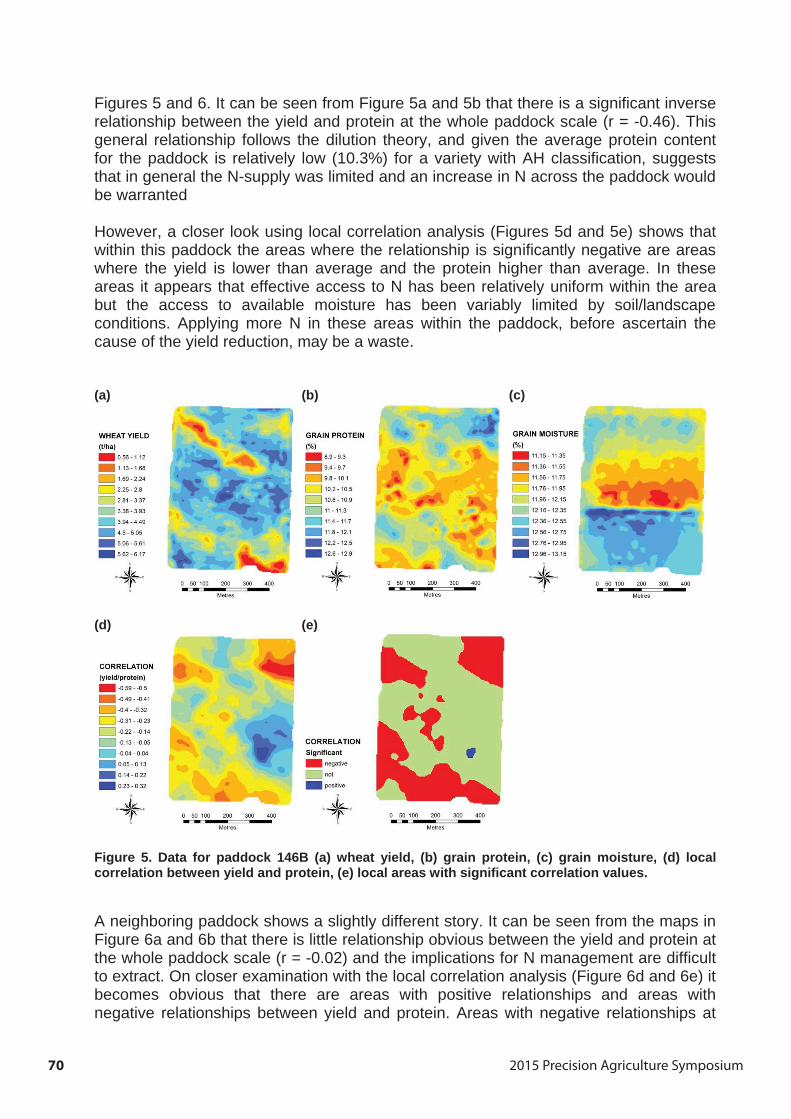
2015 Precision Agriculture Symposium70
Figures 5 and 6. It can be seen from Figure 5a and 5b that there is a significant inverse relationship between the yield and protein at the whole paddock scale (r = -0.46). This general relationship follows the dilution theory, and given the average protein content for the paddock is relatively low (10.3%) for a variety with AH classification, suggests that in general the N-supply was limited and an increase in N across the paddock would be warranted
However, a closer look using local correlation analysis (Figures 5d and 5e) shows that within this paddock the areas where the relationship is significantly negative are areas where the yield is lower than average and the protein higher than average. In these areas it appears that effective access to N has been relatively uniform within the area but the access to available moisture has been variably limited by soil/landscape conditions. Applying more N in these areas within the paddock, before ascertain the cause of the yield reduction, may be a waste.
(a) (b) (c)
(d) (e)
Figure 5. Data for paddock 146B (a) wheat yield, (b) grain protein, (c) grain moisture, (d) local correlation between yield and protein, (e) local areas with significant correlation values.
A neighboring paddock shows a slightly different story. It can be seen from the maps in Figure 6a and 6b that there is little relationship obvious between the yield and protein at the whole paddock scale (r = -0.02) and the implications for N management are difficult to extract. On closer examination with the local correlation analysis (Figure 6d and 6e) it becomes obvious that there are areas with positive relationships and areas with negative relationships between yield and protein. Areas with negative relationships at
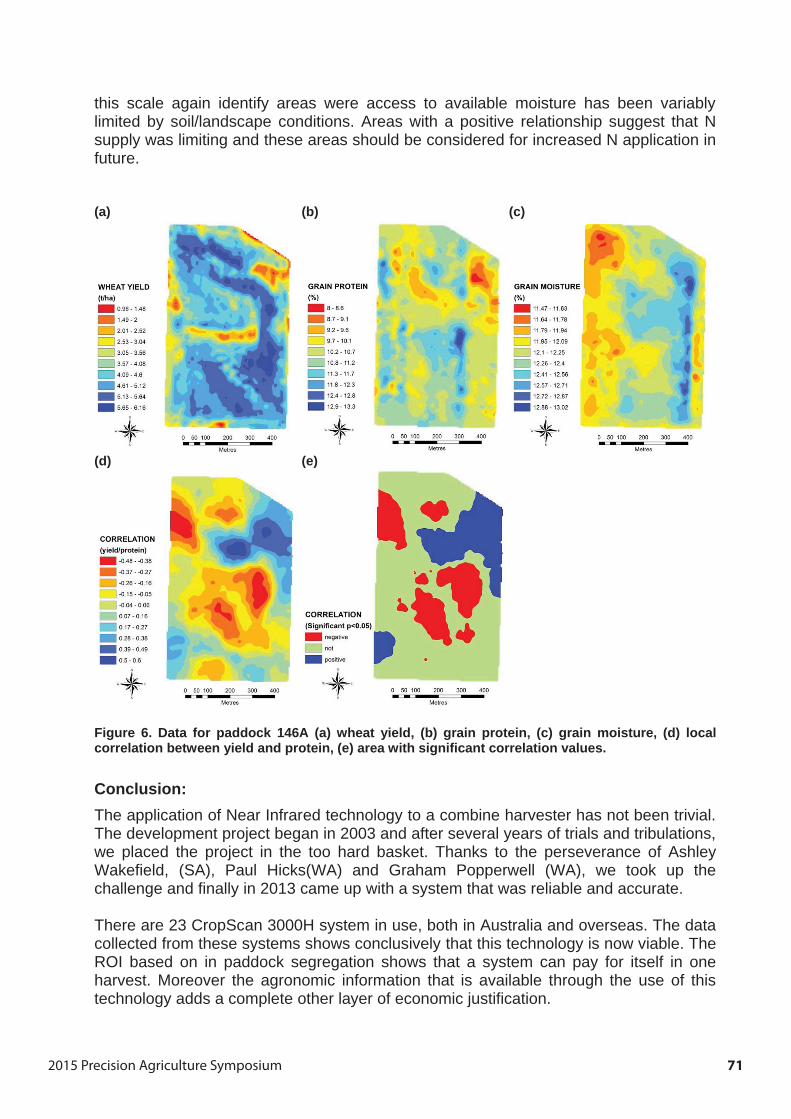
2015 Precision Agriculture Symposium 71
this scale again identify areas were access to available moisture has been variably limited by soil/landscape conditions. Areas with a positive relationship suggest that N supply was limiting and these areas should be considered for increased N application in future.
(a) (b) (c)
(d) (e)
Figure 6. Data for paddock 146A (a) wheat yield, (b) grain protein, (c) grain moisture, (d) local correlation between yield and protein, (e) area with significant correlation values.
Conclusion:The application of Near Infrared technology to a combine harvester has not been trivial. The development project began in 2003 and after several years of trials and tribulations, we placed the project in the too hard basket. Thanks to the perseverance of Ashley Wakefield, (SA), Paul Hicks(WA) and Graham Popperwell (WA), we took up the challenge and finally in 2013 came up with a system that was reliable and accurate.
There are 23 CropScan 3000H system in use, both in Australia and overseas. The data collected from these systems shows conclusively that this technology is now viable. The ROI based on in paddock segregation shows that a system can pay for itself in one harvest. Moreover the agronomic information that is available through the use of this technology adds a complete other layer of economic justification.

2015 Precision Agriculture Symposium72
PCT have been providing world-class precision agriculture (PA) solutions and services for over a decade. PCT are industry leaders in the provision of software tools, data processing, agronomic, irrigation and landforming solutions as well as
PA consulting services throughout Australia, New Zealand and North America.
Growers rely on PCT solutions everyday to: Maximise yields
Analyse data Minimise risk
Make informed decisions
For more information or to be put in touch with one of our dealers give us a call
Michael Wells, Crystal Brook SA Ph: 0428 362474 I Andrew Smart, Narrabri NSW Ph: 0428 922638
www.pct-ag.com
Precision Cropping Technologies Pty Ltd
PCT deliver your data with PCT Gateway; a suite of powerful, comprehensive, but simple to use PA software tools that gives you full
control and analysis of your Precision Agriculture data.
Now you can access your data online
with PCT AgCloud
Turn your data or images into true PA Solutions to optimise yield, increase quality, manage Inputs and boost your profitability
2015 Precision Agriculture Symposium 73
Update on irrigation control, PA developments in sugar and augmented reality information delivery
Steven Rees National Centre for Engineering in Agriculture, University of Southern Queensland.
Contact: [email protected]
The National Centre for Engineering in Agriculture (NCEA) is a research centre of the University of Southern Queensland comprising five focus areas. These areas are Automation Robotics and Machine vision (ARM), Energy, Soils, Precision Agriculture and Irrigation. This presentation provides an update on research being undertaken in irrigation and precision agriculture as well as outlining information delivery via augmented reality operating at a NCEA demonstration site, for farmers and researchers.
IrrigationAutomated irrigation control systems have the potential to significantly improve crop yields and water use efficiency by determining and applying only the required irrigation volume, when and where it is needed. An approach for irrigation control systems uses publicly available models (e.g. APSIM), executed iteratively with different irrigation volumes and timings to identify the irrigation combination that maximises the predicted end-of-season yield. Model-based control systems have been evaluated on a surface irrigation and centre pivot irrigation system on a cotton crop in Jondaryan, QLD in 2011/12 and 2012/13. The control system determined site-specific irrigation application with data from a weather station, soil-water sensors and camera-based crop monitoring sensing systems for vegetation and cotton fruit load. Field trials demonstrated yield improvements of 10-11% and water savings of 5-12 %.
Model-based control strategies often use off-the-shelf, black box industry models that may not be updated with the development of the new varieties, and may not consider all the soil-plant-water relations. Alternatively, artificial intelligence may be used for training and predicting crop dynamics based on historical and real-time infield data. An artificial intelligence-based crop model has been developed that can determine current and predict future soil-water, nitrogen and fruit load of cotton plants based on day of the season, weather data and visual plant response captured using cameras. These models have potential to be used instead of industry-standard models APSIM and OZCOT to predict crop production throughout the season as part of automated control systems to optimise irrigation and fertiliser application.
Precision agriculture The NCEA has been collaborating with CSIRO and SRA on yield monitoring in sugar cane. Research to date has shown that no one yield monitoring concept is effective under the vast range of operating conditions experienced in the sugar industry. The current project is developing a protocol to interrogate yield data and determine a confidence level in the data with regards to its correlation with real world yields. The confidence level can be used when assessing the yield data, providing a weighting for
2015 Precision Agriculture Symposium74
the data’s reliability or even if the data should be used at all. Additionally this project has also been evaluating a low cost option yield monitor option.
In a separate SRA funded project, the NCEA is using the principals of Hazard and Critical Control Point theory to identify constraints in production for the sugar industry. Technologies are then identified that can be accessed to overcome these constraints.
Augmented information delivery Agricultural technologies change in-line with general population technology trends creating consumer awareness of new products such as smart phones and tablets. Integrating these new technologies into information and training delivery for the research, farming and wider rural community, is important to effectively utilise agricultural technologies and aid decision making. A Future Farm Demonstration Site that consolidates and integrates a range of farming industry and research tools has been established at an on campus, USQ-NCEA trial site to provide a training, teaching and research and development environment for Agricultural technologies.
The Future Farm Demonstration Site involves three layers; (1) a sensors layer, (2) an operations layer and (3) a reporting layer. Technologies on the sensor layer (1) include on-farm sensors that monitor resources such as water volume and pump energy use when irrigating or infield conditions such as temperature and wind speed; the operations layer (2) manages on farm operations, controlling them via intelligent implements or remote control. The reporting layer (3) comprising Augmented Reality and mobile applications provide efficient information display, showing real-time status information on farm conditions or farm operations as well as historical data to enhance decision making.
2015 Precision Agriculture Symposium 75
precisionagriculture.com.au
[email protected]: @AgPrecisionFacebook: precisionagriculture.com.au
Crop & pasture biomass maps
Yield map setup & processing
GPS autosteer and CTF advice
Soil pH & EM38 maps
Digital farm mapping
On-farm research
Topography & drainage
Satellite & aerial imagery
Variable rate
Training
2015 Precision Agriculture Symposium76
Temperatures from Landsat 8: useful for PA decision-making?
Ben Jones1 and Charles DuBourg2
1PASource Pty Ltd, pasource.com.au, Box 400, Gardenvale, Vic, 3185. 2IK Caldwell, ikcaldwell.com.au, 6 Dillon St, Cobram, Vic, 3644.
Contact: [email protected]
AbstractLandsat 8 thermal imagery has the potential to be a useful tool in understanding temperature patterns in paddocks. Temperature patterns may help in irrigation scheduling or diagnosing crop stress, or predicting the extent of cool- and heat-stress effects. Some processing is required to remove stray light artifacts in the imagery, and to convert to Land Surface Temperature (LST).
Landsat 8 thermal imagery was processed for a range of dates over a study area in Southeastern Australia. LST derived from imagery correlated well with screen temperatures (r=+0.95, p<0.001) across a range of dates early in the winter cropping season. Plant and soil temperatures were measured on a transect within two paddocks using a hand-held infrared thermometer. On an initial image, measurements were consistent with LST being a composite of plant and soil temperatures, but also illustrated likely short-term variability in local temperature.
With appropriate processing, Landsat 8 thermal data will be a useful addition to the range of inexpensive imagery that can be used in Precision Agriculture decision-making.
IntroductionThermal bands have been a feature of Landsat missions since Landsat 4 (1982). They were included with the aim of estimating plant transpiration and water use. Evaporation at the leaf surface causes actively transpiring plants to be cooler than plants that are under water (and other types of) stress. The pixel size on initial detectors was 120m, which decreased to 60m on Landsat 7, with two bands of measurements at high and low gain. Landsat 8 has a 100m pixel size, with two bands at different wavelengths to help correct for atmospheric conditions. The pixel size (~1/ha) is small enough to be useful for discriminating between regions of broadacre cropping paddocks, and should provide a useful accompaniment to NDVI (Normalised Difference Vegetative Index), which is available with smaller pixels (15-30m) and has been more readily adopted. Between Landsat 7 and 8, there is the potential for one thermal image every 8 days, especially at the center of the satellite path, and where Landsat 8 tiles overlap.
The use of thermal imagery has lagged NDVI in precision agriculture. NDVI is widely available on satellite, airborne and ground-based platforms, and relatively well understood. Thermal imagery is less widespread, and with Landsat has come with some user challenges: the failure of the scan line corrector on Landsat 7 in 2003 limited whole-of-scene thermal images to the more erratic Landsat 5 collection schedule, until the launch of Landsat 8 in 2013. The Landsat 8 thermal detector suffers from light leakage (Montanaro et al. 2014), which produces stripes across the imagery, but is
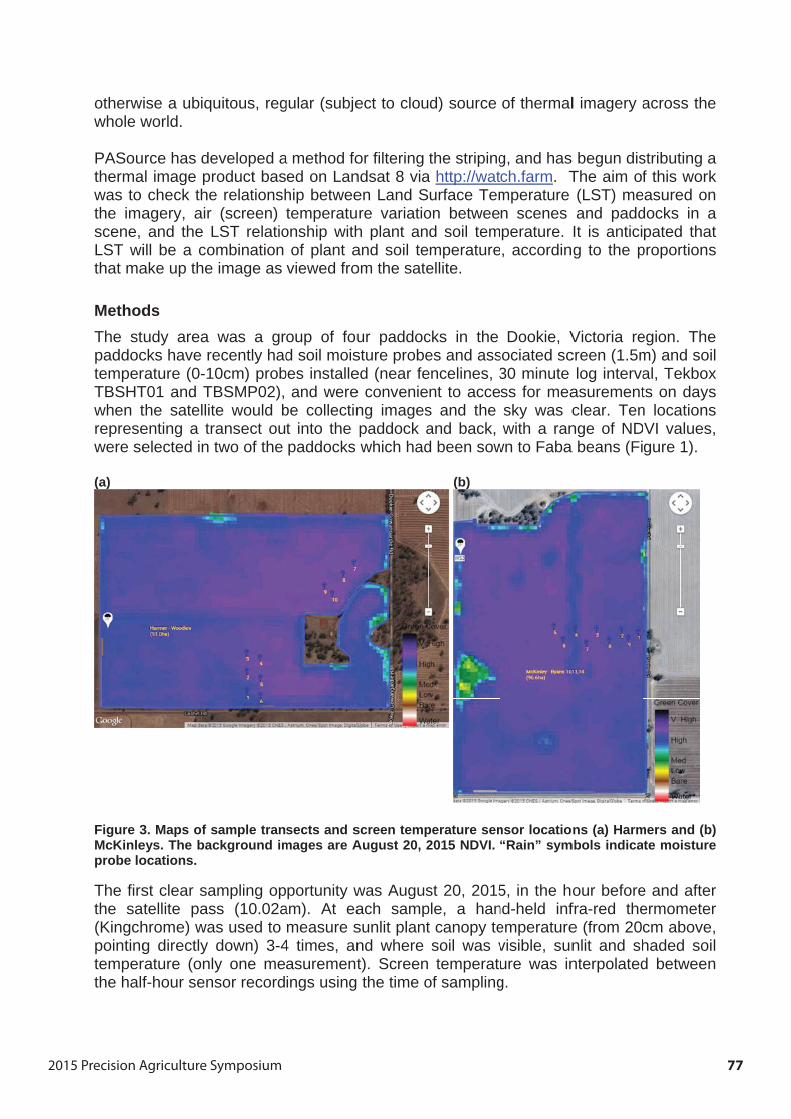
2015 Precision Agriculture Symposium 77
otherwwhole w
PASouthermawas to the imascene,LST withat ma
MethodThe stpaddoctemperTBSHTwhen trepresewere se
(a)
Figure 3McKinleprobe lo
The firsthe sa(Kingchpointingtemperthe half
ise a ubiquworld.
rce has deal image pr
check theagery, air and the L
ill be a coake up the
dsudy area cks have rerature (0-1T01 and TBthe satellitenting a trelected in t
3. Maps of seys. The bacocations.
st clear satellite pashrome) wag directly rature (onlf-hour sen
uitous, reg
eveloped aroduct base relationsh
(screen)LST relatioombination
image as
was a grecently had0cm) probBSMP02),te would bransect outwo of the
sample tranckground im
ampling opss (10.02aas used to down) 3-4y one mesor record
gular (subje
a method foed on Lanhip betweetemperatu
onship withof plant aviewed fro
oup of foud soil mois
bes installeand were
be collectint into the paddocks
sects and smages are A
portunity wam). At eameasure s
4 times, anasurementings using
ect to clou
or filtering ndsat 8 viaen Land Sre variatioh plant anand soil teom the sate
ur paddocsture probeed (near fee convenieng imagespaddock awhich had
screen tempAugust 20, 2
was Augusach sampsunlit plantnd where t). Screen the time o
d) source
the stripinga http://waturface Tem
on betweed soil temmperatureellite.
cks in the es and assencelines, 3nt to acces and the and back, d been sow
(b)
perature sen2015 NDVI.
st 20, 2015ple, a hant canopy tesoil was vtemperatu
of sampling
of thermal
g, and hasch.farm. Tmperaturen scenes perature., accordin
Dookie, Vsociated sc30 minute ss for measky was cwith a ran
wn to Faba
nsor locatio“Rain” sym
5, in the hnd-held infemperaturevisible, sunure was ing.
l imagery a
s begun disThe aim of(LST) meand paddIt is antici
ng to the p
Victoria recreen (1.5m
log intervaasurementclear. Tennge of ND
a beans (Fi
ons (a) Harmmbols indica
our beforefra-red thee (from 20cnlit and shnterpolated
across the
stributing af this work
easured ondocks in apated that
proportions
egion. Them) and soilal, Tekboxts on daysn locationsVI values,gure 1).
mers and (b)te moisture
e and afterermometercm above,haded soild between
e
aknats
el
xss,
)e
rr,l
n
2015 Precision Agriculture Symposium78
Landsat 8 imagery was obtained from the USGS (http://glovis.usgs.gov), for paths 92 and 93, over the period dating back to sensor installation (first measurement April 30), and used as supplied from http://Watch.farm . Low cloud, and cloud-free images were available for one or more paddocks on 9 occasions, according to Watch.farm’s rating scheme. NDVI was calculated in the usual way from red and near-infrared bands. Thermal bands 10 and 11 were first filtered to remove striping defects. Land Surface Temperature was estimated using the Split Window Algorithm, with coefficients calculated by Rozenstein et al. (2014, Table 1, for 0-40C). Surface emissivity was derived from NDVI (Yu et al. 2014). The effect of water vapour on atmospheric transmittance was calculated following the Mid-Latitude Summer profile (Table 2 in Rozenstein et al.) but water vapor content was assumed 1g.cm-2 for all images.
Temperature and NDVI values for sample points and moisture probe locations on all dates were taken from the pixel containing the point (without interpolation), using the PASource Mobile interface.
Results
Image-to-image and between-paddock land surface temperature Land surface temperature (LST) related quite well to air (screen) temperatures, particularly from date to date (Figure 4a, r=+0.95, p<0.001 without low Harmer-Woodies point). The low LST measured at Harmer-Woodies was measured on an image with a low-level cloud warning, and was cloud affected on visual inspection. Fewer paddocks and measurement dates had 0-10cm soil data, and the correlation was weaker (Figure 4b, r=+0.56, p=0.07). Apart from one image which covered all four paddocks, no more than three paddocks were present in any other image, where they clustered closely (not shown).
Within-paddock temperature At the time of writing, one set of measurements had been made coincident with a satellite pass (Figure 5). Each image had a temperature range of at least 2°C, but unfortunately the pre-chosen sample transects were in less variable parts of the image.
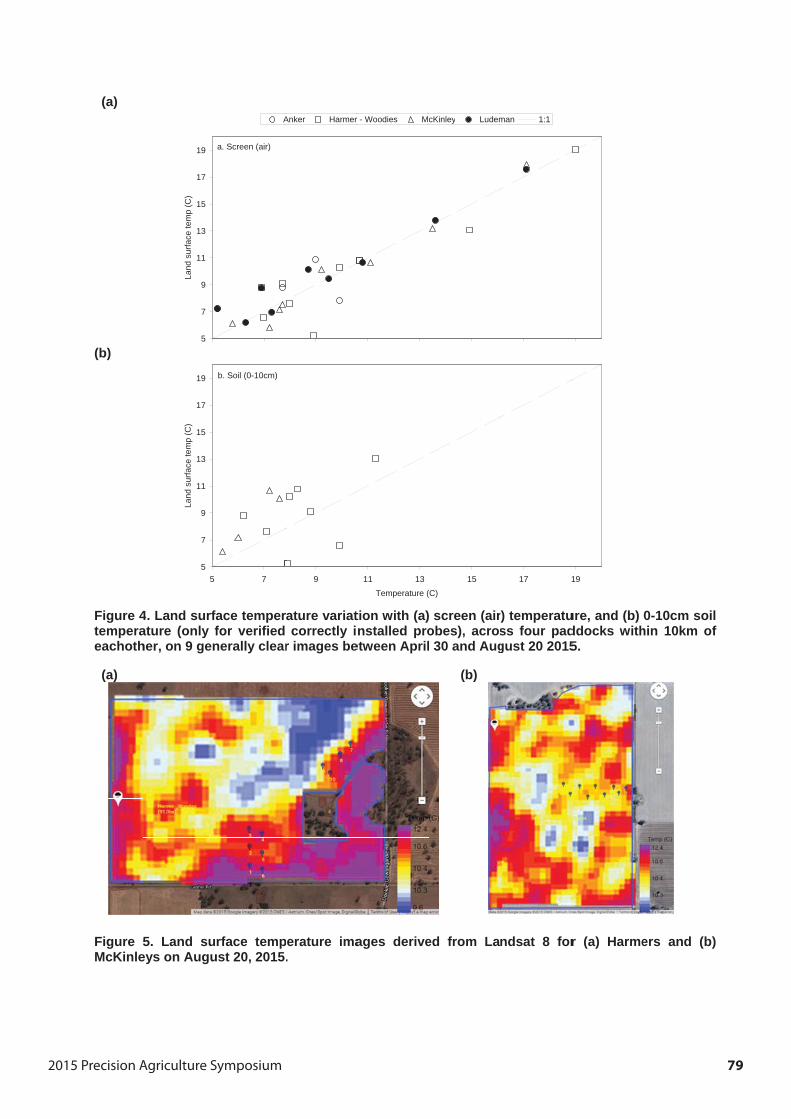
2015 Precision Agriculture Symposium 79
(a)
(b)
Figure 4temperaeachoth
(a)
FigureMcKinle
4. Land surfature (only her, on 9 gen
5. Land sueys on Augu
5
7
9
11
13
15
17
19
Land
sur
face
tem
p (C
)
5
7
9
11
13
15
17
19
5
Land
sur
face
tem
p (C
)
face temperfor verified nerally clear
urface tempust 20, 2015
A
a. Screen (air)
7
b. Soil (0-10cm)
rature variatcorrectly i
r images be
perature ima.
Anker Harmer
9
tion with (a)nstalled pro
etween April
ages derive
- Woodies M
11 13Temperature (
screen (airobes), acrosl 30 and Aug
(b)
ed from La
cKinley Ludem
15(C)
r) temperatuss four padgust 20 2015
ndsat 8 for
man 1:1
17
ure, and (b) ddocks with5.
r (a) Harme
19
0-10cm soilhin 10km of
ers and (b)
lf
)
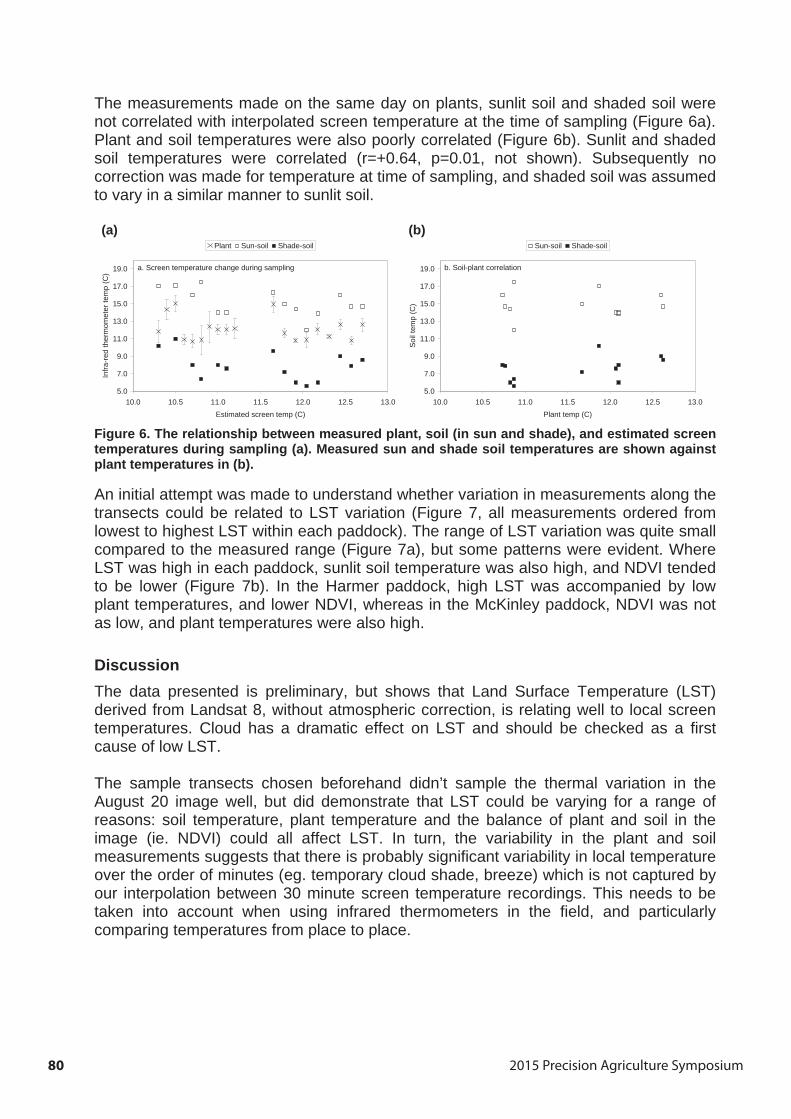
2015 Precision Agriculture Symposium80
The measurements made on the same day on plants, sunlit soil and shaded soil were not correlated with interpolated screen temperature at the time of sampling (Figure 6a). Plant and soil temperatures were also poorly correlated (Figure 6b). Sunlit and shaded soil temperatures were correlated (r=+0.64, p=0.01, not shown). Subsequently no correction was made for temperature at time of sampling, and shaded soil was assumed to vary in a similar manner to sunlit soil.
(a) (b)
Figure 6. The relationship between measured plant, soil (in sun and shade), and estimated screen temperatures during sampling (a). Measured sun and shade soil temperatures are shown against plant temperatures in (b).
An initial attempt was made to understand whether variation in measurements along the transects could be related to LST variation (Figure 7, all measurements ordered from lowest to highest LST within each paddock). The range of LST variation was quite small compared to the measured range (Figure 7a), but some patterns were evident. Where LST was high in each paddock, sunlit soil temperature was also high, and NDVI tended to be lower (Figure 7b). In the Harmer paddock, high LST was accompanied by low plant temperatures, and lower NDVI, whereas in the McKinley paddock, NDVI was not as low, and plant temperatures were also high.
Discussion The data presented is preliminary, but shows that Land Surface Temperature (LST) derived from Landsat 8, without atmospheric correction, is relating well to local screen temperatures. Cloud has a dramatic effect on LST and should be checked as a first cause of low LST.
The sample transects chosen beforehand didn’t sample the thermal variation in the August 20 image well, but did demonstrate that LST could be varying for a range of reasons: soil temperature, plant temperature and the balance of plant and soil in the image (ie. NDVI) could all affect LST. In turn, the variability in the plant and soil measurements suggests that there is probably significant variability in local temperature over the order of minutes (eg. temporary cloud shade, breeze) which is not captured by our interpolation between 30 minute screen temperature recordings. This needs to be taken into account when using infrared thermometers in the field, and particularly comparing temperatures from place to place.
5.0
7.0
9.0
11.0
13.0
15.0
17.0
19.0
10.0 10.5 11.0 11.5 12.0 12.5 13.0Estimated screen temp (C)
Infra
-red
ther
mom
eter
tem
p (C
)
Plant Sun-soil Shade-soil
a. Screen temperature change during sampling
5.0
7.0
9.0
11.0
13.0
15.0
17.0
19.0
10.0 10.5 11.0 11.5 12.0 12.5 13.0Plant temp (C)
Soi
l tem
p (C
)
Sun-soil Shade-soil
b. Soil-plant correlation
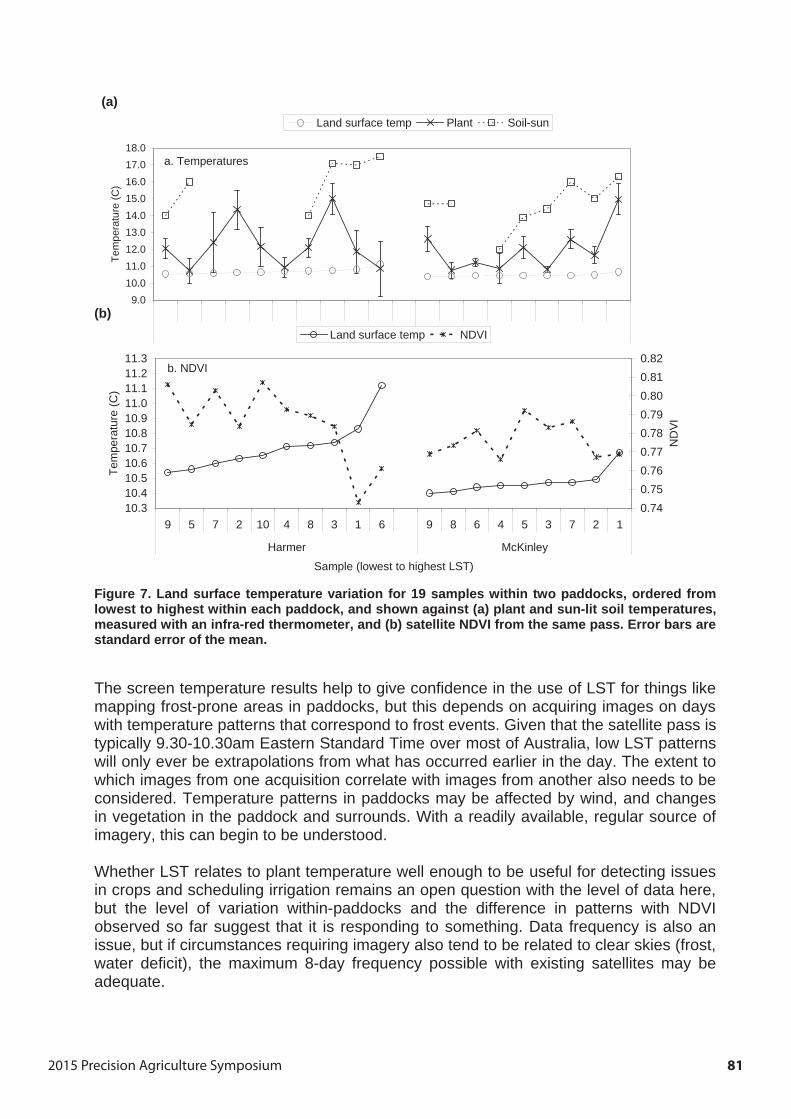
2015 Precision Agriculture Symposium 81
(a)
(b)
Figure 7. Land surface temperature variation for 19 samples within two paddocks, ordered from lowest to highest within each paddock, and shown against (a) plant and sun-lit soil temperatures, measured with an infra-red thermometer, and (b) satellite NDVI from the same pass. Error bars are standard error of the mean.
The screen temperature results help to give confidence in the use of LST for things like mapping frost-prone areas in paddocks, but this depends on acquiring images on days with temperature patterns that correspond to frost events. Given that the satellite pass is typically 9.30-10.30am Eastern Standard Time over most of Australia, low LST patterns will only ever be extrapolations from what has occurred earlier in the day. The extent to which images from one acquisition correlate with images from another also needs to be considered. Temperature patterns in paddocks may be affected by wind, and changes in vegetation in the paddock and surrounds. With a readily available, regular source of imagery, this can begin to be understood.
Whether LST relates to plant temperature well enough to be useful for detecting issues in crops and scheduling irrigation remains an open question with the level of data here, but the level of variation within-paddocks and the difference in patterns with NDVI observed so far suggest that it is responding to something. Data frequency is also an issue, but if circumstances requiring imagery also tend to be related to clear skies (frost, water deficit), the maximum 8-day frequency possible with existing satellites may be adequate.
9.010.011.012.013.014.015.016.017.018.0
Tem
pera
ture
(C)
Land surface temp Plant Soil-sun
a. Temperatures
10.310.410.510.610.710.810.911.011.111.211.3
9 5 7 2 10 4 8 3 1 6 9 8 6 4 5 3 7 2 1
Harmer McKinley
Sample (lowest to highest LST)
Tem
pera
ture
(C)
0.740.750.760.770.780.790.800.810.82
ND
VI
Land surface temp NDVI
b. NDVI

2015 Precision Agriculture Symposium82
Acknowledgments Thank you to Dookie Landcare group for access to temperature data used in this analysis, and participating farmers.
References Montanaro M, Gerace A, Lunsford A, Reuter D (2014) Stray Light Artifacts in Imagery from the Landsat 8
Thermal Infrared Sensor. Remote Sensing 6, 10435-10456. Rozenstein O, Qin Z, Derimian Y, Karnieli A (2014) Derivation of Land Surface Temperature for Landsat-
8 TIRS Using a Split Window Algorithm. Sensors 14, 5768-5780. Yu X, Guo X, Wu Z (2014) Land Surface Temperature Retrieval from Landsat TIRS — Comparison
between Radiative Transfer Equation-Based Method, Split Window Algorithm and Single Channel Method Remote Sensing 6, 9829-9852.

2015 Precision Agriculture Symposium 83
2015 Precision Agriculture Symposium84
Big ideas for using Data
Brett Whelan Precision Agriculture Laboratory, University of Sydney
Contact: [email protected]
Data-driven cropping decisions The development and application of PA in cropping enterprises has been in parallel with an increase in the volume and sources of data. Long before the term ‘Big Data’ was dragged from the literature on digital data storage, through the filter of business management analysts, to the present day, PA has been working on Big ideas for using Data.
In cropping systems, those big ideas have been targeted at the practical goal of increasing the number of (correct) decisions per hectare/per season made in the business of crop management. That target has been chosen because, early on, the potential financial benefits from using data to better managing inputs to match variability in operations were identified as significant. The scale of the required ideas and the ‘extent’ of the data requirements is driven by the uniqueness of each field & farming business.
Structuring the application of Big ideas for using Data in cropping The process will require the merging of (large?) data streams from diverse sources, with variable structures and scales into adaptable models containing environmental, crop and farm business components that will feed information into/drive key management and operational decisions.
The components in the process may eventually include:
o Local data generation and capture: These may include production yield and quality, aerial/proximal in-season sensing (crop, disease, pest, soil, environment).
o Data warehouses. Cloud-based (or local subsidiary) stores of historic and off-farm data at multiple scales (production, environment, financial, markets).
o Prescription agriculture. Alternative options for business and crop management, variable-rate application and farm logistics based on assessment of probabilistic outcomes from data-driven models of causal relationships.
Developmental stages for implementation Schematics for the incremental development and implementation of Big ideas for using Data in cropping are shown in Figures 1 to 3.
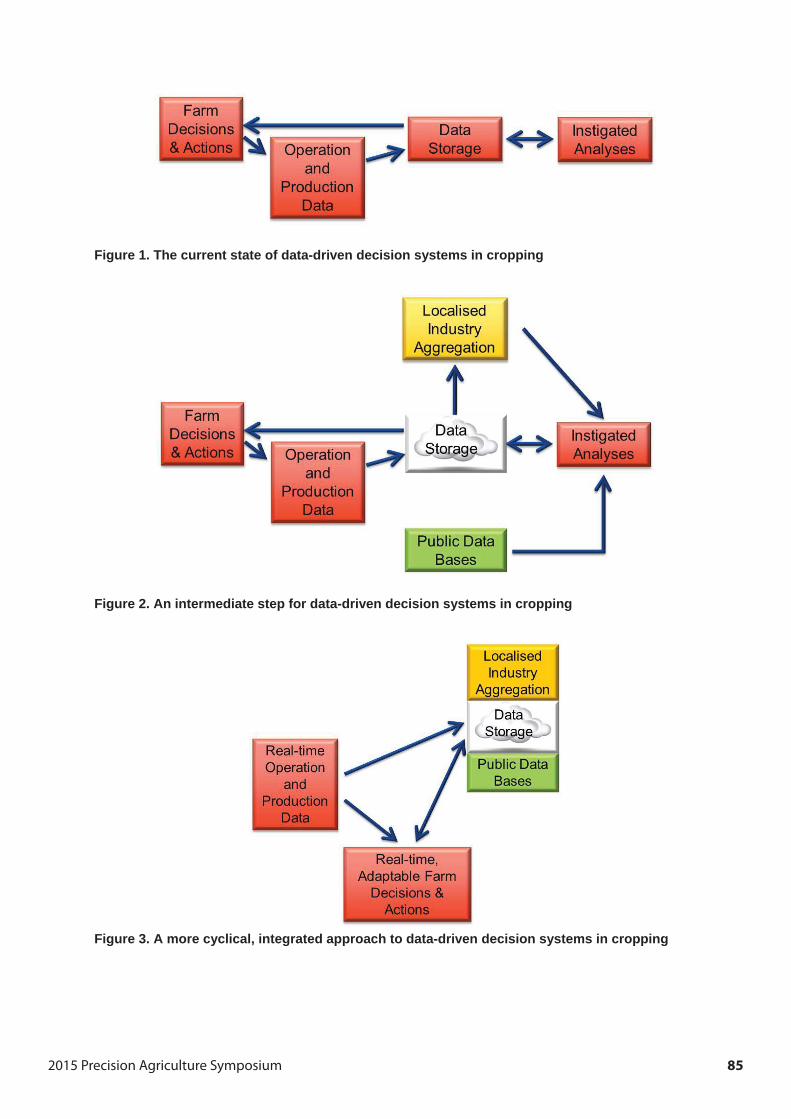
2015 Precision Agriculture Symposium 85
Figure 1. The current state of data-driven decision systems in cropping
Figure 2. An intermediate step for data-driven decision systems in cropping
Figure 3. A more cyclical, integrated approach to data-driven decision systems in cropping
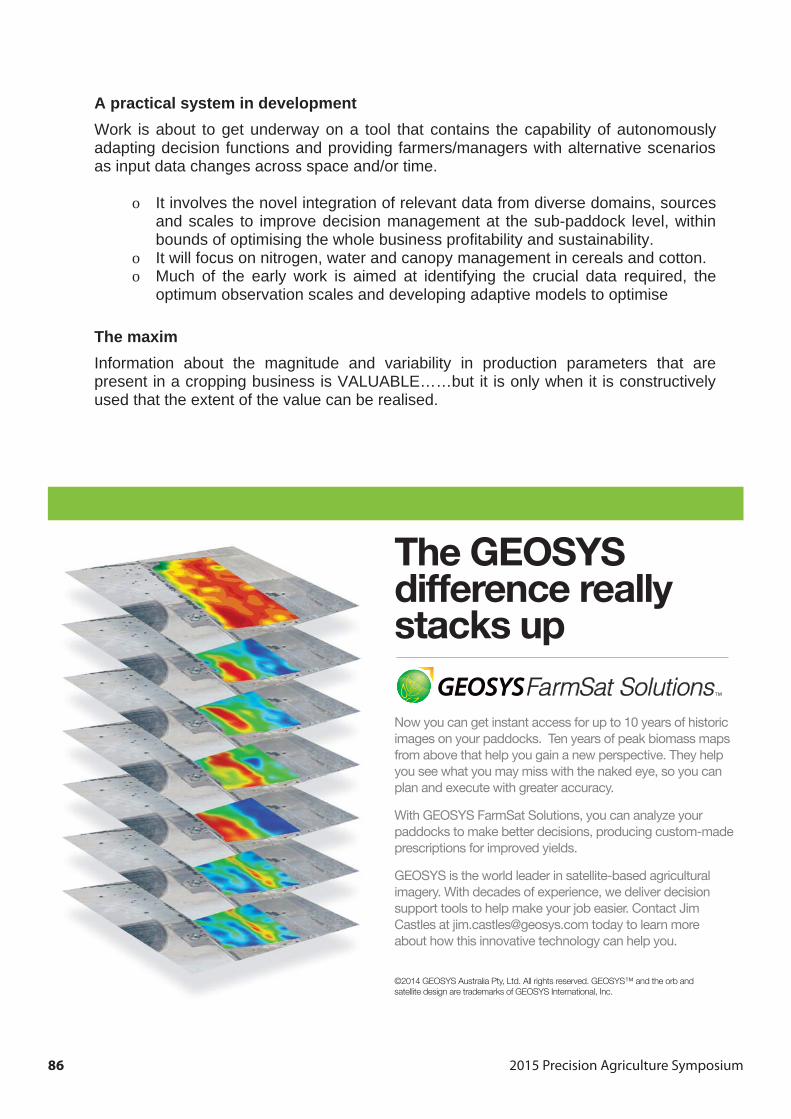
2015 Precision Agriculture Symposium86
A practical system in development Work is about to get underway on a tool that contains the capability of autonomously adapting decision functions and providing farmers/managers with alternative scenarios as input data changes across space and/or time.
o It involves the novel integration of relevant data from diverse domains, sources and scales to improve decision management at the sub-paddock level, within bounds of optimising the whole business profitability and sustainability.
o It will focus on nitrogen, water and canopy management in cereals and cotton. o Much of the early work is aimed at identifying the crucial data required, the
optimum observation scales and developing adaptive models to optimise
The maxim Information about the magnitude and variability in production parameters that are present in a cropping business is VALUABLE……but it is only when it is constructively used that the extent of the value can be realised.
Now you can get instant access for up to 10 years of historic images on your paddocks. Ten years of peak biomass maps from above that help you gain a new perspective. They help you see what you may miss with the naked eye, so you can plan and execute with greater accuracy.
With GEOSYS FarmSat Solutions, you can analyze your paddocks to make better decisions, producing custom-made prescriptions for improved yields.
GEOSYS is the world leader in satellite-based agricultural imagery. With decades of experience, we deliver decision support tools to help make your job easier. Contact Jim Castles at [email protected] today to learn more about how this innovative technology can help you.
The GEOSYS
©2014 GEOSYS Australia Pty, Ltd. All rights reserved. GEOSYS™ and the orb and satellite design are trademarks of GEOSYS International, Inc.

2015 Precision Agriculture Symposium 87
Notes
2015 Precision Agriculture Symposium88
Disclaimer:The information presented in this publication is provided in good faith and is intended as a guide only. Neither SPAA, PAL nor its editors or contributors to this publication represent that the contents are accurate or complete. Readers who may act on any information within this publication do so at their own risk.
Acknowledgements
This event has been made possible by the generous support of industry. SPAA wishes to thank the following organisations and businesses for their financial assistance in putting this event together, and assisting with the travel arrangements of our key note speakers. John Deere, Case IH, Graingrowers Ltd, National Australia Bank, Hutcheon & Pearce, Manutec, Local Land Services Riverina and Murray, PA Source, SST Software, Geosys, Australian UAV, Falcon UAV, UPG Solutions, precisionagriculture.com.au, Precision cropping technologies P/L, Injetka, Next Instruments and CR Kennedy. SPAA also thanks Emerald Grain for their contributions in bus hire.

Precision Agriculture LaboratoryThe University of Sydney
1 Central Avenue, Australian Technology Park,Eveleigh, NSW, 2015
P 02 8627 1132 F 02 8627 1099www.sydney.edu.au/agriculture/pal
SPAA Society of
Precision Agriculture Australia
PO Box 3490 Mildura Victoria 3502P 0437 422 000 F 1300 422 279
www.spaa.com.au
@spaa_eo
With thanks to our sponsors