Monarch Swarm v2.2 Tutorial - docs.datawatch.com · 2 Monarch Swarm v2.2 Tutorial Monarch Swarm...
96
Monarch Swarm Tutorial Version 2.2
Transcript of Monarch Swarm v2.2 Tutorial - docs.datawatch.com · 2 Monarch Swarm v2.2 Tutorial Monarch Swarm...

Monarch Swarm Tutorial Version 2.2


2.2.0/2018.12.28
Datawatch Corporation makes no representation or warranties with respect to the contents of this manual or the associated software and especially disclaims any implied warranties of merchantability or fitness for any particular purpose. Further, Datawatch Corporation reserves the right to revise this publication and make changes from time to time to its contents without obligation to notify anyone of such revisions or changes.
Datawatch Monarch Swarm software is offered and is to be used in accordance with a SOFTWARE LICENSE AND MAINTENANCE AGREEMENT. This agreement stipulates that this software be used only in the computer system designated in that agreement. The agreement further stipulates that the customer shall not copy or alter, or permit others to copy or alter, the software or related materials in whole or in part, in any media for any purpose, except to make an archive (back-up) copy or to make a copy as an essential step in the use of the software with the customer's computer.
Datawatch Corporation hereby grants the buyer the right to reprint this documentation for internal uses only. No part of this publication may be reproduced, stored in a retrieval system, or transmitted in any form or by any means, electronic, mechanical, photocopying, recording, or otherwise, for any other purposes, without the prior written permission of Datawatch Corporation.
Datawatch Monarch Swarm v2.2 Tutorial Copyright © 2018 by Datawatch Corporation All rights reserved. Printed in the U.S.A. Unpublished - Rights reserved under the copyright law of the United States.
Datawatch Monarch Swarm is a trademark of Datawatch Corporation. Other products mentioned herein may be trademarks or registered trademarks of their respective owners in the United States or other countries.
For U.S. Government End Users, the software is a “Commercial Item(s),” as that term is defined
at 48 C.F.R. Section 2.101, consisting of “Commercial Computer Software” and “Commercial Computer Software Documentation,” as such terms are used in 48 C.F.R. Section 12.212 or 48 C.F.R. Section 227.7202, as applicable. Consistent with 48 C.F.R. Section 12.212 or 48 C.F.R. Sections 227.7202-1 through 227.7202-4, as applicable, the Commercial Computer Software and Commercial Computer Software Documentation are being licensed to U.S. Government end users (a) only as Commercial Items and (b) with only those rights as are granted to all other end users pursuant to the Datawatch Software License and Maintenance Agreement.
DATAWATCH CORPORATION
CORPORATE HEADQUARTERS
4 Crosby Drive
Bedford, MA 01730, USA
Tel.: +1 800.445.3311
Fax: +1 978.441.1114
NEW YORK
415 Madison Avenue, Suite 1421
New York, NY 10017
Tel.: +1 800.445.3311
GREENSBORO, NC
101 S Elm #225
Greensboro, NC 27401
Tel: +1 800.445.3311
EUROPE, MIDDLE EAST, AND AFRICA
EUROPEAN HEADQUARTERS
Siena Court, Broadway
Maidenhead, Berkshire SL6 1NJ
Tel: +44 203.868.0230
DATAWATCH AB
Eriksbergsgatan 10
Stockholm, Sweden SE-114 30
Tel: +46 853.480.483
ASIA PACIFIC
MANILA
U2011 20th Flr. Jollibee Plaza Condominium
F. Ortigas Jr. Rd., Ortigas Center
Pasig City 1605 PH
Tel: +63 2.633.5583


Table of Contents [1] Introduction......................................................................................................... 1
Using This Tutorial ........................................................................................................ 2
Assumptions ................................................................................................................ 3
[2] Using Monarch Swarm for the First Time ............................................................. 4
Logging into Monarch Swarm ......................................................................................... 4
Viewing Your Dashboard ................................................................................................ 5
Viewing Your User Profile ............................................................................................... 6
Changing Your Password ................................................................................................ 8
Logging Out of Monarch Swarm ...................................................................................... 9
[3] Working with the Monarch Swarm Library ......................................................... 10
Creating a Folder .........................................................................................................11
Adding Data Sources ....................................................................................................12
Adding a Data Source with a Single Table ............................................................14
Adding a Data Source with Multiple Tables ...........................................................15
Previewing Data Sources ..............................................................................................18
Sharing Data Sources ...................................................................................................20
Creating and Saving a Workspace ..................................................................................22
[4] Socializing Data Use ........................................................................................... 27
Following/Unfollowing Users ..........................................................................................27
Liking/Unliking Objects .................................................................................................28
Subscribing/Unsubscribing to Data Sources .....................................................................30
Viewing Notifications ....................................................................................................31
[5] Report Trapping ................................................................................................. 33
What Is a Data Extraction Template? ..............................................................................33
The Report Design Window ...........................................................................................34
Using the Auto-Define Feature ............................................................................35
Defining Templates Manually ..............................................................................40
Editing Field Properties ......................................................................................46
[6] Working with Workspaces and Tables ................................................................ 50

Adding Single Tables to a Workspace ............................................................................. 50
Moving Columns ......................................................................................................... 53
Adding Multiple Tables to a Workspace .......................................................................... 54
Preparing Data ........................................................................................................... 56
Preparing Software Sales – January 2018 by Joining ............................................ 57
Preparing Software Sales – February 2018 by Hiding Columns ............................... 60
Preparing Software Sales – March 2018 by Unpivoting .......................................... 63
Appending Tables ............................................................................................ 67
Final Preparation Activities ................................................................................ 71
[7] Post-prep Activities ............................................................................................ 78
Exporting Tables ......................................................................................................... 78
Scheduling an Export ................................................................................................... 82
Publishing Tables ........................................................................................................ 85
[8] Conclusion ......................................................................................................... 90

Monarch Swarm v2.2 Tutorial 1
[1] Introduction Self-service analytics tools initially aimed to make end-users more agile and data-driven. However, increased agility had led to the development of a data free-for-all.
Current analytics tools feed the chaos because they don't show lineage or track changes. Ungoverned processes, siloed data preparation, ad hoc data reporting, duplication of efforts, and multiple versions of the truth further fuel the problem. Thus, organizations are plagued with inefficient operation and incorrect analytics based on uncontrolled, uncurated data.
Monarch Swarm, the newest of Datawatch’s product offerings, is a server-based application that allows users across organizations and regions to explore, prepare, and distribute data
seamlessly and automatically.
The application restores order to your organization by bringing IT and data workers together. A centralized location for raw and/or curated data, reports, models, workspaces, and communication breaks down data siloes, eliminates duplicate work, and improves data validity.
Monarch Swarm features:
Easy to use, team-driven, centralized data prep in a browser
Governance, collaboration, and sharing
Socialization features (e.g. like, subscribe, follow)
Machine learning-powered recommendations

2 Monarch Swarm v2.2 Tutorial
Monarch Swarm accepts a wide range of inputs, including models and reports used in Monarch
Classic and workspaces saved to the application via Data Prep Studio. Access to these inputs is controlled by IT to ensure a safe and secure browser-based working environment.
More information on Monarch Swarm can be found in the following links:
Monarch Swarm Release Notes
Monarch Swarm Factsheet
Monarch Swarm Quick Start
Monarch Swarm Help
Using This Tutorial This tutorial is intended to help first-time users build the basic skills necessary to work with many of Monarch Swarm’s functions.
While it is not intended to provide an exhaustive review of each of the application’s capabilities, the tutorial will guide you through the most common operations you will likely perform, including, but, not limited to, logging in and out of the application; adding objects, such as workspaces and data sources, to the Monarch Swarm library; sharing these objects
with other users; working with these objects, including performing data preparation and transformation operations; exporting clean, analysis-ready tables; and publishing the same for use by other Monarch Swarm users.
The lessons in this tutorial are geared toward users assigned the Analyst role. While several other roles can be assigned to users in the application (and users can be assigned more than
one role), the Analyst role provides users with a fairly wide range of capabilities not available
to other roles.
Exercises are provided at the end of some lessons to practice and strengthen your newly developed skills. If you require a deeper discussion on a topic to complete the accompanying exercise, consult the Monarch Swarm help file.

Monarch Swarm v2.2 Tutorial 3
Assumptions This tutorial assumes the following:
Your IT system administrator has successfully installed and deployed Monarch Swarm.
You have been provided the Monarch Swarm URL.
Your application administrator has created two users with the following credentials:
User 1: Bryson Matthews
• Login: bmatthews
• Password: Analyst01!
• Role: Analyst
User 2: Anne Brown
• Login: annebrown
• Password: Analyst02!
• Role: Analyst
The login information of these users has been provided to you.
You have access to the following files:
• Beantown.mdb
• Software Sales - January 2018.xls
• Software Sales - February 2018.xls
• Software Sales - March 2018.csv
• Classic.pdf
• Patient.pdf
If you do not yet have access to these files, you can download them here.

4 Monarch Swarm v2.2 Tutorial
[2] Using Monarch Swarm for the First Time Monarch Swarm represents the evolution from self-service to collaborative analytics.
Individuals, teams, and organizations can reshape the way they think about and interact with their data.
Because Monarch Swarm is a server application, you must log into it before you can fully utilize its various capabilities. The following topics are discussed:
Logging into Monarch Swarm
Viewing your user profile
Changing your password
Logging out of Monarch Swarm
Logging into Monarch Swarm Steps:
1. Enter the URL of the Monarch Swarm application provided by your system administrator into the address bar of your browser, and press Enter on your keyboard. The login page of Monarch Swarm is displayed.

Monarch Swarm v2.2 Tutorial 5
2. Enter the login name and password provided by your application administrator into the
corresponding fields. In this chapter, we’ll use bmatthews as your login name and Analyst01! as your password.
If the login is successful, you are brought to the Monarch Swarm Dashboard, which is the
default view whenever you log into the application.
Viewing Your Dashboard The dashboard is another useful socialization feature of Monarch Swarm. It is displayed when
you log into Monarch Swarm or click on the Datawatch icon located on the upper left-hand corner of your screen.

6 Monarch Swarm v2.2 Tutorial
A sample dashboard is provided above. The dashboard provides an overview of what other Monarch Swarm users are doing with the application. Separate panels are provided to show recent updates, objects shared with you, and activities recently performed. Links to the Monarch Swarm documentation and video tutorials may also be accessed here.
Related Reading
The topic Socializing Data Use provides a more in-depth discussion of Monarch Swarm’s socialization features.
You can also learn more about your dashboard by clicking on the
topic Monarch Swarm Dashboard.
Viewing Your User Profile Your user profile includes your login information and email address. It also lists which groups you belong to and which roles you are assigned. All Monarch Swarm users can view and modify their own profiles but some roles are allowed other abilities as well. Admin users, for example, can create and disable new users and groups, while Analysts and Consumers can’t.
Analysts can also view other user profiles but Consumers can’t.

Monarch Swarm v2.2 Tutorial 7
Steps:
1. Click on the profile icon at the top right-hand corner of the Monarch Swarm screen.
2. Choose Profile from the options that display.
You are brought to the User Profile page.
Through this page, you can modify your:
• User photo
• First name
• Last name
• Login ID
• Password

8 Monarch Swarm v2.2 Tutorial
Related Reading
User management is an important feature of Monarch Swarm that ensures data security. This topic is discussed extensively in the following links.
• About User Management
• Working with Roles and Permissions
• Working with Users
• Working with Groups
Changing Your Password Changing one’s password is a common Monarch Swarm activity.
Steps:
1. In the User Profile page, click the Edit link found on the rightmost part of the Password
field.
You will notice that the Password field is updated as follows:
2. Type in your new password (let’s use Analyst03! for this lesson).
3. Click Save.
4. Click Save on the User Profile page.
You are brought back to the Monarch Swarm Dashboard.
Related Reading
If you wish to make other changes to your profile, you may want
to refer to this topic:
• Editing User Profiles

Monarch Swarm v2.2 Tutorial 9
Logging Out of Monarch Swarm Now that you know how to log into the Monarch Swarm application, as well as view and modify your user profile, let’s log out of the application.
Steps:
1. Click on the profile icon at the top right-hand corner of the Monarch Swarm screen.
2. Among the choices that display in the drop-down menu, choose Logout.
You are logged out of the application and the Monarch Swarm login page displays once more.
Now that you can log into and out of the Monarch Swarm application, let’s begin learning how to work with its capabilities.

10 Monarch Swarm v2.2 Tutorial
[3] Working with the Monarch Swarm Library In the previous chapter, you learned to log in and log out of Monarch Swarm. You also learned
about user profiles and how to change them. In the current chapter, you will be introduced to the Monarch Swarm Library.
The Monarch Swarm Library comprises all of the objects, including data sources, workspaces, change lists, predictive models, report models, and exported and published tables, you and other Monarch Swarm users in your organization can immediately work with. Access to these
objects, however, depends on the sharing privileges extended to you by an object’s creator.
The lessons in this chapter will help you learn how to:
Create folders
Add data sources to the Monarch Swarm Library
Preview data sources
Share data sources
Create and save workspaces
Let’s begin this chapter by logging into Monarch Swarm using user Anne Brown’s credentials (annebrown/Analyst02!).

Monarch Swarm v2.2 Tutorial 11
Creating a Folder When working with a large number of workspaces with multiple data sources and models, you may want to group these objects together to organize your library and quickly locate corresponding content. Folders are a handy solution to this problem.
Folders function like mini-libraries within the main Swarm Library. You can add workspaces, models, change lists, predictive models, and data sources to a folder and display the contents of this folder by selecting the folder name from the main library. When requested during sharing, the contents of a folder may be curated by other Monarch Swarm users assigned the
Curator role.
Steps:
1. From the Monarch Swarm Dashboard, click Swarm Library on the Monarch Swarm menu.
The Monarch Swarm Library displays.
2. Click the New Folder button located on the left-hand side of the screen.
A new folder is created in the Monarch Swarm library.

12 Monarch Swarm v2.2 Tutorial
3. Provide a name for the new folder. For this tutorial, let’s use Tutorial Files.
We will use this folder as we go along the tutorial.
Related Reading
Folders, like all other data sources, workspaces, change lists, predictive models, and report models, can be renamed, deleted, and shared. Learn about these actions in the Managing Folders topic in the Monarch Swarm help system.
Adding Data Sources Now that you have a folder to work with, let’s begin adding objects to it.
At the beginning of this tutorial, you were assumed to have access to the following files:
Beantown.mdb
Software Sales - January 2018.xls
Software Sales - February 2018.xls
Software Sales - March 2018.csv
Classic.pdf
Patient.pdf

Monarch Swarm v2.2 Tutorial 13
These files are referred to as data sources. Data sources contain tables that you can transform
and prep in Monarch Swarm. The following data source formats are supported by Monarch Swarm:
MS Access (including password-protected files)
Delimited Text
MS Excel
HTML
JSON
XML
PDF/PRN/Text
Related Reading
All data sources that are available to you (either because you added them to the library yourself or they were shared with you)
are shown in the Data Sources list. The topic About Data Sources describes how you can work with data sources and provides links that will help you learn how to add, modify, and filter them, among other possible actions.
Data sources can be added to a Monarch Swarm session in several ways.
Via drag and drop
Using the New > Upload Local file command
Using the New > Add from Connection command
Using the New > Add Weblink command
Clicking the Add Data button in an open workspace
Importing a PDF or PRN file and defining a model for it

14 Monarch Swarm v2.2 Tutorial
ADDING A DATA SOURCE WITH A SINGLE TABLE
Some of data source files contain a single table while others may contain multiple tables. We’ll begin this lesson by adding a single-table data source to the folder we have just created by drag and drop.
Steps:
1. In the Monarch Swarm library, click on the folder Tutorial Files to open it.
2. Locate the file Software Sales - March 2018.csv file and then drag and drop it into the Tutorial Files folder. The Add Software Sales - March 2018 Data Source page displays.
Monarch Swarm automatically detects the format of the file you are uploading and displays several other properties you may wish to modify to open the data source
successfully.

Monarch Swarm v2.2 Tutorial 15
Related Reading
The properties of the data source you add to the Monarch Swarm library vary according to the format of the data source you are importing into the application. To learn more about these properties, refer to the topic Data Source Properties.
Note
You cannot drag and drop multiple data sources at the same time even if they are of the same format.
For now, let’s keep the default properties as is.
3. Click Save.
The data source is added to the Tutorial Files folder.
ADDING A DATA SOURCE WITH MULTIPLE TABLES
In the previous lesson, we added a data source with a single table. In this lesson, we’ll add a data source that includes three tables.
Steps:
1. Ensure that you are still in the My Library > Tutorial Files folder.
2. Locate the Beantown.mdb file. Drag and drop this file into the Monarch Swarm library.

16 Monarch Swarm v2.2 Tutorial
The Add Beantown Data Source page displays.
The properties displayed on this page will include a list of tables that make up the data
source we have just selected. You can choose which tables to add to the Monarch Swarm library by ticking their corresponding boxes. In the current lesson, we’ll add all of the tables available.
3. Ensure that all three boxes for the three tables in Beantown.mdb, i.e., Accounting, Data Processing, and Marketing, are ticked.
4. For this tutorial, let’s keep the default properties as is and then click Save.
The Beantown data source is added to the Tutorial Files folder.

Monarch Swarm v2.2 Tutorial 17
Independent Work
As an exercise, add the files Software Sales – January 2018.xls and Software Sales – February 2018.xls to the
Tutorial Files folder. Keep all default properties as is and add all tables available in both data sources. Don’t forget to click Save!
Related Reading
To learn about other methods for adding data sources, help is
available in the topic Adding Data Sources to a Swarm Session. Note that as an analyst, you will need your IT system administrator’s help when adding a data source from a connection.

18 Monarch Swarm v2.2 Tutorial
Previewing Data Sources If you successfully completed the exercise in the previous lesson, your Monarch Swarm Library should be populated with a total of seven tables from four data sources.
Before adding a data source to a new or existing workspace, you may want to preview it first
to ensure that it contains the data you need and want to work with. Let’s try this now. Note that you should still be viewing the contents of the Tutorial Files folder in the Monarch Swarm library.
Steps:
1. Hover your mouse over Software Sales - March 2018 until the Preview icon appears to its right. Click on this icon

Monarch Swarm v2.2 Tutorial 19
A preview of the data source displays.
In this window, you can view the following:
• A portion of the table content
• The original data source from which the table was obtained
• A list of workspaces in which the data source is used
• The creator of the data source
• The date when the data source was last updated
• A list of users with whom the data source is shared
• The date when the statistics of the data source was last cached.
You can also:
• Edit the table
• View the table profile
2. Scan the rows shown in the preview window by using the scroll bar.
3. Close the preview window by clicking the Minimize button located near the top right-hand corner of the window.

20 Monarch Swarm v2.2 Tutorial
Related Reading
When tables are brought into the Monarch Swarm library for the first time, their statistics are not cached. You can save the column statistics by clicking the Cache Statistics Now button. Learn more about this topic by referring to the topic Previewing Data Sources.
Sharing Data Sources Let’s say users Anne and Bryson are working on the same data source. In a regular office setting, Anne will likely work on this data source on her own laptop, save it to some folder, and then email Bryson to send him the file and tell him that he can continue where she left off. Bryson must then access his email and download the file Anne sent him before he can work on it. This single data source is passed back and forth and downloaded multiple times
until all work has been completed on it. If Anne is unavailable and Bryson requires clarification on how certain values were obtained from the data, for example, work stops until Anne is back, which could mean poor efficiency and productivity for the duo.
Monarch Swarm provides trusted users with the convenience of working on a single data source from various locations and the ability to track changes via a function called Change History. To provide users access to a data source, whoever uploads it to the Monarch Swarm library, also called the creator, must share the data source with others in the organization.
Steps:
1. In the Tutorial Files folder, click the Share link located to the right of the Software Sales - March 2018 data source.
The Share “Software Sales - March 2018” dialog box displays.
2. Select the With Selected People Only radio button.

Monarch Swarm v2.2 Tutorial 21
3. Place your cursor in the With field and begin to type in Br. A list of users displays whose names follow this pattern display. From this list, choose Bryson’s name.
4. In the drop-down menu beside the With Selected People Only radio button, choose Can
Edit and Share. With this selection, Bryson can modify all of your data sources and share them with other users.
5. Click Share.
The Manage Shares window displays a list of users with whom the data source is shared.
You can also modify or revoke the share settings for users and groups in this window.

22 Monarch Swarm v2.2 Tutorial
Related Reading
Shared data sources can be easily managed in Monarch Swarm. Learn about it by referring to the Sharing Data Sources topic in the documentation. You can also:
• Share Workspaces
• Share Models
• Share Change Lists
• Share Predictive Models
• Share Folders
• Share Connections
6. Click the Close icon to close the Manage Shares window and return to the Monarch Swarm library.
Independent Work
As an exercise, share the entire Tutorial Files folder with user Bryson. You’ll have to be in the main library when you do so. Some notes on sharing folders and what this means for the objects within the folder can be found in the topic Sharing
Folders.
Creating and Saving a Workspace In a previous lesson, you learned about previewing a data source. But what happens if you open a data source directly?
When you select a data source from the Monarch Swarm library and open it, the data source is
opened in a new workspace. A workspace refers to the collection of objects and actions that are involved in a data preparation session. A workspace contains the tables you have loaded, along with the actions, column transformations, and other data prep operations you have
carried out.
In this lesson, we’ll open a data source and save it to a workspace.

Monarch Swarm v2.2 Tutorial 23
Steps:
1. In the Monarch Swarm library, click on the name of the Beantown: Marketing data source.
Your data source displays in a new workspace.

24 Monarch Swarm v2.2 Tutorial
The panel to the left of the screen is the Workspace Definition panel. This panel is
divided into several tabs shows you information about your workspace, as well as the individual tables that make up your workspace.
The Workspace Overview tab shows a summary of the workspace contents, including data sources, exports, schedules, and the like. The Table and Column Information tab provides information about the contents of individual data sources. The Change History tab allows you to view and modify table changes. The Calculate tab allows you to add calculated fields to your tables. The Filters tab allows you to define filters. The Comments tab shows comments added to individual tables and allows you to reply to them.
You won’t always need to have this panel exposed, so you can minimize it by clicking on
the Minimize icon located to the upper-right of the panel.
Related Reading
The Workspace Definition panel provides more than just information on your workspace and data sources. It is also your jump-off point for auditing table changes, creating exports, and
adding calculated fields to your tables, among others. Learn more about this panel by clicking on the topic The Workspace Definition Panel.

Monarch Swarm v2.2 Tutorial 25
2. Let’s give the workspace a name. Navigate to the top part of the screen, and hover your
mouse over the generic workspace name, in this case, New Workspace. An edit button
appears. Click this button to begin renaming the field.
3. Enter the name Workspace1 into the activated field and then press Enter on your
keyboard.
Your workspace should now bear the name Workspace1, as shown below.

26 Monarch Swarm v2.2 Tutorial
You can make other modifications to your workspace if you wish but this isn’t necessary in
the current lesson. Working more extensively with workspaces and data sources is discussed in a later chapter.
4. Once you’re done making changes to the workspace, save it. To do this, click the Save
button located at the top right-hand corner of the screen. From the drop-down menu that displays, you can choose to save, save and exit, or exit without saving your workspace. Let’s choose Save and Exit.
You are then brought back to the Monarch Swarm library, specifically the Tutorial Files folder, which should now show the workspace we have just created and saved.

Monarch Swarm v2.2 Tutorial 27
[4] Socializing Data Use At the beginning of this tutorial, socialization was introduced as an important feature of Monarch Swarm. In this chapter, we will discuss this feature in depth and explore the different
social activities that can be done in Monarch Swarm.
Data socialization helps organizations think about, and employees interact with, their business data. When users are able to search for, access, share, and reuse prepared, managed data, as well as leverage ratings, recommendations, and comments left by other users, they are able to make better decisions about which data to use in their analytics processes.
Let’s begin with following users. For this part of the tutorial, log in as Bryson (bmatthews/Analyst03!).
Following/Unfollowing Users Steps:
1. Once logged into Monarch Swarm as Bryson, you are directed to the Monarch Swarm Dashboard. Click on the Swarm Library link on the Monarch Swarm menu.
Your Monarch Swarm library, which was previously empty in Chapter 2, should now be populated with the Tutorial Files folder shared by Anne in the previous chapter.
Navigate to the Creator column and then click Anne’s avatar, as highlighted below.

28 Monarch Swarm v2.2 Tutorial
2. In the window that displays, click the Follow link.
Users you follow will receive a notification that you have started following them.
To unfollow users, repeat the same steps above, but this time, click the Unfollow link.
Liking/Unliking Objects In your use of Monarch Swarm, you are likely to find data sources, models, and workspaces
that are interesting, useful in your field of work, or possibly beneficial to your colleagues. You can keep tabs of such objects by liking them.
Steps:
1. In the Monarch Swarm library, click the Tutorial Files folder to view the objects shared by Anne.
2. Like the Beantown: Marketing data source by clicking the corresponding Like link under the Liked column.

Monarch Swarm v2.2 Tutorial 29
To like the rest of the objects in the folder, repeat the same steps above.
You can “unlike” an object using the same steps, but this time, click on the Dislike link, as shown here.
Before we proceed, go ahead and like the rest of the objects shared by Anne.
Your Monarch Swarm library should appear as follows:

30 Monarch Swarm v2.2 Tutorial
Subscribing/Unsubscribing to Data Sources Let’s say you, as user Bryson, are working on Workspace1, which we created in the previous chapter. As this is a shared workspace, user Anne could also make changes to it. To alert you of any changes made to this shared object, Monarch Swarm allows you to subscribe to the
object and receive timely notifications. By subscribing to Workspace1, for example, you will receive a notification should Anne make her own changes to it.
To subscribe to an object, follow the steps below.
Steps:
1. Ensure that you are in the Tutorial Files folder.
2. Subscribe to Workspace1 by clicking the corresponding Subscribe link under the Subscribed column.
Independent Work
Subscribe to all the data sources shared by user Anne.

Monarch Swarm v2.2 Tutorial 31
To unsubscribe to any of the objects, repeat the steps above, but this time, click the
corresponding Unsubscribe button.
Now that you’ve subscribed to Workspace1, you’ll receive a notification when other users make changes to it. The same is true for the other objects you are subscribed to. The creators of the objects you subscribed to (e.g., Anne in this lesson) will also receive a notification should you make changes to the objects they created.
Viewing Notifications Notifications are sent to you whenever a user you have followed or subscribed to modifies or shares a Monarch Swarm library object and when another user follows you or likes any of your data sources, workspaces, and models. You also receive notifications when a curator approves
or rejects a Monarch Swarm library object that has been shared with you.
Notifications display as numbers indicating number of updates to the left of your avatar.
When the Notifications icon is clicked, all of your notifications display.

32 Monarch Swarm v2.2 Tutorial
The marker for new notifications remains active until you click the Mark all as Read link after you view these notes.

Monarch Swarm v2.2 Tutorial 33
[5] Report Trapping You’ve made it to Chapter 5!
In this chapter, we’ll begin working more intensively with data sources in Monarch Swarm,
particularly with report files. You will learn how to:
Load PDF data sources to the Monarch Swarm Library
Trap report data using the Auto-define template of the Report Design window
Trap report data manually
Edit field properties
Many of today’s reports come in the form of PDF, PRN, and TXT files. You could simply read
these files off your computer screen and learn about whatever they contain, but what if you wanted to use the data in these reports to perform further analysis? Let’s say you had a 150-page PDF report listing individual customer sales over 3 months and want to find out which three customers brought you the most sales. How would you go about doing so?
If your reports reside in the Monarch Swarm Library, you can define data extraction templates to quickly and consistently select data from a report and arrange them into an orderly table.
When you bring a report file into Monarch Swarm, you are asked whether to:
Save the data source without defining a model for it
Apply an existing report model to it
Begin report modeling
A model is a collection of data extraction templates, and modeling is the process of creating these templates.
What Is a Data Extraction Template? Imagine taking a piece of cardboard and cutting holes into it at specific locations. If you place this imaginary cardboard template on a printed report, you will see only the information that shows through the holes. Monarch Swarm uses electronic templates to extract information
from your report files in a similar manner. If you have blocks of data arranged in a repeating
manner throughout your report and you define a trap to capture the data in this block, you should be able to obtain the data from the same block each time you apply the template to a new report with the same structure. Ultimately, you build an electronic table from the data you extracted from your reports, and you can use this table as you would any other table in Monarch Swarm.

34 Monarch Swarm v2.2 Tutorial
The Report Design Window The Report Design window is your starting point for creating extraction templates.
The window is divided into two main panels, i.e., the Report Design panel and the Template Editor. The Report Design panel, which displays to the left, provides you with an overview of the table you are creating, including the report files used to create it and the templates and fields you have defined. The Template Editor, which displays to the right of the window is where the actual trapping operations take place.
Related Reading
The following links may be helpful as you learn to work with report
trapping:
• Creating Templates
• The Report Design Interface
In this chapter, we’ll create two data extraction templates in two ways: using Monarch Swarm’s Auto-define feature and manual trapping. When we bring in a report file into Monarch Swarm, we’ll select the Begin Report Modeling option. After this exercise, you should obtain a basic understanding of how to create templates for report files with a simple structure. As

Monarch Swarm v2.2 Tutorial 35
you gain confidence in your trapping skills, you can eventually learn how to work with other
trap types, such as the floating trap and regular expression traps.
USING THE AUTO-DEFINE FEATURE
Steps:
1. Return to the Monarch Swarm Library.
2. Drag and drop Classic.pdf into the Monarch Swarm Library.
The Add Classic Data Source page displays.
Because you are adding a PDF report to the Monarch Swarm library, you are asked
whether to save the report and model later, apply an existing model to the report, or
begin report modeling.
3. Click Begin Report Modeling.
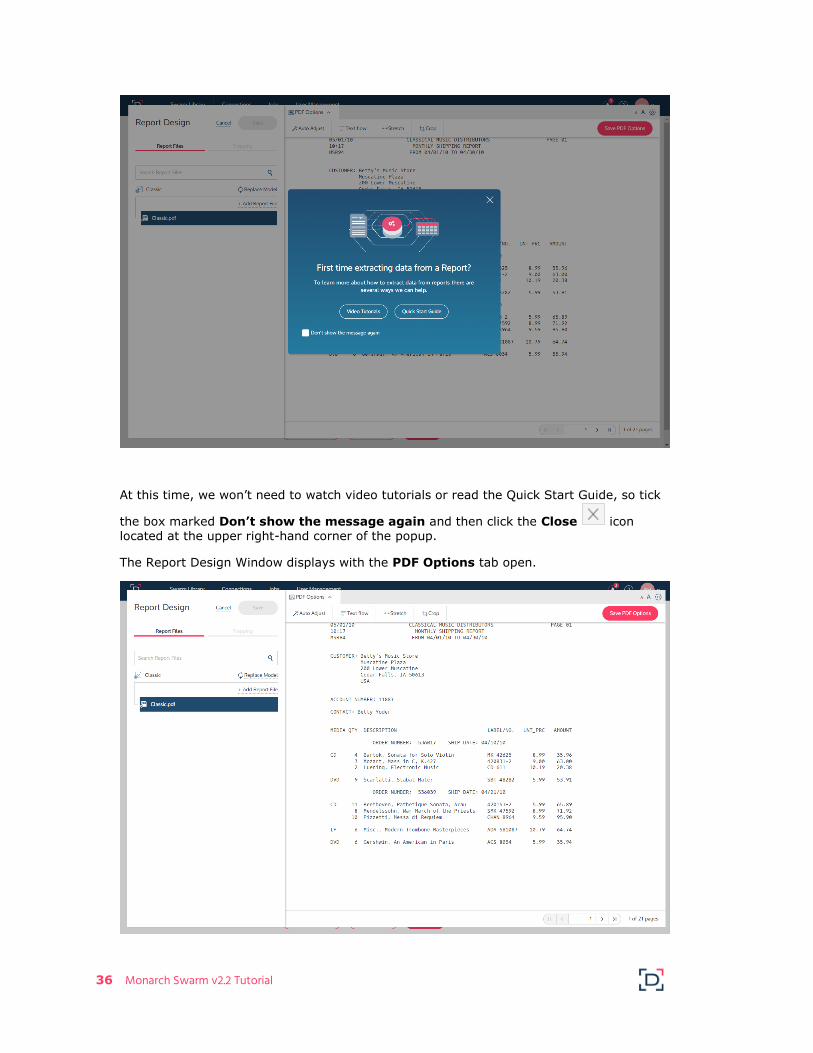
The following popup displays.
36 Monarch Swarm v2.2 Tutorial
At this time, we won’t need to watch video tutorials or read the Quick Start Guide, so tick
the box marked Don’t show the message again and then click the Close icon located at the upper right-hand corner of the popup.
The Report Design Window displays with the PDF Options tab open.

Monarch Swarm v2.2 Tutorial 37
Monarch Swarm provides several options to deal with PDF reports that may potentially
present data in an ill-fitting pattern. In this case, adjustments (e.g., stretch, text flow, crop) may be made via the PDF Options tab.
In the present example, Classic.pdf is a report file with a fairly consistent format. As
such, we won’t need to make adjustments to the data source and we can simply close the tab.
4. Click the Save PDF Options button.
Classic.pdf displays in the Report Design window.
5. Click the Auto-Define button in the Report Design panel.
The Template Editor produces several templates created logically from the report.

38 Monarch Swarm v2.2 Tutorial
6. Click Save to apply your changes and return to the Add Classic Data Source page.

Monarch Swarm v2.2 Tutorial 39
7. As we require no other changes to the file properties at this point, click Save to close the
Add Classic Data Source page.
The newly defined data source and its model are added to the Monarch Swarm Library.
If you open the Classic report in a workspace, the following table should display:
When the Workspace Definition panel is closed:

40 Monarch Swarm v2.2 Tutorial
Save this workspace as Workspace2. We’ll create another model for one more report file. This time, we’ll manually define two templates and fields.
Related Reading
Learn more about auto-defining templates here.
DEFINING TEMPLATES MANUALLY
Steps:
1. Drag and drop Patient.pdf to the Monarch Swarm Library.
2. When the Add Patient Data Source screen displays, click Begin Report Modeling.
The Report Design window displays with the PDF Options tab in focus.
3. Click Save PDF Options to continue opening Patient.pdf in the Report Design window.
Similar to Classic.pdf, Patient.pdf has a simple structure and defining templates for it will not be difficult.

Monarch Swarm v2.2 Tutorial 41
4. Click on the line selection area of the line beginning with Elmberry MO 63343 so that it
is selected. Then, in the Report Design panel, click + Add New > Detail. This instruction tells Monarch Swarm that we are creating a detail template.
The Template Editor is activated.
5. Click into the trap line right above the word BILL and then, using your keyboard, type out the word BILL. Notice how all similar lines (i.e., those with the word BILL in the exact same position in the report) are highlighted. Guillemets also appear in the line selection area next to lines containing data that match the trap.
Line selection area – Click here to select a line to use as a basis for
trapping

42 Monarch Swarm v2.2 Tutorial
You have just manually defined a trap, in this case, an exact trap. Let’s move on to defining fields.
6. In the sample text line, highlight the numbers 1839.39.
Notice how the Data Preview at the bottom of the Template Editor displays what would make the first column of your table. The rows of this table will be populated with the bill amounts you have just instructed the application to pick up.
Trap Line – Enter trap
characters here
Sample text line – Highlight text here to create fields for your
table

Monarch Swarm v2.2 Tutorial 43
Note also how the Report Design panel changes into a Field Definition panel. We’ll use
this panel to give our field a more meaningful name.
7. Hover your mouse over the field name (by default, Field Name XXX) in the Field
Definition panel to display the Edit Field Name icon and then click on it. Doing so
activates the field and enables you to change the name indicated.
8. Rename the field Bill Amount and then click Enter on your keyboard. The name of the field indicated in the Data Preview panel changes.
9. Click the Report Design link at the top left of the Field Definition panel to continue building your model.
10. Click on the line selection area next to the line beginning with Michael Canton and then, in the Report Design panel, click + Add New > Append.
The contents of the trap line and sample text line are updated with your selection.

44 Monarch Swarm v2.2 Tutorial
11. Click into the trap line directly above A in the service code A0028. Using the trap characters located above the trap line, create the following trap:
The trap characters ÃÑÑÑÑ instruct Monarch Swarm to search all of the lines of the report that include 1 alpha character followed by 4 numeric characters at the specific location in which it is located. Notice that all lines containing data corresponding to this trap are highlighted in the report. Guillemets also appear in the line selection area beside these lines.

Monarch Swarm v2.2 Tutorial 45
12. Highlight the text Michael Canton, A0028, and Son had Funny Bone Surgery. You can extend your highlighting a bit to capture names and symptoms that might be slightly longer than you are currently seeing.
All of the data captured by the fields you have just defined display in the Data Preview panel. Your table is nearly done!

46 Monarch Swarm v2.2 Tutorial
Related Reading
To learn about other methods for adding data sources, help is available in the topic Adding Data Sources to a Swarm Session. Note that as an analyst, you will need your IT system administrator’s help when adding a data source from a connection.
EDITING FIELD PROPERTIES
When fields are captured during report trapping, you can modify each field’s properties.
Renaming fields, which we did for the first field we captured in this lesson is just one of several properties you can modify.
Steps:
1. In the Data Preview panel, click on header of the field containing the entry Michael Canton. Change the name of this field to Patient Info.
2. At the bottom of the Field Definition panel, click Next Field to define a new name for the field containing the entry A0028.
3. Change the name of this field to Service Code.
4. Repeat Step 2 and then rename the next field Symptoms.
Your Data Preview panel should display as follows.
Now, note how, in the original report, the Symptoms field can span one or two lines. The
Bill amount consistently begins on the third line of the record. Unless we make adjustments to the Symptoms field, we will be unable to capture all of the symptoms written in the original report.
5. Click on the Advanced tab of the field definition for Symptoms. This tab displays several
options that will help you address multiple-line fields. At the moment, all we are concerned with is the end of the multiple-line field.
6. Locate the option End Field On > Line Count.
Monarch Swarm v2.2 Tutorial 47
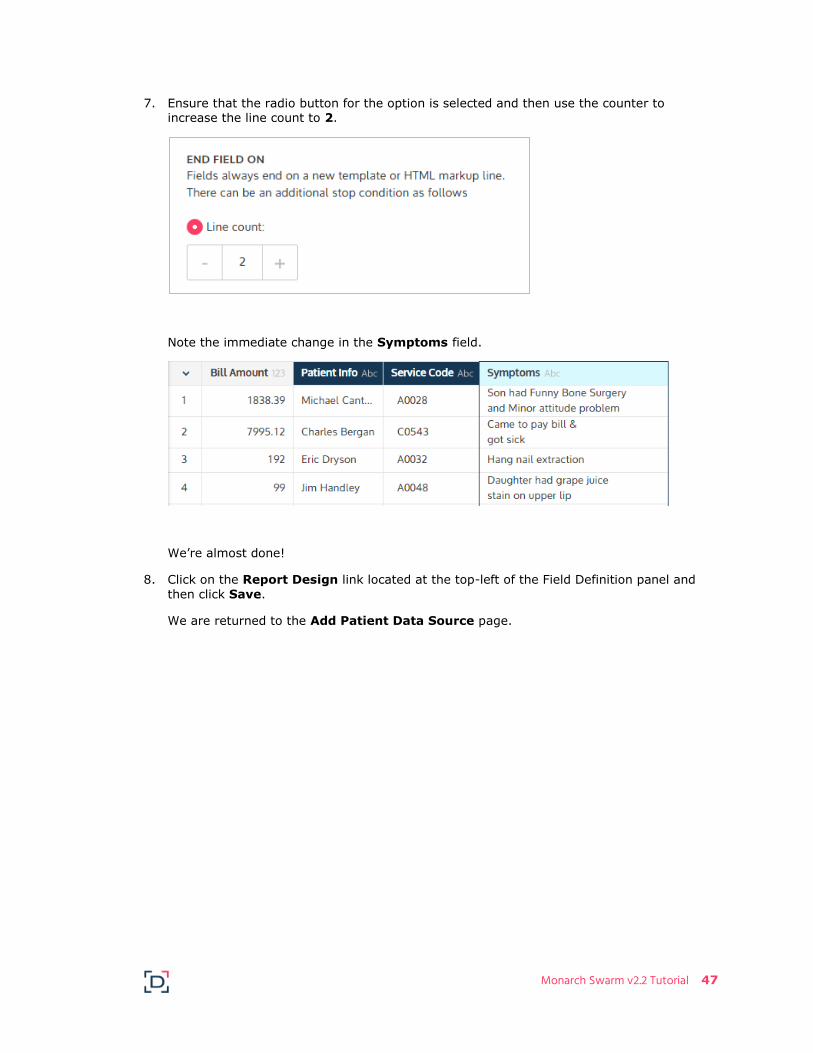
7. Ensure that the radio button for the option is selected and then use the counter to
increase the line count to 2.
Note the immediate change in the Symptoms field.
We’re almost done!
8. Click on the Report Design link located at the top-left of the Field Definition panel and
then click Save.
We are returned to the Add Patient Data Source page.

48 Monarch Swarm v2.2 Tutorial
9. No other changes are necessary at this point so simply click Save.
The data source and its model are displayed in the Monarch Swarm library.

Monarch Swarm v2.2 Tutorial 49
Independent Work
As an exercise, try extracting the header information and create fields for the report date and page number. Label these fields Report Date and Page No. You’ll need to use a Page Header template here.
To begin, select the report Patient and then choose Edit from the Library Action panel that displays to the left of your screen.
In the Edit Data Source page that displays, click on the Edit Model link. The Report Design window displays and you can begin your trapping activity.
Don’t forget to save your work!
Related Reading
The following links may prove useful as you learn how to manually create templates:
• Working with Multiple Line Fields
• Editing Field Properties
• Verifying Field Boundaries

50 Monarch Swarm v2.2 Tutorial
[6] Working with Workspaces and Tables In previous chapters, you learned how to create folders, add data sources to the Monarch
Swarm library, and even create workspaces. You also learned how to perform report trapping for PDF files. In this chapter, you will learn how to:
Add other data sources to a Monarch Swarm workspace
Perform some data preparation operations (i.e., move and hide columns, extract strings)
Join tables
Append tables
Work with several transformation operations (i.e., unpivot, group by, extract rows, sort)
Let’s begin by logging in as Bryson and opening Workspace2. This workspace should include the Classic.pdf table and model we created in Chapter 5.
Adding Single Tables to a Workspace Steps:
1. In the open workspace, click on the Add Data button on the Monarch Swarm toolbar.
The Add Data panel displays.

Monarch Swarm v2.2 Tutorial 51
2. Select the table Patient from the Add Data panel and then click Open.

52 Monarch Swarm v2.2 Tutorial
The Patient table is added to your workspace and becomes the table of focus. The
Workspace Definition panel, specifically the Info and Statistics tab, for this table is also exposed.
Related Reading
Besides tables residing in your Monarch Swarm library, you can also drag and drop files from a local or network folder or through an
established connection. You can learn more about these topics by clicking here.

Monarch Swarm v2.2 Tutorial 53
Moving Columns You may want to rearrange the columns of your table to make looking for information easier. This lesson will tell you how to do so.
Steps:
1. Ensure that the table Patient and its Info and Statistics tab are exposed.
2. Using your mouse, drag and drop the column named Bill Amount right after Symptoms.
Minimize the Workspace Definition panel by clicking on the Minimize icon when you are finished.

54 Monarch Swarm v2.2 Tutorial
The Patient report should now display as follows in your workspace:
Adding Multiple Tables to a Workspace In a previous lesson, we learned how to add a single table to our workspace. In reality, though, you can quickly add several tables to your workspace as long as they reside in the same location. In this exercise, we’ll do just that.
Steps:
1. Click Add Data on the Monarch Swarm toolbar to display the Add Data panel.
2. Select the Tutorial Files folder to expose its contents.
3. Select the data sources Software Sales – January 2018: Employee Sales, Software Sales – January 2018: Employee List, Software Sales – Feb 2018: Sheet1, and Software Sales – March 2018.xls and then click Open.

Monarch Swarm v2.2 Tutorial 55
All four data sources are added to your workspace.

56 Monarch Swarm v2.2 Tutorial
Preparing Data Analysts are faced with the challenge of extracting meaningful information from the copious amounts of data often contained within reports.
The three data sources we have just added to our workspace include sales figures for software sold according to location, type, and industry for the first quarter of the year.
Suppose Bryson was asked to determine in which state the largest software sale was made for the quarter and what type of software was sold to determine how future marketing efforts should be directed. He can certainly accomplish this task by manually going over each report
and picking out the largest numbers from each one but how can he be sure that his tallies are correct? More importantly, how long would he spend doing it?
Let’s take a look at each of the Software Sales tables we have just opened.
Software Sales – January 2018.xls contains two tables: the first includes details of the salesperson who sold software, his/her location, and his/her employee number and the second contains details of the actual sale against employee numbers. Each worksheet includes 966 rows. No location information appears in the table containing sales figures so Bryson will have
to move back and forth between two tables to identify which location sold the most of what type of software. Moreover, two or more salespersons living in the same state but in different cities might have sold the same software so their sales must be added to obtain a total amount.
Software Sales – February 2018.xls is a 1,000 row table containing the fields Salesperson, Location, Total Sales, Software, and Industry. Among the reports Bryson must work with, this
is probably the easiest to analyze. However, the problem of multiple sales for the same software in different cities but the same state remains.
Software Sales – March 2018.csv opens to display a 976-row table. This table is unique
from the first two sales reports because, in this table, the software types are presented as columns instead of rows and all of the numbers in the table indicate actual sales. This structure will complicate Bryson’s task immensely because once he successfully transforms the columns into rows, the 976-row table can quickly become a 4880-row one. Again, the problem
of multiple sales for the same software in different cities but the same state will be encountered in this table and even magnified on account of the sheer amount of data that must be combed through.
The rest of the lessons in this chapter will give you a good example of how data preparation and transformation operations in Monarch Swarm can help Bryson complete his task within minutes.
The simplest way to go about Bryson’s task is to find a way to combine all of the data
available into a single dataset and then group and sort against some parameter.

Monarch Swarm v2.2 Tutorial 57
Our strategy to accomplish Bryson’s task can be illustrated as follows:
In brief, the two tables in the January sales report and the individual tables in the February
and March sales reports will be prepared so that they all feature a similar structure that can be used as a basis for combining them. Once combined and cleaned, values will be grouped and sorted to obtain a final sales table that should show the largest total sale made stratified by location and software type.
PREPARING SOFTWARE SALES – JANUARY 2018 BY JOINING
Steps:
1. Select the tables Software Sales – January 2018: Employee List and then click Transform Table > Join on the Monarch Swarm toolbar.

58 Monarch Swarm v2.2 Tutorial
The Join window displays. The Join window allows you to define joins in the Join Definition panel and then displays the results in the Result Preview panel. Note that Software Sales – January 2018: Employee List displays as Table 1 under the Tables selector.
2. In the Join Definition panel, click on the drop-down icon of the Table 2 selector and then choose Software Sales – January 2018: Employee Sales from the options that display.

Monarch Swarm v2.2 Tutorial 59
3. Use the Join Type drop-down to select a normal join and then tick on the Inner Join
icon.
4. Select Employee Number as join keys.
5. By default, all of the columns of both tables are selected, which means all of these columns will be displayed when the joined table is created. Since our goal is to find out the location of the largest sale made and the software type that made up that sale, we don’t
need the columns Employee Number, Salesperson, and Industry.
Go ahead and untick the boxes to the left of these column names.

60 Monarch Swarm v2.2 Tutorial
6. Finally, in the field provided on top of the Result Preview panel, enter Software Sales –
January 2018. This will be the name of our joined table. Click Apply when you are finished.
The joined table displays in your workspace as follows.
Note that our column names are Location, Total Sales, and Software Type. We’ll want to maintain these column names while we work with our other tables to simplify the combine operation we’re going to have to do later on.
We’re done with the first part of our strategy. Let’s move on to cleaning up Software Sales – February 2018.
PREPARING SOFTWARE SALES – FEBRUARY 2018 BY HIDING COLUMNS
Software Sales – February 2018.xls is the simplest among our tables. In this case, we’ll only need to hide and rename columns to match those of the January sales table.
Steps:
1. Select the table Software Sales – February 2018: Sheet 1 in your workspace and then hover your mouse over the column header for Salesperson.
2. Click on the drop-down arrow that appears and then select Hide from the options that display.

Monarch Swarm v2.2 Tutorial 61
The column Salesperson is hidden.
3. Repeat Step 2 to hide the column Industry.

62 Monarch Swarm v2.2 Tutorial
4. Hover your mouse over the column header for Software, click on the drop-down arrow
that appears and then select Rename from the options that display.
5. The column header is activated. Enter the name Software Type and then press Enter on your keyboard.
Your table displays as follows.
We’re done preparing the February sales table. Let’s work on Software Sales – March 2018.csv.
Monarch Swarm v2.2 Tutorial 63
PREPARING SOFTWARE SALES – MARCH 2018 BY UNPIVOTING
As we said earlier, the Software Sales – March 2018 table is unique from the first two data sources we worked on because, in this table, the software types are presented as columns instead of rows, which is what we need to be able to consolidate all of our sales figures into a single table. To format our table correctly, we will need to transform it. Two transformations may come to mind: Transpose and Unpivot. Let’s analyze each option here.
The Transpose transformation takes the columns Presentation, Scheduling, DataManagement, Processing, and VideoEditing and turns them into rows, which is what we
want. However, this transformation also takes the values under the first column (i.e., Location) and turns these into columns. This isn’t something we want, as the locations must remain in a single column.
In this case, the Unpivot transformation is a better solution for our needs because this transformation allows you to take specific columns and turn them into rows. This functionality will help keep the location column intact while allowing us to create the necessary rows we
need so that our table looks more like the first two tables we prepared.
Let’s do this now.
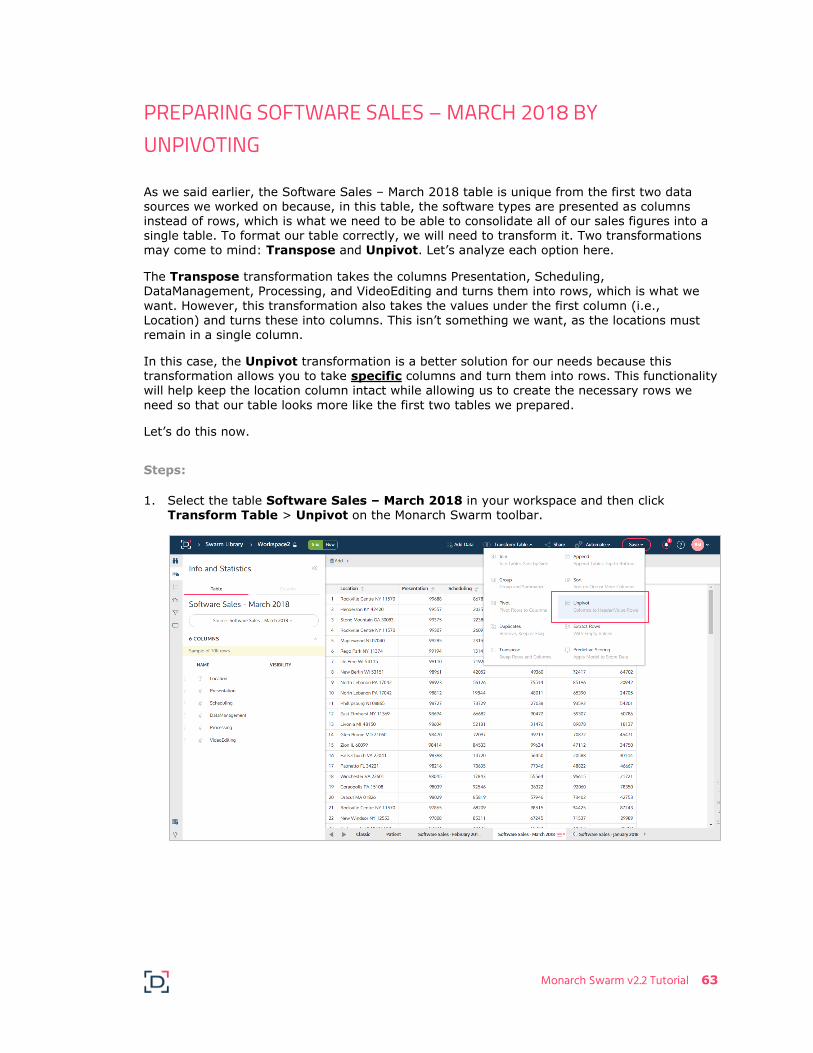
Steps:
1. Select the table Software Sales – March 2018 in your workspace and then click Transform Table > Unpivot on the Monarch Swarm toolbar.

64 Monarch Swarm v2.2 Tutorial
The Unpivot window displays with the table name displayed in the Table field.
The Unpivot window is divided into three panels: the Unpivot Definition panel, the Results Preview, and the Initial Table view. You can hide the Initial Table view by unticking the
box Show Initial Table. Note also that a name is automatically assigned to the table we will obtain after this transformation. You can rename this table if you wish but it isn’t necessary at this point.
2. In the Unpivot Definition panel, locate the Columns to Include section, and then click
on the Unpivot icons located to the left of the columns Presentation, Scheduling, Processing, DataManagement, and Video Editing. These columns should move to the Unpivot Columns section of the window.
3. In the Columns to Include section of the window, tick the box for Location – this action instructs the application to include this column in the final unpivoted table.
Your Results Previews should show the following:

Monarch Swarm v2.2 Tutorial 65
4. Click Apply to save your changes.
We’re nearly done!

66 Monarch Swarm v2.2 Tutorial
Independent Work
As an exercise, use the skills you learned earlier to rearrange and rename your columns in the order of Location, Total Sales, and Software Type.
Your final table should display as follows:

Monarch Swarm v2.2 Tutorial 67
APPENDING TABLES
Now that you’ve prepared each of your tables, let’s combine them to obtain a single table. We’ll use Monarch Swarm’s Append functionality to do so. At the moment, Monarch Swarm is unable to perform multi-table appends so we will perform this append operation twice: once to append the January and February sales tables and then another time to append the January + February and March sales tables.
Steps:
1. Select the table Software Sales – January 2018 and then click Transform Table > Append on the Monarch Swarm toolbar.
The Append window displays. By now, you will be fairly familiar with the different panels that make up this window, having seen similar windows when we joined and unpivoted the January and March sales tables, respectively.
2. Note that in the Table selectors, Software Sales – January 2018 has been specified as Table 1. Click on the drop-down icon of the Table 2 selector and then choose Software Sales – February 2018: Sheet1.

68 Monarch Swarm v2.2 Tutorial
3. In the Columns section, deselect the boxes of the last two fields for Table 1. Leave other settings as is (in the present case, we are matching by name because we ensured that all of our column names were consistent between tables while we were preparing them).
4. Rename this append as Append-Jan+Feb and then click Apply.
Your table should display as follows:
The tables indicated in these selectors specify which tables will be appended. Use the drop-downs provided to select new or change tables to append.

Monarch Swarm v2.2 Tutorial 69
Independent Work
Repeat the steps outlined in this lesson to append the tables
Append-Jan+Feb and Software Sales – March 2018 Unpivot. Again, you will be matching columns by name. Rename your table Total Sales – 1st Quarter 2018.
The following images will guide you through this exercise:

70 Monarch Swarm v2.2 Tutorial
When done, your completely appended table displays in your workspace as follows:

Monarch Swarm v2.2 Tutorial 71
In case you were wondering, your table has 6,837 rows!
FINAL PREPARATION ACTIVITIES
Now that we’ve got the heavy prep and transformation operations out of the way, we’ve only got a few steps to go.
Remember that our (Bryson’s) goal was to determine in which state the largest software sale was made for the quarter and what type of software was sold. Since our locations include city, state, and zip code, we’ll need to extract zip codes and then group sales by software type and location. A final sort of the Total Sales column should give us our answer!
Let’s begin.

72 Monarch Swarm v2.2 Tutorial
Extracting Strings from Rows
Steps:
1. Select the table Total Sales – 1st Quarter 2018 and then click on the column header of Location. A set of data prep operations you can perform to the column display above the
table.
2. From the data prep options, select Extract > Using Position and Length.
The Extract options display above the table.

Monarch Swarm v2.2 Tutorial 73
How do we begin extracting zip codes? Notice how each location always ends the same
way: 2 letters to indicate the state, a space, and 5 numbers to indicate the zip code. We can’t predict how many characters to extract from the beginning of each location string because city names vary in length, so we’ll begin extracting from the end of the string.
3. Click the + button of the And Length field until you reach the value 8. Then, tick the box for Read from End of the String and then click Apply.
Now that we have an 8-character string for all values of Location, we can easily extract the state from each value.
4. From the data prep options, choose Extract > Using Position and Length once more.
5. Click the + button of the And Length field until you reach the value 2 and then click
Apply.

74 Monarch Swarm v2.2 Tutorial
Your table displays as follows:
We’re just two operations away from obtaining our final table. Now we apply the Group transformation to tally all sales amounts according to location and software type.
Grouping Field Values
Steps:
1. Ensure that the table Total Sales – 1st Quarter 2018 is still selected and then click Transform Table > Group on the Monarch Swarm toolbar.
The Group window displays.
2. In the Columns to Include section of the Group Definition panel, tick the Group icons for Location and Software Type.
These columns should move to the Group Columns section of the panel.
3. In the Columns to Include section, tick the box for Total Sales and then ensure that the aggregation function SUM is selected under the Function Applied field. Use the drop-
down provided if necessary.

Monarch Swarm v2.2 Tutorial 75
4. Click Apply when you are finished.
Your 6,837-row table is transformed into a 162-row table in a matter of seconds.

76 Monarch Swarm v2.2 Tutorial
Now that we’ve grouped our software sales figures according to location and software type, we
only need to sort our table based on total sales to determine in which state the largest sale for the quarter was made and what type of software was sold.
Sorting Fields
Steps:
1. Ensure that the table Total Sales – 1st Quarter 2018 GroupBy is selected and then click Transform Table > Sort on the Monarch Swarm toolbar.
The Sort window displays.
2. Name this sort Total Sales - Q1 - Location and Type - Clean Sort.
3. In the Sort Columns section of the Sort Definition panel, use the drop-down arrow provided to select a sort order of Descending for the field Sum(Total Sales).
4. Click Apply when you are finished.

Monarch Swarm v2.2 Tutorial 77
Your final table displays.
This table will show you that:
• The largest software sale for the first quarter of 2018 was made in the state of New
Jersey.
• The largest type of software sold was video editing software.
In fact, our table also shows that, overall, New Jersey, New York, and Pennsylvania are the top three states for generating software sales. This knowledge may encourage Bryson’s marketing director to either channel more resources into these states to maximize revenue or funnel some of such resources to other efforts because these states are steadily generating income anyway.
Go ahead and save this workspace as Workspace2. We’ll use this workspace in the next and final chapter of our data prep activities.

78 Monarch Swarm v2.2 Tutorial
[7] Post-prep Activities In the previous chapter, you learned how to prep and transform tables. At this point, you can either export or publish your tables to the Monarch Swarm library or other locations so that
other users could use them to perform their own analytics or complete other tasks that depend on your prepped tables.
Tables can be exported and published to the Monarch Swarm Library, a local folder, a network folder, Amazon S3 storage, IBM Watson Analytics, or IBM Cognos Analytics as long as the proper connections to these locations have been established.
Note that to export tables to locations other than the Monarch Swarm library, a connection to a third-party application or other file system must be established.
A published table functions like a data source. It can be previewed, modified, used in another workspace, deleted, and shared. However, the content of this table changes when the original table is modified in the workspace from which the table was published. If the original table is deleted, the published table also disappears.
An exported table also functions like a data source. Unlike a published table, an exported table is independent of the workspace from which it was created. Its contents remain unchanged even if changes are made to the original table. The only way to modify the contents of an
exported table is to open it in a workspace and make direct changes to it.
In this lesson, we’ll use Bryson and create an export from the table we produced from our data prep activities in the previous chapter, i.e., Total Sales - Q1 - Location and Type - Clean Sort.
Exporting Tables Steps:
1. Ensure that Workspace2 is open in Monarch Swarm.
2. Navigate to the Workspace Overview tab of the Workspace Definition panel and then click the Exports link.

Monarch Swarm v2.2 Tutorial 79
3. In the Export Definition window that displays, click the +Add a new Export link.
4. Let’s modify the settings for Export 1. Use the Table to Export drop-down menu, if necessary, to ensure that the table Total Sales - Q1 - Location and Type - Clean Sort is selected.
5. In the Export as field, rename the table as Final Software Sales.

80 Monarch Swarm v2.2 Tutorial
6. As we are exporting the table to the Monarch Swarm library, leave the Where field as is.
Related Reading
If you wanted to export your table to any other location besides the Monarch Swarm Library, you would click on the Browse button to the right of the Where field and then use the Select Where to Export browser that displays to select the export
location. More on this topic can be found in the link Creating New Exports.
7. Expand the Advanced Settings drop-down and ensure that Overwrite is selected.
Related Reading
A detailed explanation of each of the properties you can modify when creating exports may be found in the topic Creating New Exports.
8. We’ll run the export right now. To do so, click Export Now.
If your export was successfully completed, the following banner displays across the top of your workspace.

Monarch Swarm v2.2 Tutorial 81
9. Hide this notification by clicking on the Close icon.
10. Let’s find out whether the table has indeed been exported to the Monarch Swarm library. Save the workspace and exit to the Monarch Swarm library.
The Monarch Swarm library should show the Final Software Sales table we have just exported.
Independent Work
Create a new export using the Classic table and then specify an Export as setting of My Own Export. Select Overwrite as an advanced setting and then simply minimize the Export window
and close the Workspace Definition panel. We’ll use this export in the next lesson, where we schedule an export to run.

82 Monarch Swarm v2.2 Tutorial
Scheduling an Export Let’s say you want the export to run at a specific time so that other users can obtain your report, including any changes made to it, at regular intervals. The automation function of Monarch Swarm helps you do just that. By scheduling an export to run at a certain time and frequency and letting Monarch Swarm do the rest, you do not have to run the export on your own every single time you need to. This type of a schedule is called a Time Schedule.
A second type of schedule, i.e., a Monitoring Schedule, can also be created. In this case, an export is executed only when a file or set of files is made available to a monitored location. In
Monarch Swarm v2.2, monitoring may be enabled for Amazon S3 or File System connections. Monitoring of the specified folder is performed every 5 minutes. If you wish to learn more about how to create monitoring exports, click here.
In the previous section, you successfully exported the Total Sales - Q1 - Location and Type - Clean Sort table to the Monarch Swarm library. For this lesson, we’ll create a time schedule to export the Classic table.
Steps:
1. Ensure that Workspace2 is open.
2. Navigate to the Workspace Overview tab of the Workspace Definition panel and then click the Schedules link.
Alternatively, you can select Automate > Schedule on the Monarch Swarm toolbar.
3. In the Schedule Definition screen, click the +Add a new Schedule link.

Monarch Swarm v2.2 Tutorial 83
The following window displays. Hide the reminder shown by clicking on the Close icon.
4. In the Export tab of the Schedule Settings panel, uncheck the box for Select All Exports and ensure that only the box for Export 2 is selected (i.e., the export you created as an exercise in the previous lesson).

84 Monarch Swarm v2.2 Tutorial
5. Click on the Recurrence tab.
For this lesson, we’ll create an export schedule that is set to run 5 minutes from the current time.
6. Select Time Schedule as a Schedule Type.
7. Use the Run Job drop-down to ensure that the value Once is selected.
8. Specify the date today and then indicate a time 5 minutes from now in the On field.
9. Save your schedule settings by clicking Enable Schedule.
10. Close the Schedule Definition window by clicking the Hide this view icon.
11. Save your workspace and exit to the Monarch Swarm library.
In 5 minutes, your Monarch Swarm Library should show the following data source (you may need to refresh your browser to see the exported table).

Monarch Swarm v2.2 Tutorial 85
A quick preview of this table should show Classic data.
Related Reading
Learn how to modify schedule properties in the Modifying Schedule Properties topic found in the Monarch Swarm help file.
Publishing Tables In this lesson, we’ll publish the Total Sales - Q1 - Location and Type - Clean Sort table to the Monarch Swarm library.
Steps:
1. Open Workspace 2.
2. Navigate to the Workspace Overview tab of the Workspace Definition panel and click the Published Tables link.

86 Monarch Swarm v2.2 Tutorial
All of the tables that can be published in the workspace display in the Tables Published as Data Sources panel.
3. Click the Publish link beside the Total Sales - Q1 - Location and Type - Clean Sort table (you’ll have to use the scroll bar to the right of this panel to locate the table).

Monarch Swarm v2.2 Tutorial 87
The Publish as Data Source dialog box displays.
4. In the Data Source Name field, enter Total Sales. For the other fields, let’s leave them as is. Note that the default location is set to the Monarch Swarm library.
Similar to when we created an export, if you wanted to publish your table to any other location besides the Monarch Swarm Library, you could click on the Browse drop-down to the right of the Location field and then use the Select Where to Publish browser that displays to select the publish location.
Related Reading
You can also publish tables directly from within a workspace. Learn how to do so in the topic Publishing Data Sources.
5. Click Publish.
6. Let’s check whether our new data source has been successfully published. Save your workspace, and then exit to the Monarch Swarm library.
The Monarch Swarm library should now show the table you published.

88 Monarch Swarm v2.2 Tutorial
Independent Work
In a previous lesson, you learned about sharing objects. Go ahead and share the Total Sales table with user Anne by following the steps in the Sharing Data Sources lesson. This time, assign Anne editing privileges, login as Anne and then open the table in a new workspace.
If you performed the previous exercise correctly, Anne’s Monarch Swarm library should
display as follows:

Monarch Swarm v2.2 Tutorial 89
When opened in a workspace, the table should display as follows:

90 Monarch Swarm v2.2 Tutorial
[8] Conclusion Congratulations! You have just completed basic lessons on how to use Monarch Swarm.
By now, you should have gained a good idea of how you can leverage the application’s
capabilities to speed up your data preparation and analytics processes.
While such topics are not covered in this tutorial, if you wish to learn more about Monarch Swarm’s advanced capabilities, such as:
Creating and managing users and groups
Creating and working with connections
Adding data sources to workspaces or the Monarch Swarm library via connections
Working with calculated fields
Creating filters
Curating Monarch Swarm objects
you can consult the Monarch Swarm help file.
Note that some of these capabilities will also require you to be assigned the Administrator role. Curation requires that you be assigned the Curator role in addition to at least the Analyst role.