
MOMR (Andi) -- A4 - OPEC · 2020-02-11 · Oil market highlights Crude Oil Price Movements The OPEC...
94
Monthly Oil Market Report OPEC Monthly Oil Market Report OPEC 10 October 2014 Feature article: The product market outlook ahead of winter Oil market highlights Feature article Crude oil price movements Commodity markets World economy World oil demand World oil supply Product markets and refinery operations Tanker market Oil trade Stock movements Balance of supply and demand 1 3 5 11 17 35 43 56 63 67 75 83
Transcript of MOMR (Andi) -- A4 - OPEC · 2020-02-11 · Oil market highlights Crude Oil Price Movements The OPEC...

Monthly Oil Market ReportO P E CMonthly Oil Market ReportO P E C
10 October 2014
Feature article:The product market outlook ahead of winter
Oil market highlights
Feature article
Crude oil price movements
Commodity markets
World economy
World oil demand
World oil supply
Product markets and refi nery operations
Tanker market
Oil trade
Stock movements
Balance of supply and demand
1
3
5
11
17
35
43
56
63
67
75
83

Organization of the Petroleum Exporting Countries
Helferstorferstrasse 17, A-1010 Vienna, AustriaE-mail: [email protected]: www.opec.org

Oil market highlights Crude Oil Price Movements The OPEC Reference Basket fell $4.77 to stand at $95.98/b in September, as sluggish demand and ample supply continue to weight on the oil market. Nymex WTI slipped $3.04/b to $93.03/b in September, while ICE Brent dropped $4.83 to $98.57/b. Speculative net length in ICE Brent was down almost 85% from the peak seen in June 2014. The Brent-WTI spread narrowed to $5.54/b, the lowest since July 2013. World Economy Expectations for world economic growth in 2014 and 2015 remain unchanged at 3.2% and 3.6% respectively, following a re-basing on 2011 purchase power parity. The OECD is seen growing at 1.8% in 2014 and 2.1% in 2015, with the US experiencing a continued acceleration, while growth in the Euro-zone and Japan remains sluggish. China’s figures remain unchanged at 7.4% in 2014 and 7.2% next year. Growth in India is also unchanged at 5.5% this year and 5.8% in 2015. World Oil Demand Global oil demand growth in 2014 is anticipated to reach around 1.05 mb/d, unchanged from the previous report. Growth this year has been supported by positive performance of China, Brazil and Saudi Arabia, offsetting lower-than-expected growth in some OECD regions. In 2015, world oil demand is forecast to rise by 1.19 mb/d, in line with last month’s forecast. World Oil Supply Non-OPEC oil supply growth in 2014 is forecast at 1.68 mb/d, in line with the previous report. Growth was seen coming mainly from the US, Brazil and Canada, while Mexico, Indonesia and the UK are expected to see a decline. Non-OPEC supply is expected to increase by 1.24 mb/d in 2015. OPEC NGLs is seen growing by 0.2 mb/d in 2015 to average 6.03 mb/d. In September, OPEC crude production averaged 30.47 mb/d according to secondary sources, an increase of 402 tb/d from the previous month. Product Markets and Refining Operations A tightening gasoline market due to several unit outages lent support to crack spreads. This partially offset weaker middle distillates demand, allowing margins to continue the upward trend in the Atlantic Basin. In Asia, strong gasoline and fuel oil demand, along with falling crude prices, allowed margins in the region to recover. Tanker Market The dirty spot tanker market continued to be under pressure in September. Tankers in different segments showed lower freight rates as tonnage demand remained limited, while availability continued to see a surplus. Clean tanker freight rates improved in September driven by high market activity west of Suez. Stock Movements OECD commercial oil stocks rose by around 9.0 mb in August to stand at 2,679 mb. At this level, inventories were still 57.0 mb below the five-year average. Crude saw a surplus of 12.0 mb, while product stocks remained 69 mb below the five-year average. In terms of days of forward cover, OECD commercial stocks edged 0.1 day higher in August over the previous month to stand at 57.9 days. Balance of Supply and Demand Demand for OPEC crude in 2014 remains unchanged from the previous report at 29.5 mb/d. In 2015, demand for OPEC crude is seen averaging 29.2 mb/d, in line with the previous expectations.
OPEC Monthly Oil Market Report – October 2014 1

2 OPEC Monthly Oil Market Report – October 2014
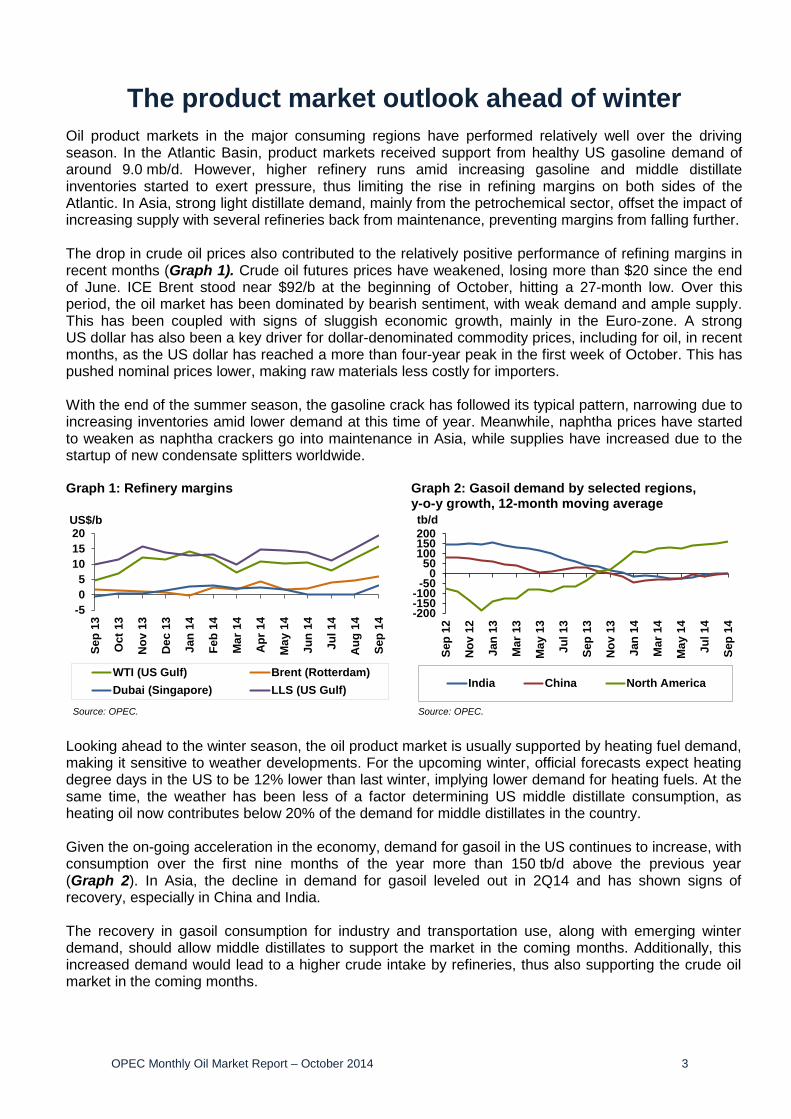
The product market outlook ahead of winter Oil product markets in the major consuming regions have performed relatively well over the driving season. In the Atlantic Basin, product markets received support from healthy US gasoline demand of around 9.0 mb/d. However, higher refinery runs amid increasing gasoline and middle distillate inventories started to exert pressure, thus limiting the rise in refining margins on both sides of the Atlantic. In Asia, strong light distillate demand, mainly from the petrochemical sector, offset the impact of increasing supply with several refineries back from maintenance, preventing margins from falling further. The drop in crude oil prices also contributed to the relatively positive performance of refining margins in recent months (Graph 1). Crude oil futures prices have weakened, losing more than $20 since the end of June. ICE Brent stood near $92/b at the beginning of October, hitting a 27-month low. Over this period, the oil market has been dominated by bearish sentiment, with weak demand and ample supply. This has been coupled with signs of sluggish economic growth, mainly in the Euro-zone. A strong US dollar has also been a key driver for dollar-denominated commodity prices, including for oil, in recent months, as the US dollar has reached a more than four-year peak in the first week of October. This has pushed nominal prices lower, making raw materials less costly for importers. With the end of the summer season, the gasoline crack has followed its typical pattern, narrowing due to increasing inventories amid lower demand at this time of year. Meanwhile, naphtha prices have started to weaken as naphtha crackers go into maintenance in Asia, while supplies have increased due to the startup of new condensate splitters worldwide. Graph 1: Refinery margins Graph 2: Gasoil demand by selected regions,
y-o-y growth, 12-month moving average
Looking ahead to the winter season, the oil product market is usually supported by heating fuel demand, making it sensitive to weather developments. For the upcoming winter, official forecasts expect heating degree days in the US to be 12% lower than last winter, implying lower demand for heating fuels. At the same time, the weather has been less of a factor determining US middle distillate consumption, as heating oil now contributes below 20% of the demand for middle distillates in the country. Given the on-going acceleration in the economy, demand for gasoil in the US continues to increase, with consumption over the first nine months of the year more than 150 tb/d above the previous year (Graph 2). In Asia, the decline in demand for gasoil leveled out in 2Q14 and has shown signs of recovery, especially in China and India. The recovery in gasoil consumption for industry and transportation use, along with emerging winter demand, should allow middle distillates to support the market in the coming months. Additionally, this increased demand would lead to a higher crude intake by refineries, thus also supporting the crude oil market in the coming months.
-505
101520
Sep
13
Oct
13
Nov
13
Dec
13
Jan
14
Feb
14
Mar
14
Apr
14
May
14
Jun
14
Jul 1
4
Aug
14
Sep
14
US$/b
WTI (US Gulf) Brent (Rotterdam)Dubai (Singapore) LLS (US Gulf)
Source: OPEC.
-200-150-100
-500
50100150200
Sep
12
Nov
12
Jan
13
Mar
13
May
13
Jul 1
3
Sep
13
Nov
13
Jan
14
Mar
14
May
14
Jul 1
4
Sep
14
tb/d
India China North America
Source: OPEC.
OPEC Monthly Oil Market Report – October 2014 3

4 OPEC Monthly Oil Market Report – April 2014

Crude Oil Price Movements
Crude Oil Price Movements The OPEC Reference Basket fell in September as weak demand, ample supply and a stronger US dollar continued to put pressure on the oil market since the end of June this year. The ORB dropped $4.77 to $95.98/b in September and its year-to-date value stood at $103.78/b. Oil futures tumbled to their lowest point in more than 1½ years, as output from the Atlantic Basin and the Middle East flooded the market, outweighing fears of supply disruptions. Nymex WTI declined $3.04 to $93.03/b over the previous month, but year-to-date was higher by $1.94 at $99.62/b compared with the same period a year earlier. The ICE Brent front-month dropped $4.83 to $98.57/b. Year-to-date, ICE Brent was lower by $1.50 at $106.99/b. Speculative net length in ICE Brent have fallen to a two-year low and are down around 85% below a record level seen in July. The Brent-WTI spread has narrowed to its smallest gap since July 2013, falling to $5.54/b in September. OPEC Reference Basket The OPEC Reference Basket (ORB) declined for a third consecutive month. The Basket dropped almost $12 or 11% of its value since June. Slow demand and ample supply — particularly in the Atlantic Basin and Asia — continue to be the key points pressuring the oil market. Meanwhile, weak economic data from Europe and China, as well as a strong US dollar and seasonal refinery maintenance, were also to blame for the oil market’s sluggish performance. The Basket lost close to $5 over the month again, to accumulate a total loss of around $12 in three months, starting in July 2014. On a monthly basis, the OPEC Reference Basket fell to an average of $95.98/b in September, down $4.77, or 4.6%, from a month earlier. Year-to-date, the Basket was down, standing at $103.78/b compared with an average of $105.69/b a year earlier, $1.91 or 1.80% lower. Graph 1.1: Crude oil price movement, 2014
85
90
95
100
105
110
115
120
85
90
95
100
105
110
115
120
01 M
ay
08 M
ay
15 M
ay
22 M
ay
29 M
ay
05 J
un
12 J
un
19 J
un
26 J
un
03 J
ul
10 J
ul
17 J
ul
24 J
ul
31 J
ul
07 A
ug
14 A
ug
21 A
ug
28 A
ug
04 S
ep
11 S
ep
18 S
ep
25 S
ep
02 O
ct
US$/bUS$/b
OPEC Basket WTI Brent Dated
OPEC Monthly Oil Market Report – October 2014 5
Crude Oil Price Movements
Table 1.1: OPEC Reference Basket and selected crudes, US$/b
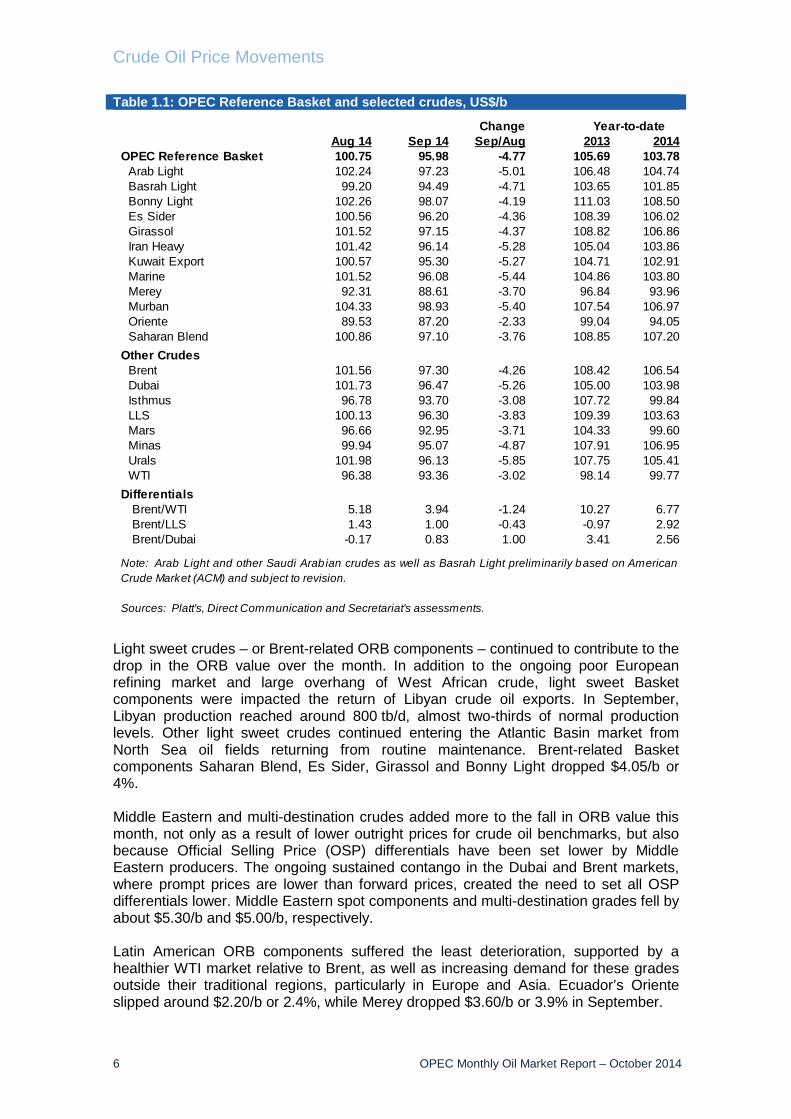
Light sweet crudes ‒ or Brent-related ORB components ‒ continued to contribute to the drop in the ORB value over the month. In addition to the ongoing poor European refining market and large overhang of West African crude, light sweet Basket components were impacted the return of Libyan crude oil exports. In September, Libyan production reached around 800 tb/d, almost two-thirds of normal production levels. Other light sweet crudes continued entering the Atlantic Basin market from North Sea oil fields returning from routine maintenance. Brent-related Basket components Saharan Blend, Es Sider, Girassol and Bonny Light dropped $4.05/b or 4%. Middle Eastern and multi-destination crudes added more to the fall in ORB value this month, not only as a result of lower outright prices for crude oil benchmarks, but also because Official Selling Price (OSP) differentials have been set lower by Middle Eastern producers. The ongoing sustained contango in the Dubai and Brent markets, where prompt prices are lower than forward prices, created the need to set all OSP differentials lower. Middle Eastern spot components and multi-destination grades fell by about $5.30/b and $5.00/b, respectively. Latin American ORB components suffered the least deterioration, supported by a healthier WTI market relative to Brent, as well as increasing demand for these grades outside their traditional regions, particularly in Europe and Asia. Ecuador’s Oriente slipped around $2.20/b or 2.4%, while Merey dropped $3.60/b or 3.9% in September.
ChangeAug 14 Sep 14 Sep/Aug 2013 2014
OPEC Reference Basket 100.75 95.98 -4.77 105.69 103.78 Arab Light 102.24 97.23 -5.01 106.48 104.74 Basrah Light 99.20 94.49 -4.71 103.65 101.85 Bonny Light 102.26 98.07 -4.19 111.03 108.50 Es Sider 100.56 96.20 -4.36 108.39 106.02 Girassol 101.52 97.15 -4.37 108.82 106.86 Iran Heavy 101.42 96.14 -5.28 105.04 103.86 Kuwait Export 100.57 95.30 -5.27 104.71 102.91 Marine 101.52 96.08 -5.44 104.86 103.80 Merey 92.31 88.61 -3.70 96.84 93.96 Murban 104.33 98.93 -5.40 107.54 106.97 Oriente 89.53 87.20 -2.33 99.04 94.05 Saharan Blend 100.86 97.10 -3.76 108.85 107.20Other Crudes Brent 101.56 97.30 -4.26 108.42 106.54 Dubai 101.73 96.47 -5.26 105.00 103.98 Isthmus 96.78 93.70 -3.08 107.72 99.84 LLS 100.13 96.30 -3.83 109.39 103.63 Mars 96.66 92.95 -3.71 104.33 99.60 Minas 99.94 95.07 -4.87 107.91 106.95 Urals 101.98 96.13 -5.85 107.75 105.41 WTI 96.38 93.36 -3.02 98.14 99.77Differentials Brent/WTI 5.18 3.94 -1.24 10.27 6.77 Brent/LLS 1.43 1.00 -0.43 -0.97 2.92 Brent/Dubai -0.17 0.83 1.00 3.41 2.56
Year-to-date
Note: Arab Light and other Saudi Arabian crudes as well as Basrah Light preliminarily based on AmericanCrude Market (ACM) and subject to revision.
Sources: Platt's, Direct Communication and Secretariat's assessments.
6 OPEC Monthly Oil Market Report – October 2014

Crude Oil Price Movements
On 9 October, the OPEC Reference Basket weakened to $88.27/b, $7.71 under the September average. The oil futures market Global oil futures dropped for the third consecutive month to their lowest level in more than 1½ years in September, with US crude front-month posting its lowest monthly average since April 2013, while ICE Brent front-month ended at its lowest monthly value since June 2012. Quarter-to-quarter losses in 3Q14 were almost 6% of both Brent and WTI futures prices, the biggest quarterly retreat in two years. Oil prices have declined since the end of June as output from the Middle East, Africa and the United States outweighed fears of supply disruptions. Output improved substantially in Libya, with the latest figures showing production levels of around 800,000 b/d. On average, Libyan crude output over September was some 250,000 b/d higher than August. In addition, the crude market was pressured by weak economic data from the world's biggest energy consumers, further pointing to lacklustre demand growth at a time of strong supply. China's August factory output grew at its weakest pace in nearly six years, while US manufacturing data was also negative, with output falling for the first time in seven months in August. Pressure has also come from the currency side, with the US dollar appreciating by 3.2% since the previous month. Further pressure also emerged from a sharp month-end drop in US gasoline prices and end-of-quarter position squaring. The Nymex WTI front-month dropped $3.04/b or 3.2% over the month to average $93.03/b in September. Compared with the same period in 2013, the year-to-date WTI value is higher by $1.94/b or 1.99% at $99.62/b. The ICE Brent front-month contract declined by $4.83/b or 4.1% to average $98.57/b, falling below $100/b for the first time since June 2012. Year-to-date, ICE Brent was down by $1.50/b or 1.4% to $106.99/b from $108.49/b during the same period one year ago. Crude oil futures prices weakened in the second week of October. On 9 October, ICE Brent stood at $90.05/b and Nymex WTI at $85.77/b. Speculative net length in Brent crude futures have fallen to a two-year low, down about 85% since hitting a record level in June, data from ICE showed on Monday. Brent has fallen from more than $115/b in June to a two-year low of just below $95/b by the end of September. ICE data shows hedge funds cut their net long positions in Brent by 28,294 futures and options contracts since the end of August to 36,704 lots. In late June they held a net long positions of 242,201 futures and options contracts. US Commodity Futures Trading Commission (CFTC) data also shows that hedge fund and money managers decreased their net long US crude futures and options positions over the past three months to September as prices decreased. Nevertheless, the Nymex WTI speculator group held to its bullish sentiment in September, increasing its combined futures and options positions in US crude oil by 12,110 contracts to 201,863 lots. Moreover, total futures and options open interest volumes in the two markets increased in September by 81,280 lots to 3.85 million contracts.
OPEC Monthly Oil Market Report – October 2014 7
Crude Oil Price Movements
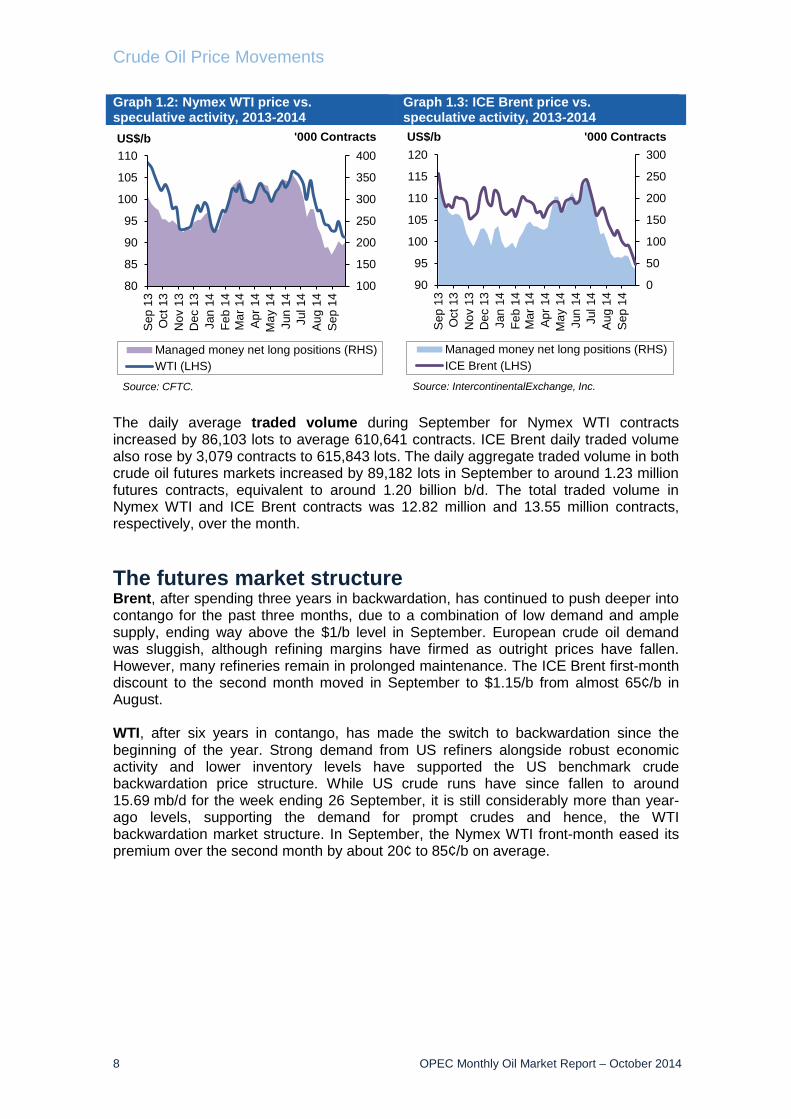
Graph 1.2: Nymex WTI price vs. speculative activity, 2013-2014
Graph 1.3: ICE Brent price vs. speculative activity, 2013-2014
The daily average traded volume during September for Nymex WTI contracts increased by 86,103 lots to average 610,641 contracts. ICE Brent daily traded volume also rose by 3,079 contracts to 615,843 lots. The daily aggregate traded volume in both crude oil futures markets increased by 89,182 lots in September to around 1.23 million futures contracts, equivalent to around 1.20 billion b/d. The total traded volume in Nymex WTI and ICE Brent contracts was 12.82 million and 13.55 million contracts, respectively, over the month. The futures market structure Brent, after spending three years in backwardation, has continued to push deeper into contango for the past three months, due to a combination of low demand and ample supply, ending way above the $1/b level in September. European crude oil demand was sluggish, although refining margins have firmed as outright prices have fallen. However, many refineries remain in prolonged maintenance. The ICE Brent first-month discount to the second month moved in September to $1.15/b from almost 65¢/b in August. WTI, after six years in contango, has made the switch to backwardation since the beginning of the year. Strong demand from US refiners alongside robust economic activity and lower inventory levels have supported the US benchmark crude backwardation price structure. While US crude runs have since fallen to around 15.69 mb/d for the week ending 26 September, it is still considerably more than year-ago levels, supporting the demand for prompt crudes and hence, the WTI backwardation market structure. In September, the Nymex WTI front-month eased its premium over the second month by about 20¢ to 85¢/b on average.
100
150
200
250
300
350
400
80
85
90
95
100
105
110Se
p 13
Oct
13
Nov
13
Dec
13
Jan
14Fe
b 14
Mar
14
Apr 1
4M
ay 1
4Ju
n 14
Jul 1
4Au
g 14
Sep
14
US$/b
Managed money net long positions (RHS)WTI (LHS)
'000 Contracts
Source: CFTC.
0
50
100
150
200
250
300
90
95
100
105
110
115
120
Sep
13O
ct 1
3N
ov 1
3D
ec 1
3Ja
n 14
Feb
14M
ar 1
4Ap
r 14
May
14
Jun
14Ju
l 14
Aug
14Se
p 14
US$/b
Managed money net long positions (RHS)ICE Brent (LHS)
'000 Contracts
Source: IntercontinentalExchange, Inc.
8 OPEC Monthly Oil Market Report – October 2014

Crude Oil Price Movements
Table 1.2: Nymex WTI and ICE Brent forward curves, US$/b
The Brent-WTI spread has narrowed to its smallest gap in more than 1½ years, as higher supply and poor demand have sent the North Sea benchmark to two-year lows. The Brent premium to WTI fell to $5.54/b in September, the narrowest spread since July 2103. Strong demand from US refiners ‒ alongside robust economic activity and lower inventory levels ‒ has supported the US benchmark crude price. US crude stockpiles fell in September as imports dropped, data from the US Energy Information Administration shows. US imports to the Gulf Coast have touched six-year lows in recent months as domestic shale production reduced the need for foreign crude, particularly from West Africa. The prompt ICE Brent/Nymex WTI spread narrowed by $2 over the month to average $5.54/b. Graph 1.4: Nymex WTI and ICE Brent forward curves, 2014
The light sweet/medium sour crude spread Sweet/sour differentials widened in September significantly in Europe and moderately in Asia, while the spread narrowed slightly in the US Gulf Coast (USGC). The Middle East crude market weakened as inbound cargoes from the Atlantic Basin kept the Asia Pacific market well supplied. Asia Pacific sweet crudes were also affected by arbitrage cargoes arriving in the region from the Atlantic Basin. Brent's narrow premium to Dubai made it economically viable to ship Brent-linked grades to Asia, predominantly from West Africa. The Tapis-Dubai spread widened by about 30¢ to $5.50/b in September. In Europe, the Russian medium sour Urals premium was heavily discounted over North Sea Dated Brent this month. The sour grade was under pressure from plentiful
85
90
95
100
105
85
90
95
100
105
1FM 2FM 3FM 4FM 5FM 6FM 7FM 8FM 9FM 10FM 11FM 12FM
US$/bUS$/b
ICE Brent: 25 Aug 14 ICE Brent: 25 Sep 14Nymex WTI: 25 Aug 14 Nymex WTI: 25 Sep 14
FM = future month.
Nymex WTI 1st FM 2nd FM 3rd FM 6th FM 12th FM
25 Aug 14 93.35 92.88 92.68 92.48 91.5625 Sep 14 92.53 91.78 91.30 90.38 89.43
ICE Brent1st FM 2nd FM 3rd FM 6th FM 12th FM
25 Aug 14 102.65 103.36 103.89 104.64 103.8125 Sep 14 97.00 97.63 98.21 99.39 100.14
FM = future month.
OPEC Monthly Oil Market Report – October 2014 9

Crude Oil Price Movements
sour crude supply and thinning refinery demand. Competing Middle Eastern grades moving to Europe have weighed on Urals, despite intense buying from China for storage in the Asia Pacific. Slightly weaker fuel oil margins also affected Urals negatively. On the other hand, firmer light distillate refining margins for light sweet crudes, tighter Caspian supplies and frequent production interruptions at the Buzzard field supported North Sea Brent. The Brent-Urals spread in September flipped from negative 40¢/b to a premium of about $1.15/b to the advantage of Brent, widening a hefty $1.55 from the previous month. In the USGC, the Light Louisiana Sweet (LLS) premium over medium sour Mars narrowed further by 12¢ to $3.35/b. Firm USGC refinery demand supported both deepwater crudes. Stronger Asian refinery buying of Latin American heavy sour crudes supported the USGC sour market for domestic and imported crudes. Graph 1.5: Brent Dated vs. Sour grades (Urals and Dubai) spread, 2014
-4
-2
0
2
4
6
-4
-2
0
2
4
6
01 M
ay
08 M
ay
15 M
ay
22 M
ay
29 M
ay
05 J
un
12 J
un
19 J
un
26 J
un
03 J
ul
10 J
ul
17 J
ul
24 J
ul
31 J
ul
07 A
ug
14 A
ug
21 A
ug
28 A
ug
04 S
ep
11 S
ep
18 S
ep
25 S
ep
02 O
ct
US$/bUS$/b
Dubai Urals
10 OPEC Monthly Oil Market Report – October 2014

Commodity Markets
Commodity Markets Commodity prices experienced a broad-based decline in September. Energy prices were down on lower crude oil prices. Non-energy commodity prices also dropped, with both metals and agriculture showing price declines among the majority of their components. Precious metals showed the largest price decline of the year due to the strengthening US economy. Trends in selected commodity markets Both supply and demand factors were behind the widespread decline in commodity prices during the month. Recent manufacturing data from China — where the Purchasing Managers’ Index was at 50.2 — suggested weakening demand for industrial metals. Meanwhile, divergent economic performance by the US, the Eurozone and Japan led to differing monetary policies and continued to translate into significant appreciation of the US dollar, which reached its highest point in four years based on the import-weighted modified Geneva I + US dollar basket1. This development could make commodities relatively more expensive for some countries. On the supply side, the prospect of bumper crops continues to weaken agricultural prices, which have reached multi-year lows. Meanwhile, overcapacity and receding supply disruption fears remain, pressuring metals. Base metals and minerals saw their largest decline since March, sliding down in all components. Slowing manufacturing momentum and a cooling property sector in China — average home prices were down 1.1% in August2 — suggest softening demand for metals. Moreover, significant overcapacity remains in iron ore, the price of which declined to four-year lows. Meanwhile, copper prices fell on the normalization of exports by mining companies from Indonesia. Aluminium prices also dropped — due to industry consolidation efforts by major producers — reversing the trend of the last three months, as new capacity entered the market following this year’s price recovery. Energy prices declined as crude oil prices retreated on easing demand and fading supply concerns. Natural gas prices increased slightly in the US, however a milder summer has provided the opportunity for larger-than-expected injections into storage, thereby limiting upside potential. Meanwhile, European inventories reported by Gas Infrastructure Europe were at 91.7%, up from 88% the previous month and representing the slowest increase this year, though hub prices increased due to the approaching winter season, thereby driving up average natural gas import prices on the continent. Agricultural prices declined on the expectation of bumper crops for grains and oilseeds. The US Department of Agriculture (USDA) has maintained its position regarding large grain and oilseed crops in the US during the month, thus leading to high year-end inventory projections. Meanwhile, major grain exporter Ukraine’s production doesn’t appear to have been significantly affected by the ongoing conflict. Corn prices continued their decline to multi-year lows on the record crop forecast for the US, while uncertainty remains about possible future corn demand for ethanol, as the US Environmental Protection Agency has not decided on its final biofuels mandate for
1 The ‘modified Geneva I+US$ basket’ includes the euro, the Japanese yen, the US dollar, the pound sterling and the Swiss franc, weighted according to the merchandise imports of OPEC Member Countries from the countries in the basket. 2 According to the China National Bureau of Statistics.
OPEC Monthly Oil Market Report –October 2014 11
Commodity Markets
2014. Soybean prices declined on larger-than-expected production this year, and increased competition from other sources of vegetable oil - palm and rapeseed, while wheat prices dropped on larger-than-expected crops in the US and receding fears of supply disruption in the Black Sea region. Among the developments that will require close monitoring are the impact of easing property market purchase- and mortgage lending restrictions in China, which could potentially support demand for metals, and the impact of continuing improvements in the US economy on commodity prices through further US dollar appreciation. On the geopolitical front, the potential de-escalation of the Ukrainian conflict could likely reduce support for natural gas prices. Table 2.1: Commodity price data, 2014
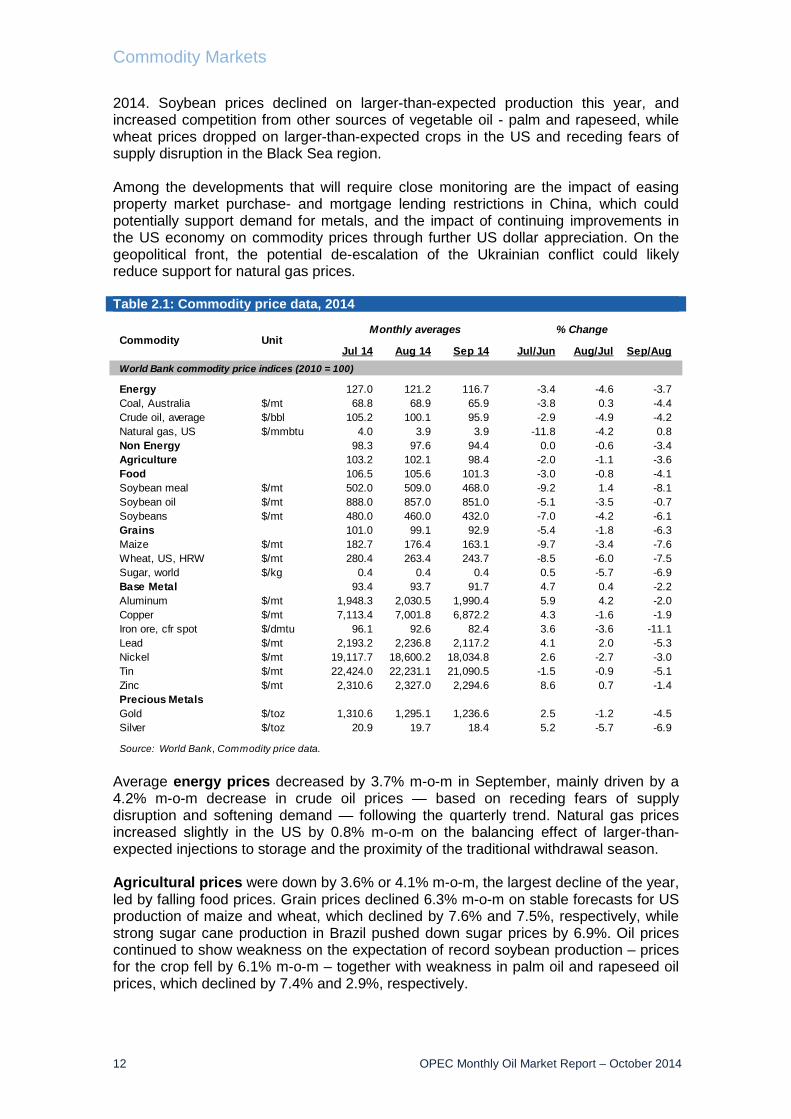
Average energy prices decreased by 3.7% m-o-m in September, mainly driven by a 4.2% m-o-m decrease in crude oil prices — based on receding fears of supply disruption and softening demand — following the quarterly trend. Natural gas prices increased slightly in the US by 0.8% m-o-m on the balancing effect of larger-than-expected injections to storage and the proximity of the traditional withdrawal season. Agricultural prices were down by 3.6% or 4.1% m-o-m, the largest decline of the year, led by falling food prices. Grain prices declined 6.3% m-o-m on stable forecasts for US production of maize and wheat, which declined by 7.6% and 7.5%, respectively, while strong sugar cane production in Brazil pushed down sugar prices by 6.9%. Oil prices continued to show weakness on the expectation of record soybean production ‒ prices for the crop fell by 6.1% m-o-m ‒ together with weakness in palm oil and rapeseed oil prices, which declined by 7.4% and 2.9%, respectively.
Jul 14 Aug 14 Sep 14 Jul/Jun Aug/Jul Sep/Aug
Energy 127.0 121.2 116.7 -3.4 -4.6 -3.7Coal, Australia $/mt 68.8 68.9 65.9 -3.8 0.3 -4.4Crude oil, average $/bbl 105.2 100.1 95.9 -2.9 -4.9 -4.2Natural gas, US $/mmbtu 4.0 3.9 3.9 -11.8 -4.2 0.8Non Energy 98.3 97.6 94.4 0.0 -0.6 -3.4Agriculture 103.2 102.1 98.4 -2.0 -1.1 -3.6Food 106.5 105.6 101.3 -3.0 -0.8 -4.1Soybean meal $/mt 502.0 509.0 468.0 -9.2 1.4 -8.1Soybean oil $/mt 888.0 857.0 851.0 -5.1 -3.5 -0.7Soybeans $/mt 480.0 460.0 432.0 -7.0 -4.2 -6.1Grains 101.0 99.1 92.9 -5.4 -1.8 -6.3Maize $/mt 182.7 176.4 163.1 -9.7 -3.4 -7.6Wheat, US, HRW $/mt 280.4 263.4 243.7 -8.5 -6.0 -7.5Sugar, world $/kg 0.4 0.4 0.4 0.5 -5.7 -6.9Base Metal 93.4 93.7 91.7 4.7 0.4 -2.2Aluminum $/mt 1,948.3 2,030.5 1,990.4 5.9 4.2 -2.0Copper $/mt 7,113.4 7,001.8 6,872.2 4.3 -1.6 -1.9Iron ore, cfr spot $/dmtu 96.1 92.6 82.4 3.6 -3.6 -11.1Lead $/mt 2,193.2 2,236.8 2,117.2 4.1 2.0 -5.3Nickel $/mt 19,117.7 18,600.2 18,034.8 2.6 -2.7 -3.0Tin $/mt 22,424.0 22,231.1 21,090.5 -1.5 -0.9 -5.1Zinc $/mt 2,310.6 2,327.0 2,294.6 8.6 0.7 -1.4Precious MetalsGold $/toz 1,310.6 1,295.1 1,236.6 2.5 -1.2 -4.5Silver $/toz 20.9 19.7 18.4 5.2 -5.7 -6.9
Source: World Bank, Commodity price data.
World Bank commodity price indices (2010 = 100)
UnitCommodity Monthly averages % Change
12 OPEC Monthly Oil Market Report – October 2014

Commodity Markets
Prices for base metals decreased by 2.2% m-o-m, with declines affecting all group components. Aluminium dropped by 2.0%, while copper fell by 1.9% on continuing softening of manufacturing expansion and the real estate market in China, as well as confirmation of the first copper shipments from Indonesia in months. Iron ore showed its steepest decline since May — down 11.1% m-o-m on continuing overcapacity. Within precious metals, average gold prices decreased by 4.5% m-o-m ‒ the largest drop in 2014 ‒ as positive readings of the US economy fuelled expectations for the beginning of monetary policy normalization by the US Federal Reserve in the upcoming months. Meanwhile, silver prices also declined sharply by 6.9% during the month. Graph 2.1: Major commodity price indices, 2012-2014
In September, the Henry Hub (HH) natural gas price rose slightly with inventory increases above market expectations, but with few weeks left of the injection season. The index gained 3¢, or 0.8%, to reach $3.9 per million British thermal units (mmbtu), after trading at an average of $3.87/mmbtu the previous month. The US Energy Information Administration (EIA) said utilities put 112 billion cubic feet (Bcf) of gas into storage during the week ending 26 September, 5 Bcf above the market expectation of a 107 Bcf increase. Gas in storage stands at 3,100 Bcf, which is 11.4% below the latest five-year average — one month ago it was 15.4% below that average. The EIA expects end-of-October working inventory levels of 3,477 Bcf, requiring average weekly injections of 75 Bcf. The agency also reported temperatures warmer than the 30-year average; the continuing trend of milder weather provides support to amounts injected, leading to above-average inventory increases.
60
80
100
120
140
160
60
80
100
120
140
160
Oct
12
Nov
12
Dec
12
Jan
13
Feb
13
Mar
13
Apr 1
3
May
13
Jun
13
Jul 1
3
Aug
13
Sep
13
Oct
13
Nov
13
Dec
13
Jan
14
Feb
14
Mar
14
Apr 1
4
May
14
Jun
14
Jul 1
4
Aug
14
Sep
14
IndexIndex
Energy Non-energy Agriculture Food
Base metals HH natural gas Gold
Source: World Bank, Commodity price data.
Base year 2010 = 100
OPEC Monthly Oil Market Report –October 2014 13

Commodity Markets
Graph 2.2: Inventories at the LME, 2013-2014
Investment flows into commodities The total open interest volume (OIV) in major US commodity markets remained stable at 8.4 million contracts in September, with OIV declining for crude oil and copper by 2.8% and 5.6%, respectively. Meanwhile, precious metals, natural gas, agriculture, and livestock OIV showed increases of 4.6%, 1.0%, 0.5% and 0.4%, respectively. Graph 2.3: Total open interest volume, 2013-2014
Total net length speculative positions in selected commodities decreased by 20% m-o-m to 587,750 contracts in September, due to the effect of steep declines in managed money net length on precious metals, copper and agriculture. Agricultural OIV increased by 0.4% m-o-m to 4,629,760 contracts in September. Meanwhile, money manager net long positions in agriculture fell by 22.0% to 167,461 lots on the trend of ample global supplies observed during the previous months of the quarter.
6,000
6,200
6,400
6,600
6,800
7,000
7,200
7,400
7,600
6,000
6,200
6,400
6,600
6,800
7,000
7,200
7,400
7,600
Sep
13
Oct
13
Nov
13
Dec
13
Jan
14
Feb
14
Mar
14
Apr
14
May
14
Jun
14
Jul 1
4
Aug
14
Sep
14
'000 Tonnes'000 Tonnes
Sources: London Metal Exchange and Haver Analytics.
7,000
7,500
8,000
8,500
9,000
7,000
7,500
8,000
8,500
9,000
Sep
13
Oct
13
Nov
13
Dec
13
Jan
14
Feb
14
Mar
14
Apr
14
May
14
Jun
14
Jul 1
4
Aug
14
Sep
14
'000 contracts
Source: US Commodity Futures Trading Commission.
'000 contracts
14 OPEC Monthly Oil Market Report – October 2014

Commodity Markets
Graph 2.4: Speculative activity in key commodities, net length
Henry Hub natural gas OIV increased by 1.0% m-o-m to 969,577 contracts in September. Money managers more than doubled their net long positions by 113.6% to 15,741 lots as the end of the injection season approached. Graph 2.5: Speculative activity in key commodities, as % of open interest
Copper’s OIV decreased by 5.5% m-o-m to 147,238 contracts in September. Money managers changed their stance to a net short position of 5,763 contracts on a widespread decline among metals on fear of weakening demand from China and receding supply disruptions. Gold’s OIV increased by 4.6% m-o-m to 381,520 contracts in September. Money managers cut their net length sharply in gold by 60.9% to 46,174 lots on the expectation of monetary policy normalization in the US if the country can sustain its current strong economic performance.
-100
100
300
500
700
900
-100
100
300
500
700
900Se
p 13
Oct
13
Nov
13
Dec
13
Jan
14
Feb
14
Mar
14
Apr 1
4
May
14
Jun
14
Jul 1
4
Aug
14
Sep
14
'000 contracts'000 contracts
Agriculture Gold WTI Natural gas Livestocks Copper
Source: US Commodity Futures Trading Commission.
-10
0
10
20
30
40
-10
0
10
20
30
40
Sep
13
Oct
13
Nov
13
Dec
13
Jan
14
Feb
14
Mar
14
Apr
14
May
14
Jun
14
Jul 1
4
Aug
14
Sep
14
%%
Agriculture Gold WTI Livestocks Copper Natural gas
Source: US Commodity Futures Trading Commission.
OPEC Monthly Oil Market Report –October 2014 15

Commodity Markets
Table 2.2: CFTC data on non-commercial positions, ‘000 contracts
Graph 2.6: Inflow of investment into commodities, 2011-2014
0
20
40
60
80
100
120
140
1Q 2Q 3Q 4Q 1Q 2Q 3Q 4Q 1Q 2Q 3Q 4Q 1Q 2Q Jul Aug
2011 2012 2013 2014
US$ bn
Agriculture Copper Gold Natural gas WTI crude oil
Source: US Commodity Futures Trading Commission.
Aug 14 Sep 14 Aug 14 % OIV Sep 14 % OIV
Crude oil 1,566 1,522 212 14 198 13Natural gas 960 970 7 1 16 2Agriculture 4,613 4,630 215 5 167 4Precious metals 526 550 118 22 46 8Copper 156 147 20 13 -6 -4Livestock 598 601 162 27 166 28Total 8,418 8,419 734 9 588 7Source: US Commodity Futures Trading Commission.
Open interest Net length
16 OPEC Monthly Oil Market Report – October 2014

World Economy
World Economy Solid momentum in the US is counterbalanced by ongoing challenges in the Euro-zone and Japan, leaving the OECD growth forecast unchanged at 1.8% for 2014 and at 2.1% for 2015. In the emerging economies, downward revisions have been applied to Russia and Brazil, which are expected to show low growth in 2014 at 0.3% and 0.6% respectively, before appreciating to 0.9% and 1.2% in 2015. China is forecast to grow by 7.4% in 2014 and 7.2% in 2015, while India’s forecast stands at 5.5% for this year and at 5.8% for the coming year, both unchanged from the previous month. This leads to an also unchanged global growth forecast of 3.2% for 2014 and 3.6% in 2015. The current growth forecast accommodates the current soft momentum in the global economic environment. Upside potential to the forecast is mainly coming from the US, which may achieve higher growth if its current momentum continues. Downside risk is coming from an earlier-than-expected rise in key interest rates in the US, a further weakening in the Euro-zone, ongoing challenges in Japan’s recovery and geopolitical issues. The economic growth numbers are now based on 2011 Purchase Power Parity levels as provided by the International Comparison Program of the World Bank. For comparability purposes, all numbers have been rebased throughout the economic section. Table 3.1: Economic growth rate and revision, 2014-2015, %
OECD OECD Americas US Momentum in the US is ongoing. After strong 2Q growth, output numbers and labour market improvements point to a continued solid recovery. This is also currently a support factor on a global basis. Growth in 2Q14 stood at a 4.2% q-o-q seasonally adjusted annualised rate (SAAR), significantly recovering from the decline of 2.1% in 1Q14. It is not clear yet at which pace this momentum will continue in 2H14, but it is forecast that the recovery will continue at a higher level than in 1H14. Given the experience of the past year’s political challenges over budgetary and debt ceiling issues, some uncertainty for next year’s growth also comes from possible consequences of the mid-term elections in November and the potential need for renewal of the current debt ceiling in mid-March 2015 at the latest, when the current agreement on the suspension of the US debt ceiling will end again.
World OECD US Japan Euro-zone China India Brazil Russia
2014F* 3.2 1.8 2.1 0.8 0.7 7.4 5.5 0.6 0.3
Change from previous month 0.0 0.0 0.0 -0.1 0.0 0.0 0.0 -0.1 0.0
2015F* 3.6 2.1 2.6 1.2 1.1 7.2 5.8 1.2 0.9
Change from previous month 0.0 0.0 0.0 0.0 0.0 0.0 0.0 -0.2 -0.2
* F = forecast.
OPEC Monthly Oil Market Report – October 2014 17

World Economy
Graph 3.1: US manufacturing and non-manufacturing ISM indices
The labour market has significantly improved over the past months, and the latest batch of data largely confirms this trend. The unemployment rate fell to 5.9% in September compared to 6.1% in August. Non-farm payrolls in September grew by 248,000, after an upwardly revised 180,000 in August. The share of long-term unemployed rose slightly again to 31.9% from a rate of 31.2% in August. Another soft spot in the labour market is the fact that the participation rate remained at a low level of only 62.7%, barely changing from the rate of 62.8% seen in August. The housing market continues recovering, but at a slowing pace. Prices rose by 4.4% y-o-y in July, as reported by the Federal Housing Finance Agency. This is clearly a lower level when compared with previous months. Prices have therefore recovered more than 20% since they bottomed out in 2011. Existing home sales have continued declining on a yearly basis. They fell by 5.3% y-o-y in August, after a decline of 4.5% y-o-y in July. Positively, vacancy rates declined for both homeowner properties and rentals, and growth in housing inventory has been almost flat in the past months. Consumer confidence retraced somewhat. The Conference Board consumer confidence index fell back to 86.0 in September from 93.4 in August, which marked the highest level since December 2007. The purchasing manager’s index (PMI) for the manufacturing sector, as provided by the Institute of Supply Management (ISM), has also come back slightly. It was recorded at 56.6 in September, after 59.0 in August, and 57.1 in July. The ISM for the services sector also fell slightly, dropping to a level of 58.6, compared to 59.6 in August and 58.7 in July, all high levels. While some upside potential is becoming visible, the GDP growth forecast remains unchanged at 2.1% in 2014. The 2015 growth expectation also remains unchanged at 2.6%, given that some uncertainties about the pace of the economic momentum prevail. Canada In Canada, improvements continue as well, along with the US, which is by far the largest export market for the significantly smaller economy, with more than two-thirds of exports being shipped to the US. After industrial production rose by 5.5% y-o-y in June, the largest increase since September 2011, it grew by 4.6% y-o-y in July. The PMI for manufacturing in September fell slightly to 53.5, after reaching 54.8 in August and 54.2 in July. Considering the ongoing momentum, the GDP growth forecast has been raised
56.6
58.6
45
50
55
60O
ct 1
3
Nov
13
Dec
13
Jan
14
Feb
14
Mar
14
Apr
14
May
14
Jun
14
Jul 1
4
Aug
14
Sep
14
Index
ISM manufacturing index ISM non-manufacturing index
Sources: Institute for Supply Management and Thomson Reuters.
18 OPEC Monthly Oil Market Report – October 2014

World Economy
by 0.1 percentage points (pp) for both 2014 and 2015, and stands now at 2.3% for both years. OECD Asia-Pacific Japan While some recovery in domestic demand becomes apparent, exports are declining again, and the drag from April’s sales tax increase continues to impact the economy negatively. It has been reported that 2Q14 GDP fell considerably at a 7.1% q-o-q SAAR, higher than the previous estimate of 7.1%. The magnitude of this decline was even greater than the strong increase of 6.0% q-o-q SAAR from 1Q14. In addition to challenges in domestic demand due to April’s sales tax increase, export markets were also weakening at the time. It remains to be seen now what actions will be taken by the government in combination with the Bank of Japan (BoJ). So far, the BoJ has not announced any further plans to increase the monetary base beyond its 2014 target. Moreover, the government’s room to manoeuvre is also limited given the high level of public debt. More focus will possibly be on the third pillar of the support measures, the structural changes. Another aspect for consideration will be the development of inflation in combination with an income increase. After the sales tax was hiked in April from 5% to 8%, consumer price inflation remained at a high level of 3.3% y-o-y in August, which is almost at the July level of 3.4%. While a key target for the government has been to raise inflation to a level of around 2%, adjusted for the sales tax increase, the price increase has not been counterbalanced by an increase in income. While at a quarterly level consumer price inflation stood at 3.6% y-o-y in 2Q14, average monthly earnings rose only by 1.6% during the same period. However, developments in July and August are pointing to some improvement as earnings rose by 3.9% y-o-y and 2.2% y-o-y, respectively. This might have also been a supporting factor for retail sales, which again moved into positive territory at 0.8% y-o-y in July and 1.3% y-o-y in August. While Japanese exports recovered in July when they rose by 3.9% y-o-y after two months of decline, they fell again by 1.3% y-o-y in August. Quarterly growth in 2Q stood at only 0.1% y-o-y. Industrial production has also been sluggish recently as it fell by 0.7% y-o-y in July and by 1.7% in August, the latest available number. Graph 3.2: Japanese PMI indices Graph 3.3: Japanese consumer confidence
index, NSA
52.551.7
46
48
50
52
54
56
58
Sep
13O
ct 1
3N
ov 1
3D
ec 1
3Ja
n 14
Feb
14M
ar 1
4Ap
r 14
May
14
Jun
14Ju
l 14
Aug
14Se
p 14
Index
Sources: Markit, Japan Materials Management Association and Haver Analytics.
Services PMI
Manufacturing PMI
40.5
36
38
40
42
44
46
Aug
12O
ct 1
2D
ec 1
2Fe
b 13
Apr 1
3Ju
n 13
Aug
13O
ct 1
3D
ec 1
3Fe
b 14
Apr 1
4Ju
n 14
Aug
14
Index
Sources: Cabinet Office of Japan and Haver Analytics.
OPEC Monthly Oil Market Report – October 2014 19
World Economy
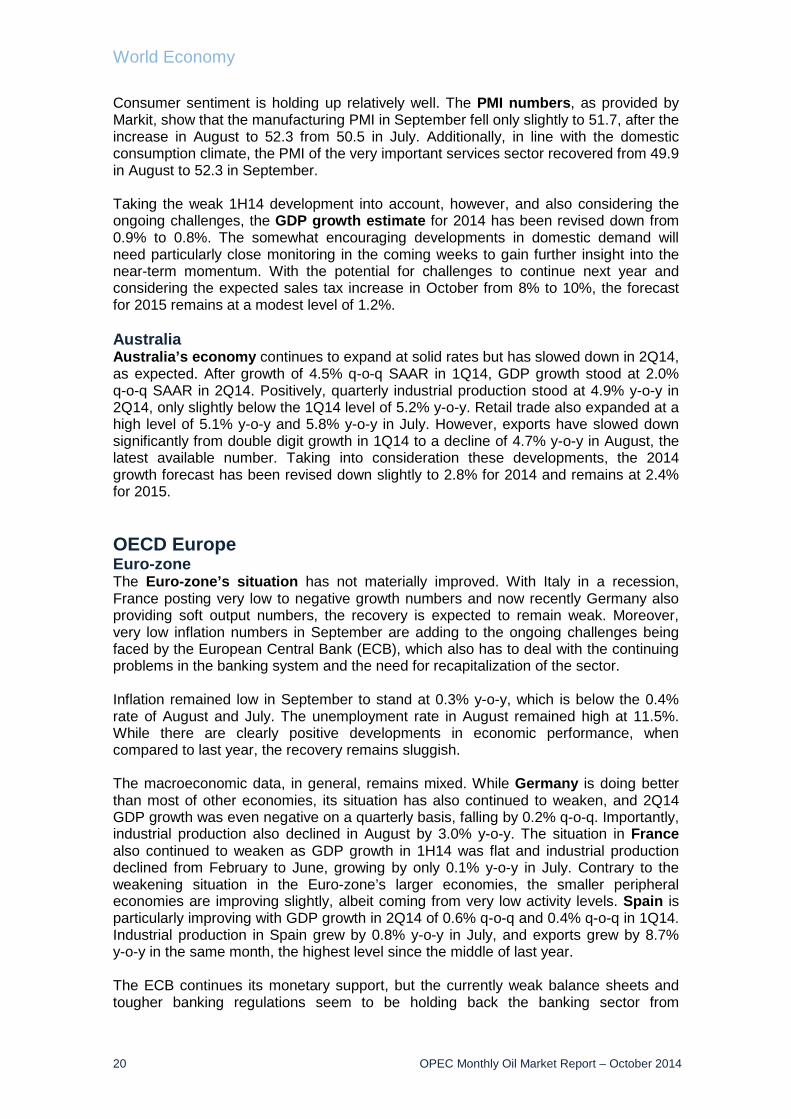
Consumer sentiment is holding up relatively well. The PMI numbers, as provided by Markit, show that the manufacturing PMI in September fell only slightly to 51.7, after the increase in August to 52.3 from 50.5 in July. Additionally, in line with the domestic consumption climate, the PMI of the very important services sector recovered from 49.9 in August to 52.3 in September. Taking the weak 1H14 development into account, however, and also considering the ongoing challenges, the GDP growth estimate for 2014 has been revised down from 0.9% to 0.8%. The somewhat encouraging developments in domestic demand will need particularly close monitoring in the coming weeks to gain further insight into the near-term momentum. With the potential for challenges to continue next year and considering the expected sales tax increase in October from 8% to 10%, the forecast for 2015 remains at a modest level of 1.2%. Australia Australia’s economy continues to expand at solid rates but has slowed down in 2Q14, as expected. After growth of 4.5% q-o-q SAAR in 1Q14, GDP growth stood at 2.0% q-o-q SAAR in 2Q14. Positively, quarterly industrial production stood at 4.9% y-o-y in 2Q14, only slightly below the 1Q14 level of 5.2% y-o-y. Retail trade also expanded at a high level of 5.1% y-o-y and 5.8% y-o-y in July. However, exports have slowed down significantly from double digit growth in 1Q14 to a decline of 4.7% y-o-y in August, the latest available number. Taking into consideration these developments, the 2014 growth forecast has been revised down slightly to 2.8% for 2014 and remains at 2.4% for 2015. OECD Europe Euro-zone The Euro-zone’s situation has not materially improved. With Italy in a recession, France posting very low to negative growth numbers and now recently Germany also providing soft output numbers, the recovery is expected to remain weak. Moreover, very low inflation numbers in September are adding to the ongoing challenges being faced by the European Central Bank (ECB), which also has to deal with the continuing problems in the banking system and the need for recapitalization of the sector. Inflation remained low in September to stand at 0.3% y-o-y, which is below the 0.4% rate of August and July. The unemployment rate in August remained high at 11.5%. While there are clearly positive developments in economic performance, when compared to last year, the recovery remains sluggish. The macroeconomic data, in general, remains mixed. While Germany is doing better than most of other economies, its situation has also continued to weaken, and 2Q14 GDP growth was even negative on a quarterly basis, falling by 0.2% q-o-q. Importantly, industrial production also declined in August by 3.0% y-o-y. The situation in France also continued to weaken as GDP growth in 1H14 was flat and industrial production declined from February to June, growing by only 0.1% y-o-y in July. Contrary to the weakening situation in the Euro-zone’s larger economies, the smaller peripheral economies are improving slightly, albeit coming from very low activity levels. Spain is particularly improving with GDP growth in 2Q14 of 0.6% q-o-q and 0.4% q-o-q in 1Q14. Industrial production in Spain grew by 0.8% y-o-y in July, and exports grew by 8.7% y-o-y in the same month, the highest level since the middle of last year. The ECB continues its monetary support, but the currently weak balance sheets and tougher banking regulations seem to be holding back the banking sector from
20 OPEC Monthly Oil Market Report – October 2014

World Economy
expanding debt-related financing. Lending of financial intermediaries to private households fell by 2.0% y-o-y in August and July, hardly better than the decline of 2.2% y-o-y in June and the minus 2.4% y-o-y in May. Graph 3.4: Euro-zone PMI indices Graph 3.5: Euro-zone consumer price index
and lending activity
While the situation generally remains fragile, the recent PMI numbers point to a continuation of the modest growth level. The latest PMI for manufacturing, as provided by Markit, stood at 50.3 in September, lower than the 50.7 in August and 51.8 in July. While the recovery in the Euro-zone has improved compared to the previous year, the weakening output indicators seen recently in some economies are highlighting that the development remains fragile. The GDP growth forecast has therefore been lowered by 0.1 pp for 2014 and now stands at 0.7%, while the growth forecast for 2015 remains at 1.1%, only slightly higher than in the current year. UK The United Kingdom continues recovering. Lead indicators point to a continued strong but slowing momentum. The PMI for manufacturing remained at a solid level of 51.6 but is now clearly below the 1H14 level of more than 55. After strong momentum in 1H14, the dynamic is slowly decreasing. While slightly lower than in 1H14, industrial production grew by 2.2% y-o-y in July and 2.5% y-o-y in August. Therefore, the 2014 GDP growth forecast remains unchanged at 2.9%, and the forecast for 2015 stays at 2.3% in anticipation of some moderation of the current momentum. Emerging and Developing Economies Indicators in Brazil this month point once again to a deceleration of exports accompanied by a weakening currency and worsening consumer sentiment. The manufacturing sector was back into contraction in September for the fifth time in the past six months. Recent indications obviously support the direction of the downward revisions made last month to GDP forecasts, which were 0.7% and 1.4% for 2014 and 2015, respectively. The GDP growth forecast is slightly lower this month at 0.6% for 2014 and 1.2% for 2015. In Russia, the manufacturing sector sent signals of improvement over the past three months. Yet, investigating the drivers behind that progress does not suggest a lasting
52.4
50.3
48
50
52
54
56
Sep
13O
ct 1
3N
ov 1
3D
ec 1
3Ja
n 14
Feb
14M
ar 1
4A
pr 1
4M
ay 1
4Ju
n 14
Jul 1
4Au
g 14
Sep
14
Index
Sources: Markit and Haver Analytics.
Services PMI
Manufacturing PMI
-4%
-2%
0%
2%
4%
6%
-1%
0%
1%
2%
3%
4%
Sep
09
Mar
10
Sep
10
Mar
11
Sep
11
Mar
12
Sep
12
Mar
13
Sep
13
Mar
14
Sep
14
CPI (LHS) MFI lending (RHS)
Sources: Statistical Office of the European Communities, European Central Bank and Haver Analytics.
% change y-o-y % change y-o-y
OPEC Monthly Oil Market Report – October 2014 21
World Economy
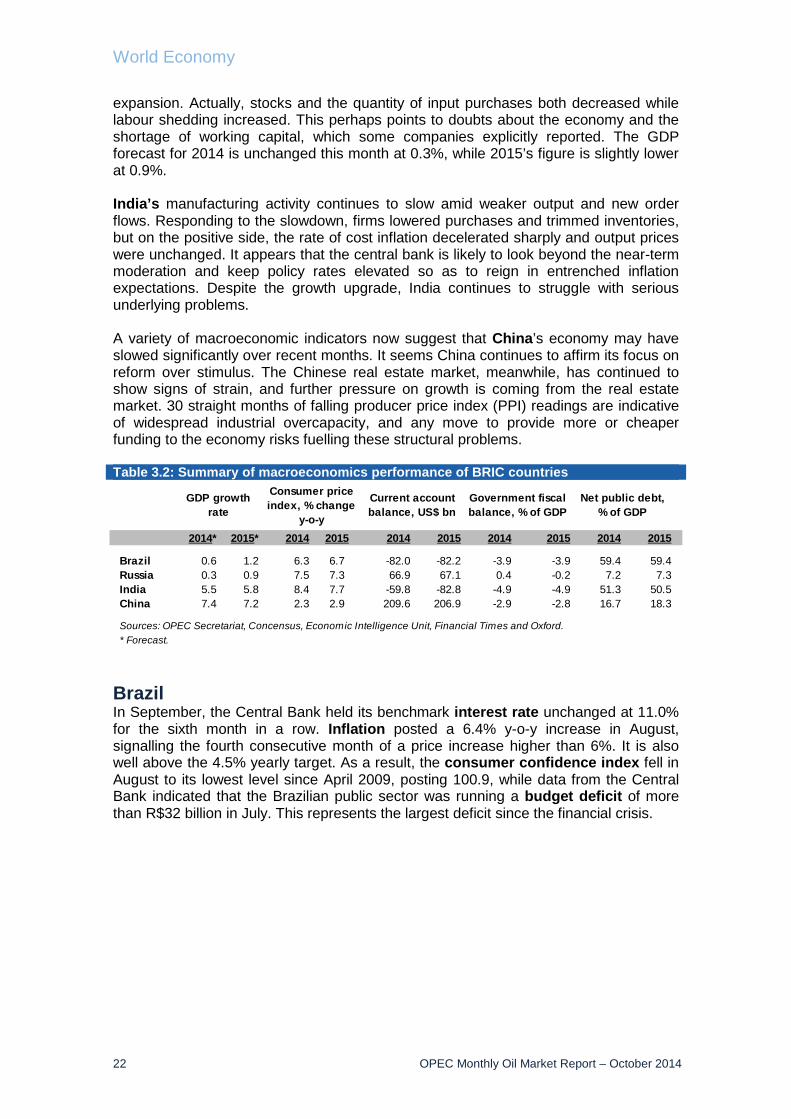
expansion. Actually, stocks and the quantity of input purchases both decreased while labour shedding increased. This perhaps points to doubts about the economy and the shortage of working capital, which some companies explicitly reported. The GDP forecast for 2014 is unchanged this month at 0.3%, while 2015’s figure is slightly lower at 0.9%. India’s manufacturing activity continues to slow amid weaker output and new order flows. Responding to the slowdown, firms lowered purchases and trimmed inventories, but on the positive side, the rate of cost inflation decelerated sharply and output prices were unchanged. It appears that the central bank is likely to look beyond the near-term moderation and keep policy rates elevated so as to reign in entrenched inflation expectations. Despite the growth upgrade, India continues to struggle with serious underlying problems. A variety of macroeconomic indicators now suggest that China’s economy may have slowed significantly over recent months. It seems China continues to affirm its focus on reform over stimulus. The Chinese real estate market, meanwhile, has continued to show signs of strain, and further pressure on growth is coming from the real estate market. 30 straight months of falling producer price index (PPI) readings are indicative of widespread industrial overcapacity, and any move to provide more or cheaper funding to the economy risks fuelling these structural problems. Table 3.2: Summary of macroeconomics performance of BRIC countries
Brazil In September, the Central Bank held its benchmark interest rate unchanged at 11.0% for the sixth month in a row. Inflation posted a 6.4% y-o-y increase in August, signalling the fourth consecutive month of a price increase higher than 6%. It is also well above the 4.5% yearly target. As a result, the consumer confidence index fell in August to its lowest level since April 2009, posting 100.9, while data from the Central Bank indicated that the Brazilian public sector was running a budget deficit of more than R$32 billion in July. This represents the largest deficit since the financial crisis.
2014* 2015* 2014 2015 2014 2015 2014 2015 2014 2015
Brazil 0.6 1.2 6.3 6.7 -82.0 -82.2 -3.9 -3.9 59.4 59.4Russia 0.3 0.9 7.5 7.3 66.9 67.1 0.4 -0.2 7.2 7.3India 5.5 5.8 8.4 7.7 -59.8 -82.8 -4.9 -4.9 51.3 50.5China 7.4 7.2 2.3 2.9 209.6 206.9 -2.9 -2.8 16.7 18.3
* Forecast.Sources: OPEC Secretariat, Concensus, Economic Intelligence Unit, Financial Times and Oxford.
GDP growth rate
Consumer price index, % change
y-o-y
Current account balance, US$ bn
Government fiscal balance, % of GDP
Net public debt, % of GDP
22 OPEC Monthly Oil Market Report – October 2014

World Economy
Graph 3.6: Brazilian inflation vs. interest rates
Graph 3.7: Brazilian consumer confidence index
The Brazilian trade balance recorded a $939 million deficit in September of 2014, compared with a $2,146 million surplus a year earlier. It is the first shortfall in seven months as exports contracted for the second month in a row. Exports fell 6.6% y-o-y to $19.6 billion in September, following a 4.5% drop in the previous month. When adjusted for working days, sales contracted at a faster 10.2%. Meanwhile, imports rose 9% on the year to $20.5 billion. Considering the first nine months of 2014, the country’s trade deficit widened to $690 million in September compared with a $249 million gap in August. Business conditions in the country’s manufacturing sector deteriorated in September for the fifth time in the past six months. The manufacturing PMI posted 49.3 in September, down from 50.2 in August, which represented the five-month high reading of the index. The survey indicated a contraction in production after August’s ramp-up. Modest reductions in new business and export orders were reported, while input costs fell for the first time in over five years. The unemployment rate in August rose to 5% y-o-y from July’s 4.9%. August’s reading represents a record low for the month as the labour market remains strong in the face of a recession in 1H14. Indicators this month point once again to a deceleration in exports accompanied by a weakening currency and worsening consumer sentiment. The manufacturing sector was back into contraction in September for the fifth time in the past six months. Recent indications obviously support the direction of the downward revisions made last month to GDP forecasts, which were 0.7% and 1.4% for 2014 and 2015, respectively. The GDP growth forecast is slightly lower this month at 0.6% for 2014 and 1.2% for 2015. Russia In September, Russia held its first sale of ruble bonds after nine cancellations. The Ministry of Finance perceives current borrowing costs as acceptable and will fulfill plans to offer another RUB223 billion this year. It will also offer RUB15 billion of local currency securities due in January 2028. The yield on the notes fell in September by 44 basis points as a cease fire in Ukraine reduced the chances of further geopolitical escalations. The Economy Ministry estimated capital outflows may drop to $50 billion next year if the geopolitical situation stabilizes and borrowing costs are little changed after raising this year’s estimate to $100 billion from $90 billion in its macroeconomic
6.4
11.0
7
8
9
10
11
12
5.05.25.45.65.86.06.26.46.6
Sep
13
Oct
13
Nov
13
Dec
13
Jan
14Fe
b 14
Mar
14
Apr
14
May
14
Jun
14Ju
l 14
Aug
14
Sep
14
National consumer price index (LHS)Selic rate (RHS)
Sources: Banco Central do Brasil, Instituto Brasileiro de Geografia e Estatística and Haver Analytics.
% change y-o-y % per annum
Sep 14102.4
90
95
100
105
110
115
120
125
130
Sep
08M
ar 0
9Se
p 09
Mar
10
Sep
10M
ar 1
1Se
p 11
Mar
12
Sep
12M
ar 1
3Se
p 13
Mar
14
Sep
14
Index
Sources: Fundação Getúlio Vargas and Haver Analytics.
OPEC Monthly Oil Market Report – October 2014 23

World Economy
forecast published in late September. Russian companies and banks will need to repay $53.5 billion in international debt in 4Q14 and as much as $106 billion in 2015, according to central bank data. The manufacturing sector showed signs of a fragile recovery in September with the manufacturing PMI registering 50.4, down from 51.0 in August. The survey showed continued growth in terms of production and new business in September. New orders increased for the third month running and at the fastest rate since October 2013. However, the index was weighed down by a sharp drop in new export business during the month. New export orders have fallen continuously since September 2013. Output rose for the fourth month running, but the rate of growth slowed further and was historically weak. The survey indicated a rise in input prices in September at the fastest rate in four months. Prices charged for final goods also rose, with inflationary pressures widely linked to the weakening currency. It seems that import substitution and State orders must be supporting the manufacturing sector as compared to other sectors of the Russian economy. Graph 3.8: Russian inflation vs. interest rates
Graph 3.9: Russian manufacturing and services PMIs
The HSBC Russia Services PMI revealed that the private sector remained in growth territory in September. The Services Business Activity Index posted 50.5 in September. However, data suggested that the rise in total services business activity in September may not be sustained in the coming months as the volume of new business in the sector contracted for the first time since May. The volume of outstanding business held by Russian service providers fell at the steepest rate since March. The survey highlighted an acceleration in input price inflation to a five-month high. The manufacturing sector sent signals of improvement over the past three months, yet an investigation of the drivers behind that progress does not suggest a lasting expansion. Actually, stocks and the quantity of input purchases both decreased while labour shedding increased. This perhaps points to doubts about the economy and the shortage of working capital, which some companies explicitly reported. The GDP forecast for 2014 is unchanged this month at 0.3%, while 2015’s figure is slightly lower at 0.9%.
8.08.0
5.0
5.5
6.0
6.5
7.0
7.5
8.0
8.5
Sep
13
Oct
13
Nov
13
Dec
13
Jan
14Fe
b 14
Mar
14
Apr
14
May
14
Jun
14Ju
l 14
Aug
14
Sep
14
%
Sources: Federal State Statistics Service, Central Bank of Russia and Haver Analytics.
Inflation rate
Interest rate
50.450.5
464748495051525354
Sep
13
Oct
13
Nov
13
Dec
13
Jan
14Fe
b 14
Mar
14
Apr
14
May
14
Jun
14Ju
l 14
Aug
14
Sep
14
Index
Sources: HSBC, Markit and Haver Analytics.
Services PMI
Manufacturing PMI
24 OPEC Monthly Oil Market Report – October 2014
World Economy
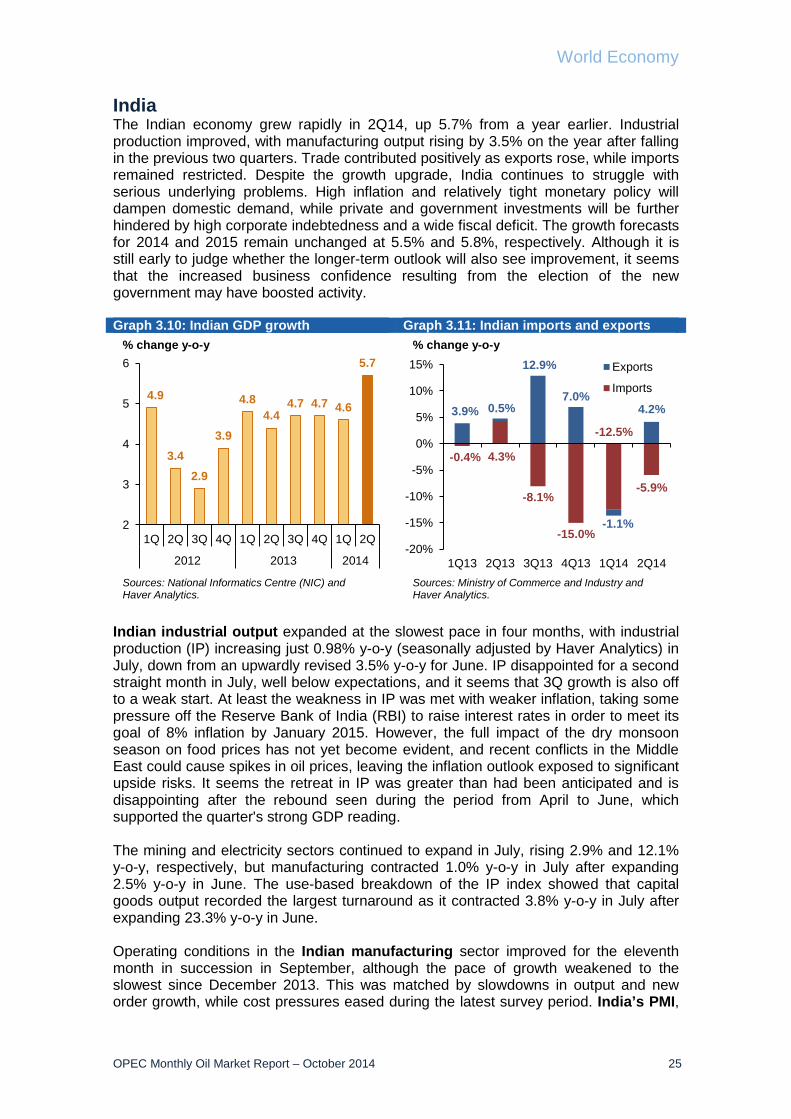
India The Indian economy grew rapidly in 2Q14, up 5.7% from a year earlier. Industrial production improved, with manufacturing output rising by 3.5% on the year after falling in the previous two quarters. Trade contributed positively as exports rose, while imports remained restricted. Despite the growth upgrade, India continues to struggle with serious underlying problems. High inflation and relatively tight monetary policy will dampen domestic demand, while private and government investments will be further hindered by high corporate indebtedness and a wide fiscal deficit. The growth forecasts for 2014 and 2015 remain unchanged at 5.5% and 5.8%, respectively. Although it is still early to judge whether the longer-term outlook will also see improvement, it seems that the increased business confidence resulting from the election of the new government may have boosted activity. Graph 3.10: Indian GDP growth Graph 3.11: Indian imports and exports
Indian industrial output expanded at the slowest pace in four months, with industrial production (IP) increasing just 0.98% y-o-y (seasonally adjusted by Haver Analytics) in July, down from an upwardly revised 3.5% y-o-y for June. IP disappointed for a second straight month in July, well below expectations, and it seems that 3Q growth is also off to a weak start. At least the weakness in IP was met with weaker inflation, taking some pressure off the Reserve Bank of India (RBI) to raise interest rates in order to meet its goal of 8% inflation by January 2015. However, the full impact of the dry monsoon season on food prices has not yet become evident, and recent conflicts in the Middle East could cause spikes in oil prices, leaving the inflation outlook exposed to significant upside risks. It seems the retreat in IP was greater than had been anticipated and is disappointing after the rebound seen during the period from April to June, which supported the quarter's strong GDP reading. The mining and electricity sectors continued to expand in July, rising 2.9% and 12.1% y-o-y, respectively, but manufacturing contracted 1.0% y-o-y in July after expanding 2.5% y-o-y in June. The use-based breakdown of the IP index showed that capital goods output recorded the largest turnaround as it contracted 3.8% y-o-y in July after expanding 23.3% y-o-y in June. Operating conditions in the Indian manufacturing sector improved for the eleventh month in succession in September, although the pace of growth weakened to the slowest since December 2013. This was matched by slowdowns in output and new order growth, while cost pressures eased during the latest survey period. India’s PMI,
4.9
3.42.9
3.9
4.84.4
4.7 4.7 4.6
5.7
2
3
4
5
6
1Q 2Q 3Q 4Q 1Q 2Q 3Q 4Q 1Q 2Q
2012 2013 2014
Sources: National Informatics Centre (NIC) and Haver Analytics.
% change y-o-y
-0.4% 4.3%
-8.1%
-15.0%
-12.5%
-5.9%
3.9% 0.5%
12.9%
7.0%
-1.1%
4.2%
-20%
-15%
-10%
-5%
0%
5%
10%
15%
1Q13 2Q13 3Q13 4Q13 1Q14 2Q14
Exports
Imports
% change y-o-y
Sources: Ministry of Commerce and Industry and Haver Analytics.
OPEC Monthly Oil Market Report – October 2014 25

World Economy
a composite gauge designed to give a single-figure snapshot of manufacturing business conditions, dropped from 52.4 in August to 51.0 in September. The reading was indicative of a modest improvement in operating conditions. Overall, intermediate goods were the best performing among the three monitored sub-sectors. Graph 3.12: Indian PMIs Graph 3.13: Indian industrial productions
India's consumer price index (CPI) meanwhile recorded a more favourable result in August with inflation easing back to 7.8% y-o-y from July's reading of 8.0% y-o-y, in line with market expectations. Supporting the improvement was an easing in the food, beverages and tobacco sub-index of the CPI to 7.0% y-o-y in August, from 7.4% y-o-y in July. Consequently, y-o-y food inflation remained stubborn at 9.2% versus 9.1% in July. It seems that if current trends continue, the September CPI could decline dramatically to 7% or lower. This, in conjunction with the late recovery of the monsoon and softening global commodity prices, prompts a shift in the RBI’s call for a hike in 1Q15 from 4Q14. In contrast to the rise in food prices, commodity prices softened in August. Fuel/light and transport/communication costs, which reflect the impact of international oil prices, declined 0.2% and 0.1% m-o-m, seasonally adjusted, respectively. India’s annual wholesale price inflation (WPI) rate fell from 5.2% in July to 3.7% in August, its lowest level since October 2009, due to base effects, the fall in global oil prices and some easing in food price inflation. However, this has yet to translate into a significant fall in CPI inflation, the most relevant price measure for households, as this only edged down from 8% to 7.8% in August. Consumer spending growth will remain under pressure until CPI inflation has moderated to around 6%. Although the RBI has lately focused more on consumer prices than on wholesale prices when assessing inflationary pressures in the economy and deciding on a course for monetary policy, wholesale price inflation is still a very relevant indicator, not least because it gives clues as to the intensity of pipeline inflationary pressures from a supply standpoint. If sustained, and especially if food wholesale inflation remains tame in coming months despite the weak monsoon season, there is a better chance that consumer price inflation would also sustain its recent easing. The RBI is targeting CPI inflation at or below 8% by January 2015. Given the stubbornly high rate of CPI inflation over the last five years despite the significant slowdown in growth, the RBI will want to see a downward trend in inflation established before easing policy. As a result, Indian interest rates are not forecast to be cut before the beginning of 2015. It seems that high interest rates are damaging growth by encouraging consumers to save rather than spend and
51.0
51.851.6
44
46
48
50
52
54
56
58
60
Sep
12N
ov 1
2Ja
n 13
Mar
13
May
13
Jul 1
3Se
p 13
Nov
13
Jan
14M
ar 1
4M
ay 1
4Ju
l 14
Sep
14
Index
Sources: HSBC, Markit and Haver Analytics.
Manufacturing PMI
Composite PMIServices and activity PMI
1.0%-1.2%
5.7%
-20%
-10%
0%
10%
20%
Jul 1
2
Oct
12
Jan
13
Apr
13
Jul 1
3
Oct
13
Jan
14
Apr
14
Jul 1
4
Total IP Manufacturing IPFood products IP
% change y-o-y
Sources: Central Statistical Organisation of India and Haver Analytics.
26 OPEC Monthly Oil Market Report – October 2014

World Economy
discouraging businesses from borrowing to invest, and will continue to check domestic demand. Graph 3.14: Indian inflation vs. repo rates Graph 3.15: Indian trade balance
Despite the growth upgrade, India continues to struggle with serious underlying problems. High inflation and relatively tight monetary policy will dampen domestic demand, while private and government investment will be further hindered by high corporate indebtedness and a wide fiscal deficit. China A variety of macroeconomic indicators and cycle analysis results now suggest that China’s economy may have slowed significantly over recent months. In August, imports were down 2% from a year ago, with the three-month average rate of growth at just 0.8%. Industrial output growth, meanwhile, grew by just 6.9% on the year in August, down from 9.1% the previous month and the weakest growth rate since January 2009. Some of the weakness in industrial production may be due to sectors with severe overcapacity reducing their output amid falling prices. Other contributing factors include producer prices being negative for the past 30 months and policy measures aimed at hindering further expansion of output in these sectors. Alongside these conventional data, other ‘alternative’ indicators of growth in China are also signalling slower expansion. While this adjustment is positive in terms of rebalancing the economy, in the short term, it will imply lower GDP growth rates, and it seems that the GDP growth rate in 3Q may be lower than expected. In August, China’s CPI inflation came in lower than expected at 2.0% y-o-y, down from 2.3% in July, and it seems price pressures remain subdued amid weak domestic demand. For the first eight months of the year, CPI inflation averaged 2.2% y-o-y, well below the government’s full-year 3.5% target. However, 30 straight months of falling PPI readings are indicative of widespread industrial overcapacity, and any move to provide increased or cheaper funding to the economy risks fuelling these structural problems.
02468
1012
Aug
13Se
p 13
Oct
13
Nov
13
Dec
13
Jan
14Fe
b 14
Mar
14
Apr 1
4M
ay 1
4Ju
n 14
Jul 1
4Au
g 14
Sep
14
%
Repo rateConsumer price index (CPI)CPI lower target bondCPI higher target bondWholesale price index (WPI)WPI confort zone
Sources: Ministry of Commerce and Industry, Reserve Bank of India and Haver Analytics.
-10,
839
-14,000
-12,000
-10,000
-8,000
-6,000
-4,000
Aug
13
Sep
13
Oct
13
Nov
13
Dec
13
Jan
14Fe
b 14
Mar
14
Apr
14
May
14
Jun
14Ju
l 14
Aug
14
US$ mn
Sources: Ministry of Commerce and Industry and Haver Analytics.
OPEC Monthly Oil Market Report – October 2014 27

World Economy
Graph 3.16: Chinese consumer price index vs. producer price index
Graph 3.17: Chinese imports and exports
China continues to affirm its focus on reform over stimulus. According to a statement made by the Chinese Finance Minister at a 21 September G-20 meeting of finance ministers and central bankers, China will not adjust its macroeconomic policy based simply on variability in a single economic data point. The Minister indicated that government economic policy will continue to focus on decreasing financial costs for micro and small enterprises, encouraging private sector investment in areas such as infrastructure and clean energy, and further reform measures, which has substantial growth-generating potential. China's trade surplus expanded at is fastest rate in over a year in August, driven by high demand from developed countries and contracting imports from Asian supply chain partners. According to data published by China's General Administration of Customs on 8 September, exports in August grew by 9.4% y-o-y, a deceleration from 14.5% y-o-y in July, yet still well above the 0.9% expansion during 1H14. Imports contracted by 2.4% y-o-y, deepening a contraction that started in July. Graph 3.18: Chinese cumulative exports by country
Graph 3.19: Chinese foreign direct investment
-4
-2
0
2
4Ja
n 13
Mar
13
May
13
Jul 1
3
Sep
13
Nov
13
Jan
14
Mar
14
May
14
Jul 1
4
Consumer price index (CPI)CPI lower target bondProducer price index (PPI)Interest rate
Sources: China National Bureau of Statistics and Haver Analytics.
% change y-o-y
-5.2%
4.9%2.2% 1.7%
-10%
-5%
0%
5%
10%
15%
20%
1Q 2Q 3Q 4Q 1Q 2Q
2013 2014
Exports Imports
Sources: China Customs and Haver Analytics.
% change y-o-y
-10%
-5%
0%
5%
10%
15%
20%
Jan14
Feb14
Mar14
Apr14
May14
Jun14
Jul14
Aug14
Asia and Middle East AfricaEurope Latin AmericaNorth America
% change y-o-y
Sources: China Customs and Haver Analytics.
-50
0
50
100
150
200
Jan13
Mar13
May13
Jul13
Sep13
Nov13
Jan14
Mar14
May14
Jul14
% change y-o-y
Sources: China National Bureau of Statistics and Haver Analytics.
28 OPEC Monthly Oil Market Report – October 2014

World Economy
Exports strength seemingly continues to be driven by demand from the EU, the US, Africa and the ASEAN. Exports to Hong Kong, Japan and South Korea all weakened marginally. More significant in the August data was a continued weakening of import demand. While last month that primarily arose from apparent price changes in minerals trade with Australia, this month, the deeper contraction arises from weak demand for imports from Hong Kong, Japan and South Korea. This helped push China's trade surplus to $200.5 billion year-to-date, up 30.1% y-o-y, and will bolster growth in 3Q but may also enflame tensions over the value of the Chinese yuan at a time, when domestic demand is already tepid due to housing market weakness. Foreign direct investment (FDI) into China, excluding investment in the financial sector, continued to drop about 14% in August y-o-y to $7.2 billion, following the 17% y-o-y slump in July. The August data reported the lowest monthly total since July 2012 and marked two consecutive monthly drops of more than 10% for the first time since 2009, according to the Financial Times report. From January to August, total FDI reached $78.34 billion, edging down 1.8% y-o-y. Meanwhile, 15,200 new foreign ventures were established during the same period of time, rising 5% y-o-y. For the first eight months, investment from Japan dropped 43.3% y-o-y to $3.2 billion due to the recent diplomatic tension between the two countries over sovereignty of islands in the East China Sea. FDI from the US, the EU and the ASEAN continued to shrink by 16.9%, 17.9% and 9.7% to $2.1 billion, $4.2 billion and $4.6 billion, respectively. Graph 3.20: Chinese approved FDI vs. utilised FDI
Graph 3.21: Chinese imports and exports
The 2.4% y-o-y fall in imports in August, following a 1.6% decline in July, provides further evidence of the subdued state of domestic demand. But with exports continuing to expand robustly, up 9.4% on the year in August, net exports will provide a sizeable positive contribution to growth. In terms of monetary policy, the Peoples Bank of China (PBC) injected RMB500 billion ($81 billion) into the banking system this month. The liquidity injection has many traders predicting a weakening of the currency, the time-honoured way for Chinese policymakers to boost growth. The move is aimed at stabilizing credit expansion amid a slowdown in shadow bank lending and maintaining adequate liquidity in the system ahead of the end of the financial quarter and national holidays in October. But with demand growth weakening and the balance sheets of the corporate sector under pressure, the effectiveness of these targeted stimulus measures will continue to diminish.
5%
-14%
-20%
-10%
0%
10%
20%
30%
-40%
-20%
0%
20%
40%
Jan
13M
ar 1
3M
ay 1
3Ju
l 13
Sep
13
Nov
13
Jan
14M
ar 1
4M
ay 1
4Ju
l 14
Approved FDI, units (RHS)Utilised FDI, US$100 mn (LHS)
Sources: China National Bureau of Statistics and Haver Analytics.
% change y-o-y % change y-o-y
-5.2%
4.9%2.2% 1.7%
-10%
-5%
0%
5%
10%
15%
20%
1Q 2Q 3Q 4Q 1Q 2Q
2013 2014
Exports Imports
Sources: China Customs and Haver Analytics.
% change y-o-y
OPEC Monthly Oil Market Report – October 2014 29

World Economy
The Chinese real estate market, meanwhile, has continued to show signs of strain. Prices fell in 68 of 70 key cities in August, and new construction is around 11% down year-to-date on 2013’s levels. It seems that further pressure on growth is coming from the real estate market. The monthly decline in prices is accelerating to -1.1% in August from 0.2% in May, and sales are now 8.3% lower than a year ago. The manufacturing PMI was revised down slightly to 50.2 in the final reading for September from the flash reading of 50.5, and was unchanged from the August reading. Output and new orders were both revised down. Meanwhile, the employment and price sub-indices were revised up, although both remain at relatively low levels. The new export orders sub-index rose to its highest reading since March 2010. Overall, the data in September suggest that manufacturing activity continues to expand at a slow pace. Risks to growth are foreseeably still on the downside and warrant more accommodative monetary as well as fiscal policies. Graph 3.22: Chinese PMIs Graph 3.23: Chinese industrial production
Therefore, GDP growth remains unchanged at 7.4% for 2014 and at 7.2% for 2015. OPEC Member Countries Operating conditions in Saudi Arabia’s non-oil producing private sector economy showed a notable improvement last month. The headline PMI registered 61.8 in September, up from August’s 60.7. The latest reading represents the highest in over three years. The survey showed a rise in new orders at the fastest pace in 28 months amid strong demand for goods and services. As for new export orders, they rose further during September by the same pace reported in August. The country’s non-oil producing private sector also reported a sharp increase in job creation at the fastest pace in 21 months. Iran reported a 44% y-o-y increase in its total non-oil trade in the six months to 22 September 2014, registering $49.69 billion over the period. Official estimates point to a 50% increase in total non-oil exports from Iran to post $47 billion in the twelve months to late March 2015. In the United Arab Emirates, activity in the non-oil producing sector continued to improve in September, though by the slowest pace in four months. The HSBC UAE Purchasing Managers’ Index remained well above the level of 50, posting 57.6 in
52.8
50.2
47
48
49
50
51
52
53
54
Sep
13O
ct 1
3N
ov 1
3D
ec 1
3Ja
n 14
Feb
14M
ar 1
4A
pr 1
4M
ay 1
4Ju
n 14
Jul 1
4Au
g 14
Sep
14Index
Sources: HSBC, Markit and Haver Analytics.
Composite PMI
Manufacturing PMI 6.9%6%
7%
8%
9%
10%
11%
Sep
13O
ct 1
3N
ov 1
3D
ec 1
3Ja
n 14
Feb
14M
ar 1
4Ap
r 14
May
14
Jun
14Ju
l 14
Aug
14Se
p 14
% change y-o-y
Sources: China National Bureau of Statistics and Haver Analytics.
30 OPEC Monthly Oil Market Report – October 2014

World Economy
September, down from 58.4 a month earlier. Despite output growing to a three-month high, new order growth slowed to its lowest since August 2013. Graph 3.24: Saudi Arabia and UAE: manufacturing PMIs
Other Asia This year, Vietnam’s central bank cut interest rates and devalued the currency. The refinancing rate was cut from 7.0% to 6.5%. The currency depreciated 0.1% and 0.2% m-o-m in July and August, respectively. The government has increased efforts to clean up bad debt at banks and spur lending to businesses. The Planning Ministry of Vietnam announced an estimated GDP growth of 5.5% in the nine months through September compared to the same period a year earlier. Sluggish bank lending was more than offset by improvements in foreign investment that enhanced manufacturing and exports. The official estimate points to an increase in exports by 11% this year, while actual data showed exports rising 14% in the first nine months from a year earlier. Imports climbed 11% during the same period. The country’s manufacturing sector progressed in September with the manufacturing PMI registering 51.7 last month, up from 50.3 in August. The survey showed a solid rise in new orders and a marginal increase in job creation. Graph 3.25: Manufacturing PMIs in Vietnam and Indonesia
61.8
57.6
50
55
60
65
Sep
12
Oct
12
Nov
12
Dec
12
Jan
13
Feb
13
Mar
13
Apr 1
3
May
13
Jun
13
Jul 1
3
Aug
13
Sep
13
Oct
13
Nov
13
Dec
13
Jan
14
Feb
14
Mar
14
Apr 1
4
May
14
Jun
14
Jul 1
4
Aug
14
Sep
14
Index
Saudi Arabia UAE
Sources: SAAB, HSBC, Markit and Haver Analytics.
51.750.7
44
46
48
50
52
54
Oct
12
Nov
12
Dec
12
Jan
13
Feb
13
Mar
13
Apr 1
3
May
13
Jun
13
Jul 1
3
Aug
13
Sep
13
Oct
13
Nov
13
Dec
13
Jan
14
Feb
14
Mar
14
Apr 1
4
May
14
Jun
14
Jul 1
4
Aug
14
Sep
14
Index
Vietnam Indonesia
Sources: HSBC, Markit and Haver Analytics.
OPEC Monthly Oil Market Report – October 2014 31
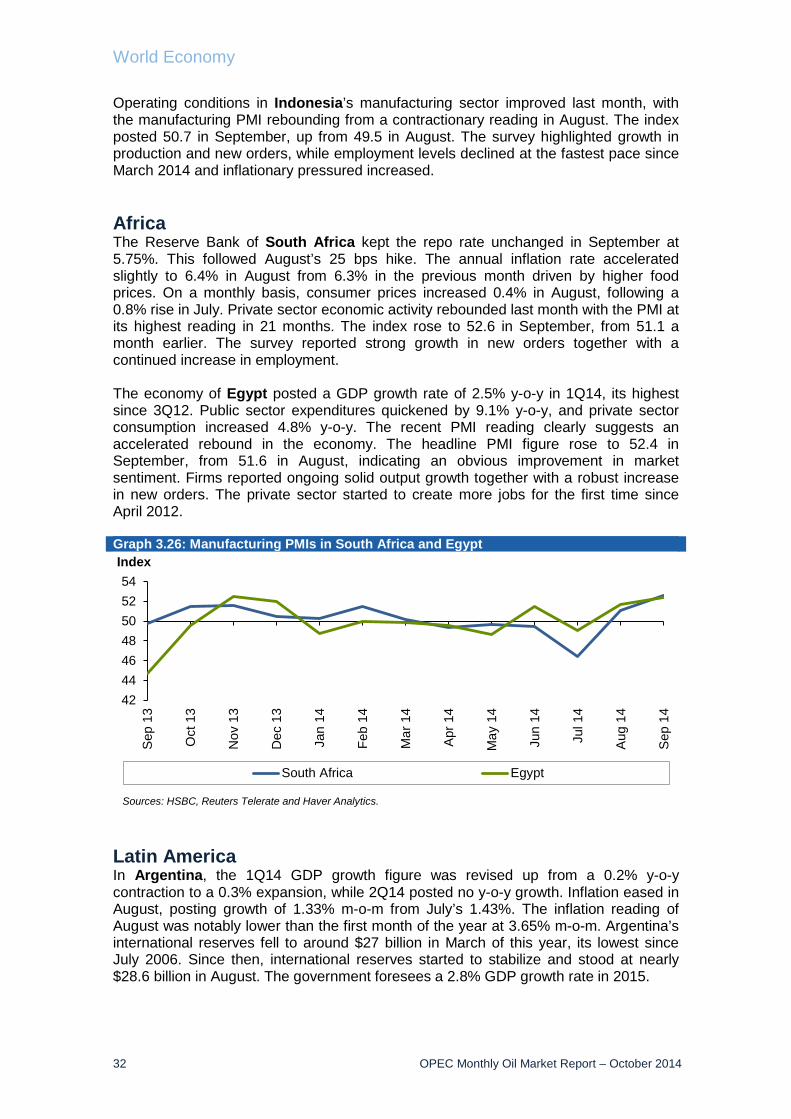
World Economy
Operating conditions in Indonesia’s manufacturing sector improved last month, with the manufacturing PMI rebounding from a contractionary reading in August. The index posted 50.7 in September, up from 49.5 in August. The survey highlighted growth in production and new orders, while employment levels declined at the fastest pace since March 2014 and inflationary pressured increased. Africa The Reserve Bank of South Africa kept the repo rate unchanged in September at 5.75%. This followed August’s 25 bps hike. The annual inflation rate accelerated slightly to 6.4% in August from 6.3% in the previous month driven by higher food prices. On a monthly basis, consumer prices increased 0.4% in August, following a 0.8% rise in July. Private sector economic activity rebounded last month with the PMI at its highest reading in 21 months. The index rose to 52.6 in September, from 51.1 a month earlier. The survey reported strong growth in new orders together with a continued increase in employment. The economy of Egypt posted a GDP growth rate of 2.5% y-o-y in 1Q14, its highest since 3Q12. Public sector expenditures quickened by 9.1% y-o-y, and private sector consumption increased 4.8% y-o-y. The recent PMI reading clearly suggests an accelerated rebound in the economy. The headline PMI figure rose to 52.4 in September, from 51.6 in August, indicating an obvious improvement in market sentiment. Firms reported ongoing solid output growth together with a robust increase in new orders. The private sector started to create more jobs for the first time since April 2012. Graph 3.26: Manufacturing PMIs in South Africa and Egypt
Latin America In Argentina, the 1Q14 GDP growth figure was revised up from a 0.2% y-o-y contraction to a 0.3% expansion, while 2Q14 posted no y-o-y growth. Inflation eased in August, posting growth of 1.33% m-o-m from July’s 1.43%. The inflation reading of August was notably lower than the first month of the year at 3.65% m-o-m. Argentina’s international reserves fell to around $27 billion in March of this year, its lowest since July 2006. Since then, international reserves started to stabilize and stood at nearly $28.6 billion in August. The government foresees a 2.8% GDP growth rate in 2015.
42444648505254
Sep
13
Oct
13
Nov
13
Dec
13
Jan
14
Feb
14
Mar
14
Apr
14
May
14
Jun
14
Jul 1
4
Aug
14
Sep
14
Index
South Africa Egypt
Sources: HSBC, Reuters Telerate and Haver Analytics.
32 OPEC Monthly Oil Market Report – October 2014

World Economy
In Chile, the government announced plans to stimulate the economy via spending increases next year. GDP growth slowed this year to 2.4% and 1.9% in 1Q and 2Q, respectively. The 1Q14 figure is the slowest since 3Q09. The government now plans to increase spending by 9.8% in 2015, most of which is planned to be directed towards investment. Transition region In the Czech Republic, the Central Bank kept its benchmark interest rate unchanged at 0.05% for the 15th month in a row in September. The economy is experiencing a period of relatively good growth with GDP increasing by 2.6% and 2.5% y-o-y in 1Q14 and 2Q14, respectively. This represents a notably better economic performance when compared with the -2.8% and -1.4% y-o-y in 1Q and 2Q13, respectively. The country’s manufacturing sector continued to experience strongly improving business conditions in September. The manufacturing PMI rose to 55.6 in September from 54.3 in the previous month. The survey revealed faster growth in output, new orders, exports, employment and purchasing. GDP growth in Poland registered 3.2% y-o-y in 2Q14 compared to 3.4% y-o-y in the previous period. The manufacturing PMI posted 49.5 in September from 49.9 in August. The 3Q14 index readings were all in contractionary territory following four quarters of expansion. The survey showed weaker falls in new orders and purchasing activity with a fall in output prices. Graph 3.27: Manufacturing PMIs in Czech Republic and Poland
Oil prices, US dollar and inflation On a monthly average, the US dollar continued appreciating in September compared to its major currency counterparts on average. Compared to the euro, the US dollar rose by 3.2% in September and stood at a monthly average of $1.2889/€. Versus the Japanese yen, the US-dollar rose by 4.2% to reach ¥107.244/$. Compared to the pound sterling, it rose by 2.5%, the second month of recovery after five consecutive months of decline, while compared to the Swiss franc, it increased by 2.9%. With the ongoing recovery in the US, the tapering of the US Federal Reserve (US Fed), the continued monetary stimulus from the ECB and the ongoing efforts to stimulate the economy by the BoJ, and given the current slow-down in the emerging markets, the US dollar should be expected to continue appreciating in the coming months.
55.6
49.5
4446485052545658
Oct
12
Nov
12
Dec
12
Jan
13
Feb
13
Mar
13
Apr
13
May
13
Jun
13
Jul 1
3
Aug
13
Sep
13
Oct
13
Nov
13
Dec
13
Jan
14
Feb
14
Mar
14
Apr
14
May
14
Jun
14
Jul 1
4
Aug
14
Sep
14
Index
Czech Republic Poland
Sources: HSBC, Markit and Haver Analytics.
OPEC Monthly Oil Market Report – October 2014 33

World Economy
In nominal terms, the price of the OPEC Reference Basket (ORB) declined by a monthly average of $4.77, or 4.7%, from $100.75/b in August to $95.98/b in September. In real terms, after accounting for inflation and currency fluctuations, the ORB fell by 2.4%, or $1.47, to $59.32/b from $60.79/b (base June 2001=100). Over the same period, the US dollar gained 2.4% against the import-weighted modified Geneva I + US dollar basket* while inflation remained flat.
* The ‘modified Geneva I+US$ basket’ includes the euro, the Japanese yen, the US dollar, the pound sterling and the Swiss franc, weighted according to the merchandise imports of OPEC Member Countries from the countries in the basket.
34 OPEC Monthly Oil Market Report – October 2014

World Oil Demand
World Oil Demand World oil demand growth remained broadly unchanged to average 1.05 mb/d in 2014. As a result, total oil demand stood at 91.19 mb/d. For 2015, growth is expected to be around 1.19 mb/d, relatively unchanged from the previous MOMR, to reach 92.38 mb/d. World oil demand in 2014 and 2015 Table 4.1: World oil demand in 2014, mb/d
Table 4.2: World oil demand in 2015, mb/d
2013 1Q14 2Q14 3Q14 4Q14 2014 Growth %Americas 24.05 23.86 23.89 24.39 24.55 24.17 0.13 0.53 of which US 19.24 19.18 19.03 19.52 19.71 19.36 0.12 0.62Europe 13.61 13.02 13.46 13.76 13.37 13.41 -0.20 -1.48Asia Pacific 8.29 8.85 7.58 7.81 8.40 8.16 -0.14 -1.64Total OECD 45.95 45.73 44.93 45.96 46.32 45.74 -0.21 -0.46Other Asia 11.06 11.08 11.37 11.37 11.35 11.29 0.23 2.10 of which India 3.70 3.85 3.80 3.68 3.86 3.80 0.10 2.65Latin America 6.50 6.42 6.69 6.98 6.78 6.72 0.22 3.46Middle East 7.81 8.07 7.98 8.47 7.95 8.12 0.31 3.92Africa 3.63 3.75 3.75 3.61 3.76 3.72 0.09 2.46Total DCs 29.00 29.31 29.79 30.43 29.84 29.85 0.85 2.94FSU 4.49 4.39 4.24 4.63 4.93 4.55 0.06 1.25Other Europe 0.64 0.64 0.60 0.64 0.72 0.65 0.01 1.87China 10.07 10.08 10.56 10.30 10.70 10.41 0.34 3.42Total "Other regions" 15.20 15.11 15.39 15.57 16.34 15.61 0.41 2.71
Total world 90.14 90.16 90.11 91.96 92.50 91.19 1.05 1.17Previous estimate 90.14 90.14 90.11 91.97 92.50 91.19 1.05 1.17Revision 0.00 0.01 0.00 0.00 0.00 0.00 0.00 0.00
Change 2014/13
Totals may not add up due to independent rounding.
2014 1Q15 2Q15 3Q15 4Q15 2015 Growth %Americas 24.17 24.02 24.03 24.56 24.70 24.33 0.16 0.64 of which US 19.36 19.31 19.13 19.66 19.84 19.49 0.13 0.65Europe 13.41 12.96 13.41 13.67 13.29 13.34 -0.07 -0.52Asia Pacific 8.16 8.76 7.51 7.71 8.26 8.06 -0.10 -1.23Total OECD 45.74 45.74 44.95 45.94 46.25 45.72 -0.02 -0.03Other Asia 11.29 11.30 11.61 11.62 11.56 11.52 0.23 2.06 of which India 3.80 3.94 3.89 3.78 3.96 3.89 0.10 2.50Latin America 6.72 6.64 6.90 7.20 7.04 6.95 0.23 3.35Middle East 8.12 8.36 8.25 8.78 8.24 8.41 0.30 3.64Africa 3.72 3.84 3.84 3.70 3.85 3.81 0.09 2.42Total DCs 29.85 30.15 30.60 31.30 30.69 30.69 0.84 2.82FSU 4.55 4.44 4.28 4.68 4.98 4.60 0.05 1.10Other Europe 0.65 0.65 0.61 0.65 0.72 0.66 0.01 1.08China 10.41 10.39 10.87 10.62 10.99 10.72 0.31 2.95Total "Other regions" 15.61 15.47 15.76 15.95 16.69 15.97 0.36 2.34
Total world 91.19 91.36 91.31 93.18 93.64 92.38 1.19 1.31Previous estimate 91.19 91.35 91.31 93.19 93.64 92.38 1.19 1.31Revision 0.00 0.01 0.00 0.00 0.00 0.00 0.00 0.00
Totals may not add up due to independent rounding.
Change 2015/14
OPEC Monthly Oil Market Report – October 2014 35

World Oil Demand
Graph 4.1: Quarterly world oil demand growth
OECD Americas US The latest US monthly data for July 2014 shows a slight decrease in oil demand by around 0.07 mb/d y-o-y, in line with the more moderate trend observed in growth since the beginning of 2014. Motor gasoline requirements grew slightly, while distillate demand registered solid growth, which was due to the healthy transportation and industrial sectors. All other main product requirements, however, dropped, outpacing the increases. The bulk of losses were seen in residual fuel oil and propane/propylene, mainly as a result of fuel substitution with other commodities, primarily natural gas. With data available for three quarters of 2014 – monthly data until July and preliminary weekly data for August and September – US oil demand seems to have grown by around 0.1 mb/d with distillate requirements being the product category with the strongest growth while gasoline saw lower growth than in the previous year. Declines were also seen in the demand for residual fuel oil. Graph 4.2: US oil consumption, y-o-y changes
The structure of US oil demand seems to be undergoing some changes, which relate to fuel substitution in the industrial and transportation sectors, and to increasing vehicle
-1,000
-500
0
500
1,000
1,500
2,000
1Q 2Q 3Q 4Q 1Q 2Q 3Q 4Q 1Q 2Q 3Q 4Q
2013 2014estimate
2015forecast
tb/d
OECD Non-OECD Total world
-1,000
-500
0
500
1,000
1,500
Sep
12
Oct
12
Nov
12
Dec
12
Jan
13
Feb
13
Mar
13
Apr
13
May
13
Jun
13
Jul 1
3
Aug
13
Sep
13
Oct
13
Nov
13
Dec
13
Jan
14
Feb
14
Mar
14
Apr
14
May
14
Jun
14
Jul 1
4
Aug
14
Sep
14
tb/d
All other Distillates Gasoline Total oil
36 OPEC Monthly Oil Market Report – October 2014

World Oil Demand
fuel efficiencies; these phenomena are expected to continue playing a role in US oil demand for the remainder of 2014 and 2015. The overall risk for the development of US oil demand has remained unchanged since last month with upside risks originating in the projected growth of the economy, while fuel substitution and vehicle efficiencies representing the main downside risks. Canada and Mexico In Canada, oil demand growth in July contracted slightly y-o-y. Gains in gasoline, jet fuel and gasoil have been more than offset by declines in LPG requirements. 2014 and 2015 Canadian oil demand is projected to remain roughly at the levels of 2013, marking marginal increases, with risks being equally distributed to the upside and downside. The level of growth will also depend on the development of the economy, and, as with the US, on the degree of fuel substitution. Falling Mexican manufacturing activity in August 2014, in combination with fuel substitution, have led to decreases in oil demand in Mexico with residual fuel oil and gasoline accounting for the bulk of these decreases. The risks for 2014 and 2015 Mexican oil demand remain skewed to the downside and relate to fuel substitution and the development of the overall economy. In 2014, OECD Americas’ oil demand is expected to grow by 0.13 mb/d compared with 2013. OECD Americas’ oil demand in 2015 is projected to increase by 0.16 mb/d compared with 2014. OECD Europe The sentiment in European oil demand remained bearish for another month with oil demand in the region declining in July 2014 y-o-y. The decrease is in line with continuing economic concerns in the region. Early indications for August 2014 showed losses of approximately 0.2 mb/d in Germany, France, Italy and the UK ‒ the European Big 4 oil consumers ‒ with industrial and transportation fuels, notably gasoline and distillates, accounting for the bulk of the decreases. The positive momentum in auto sales continued though in August 2014 in almost all European major markets with the exception of France, Germany and Italy, which showed slight decreases. Oil demand continued its contracting trend in most of the countries, which are struggling with the reduction of their public debts. Projected improvements in the economies of the region’s main countries during 2015 are expected to result in a lower oil demand contraction than in 2014, however increasing downside risks remain since last month as a result of the path of recovery in the economies. Table 4.3: Europe Big 4* oil demand, tb/d
Aug 14 Aug 13 Change form Aug 13 Change form Aug 13, %LPG 342 347 -4 -1.3Gasoline 1,145 1,171 -26 -2.2Jet/Kerosene 828 783 44 5.7Gas/Diesel oil 2,880 3,087 -206 -6.7Fuel oil 282 298 -16 -5.2Other products 1,072 1,054 18 1.7Total 6,549 6,739 -190 -2.8
* Germany, France, Italy and the UK.
OPEC Monthly Oil Market Report – October 2014 37

World Oil Demand
European oil demand is projected to decrease in 2014 by 0.20 mb/d. In 2015, the contraction in the region’s oil demand is forecast to be around 0.07 mb/d. OECD Asia Pacific Preliminary August data implies that Japanese oil demand contracted by 0.46 mb/d in August 2014 y-o-y. This followed a drop in July 2014 and marked the fifth consecutive month of decline. The picture was bearish in all product categories, with the only exception being jet fuel. Gasoline diesel requirements fell sharply in line with lower new vehicle registrations, while required volumes for direct burning of crude and fuel oil were also lower. Additionally, the restarting of some nuclear plants seems likely to be shifted to 1Q15, as prior to a restart, and upon achieving the required safety criteria, approval of the local authorities is required for all plants. September 2014 new vehicle registrations again showed a decrease y-o-y of around 3%. The outlook for 2014 and 2015 Japanese oil demand has been relatively unchanged from last month’s forecasts with the risks continuing to be skewed towards the downside, mainly as a result of a weakening economy. Projections for 2015 assume a strong likelihood that a number of nuclear plants will rejoin operation. Table 4.4: Japanese domestic sales, tb/d
In South Korea, available data up to July 2014 indicates a slight increase of 0.03 mb/d compared with the same period last year, with naphtha requirements accounting for the bulk of these increases. During the same period, fuel oil, LPG and gasoil usage decreased, while gasoline demand remained flat y-o-y. The outlook for South Korean oil consumption during 2014 and 2015 remained unchanged compared with last month’s projections. OECD Asia Pacific oil consumption is projected to fall by 0.14 mb/d in 2014. This decrease is expected to continue in 2015, albeit to a lesser extent, by 0.1 mb/d y-o-y. Other Asia Indian oil demand returned to modest growth during the month of August 2014, increasing by 31 tb/d or just below 1% y-o-y, leading to total oil consumption of 3.39 mb/d. There has been sufficient growth y-o-y in most products with the exception of fuel oil and other products. LPG demand rose by 16 tb/d or more than 3% y-o-y, marking a continuation of the product’s good performance in 2014. The major underlying factors behind LPG’s solid performance in 2014 include higher cylinder subsidies, logistical ease of some bottlenecks and switching from other products to LPG.
Aug 14 Change from Aug 13 Change from Aug 13, %LPG 389 -14 -3.5Gasoline 1,011 -68 -6.3Naphtha 725 -55 -7.0Jet fuel 93 -15 -13.8Kerosene 91 -15 -14.3Gasoil 548 -20 -3.5Fuel oil 436 -138 -24.0Other products 54 -4 -6.7Direct crude burning 114 -127 -52.8
Total 3,461 -456 -11.6
38 OPEC Monthly Oil Market Report – October 2014

World Oil Demand
Gasoline also continued to demonstrate good performance, growing by more than 30 tb/d or just below 8% y-o-y. This was a result of an increase in car sales, which continued at a healthy pace with total passenger cars registering growth of more than 15% in August for the fourth month in a row. The pace of two-wheeler sales was exceptional, higher y-o-y by more than 19% with a total of 1.34 million units sold in August. Jet fuel demand was almost flat y-o-y, registering slight growth of around 3 tb/d or just above 1% y-o-y. Graph 4.3: Changes in Indian oil demand, y-o-y
Diesel growth, on the other hand, softened from July’s levels, growing by 17 tb/d or more than 1.3% y-o-y. This marks the fourth month of consecutive growth after a period of decline. The late arrival of the monsoon season rains reduced diesel demand, especially towards the second half of August, compared with higher-than-expected consumption in June and July, during which a shortage of coal was also witnessed. Fuel oil demand weakened by around 30 tb/d y-o-y, despite an increase in demand from the power sector in the southern region as some fertilizing companies switched from fuel oil to natural gas as a source of power generation. Table 4.5: Indian oil demand by main products, tb/d
Oil demand in India is expected to be supported by the improved sentiment in India's economy, which should boost industrial and transportation fuel consumption. In 2015, expectations for Indian oil demand are firm with a general improvement in the overall economy expected to positively impact oil demand data. In Indonesia, the latest July 2014 data showed an increase of around 37 tb/d or 2.6% y-o-y; the growing requirements for gasoline, diesel and fuel oil were offset by declining demand for LPG and jet fuel. Generally, the improvement in manufacturing data supported industrial fuel requirements. The main concerns for Indonesia and other countries in the region are still the budget deficits and the impact of reducing subsidies
-300-200-100
0100200300400500
Aug
12
Sep
12
Oct
12
Nov
12
Dec
12
Jan
13
Feb
13
Mar
13
Apr
13
May
13
Jun
13
Jul 1
3
Aug
13
Sep
13
Oct
13
Nov
13
Dec
13
Jan
14
Feb
14
Mar
14
Apr
14
May
14
Jun
14
Jul 1
4
Aug
14
tb/d
LPG Gasoline Kerosene Diesel oil Fuel oil Other products
Aug 14 Aug 13 Change Change, %LPG 516 500 16 3.2Gasoline 448 415 33 7.9Kerosene 269 265 4 1.5Diesel oil 1,348 1,331 17 1.3Fuel oil 236 270 -34 -12.5Other products 570 576 -5 -0.9
Total oil demand 3,387 3,356 31 0.9
OPEC Monthly Oil Market Report – October 2014 39

World Oil Demand
for oil products. According to the latest news, subsidy reductions are planned in Indonesia as early as November 2014 or early 2015 with cuts estimated to be as high as 55%. However, cash vouchers worth more than $400 million are expected to be distributed to around 27 million Indonesians in an attempt to ease the impact on the poor. Other Asia’s oil demand is anticipated to grow by 0.23 mb/d y-o-y in 2014. As for 2015, oil demand is forecast to also increase by 0.23 mb/d, the same as in the previous year. Latin America In Brazil, July’s oil demand data was promising compared with the previous month. Total oil demand growth almost reached 90 tb/d, or around 3.7%, y-o-y after a modest rise a month earlier. Total oil demand stood at 2.46 mb/d in July. Transportation fuels were yet again the main driver behind this growth with consumption of gasoline and ethanol rising by around 5%. Diesel eased marginally compared with the same month last year, declining by just around 5 tb/d, in line with slower economic momentum. Jet/kerosene saw slight growth of around 4 tb/d or 3.1% y-o-y. Fuel oil consumption was on the rise compared with July 2013, growing by around 40 tb/d y-o-y, largely the result of a lower base line. Table 4.6: Brazilian inland deliveries, tb/d
The latest Ecuadorian data for July 2014 show higher oil requirements by around 10 tb/d or 4% compared to the same month last year. Gasoline and diesel requirements rose, while LPG and fuel oil demand shrank. In Argentina, oil demand continued to grow despite economic concerns in the country. However, all transportation fuels (gasoline, jet/kerosene and diesel oil) declined by 6.1%, 1.5% and 2.3%, respectively, a reflection of slower economic activity. LPG and other products, on the other hand, led most of the demand growth with LPG rising by more than 18% while other products increased by around 26%. The risks for 2014 oil demand in the Latin America are currently balanced despite the fact that slower economic momentum in the country has yet to be reflected in oil demand consumption. In 2015, expectations of oil demand growth remain within the same levels as anticipated last month. For 2015, oil demand projections in Latin America are unchanged from last month’s expectations and indicate growth levels similar to 2014. Latin American oil demand is expected to grow by around 0.23 mb/d in both 2014 and 2015.
Jul 14 Jul 13 Change Change, %LPG 250 245 5 2.1Gasoline 741 708 34 4.8Jet/Kerosene 134 129 4 3.2Diesel 1,031 1,036 -5 -0.5Fuel oil 95 55 40 73.7Alcohol 205 195 10 5.1
Total 2,457 2,369 88 3.7
40 OPEC Monthly Oil Market Report – October 2014

World Oil Demand
Middle East In Saudi Arabia, August 2014 oil demand was characterized by a substantial increase of 0.31 mb/d or around 13% y-o-y, with total oil demand reaching around 2.73 mb/d. All products saw positive growth, with the exception of LPG and other products. Gasoline, jet/kerosene and fuel oil experienced the highest growth levels of more than 18%, 46% and 44%, respectively, compared with the same month a year earlier. Strong growth in the transportation sector was supported by the end-of-summer holidays, especially in the aviation sector while growth in fuel oil consumption can be largely attributed to the additional summer power generation requirements. Oil demand declined in Iraq for yet another month. This marks the third monthly drop in oil requirements y-o-y. Total demand dipped by more than 20% or 0.15 mb/d y-o-y in August. Total oil demand, in absolute terms, is now just below 0.60 mb/d after reaching as high as 0.75 mb/d at the end of 2013. Demand for diesel oil, which is used in the transportation and industrial sectors, was lower by around 58 tb/d or 29% y-o-y, followed by gasoline, which dropped by around 37 tb/d or 26% y-o-y. Fuel oil used for power generation also recorded a decrease of around 22 tb/d or 14% y-o-y. Graph 4.4: Oil demand growth in the Middle East, y-o-y
For 2014, Middle East oil demand is expected to grow by 0.31 mb/d, while oil demand in 2015 is projected to increase by 0.30 mb/d. China Chinese oil consumption picked up momentum in August, growing by more than 0.36 mb/d, to stand at 10.39 mb/d, led by considerable growth in gasoline and fuel oil compared with the same month a year earlier. LPG also registered growth, albeit at a slower pace. Major contributors to this growth in oil demand data are the low base line of 2013, the continued improvement in year-to-date car sale statistics and the pickup in demand for feedstock fuels to satisfy teapot refinery requirements. Gasoline rose by around 0.25 mb/d or 12% compared with a year ago despite weaker car sales data in August. According to statistics and analysis of the China Association of Automobile Manufacturers (CAAM), sales of commercial vehicles were up by more than 247,000 units from the previous month, yet down by more 16.4% from the levels of August 2013. Jet fuel demand, on the other hand, was down y-o-y by 17 tb/d, or around minus 3% as a result of reduced aviation sector requirements. August diesel demand remained
-50
0
50
100
150
200
250
300
350
-50
0
50
100
150
200
250
300
350
1Q12 2Q12 3Q12 4Q12 1Q13 2Q13 3Q13 4Q13 1Q14 2Q14
tb/dtb/d
Saudi Arabia Iran, I.R. Kuwait UAE Others
OPEC Monthly Oil Market Report – October 2014 41
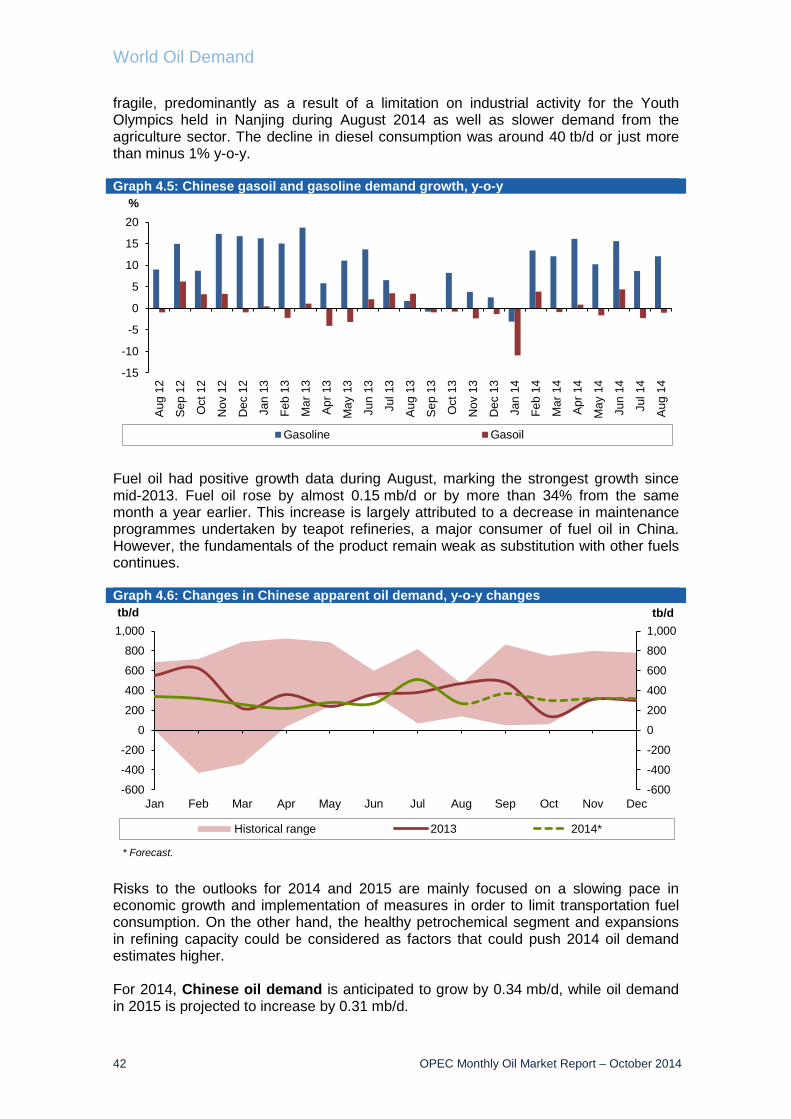
World Oil Demand
fragile, predominantly as a result of a limitation on industrial activity for the Youth Olympics held in Nanjing during August 2014 as well as slower demand from the agriculture sector. The decline in diesel consumption was around 40 tb/d or just more than minus 1% y-o-y. Graph 4.5: Chinese gasoil and gasoline demand growth, y-o-y
Fuel oil had positive growth data during August, marking the strongest growth since mid-2013. Fuel oil rose by almost 0.15 mb/d or by more than 34% from the same month a year earlier. This increase is largely attributed to a decrease in maintenance programmes undertaken by teapot refineries, a major consumer of fuel oil in China. However, the fundamentals of the product remain weak as substitution with other fuels continues. Graph 4.6: Changes in Chinese apparent oil demand, y-o-y changes
Risks to the outlooks for 2014 and 2015 are mainly focused on a slowing pace in economic growth and implementation of measures in order to limit transportation fuel consumption. On the other hand, the healthy petrochemical segment and expansions in refining capacity could be considered as factors that could push 2014 oil demand estimates higher. For 2014, Chinese oil demand is anticipated to grow by 0.34 mb/d, while oil demand in 2015 is projected to increase by 0.31 mb/d.
-15
-10
-5
0
5
10
15
20
Aug
12
Sep
12
Oct
12
Nov
12
Dec
12
Jan
13
Feb
13
Mar
13
Apr
13
May
13
Jun
13
Jul 1
3
Aug
13
Sep
13
Oct
13
Nov
13
Dec
13
Jan
14
Feb
14
Mar
14
Apr
14
May
14
Jun
14
Jul 1
4
Aug
14
%
Gasoline Gasoil
-600
-400
-200
0
200
400
600
800
1,000
-600
-400
-200
0
200
400
600
800
1,000
Jan Feb Mar Apr May Jun Jul Aug Sep Oct Nov Dec
tb/dtb/d
Historical range 2013 2014*
* Forecast.
42 OPEC Monthly Oil Market Report – October 2014

World Oil Supply
World Oil Supply Non-OPEC oil supply is estimated to average 55.91 mb/d in 2014, unchanged from the previous Monthly Oil Market Report (MOMR). This represents an increase of 1.68 mb/d over a year earlier, unchanged from the previous month. OECD Americas is expected to be the main driver for growth in 2014. In 2015, non-OPEC oil supply is projected to grow by 1.24 mb/d, unchanged from the previous assessment, to average 57.16 mb/d. OPEC NGLs and non-conventional liquids are estimated to have grown by 0.2 mb/d to average 5.83 mb/d in 2014. OPEC NGLs are also forecast to grow by 0.2 mb/d to average 6.03 mb/d in 2015. In September 2014, OPEC crude oil production increased by 402 tb/d to average 30.47 mb/d, according to secondary sources. Thus, preliminary data indicates that world oil supply increased by 0.54 mb/d in August to average 92.33 mb/d.
Estimate for 2014 Non-OPEC supply Non-OPEC oil production is estimated to average 55.91 mb/d in 2014, indicating an increase of 1.68 mb/d over the previous year, unchanged from the previous MOMR. The main driver of non-OPEC supply growth in 2014 is OECD Americas, which is forecast to increase by 1.51 mb/d in 2014. Upward and downward revisions were introduced this month, with growth in Brazil largely offsetting declines elsewhere. Among non-OPEC suppliers, OECD supply will grow by 1.50 mb/d in 2014 over the previous year, stable from the previous MOMR. Graph 5.1: Regional non-OPEC supply growth, y-o-y
The non-OPEC oil supply forecast for 4Q14 is unchanged from the previous MOMR. It is also expected that 4Q14 will yield the highest supply in the year at 56.42 mb/d and the highest q-o-q growth of 0.56 mb/d, as predicted in the previous month’s assessment. On a regional basis, OECD Americas saw the largest growth, followed by Latin America, Africa and China, while Other Asia, the Middle East and the Former Soviet Union (FSU) experienced declines. On a quarterly basis, non-OPEC supply for 2014 is estimated to average 55.59 mb/d, 55.77 mb/d, 55.86 mb/d and 56.42 mb/d, respectively.
-0.5
0.0
0.5
1.0
1.5
-0.5
0.0
0.5
1.0
1.5
OECDAmerica
OECDEurope
OECD AsiaPacific
OtherAsia
LatinAmerica
Middle East Africa FSU
mb/dmb/d
13/12 14/13 15/14
OPEC Monthly Oil Market Report – October 2014 43
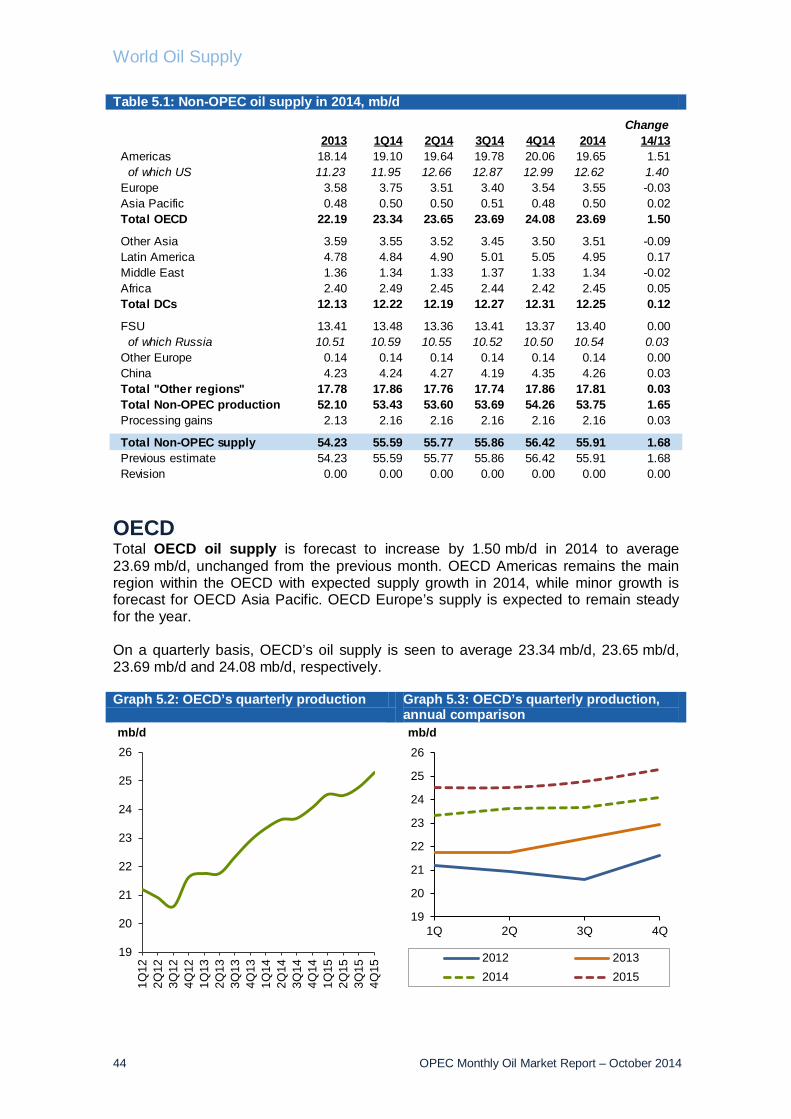
World Oil Supply
Table 5.1: Non-OPEC oil supply in 2014, mb/d
OECD Total OECD oil supply is forecast to increase by 1.50 mb/d in 2014 to average 23.69 mb/d, unchanged from the previous month. OECD Americas remains the main region within the OECD with expected supply growth in 2014, while minor growth is forecast for OECD Asia Pacific. OECD Europe’s supply is expected to remain steady for the year. On a quarterly basis, OECD’s oil supply is seen to average 23.34 mb/d, 23.65 mb/d, 23.69 mb/d and 24.08 mb/d, respectively. Graph 5.2: OECD’s quarterly production Graph 5.3: OECD’s quarterly production,
annual comparison
19
20
21
22
23
24
25
26
1Q12
2Q12
3Q12
4Q12
1Q13
2Q13
3Q13
4Q13
1Q14
2Q14
3Q14
4Q14
1Q15
2Q15
3Q15
4Q15
mb/d
19
20
21
22
23
24
25
26
1Q 2Q 3Q 4Q
mb/d
2012 20132014 2015
Change2013 1Q14 2Q14 3Q14 4Q14 2014 14/13
Americas 18.14 19.10 19.64 19.78 20.06 19.65 1.51 of which US 11.23 11.95 12.66 12.87 12.99 12.62 1.40Europe 3.58 3.75 3.51 3.40 3.54 3.55 -0.03Asia Pacific 0.48 0.50 0.50 0.51 0.48 0.50 0.02Total OECD 22.19 23.34 23.65 23.69 24.08 23.69 1.50
Other Asia 3.59 3.55 3.52 3.45 3.50 3.51 -0.09Latin America 4.78 4.84 4.90 5.01 5.05 4.95 0.17Middle East 1.36 1.34 1.33 1.37 1.33 1.34 -0.02Africa 2.40 2.49 2.45 2.44 2.42 2.45 0.05Total DCs 12.13 12.22 12.19 12.27 12.31 12.25 0.12
FSU 13.41 13.48 13.36 13.41 13.37 13.40 0.00 of which Russia 10.51 10.59 10.55 10.52 10.50 10.54 0.03Other Europe 0.14 0.14 0.14 0.14 0.14 0.14 0.00China 4.23 4.24 4.27 4.19 4.35 4.26 0.03Total "Other regions" 17.78 17.86 17.76 17.74 17.86 17.81 0.03Total Non-OPEC production 52.10 53.43 53.60 53.69 54.26 53.75 1.65Processing gains 2.13 2.16 2.16 2.16 2.16 2.16 0.03
Total Non-OPEC supply 54.23 55.59 55.77 55.86 56.42 55.91 1.68Previous estimate 54.23 55.59 55.77 55.86 56.42 55.91 1.68Revision 0.00 0.00 0.00 0.00 0.00 0.00 0.00
44 OPEC Monthly Oil Market Report – October 2014

World Oil Supply
OECD Americas OECD Americas’ total liquids production in 2014 is expected to increase by 1.40 mb/d to average 19.65 mb/d, representing an upward revision of 30 tb/d from the previous MOMR. OECD Americas’ supply is expected to have the highest growth among all non-OPEC regions in 2014, supported by strong forecasts from the US and Canada. Based on actual data, the region’s supply averaged 19.37 mb/d during 1H14, indicating significant growth of 1.71 mb/d, higher than the 0.54 mb/d level recorded during the same period in 2012 and 2013. On a quarterly basis, OECD Americas’ oil supply in 2014 is estimated to stand at 19.10 mb/d, 19.64 mb/d, 19.78 mb/d and 20.06 mb/d, respectively. US US oil supply is forecast to average 12.62 mb/d in 2014, indicating growth of 1.40 mb/d over the previous year, the highest among all non-OPEC countries, representing an upward revision by 0.1 mb/d from the previous MOMR. According to the US Energy Information Administration’s (EIA’s) official data, US crude oil production for July 2014 was estimated at 8.537 mb/d, a drop by 3 tb/d compared to a month earlier. The increasing volume came mainly from North Dakota and Texas, particularly from the Permian shale play, while output in Alaska and the Gulf of Mexico declined. Oil production from the Gulf of Mexico is expected to increase from 1.25 mb/d in 2013 to 1.67 mb/d in 2015, with 11 projects starting this year. Oil production from six projects started up in the first half of 2014: Na Kika Phase 3, Mars B, Dalmatian, Entrada, Atlantis Phase 2, and Tubular Bells. More oil is expected to be produced from the Cardamom Deep, South Deimos/West Boreas, Hadrian South and Jack/St. Malo and Lucius projects in 4Q14. Oil production in the US Gulf of Mexico decreased to average 1.406 mb/d in July 2014 in spite of new projects starting up, indicating a drop of 8 tb/d compared with the previous month. Other new projects coming online from September onward should boost Gulf of Mexico output at the end of this year. The Tubular Bells project came online in September and will ramp up to 44 tb/d by November. The Lucius project is also on schedule for first oil in early 4Q14. Finally, Jack St. Malo will come on stream in December with a peak capacity of 100 tb/d. Further new projects will be added at year end, but averaged across the year, the US Gulf of Mexico is unlikely to grow by much more than 0.1 mb/d, as high decline rates at existing fields offset much of the growth from new additions. Alaska’s oil production averaged 0.42 mb/d in July, indicating a 63 tb/d decline in output, mainly due to seasonal maintenance. Oil output also declined a total of 66 tb/d in North Slope and South Alaska. Alaskan crude production dropped in the first seven months by 13 tb/d compared with the same period in 2013 to average 507 tb/d, the lowest level for the same period since 1977. The output drop is taking place due to limited new developments and declines in mature producing areas. The key tight oil regions ‒ Bakken, Eagle Ford, Haynesville, Marcellus, Niobrara, Permian and Utica ‒ accounted for 95% of domestic US oil production growth. Preliminary data for 1 October indicates that the Bakken region’s oil output averaged 1,179 tb/d, a m-o-m increase in oil production of 27 b/d, with average new-well-per-rig oil production reaching 530 b/d. The Eagle Ford region’s oil output averaged 1,582 tb/d in October, a m-o-m rise in oil production of 31 b/d. Average new-well-per-rig oil production reached 536 b/d. The Permian region’s oil output averaged 1,757 tb/d, a
OPEC Monthly Oil Market Report – October 2014 45

World Oil Supply
m-o-m rise in oil production of 39 tb/d, with average new-well-per-rig oil production reaching 171 b/d. On a quarterly basis, US oil supply is seen to average 11.95 mb/d, 12.66 mb/d, 12.87 mb/d and 12.99 mb/d, respectively. Graph 5.4: US quarterly production Graph 5.5: US quarterly production,
annual comparison
Canada and Mexico Oil production from Canada is forecast to increase by 0.18 mb/d in 2014 to average 4.19 mb/d, a downward revision by 60 tb/d from the previous assessment. The second and third quarters were revised down on the back of updated production data compared with the previous MOMR. Preliminary data in the early part of the third quarter (July) indicated weaker supply compared with the previous month for crude, oil sands and NGLs. Maintenance impacted output in the second quarter and the return of production supported an assumed increase in the third quarter. Conventional crude oil production in Alberta, previously on the decline, has generally shown signs of an increase, a trend that will continue over the coming years. Last year about 0.59 mb/d of conventional oil was produced in Alberta compared with 0.55 mb/d in 2012, 0.52 mb/d in 2011 and 0.46 mb/d in 2010. According to the Alberta Energy Department, conventional crude oil is expected to increase to 0.65 mb/d in 2014. Oil sands output in the province is also set to increase, because producers will need to maintain competitiveness to attract investors to the sector. In 2014, the province is expected to produce 2.4 mb/d, with about 0.2 mb/d of new output added each year until 2030. The Canadian Association of Petroleum Producers in its annual report this summer emphasized the increased use of horizontal drilling and multi-stage fracking, which has reversed the steady decline in production from mature basins. New technology and extraction methods are being used widely in the Cardium play in west-central Alberta, the Beaverhill Lake Carbonates, and the Viking in east-central Alberta and at Redwater. On a quarterly basis, Canada’s supply is seen to average 4.27 mb/d, 4.12 mb/d, 4.13 mb/d and 4.24 mb/d, respectively. During the first half of 2014, Canada’s oil supply increased by 0.26 mb/d.
9
10
11
12
13
14
15
1Q12
2Q12
3Q12
4Q12
1Q13
2Q13
3Q13
4Q13
1Q14
2Q14
3Q14
4Q14
1Q15
2Q15
3Q15
4Q15
mb/d
8
9
10
11
12
13
14
15
1Q 2Q 3Q 4Q
mb/d
2012 20132014 2015
46 OPEC Monthly Oil Market Report – October 2014

World Oil Supply
Mexico’s oil output is forecast to decline by 70 tb/d in 2014 to average 2.83 mb/d, indicating a downward revision by 10 tb/d from the previous MOMR. Oil production in Mexico is connected to the performance of giant field developments Cantarel and Ku-Maloob-Zaap. Although the approval of a new energy reform in Mexico would impact their long-term oil production, the results of round one licensing ‒ scheduled to be launched in February 2015 ‒ are not expected to be fruitful in 2016. Preliminary estimations for 2014 oil production indicate a gradual decline in the final three quarters, reaching the lowest level of output in 3Q14 at 2.77 mb/d. According to preliminary data, Mexico’s oil supply averaged 2.89 mb/d during the first three quarters of 2014, down 60 tb/d from the same period in 2013. On a quarterly basis, Mexico’s supply is seen to stand at 2.87 mb/d, 2.85 mb/d, 2.77 mb/d and 2.82 mb/d, respectively. OECD Europe Total OECD Europe’s oil supply is forecast to drop 30 tb/d in 2014 to average 3.55 mb/d, representing a downward revision of 30 tb/d from the previous month. The ongoing output decline in North Sea production is expected to slow down in 2015. On a quarterly basis, oil output is estimated to stand at 3.75 mb/d, 3.51mb/d, 3.40 mb/d and 3.54 mb/d, respectively. Norway’s oil supply is projected to grow by 40 tb/d in 2014 to average 1.88 mb/d, indicating an upward revision of 20 tb/d from the previous MOMR. Based on official production figures published by the Norwegian Petroleum Directorate (NPD), a healthy production level in July of 1.92 mb/d declined in August by 79 tb/d due to maintenance and technical problems at the Fram and Skuld og Troll fields. The decrease in Norway’s August oil production took place despite production increases from Ekofisk and Gullfaks on return from maintenance. Average daily liquid production in August amounted to 1.48 mb/d of oil, 0.30 mb/d of NGLs and 56 tb/d of condensate. Norway’s output in September is also expected to drop by about 50 tb/d, which could further impact the quarterly forecast. During the first three quarters, Norway’s supply averaged 1.86 mb/d, growth of 37 tb/d from the same period a year earlier. On a quarterly basis, Norway’s production is expected to average 1.95 mb/d, 1.79 mb/d, 1.85 mb/d and 1.93 mb/d, respectively. The UK’s oil production is forecast to decline by 30 tb/d in 2014 to average 0.84 mb/d, representing a downward revision of 20 tb/d from the previous month. The UK’s expected annual production level for 2014 is the lowest annual average since 1977. According to actual production data, UK monthly oil output indicated a big drop of 0.23 mb/d compared with July. The impact of maintenance and natural decline were the main factors behind the drop. A loss in output from the 0.2 mb/d Buzzard field, which remained offline for most of the month, was the main reason for a fall in loading of Forties oil. The Buzzard’s return from maintenance has been disorderly, leading to a delay of several months for deliveries of Forties oil, particularly from August to October. On a quarterly basis, the UK’s oil supply is seen to average 0.97 mb/d, 0.90 mb/d, 0.71 mb/d and 0.80 mb/d, respectively. According to preliminary data, UK oil supply averaged 0.86 mb/d during the first three quarters of 2014, a decline of 100 tb/d compared with the same period a year earlier.
OPEC Monthly Oil Market Report – October 2014 47

World Oil Supply
OECD Asia Pacific Total OECD Asia Pacific oil supply is forecast to grow by 20 tb/d and average 0.50 mb/d in 2014, representing a steady state from the previous month. On a quarterly basis, total OECD Asia Pacific supply is seen to average 0.50 mb/d, 0.50 mb/d, 0.51 mb/d and 0.48 mb/d, respectively. Australia’s oil supply is expected to average 0.42 mb/d in 2014, an increase of 10 tb/d and downward revision of 10 tb/d from the previous MOMR. The expected annual average is at the lowest level since 1972. Limited new developments and natural decline remain the main characteristics of Australia’s oil supply. The country’s oil output in 3Q14 is estimated to average 0.42 mb/d, unchanged from 2Q14. On a quarterly basis, Australia’s oil supply is seen to average 0.41 mb/d, 0.42 mb/d, 0.42 mb/d and 0.42 mb/d, respectively. Developing countries Total oil supply in developing countries (DCs) is forecast to average 12.25 mb/d in 2014, representing an increase of 0.12 mb/d over 2013, stagnant from the previous month. Latin America and Africa are the only two regions forecasting supply growth, while production from the Middle East and Other Asia is expected to see a decline in 2014. Latin America is now forecast to experience the second-largest increase among all non-OPEC regions, supported by Brazil. On a quarterly basis, total supply in DCs is seen to average 12.22 mb/d, 12.19 mb/d, 12.27 mb/d and 12.31 mb/d, respectively. According to preliminary and estimated data, DCs’ oil supply averaged 12.20 mb/d during 1H14, an increase of 10 tb/d compared with the same period a year earlier. Graph 5.6: Developing Countries’ quarterly production
Graph 5.7: Developing Countries’ quarterly production, annual comparison
Other Asia Other Asia’s liquids supply is expected to decline by 90 tb/d in 2014 to average 3.51 mb/d, indicating a downward revision of 20 tb/d from the previous MOMR. New assessments indicate that none of the countries of this region are expected to experience production growth in 2014, while oil production from Indonesia, Vietnam,
11.8
11.9
12.0
12.1
12.2
12.3
12.4
12.5
12.6
1Q12
2Q12
3Q12
4Q12
1Q13
2Q13
3Q13
4Q13
1Q14
2Q14
3Q14
4Q14
1Q15
2Q15
3Q15
4Q15
mb/d
11.8
11.9
12.0
12.1
12.2
12.3
12.4
12.5
12.6
1Q 2Q 3Q 4Q
mb/d
2012 20132014 2015
48 OPEC Monthly Oil Market Report – October 2014

World Oil Supply
Thailand and India are likely to decline. Oil production from Brunei, Malaysia and Asia others will remain steady for the remainder of the year. On a quarterly basis, total supply from Other Asia is seen to average 3.55 mb/d, 3.52 mb/d, 3.45 mb/d and 3.50 mb/d, respectively. India’s oil production is seen to stand at 0.87 mb/d in 2014, a minor decline of 10 tb/d compared with the previous year and flat from the previous MOMR. Weak production suggests that India ‒ the world's fourth largest energy consumer ‒ will remain a strong oil importer. Malaysia’s oil supply is expected to average 0.67 mb/d in 2014, steady from the previous MOMR. Malaysia’s oil supply is seen to hold steady in the fourth quarter at 0.66 mb/d. First oil from Malaysia’s deep-water Gumusut field offshore Sabah is now expected to come on stream in the middle of 4Q14. Oil production from Gumusut is expected to peak at 135 tb/d. Gumusut-Kakap is Malaysia’s second deep-water development after the Kikeh oil field. Indonesia’s oil supply is forecast to decline by 40 tb/d in 2014 to average 0.91 mb/d – the country is the biggest producer in the region with the highest expected declines, indicating a downward revision of 20 tb/d compared with the previous month. The downward revision came on the back of updated production figures in the third quarter showing lower output than previously expected. Similarly, Thailand’s oil supply encountered a minor decline by 10 tb/d compared with 2013, unchanged from the previous month’s assessment on the back of updated production data. The country’s oil supply is expected to average 0.36 mb/d in 2014, steady from the previous year. Oil production from Vietnam is expected to drop by 30 tb/d to average 0.35 mb/d in 2014 compared with the previous year, while oil output from Brunei and Asia others is expected to remain steady in 2014 at 0.13 and 0.22 mb/d, respectively. Latin America Latin America’s oil supply is projected to increase by 0.17 mb/d in 2014 to average 4.95 mb/d, indicating an upward revision of 10 tb/d from the previous MOMR. On a quarterly basis, Latin America’s oil production is seen to average 4.84 mb/d, 4.90 mb/d, 5.01 mb/d and 5.05 mb/d, respectively. Argentina’s oil supply forecast remained steady compared with the previous month, averaging 0.66 mb/d, a decline of 30 tb/d compared with the previous year. Colombia’s supply is anticipated to decrease by 20 tb/d in 2014 — the largest drop in the region — to average 1.01 mb/d, indicating an upward revision by 10 tb/d from the previous MOMR. Colombia’s oil supply remained healthy so far in 2014, with continuous gains despite the security situation. Brazil’s oil supply is expected to increase by 0.21 tb/d in 2014 to average 2.85 mb/d, indicating an upward revision of 10 tb/d from the previous month. This revision affected all quarters in 2014. A major revision was introduced to Brazilian oil production on the back of healthy production levels, though maintenance and declines at mature fields in the Campos basin sharply influenced output in July. However, a new report from Petrobras registered an increase of 50 tb/d in August. According to preliminary and
OPEC Monthly Oil Market Report – October 2014 49

World Oil Supply
estimated data, Brazil’s oil supply has been increasing by 100 tb/d in each quarter of 2014. On a quarterly basis, the country’s oil production is seen to average 2.71 mb/d, 2.82 mb/d, 2.92 mb/d and 2.95 mb/d, respectively. Middle East Middle Eastern oil production is estimated to decline by 20 tb/d in 2014 to average 1.34 mb/d, a downward revision of 30 tb/d from the previous month. Bahrain and Syria saw production at 0.22 mb/d and 0.03 mb/d in 2014, while Oman’s growth for 2014 has increased to 20 tb/d, although absolute volumes were unchanged at 0.95 mb/d. Syria was producing 330 tb/d just six months before its civil war began, and no changes are expected for Syria in 4Q14. Yemen is estimated to show a decline by 30 tb/d for 4Q14. The country’s forecasts indicate a decline by 10 tb/d to average 0.13 mb/d, revised upward by 10 tb/d compared with the previous MOMR. A high level of risk remains associated with Middle East supply forecasts, mainly due to political and data issues, thus there is downside risk to the forecast. On a quarterly basis, Middle East oil production is seen to stand at 1.34 mb/d, 1.33 mb/d, 1.37 mb/d and 1.33 mb/d, respectively. Africa African oil supply is forecast to increase by 0.05 mb/d in 2014 to average 2.45 mb/d, unchanged from the previous MOMR. Despite this steady state, individual countries’ oil supply forecasts saw a few upward and downward revisions which offset each other. Oil production from Chad and Equatorial Guinea are expected to see minor growth of 20 tb/d and 10 tb/d to average, 0.14 mb/d and 0.33 mb/d, respectively. Egypt and Africa other will show declines of 20 tb/d and 10 tb/d to average 0.70 mb/d and 0.33 mb/d, respectively. The supply forecast for Congo, Gabon and South Africa is unchanged from the previous year to average 0.26 mb/d, 0.23 mb/d and 0.17 mb/d, respectively. Oil supply from the Sudans averaged 0.24 mb/d in 2013, an increase of 0.12 mb/d compared with the previous year, indicating an upward revision of 20 tb/d from the previous MOMR. Fighting between the South Sudanese government and rebels, led by the previous vice president, has cut oil output to 185 tb/d. Total production of the Sudans is expected to grow by 50 tb/d from a year earlier to average 0.29 mb/d in 2014. Moreover, more wells have come back online and output is expected to increase toward pre-shutdown levels, if downside risks do not materialise. On a quarterly basis, Africa’s oil supply is estimated to average 2.49 mb/d, 2.45 mb/d, 2.44 mb/d and 2.42 mb/d, respectively. FSU, other regions Total FSU oil production will remain stagnant in 2014 to average 13.40 mb/d, unchanged from the previous month’s estimate. The forecast has experienced upward and downward revisions on an annual basis for Kazakhstan, Azerbaijan, and FSU Others, which offset each other. The revisions took place mainly in the third and fourth quarters as updated production data became available. The FSU’s supply growth is supported mainly by Russia while Kazakhstan’s production is expected to decline in 2014 and Azerbaijan’s production
50 OPEC Monthly Oil Market Report – October 2014

World Oil Supply
remains steady. FSU remains the second-largest oil-producer, based on volume on a regional basis, after OECD Americas. According to preliminary data, FSU supply averaged 13.41 mb/d in the first three quarters of 2014, an increase of 0.13 mb/d compared with the same period a year earlier. Other Europe’s supply is seen to remain flat from 2012 and average 0.14 mb/d in 2014. On a quarterly basis, total production in the FSU is estimated to average 13.48 mb/d, 13.36 mb/d, 13.41 mb/d and 13.37 mb/d, respectively. Russia Russia’s oil supply is expected to increase by 0.30 mb/d in 2014 to average 10.54 mb/d, indicating an upward revision of 10 tb/d compared with the previous month. This minor upward revision was introduced to adjust for updated production data. Eastern Siberian fields are strongly supporting Russian output as well as stabilizing Western Siberian fields. Russian oil output recovered m-o-m to 10.54 mb/d in August as maintenance ended at Gazprom’s Uregoi and Yamburg gas fields. According to preliminary data from the ministry, the country’s production reached a record high in September of 10.63 mb/d, a 90 tb/d increase over the previous month. This healthy figure was supported by steady production from Western Siberian fields as well as new volumes from green fields. According to the ministry's outlook, Russia will extract 525.3 million metric tons (3.85 billion barrels) of crude oil in 2014, up from a previous all-time high of 523.3 million tons in 2013. Russia's oil production has increased steadily for the past five years as new fields in Eastern Siberia have come on stream. However, the ministry expects oil production to to drop to 10.51 mb/d in 2015, y-o-y. Sanctions are assumed to have a limited impact on output in 2016, but not in 2014 and 2015. Arctic offshore and shale oil projects are the main strategy of Russia's post-2020 plan, but will not significantly affect production over the short term. On a quarterly basis, Russia’s supply is estimated to average 10.59 mb/d, 10.55 mb/d, 10.52 mb/d and 10.50 mb/d, respectively. Graph 5.8: Russia’s quarterly production Graph 5.9: Russia’s quarterly production,
annual comparison
10.1
10.2
10.3
10.4
10.5
10.6
10.7
1Q12
2Q12
3Q12
4Q12
1Q13
2Q13
3Q13
4Q13
1Q14
2Q14
3Q14
4Q14
1Q15
2Q15
3Q15
4Q15
mb/d
10.1
10.2
10.3
10.4
10.5
10.6
10.7
1Q 2Q 3Q 4Q
mb/d
2012 20132014 2015
OPEC Monthly Oil Market Report – October 2014 51
World Oil Supply
Caspian Kazakhstan’s oil production is forecast to decrease by 20 tb/d in 2014 to average 1.62 mb/d, indicating an upward revision of 10 tb/d from the previous MOMR. The upward revision was introduced to adjust for updated preliminary production data in the third quarter; it is supported by production from the Tengiz oil field, which returned from maintenance. Kazakhstan’s output is expected to fall again, given heavy maintenance in 2014 and high underlying decline rates. Y-o-y changes in Kazakhstan’s oil fields indicate that output from Tengiz, Aktobemunai and Kazgermunai fields is declining. On a quarterly basis, Kazakhstan oil supply is seen to stand at 1.65 mb/d, 1.57 mb/d, 1.64 mb/d and 1.61 mb/d, respectively. Azerbaijan’s oil production is forecast to drop 40 tb/d in 2014 to average 0.86 mb/d, a downward revision of 15 tb/d from the previous MOMR. The revision was introduced to 2H14 supply estimates. Updated production data for early parts of the third quarter show that output remained below expectations, necessitating a downward revision in the third quarter. Weak production data stems from both maintenance and natural decline. The loading programme indicated some improvement in October from the previous month, supporting fourth quarter output. On a quarterly basis, Azerbaijan’s output is seen to stand at 0.87 mb/d, 0.87 mb/d, 0.85 mb/d and 0.85 mb/d, respectively. China China’s oil supply is anticipated to increase by 30 tb/d in 2014 to average 4.26 mb/d, a downward revision of 10 tb/d from the previous month. This revision was made to adjust for updated production data in the third quarter, which was partially carried over to the rest of the year. Decline rates at mature fields such as Daqing and Changqing have also increased. Preliminary production data indicated that China’s output increased by 50 tb/d in August from the previous month, supported by an increase in offshore production. According to preliminary and estimated data, China’s supply averaged 4.23 mb/d during the first three quarters of the year, an increase of less than 20 tb/d from the same period a year earlier. Oil production in 4Q14 will reach 4.35 mb/d, 160 tb/d more than a month earlier. On a quarterly basis, China’s oil production is expected to average 4.24 mb/d, 4.27 mb/d, 4.19 mb/d and 4.35 mb/d, respectively.
Forecast for 2015 Non-OPEC supply Non-OPEC oil supply is forecast to increase by 1.24 mb/d in 2015 to average 57.16 mb/d. Output for 2015 is expected to remain unchanged, despite revisions to oil production of several countries. OECD Americas will continue to be the non-OPEC region with the highest expected growth at 1.08 mb/d, supported by a forecast increase in the US of 0.88 mb/d and Canada of 0.24 mb/d, while output from Mexico is expected to decline by 30 tb/d, less than in 2014. Latin America is forecast to grow by 0.18 mb/d, due to projected supply increases from Brazil, which will grow by 0.19 mb/d to average 3.04 mb/d. FSU’s supply is expected to experience the biggest decline, down 80 tb/d to average 13.32 mb/d – this is made up of Kazakhstan with a loss of 40 tb/d, Russia down by 30 tb/d and Azerbaijan falling 10 tb/d. Africa’s production is forecast to drop by
52 OPEC Monthly Oil Market Report – October 2014

World Oil Supply
30 tb/d in 2015 compared with other non-OPEC regions, while Chinese oil supply is expected to grow by 60 tb/d to reach an average of 4.32 mb/d in 2015. On a quarterly basis, non-OPEC supply in 2015 is expected to average 57.07 mb/d, 56.85 mb/d, 57.04 mb/d and 57.65 mb/d, respectively. Table 5.2: Non-OPEC oil supply in 2015, mb/d
Revisions to the 2015 forecast Oil supply forecasts for the US, Mexico, Australia, India, Oman, South Africa, FSU others and China have seen some upward revision for 2015, while oil output from Canada, Norway, the UK, Other Asia Pacific, Indonesia, Thailand, Brazil, Colombia, Yemen, Egypt, Russia and Kazakhstan has been revised down. These revisions are due to changes in 2013 estimates as well as changes to the 2014 forecast which are being carried over to 2015. OPEC NGLs and non-conventional oils Production of OPEC natural gas liquids (NGLs) and non-conventional oils in 2014 is expected to increase by 0.18 mb/d over the previous year to reach 5.83 mb/d, unchanged from the previous monthly assessment. In 2015, OPEC NGLs and non-conventional oils are forecast to grow by 0.20 mb/d to 6.03 mb/d. Table 5.3: OPEC NGLs + non-conventional oils, 2012-2015
Change2014 1Q15 2Q15 3Q15 4Q15 2015 15/14
Americas 19.65 20.37 20.48 20.86 21.21 20.73 1.08 of which US 12.62 13.16 13.34 13.62 13.85 13.50 0.88Europe 3.55 3.66 3.51 3.40 3.62 3.55 0.00Asia Pacific 0.50 0.51 0.52 0.51 0.47 0.50 0.00Total OECD 23.69 24.53 24.50 24.77 25.31 24.78 1.09
Other Asia 3.51 3.57 3.54 3.50 3.45 3.51 0.01Latin America 4.95 5.11 5.11 5.13 5.17 5.13 0.18Middle East 1.34 1.37 1.36 1.35 1.34 1.35 0.01Africa 2.45 2.47 2.43 2.41 2.39 2.42 -0.03Total DCs 12.25 12.52 12.44 12.38 12.34 12.42 0.17
FSU 13.40 13.39 13.30 13.27 13.32 13.32 -0.08 of which Russia 10.54 10.52 10.50 10.49 10.51 10.51 -0.03Other Europe 0.14 0.14 0.14 0.14 0.14 0.14 0.00China 4.26 4.31 4.29 4.31 4.37 4.32 0.06Total "Other regions" 17.81 17.85 17.73 17.72 17.83 17.78 -0.02Total Non-OPEC production 53.75 54.89 54.68 54.87 55.48 54.98 1.23Processing gains 2.16 2.17 2.17 2.17 2.17 2.17 0.01
Total Non-OPEC supply 55.91 57.07 56.85 57.04 57.65 57.16 1.24Previous estimate 55.91 57.07 56.85 57.04 57.65 57.16 1.24Revision 0.00 0.00 0.00 0.00 0.00 0.00 0.00
Change Change Change2012 2013 13/12 1Q14 2Q14 3Q14 4Q14 2014 14/13 2015 15/14
Total OPEC 5.57 5.65 0.08 5.73 5.79 5.86 5.93 5.83 0.18 6.03 0.20
OPEC Monthly Oil Market Report – October 2014 53

World Oil Supply
OPEC crude oil production Total OPEC crude oil production has risen in September to average 30.47 mb/d, according to secondary sources, up 0.40 mb/d from the previous month. Production from Libya, Iraq, Angola and Nigeria increased, while crude oil output in Saudi Arabia fell. According to secondary sources, OPEC crude oil production, not including Iraq, stood at 27.31 mb/d in September, up 0.27 mb/d over the previous month. Table 5.4: OPEC crude oil production based on secondary sources, tb/d
Table 5.5: OPEC crude oil production based on direct communication, tb/d
2012 2013 1Q14 2Q14 3Q14 Jul 14 Aug 14 Sep 14 Sep/AugAlgeria 1,210 1,159 1,128 1,157 1,166 1,167 1,166 1,166 0.0Angola 1,738 1,738 1,600 1,646 1,688 1,642 1,692 1,732 40.4Ecuador 499 516 537 541 544 542 544 546 2.1Iran, I.R. 2,977 2,673 2,772 2,767 2,761 2,754 2,765 2,765 0.0Iraq 2,979 3,037 3,217 3,258 3,086 3,069 3,029 3,164 134.5Kuwait 2,793 2,822 2,797 2,786 2,791 2,780 2,796 2,796 0.0Libya 1,393 928 371 222 580 424 536 787 250.6Nigeria 2,073 1,912 1,898 1,894 1,982 1,912 2,006 2,030 24.8Qatar 753 732 733 729 738 738 739 739 0.0Saudi Arabia 9,737 9,586 9,702 9,675 9,725 9,912 9,655 9,605 -50.4UAE 2,624 2,741 2,745 2,749 2,806 2,795 2,812 2,812 0.0Venezuela 2,359 2,356 2,341 2,337 2,328 2,320 2,332 2,332 0.0
Total OPEC 31,135 30,198 29,839 29,762 30,197 30,054 30,072 30,474 402.0OPEC excl. Iraq 28,155 27,161 26,622 26,503 27,111 26,986 27,043 27,311 267.4
Totals may not add up due to independent rounding.
2012 2013 1Q14 2Q14 3Q14 Jul 14 Aug 14 Sep 14 Sep/AugAlgeria 1,203 1,203 1,202 1,190 1,196 1,203 1,202 1,183 -19.0Angola 1,704 1,701 1,553 1,616 1,709 1,714 1,709 1,703 -6.0Ecuador 504 526 553 557 557 558 561 551 -9.8Iran, I.R. 3,740 3,576 3,270 3,194 3,003 3,000 3,010 3,000 -10.0Iraq 2,944 2,980 3,106 3,118 3,076 3,012 3,023 3,196 173.0Kuwait 2,977 2,922 2,898 2,885 2,876 2,850 2,880 2,900 20.0Libya 1,450 993 384 228 522 415 391 768 377.2Nigeria 1,954 1,754 1,869 1,821 1,747 1,648 1,785 1,810 24.9Qatar 734 724 725 710 720 734 734 690 -43.5Saudi Arabia 9,763 9,637 9,723 9,715 9,769 10,005 9,597 9,704 107.1UAE 2,652 2,797 2,733 2,770 2,881 2,893 2,911 2,837 -74.1Venezuela 2,804 2,786 2,870 2,826 .. 2,776 .. .. ..
Total OPEC 32,429 31,599 30,886 30,629 .. 30,808 .. .. ..OPEC excl. Iraq 29,485 28,619 27,781 27,511 .. 27,796 .. .. ..
Totals may not add up due to independent rounding... Not availab le.
54 OPEC Monthly Oil Market Report – October 2014
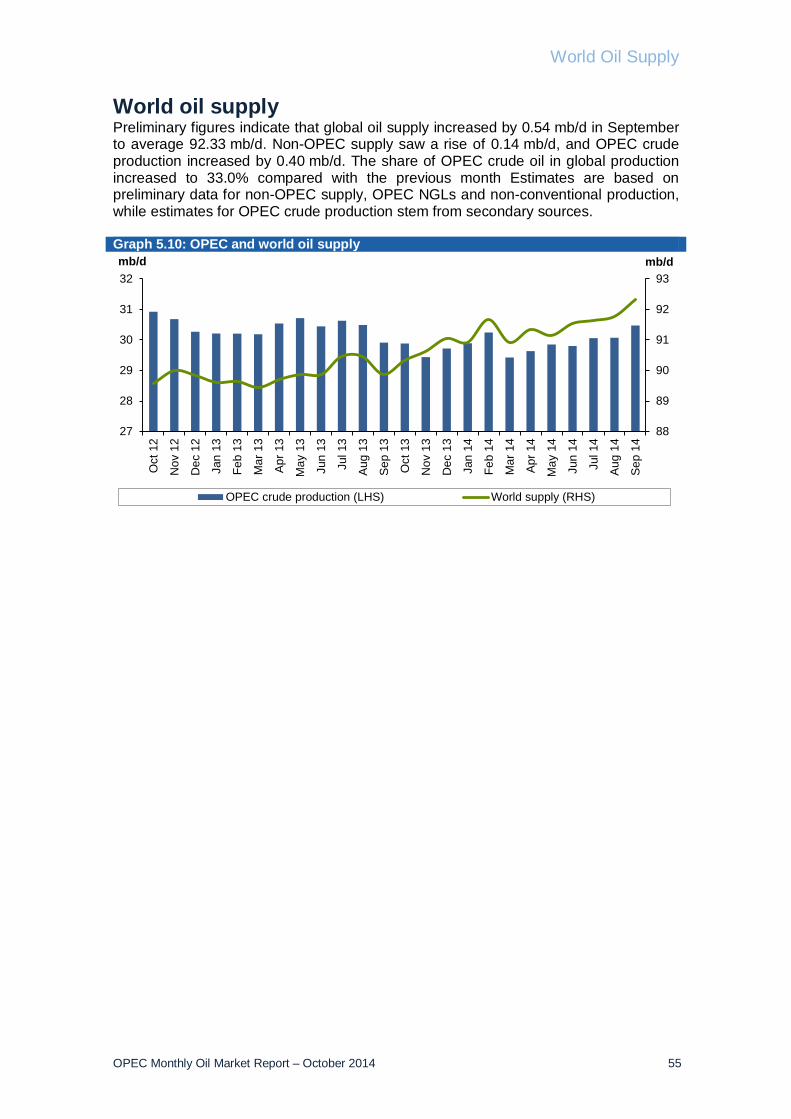
World Oil Supply
World oil supply Preliminary figures indicate that global oil supply increased by 0.54 mb/d in September to average 92.33 mb/d. Non-OPEC supply saw a rise of 0.14 mb/d, and OPEC crude production increased by 0.40 mb/d. The share of OPEC crude oil in global production increased to 33.0% compared with the previous month Estimates are based on preliminary data for non-OPEC supply, OPEC NGLs and non-conventional production, while estimates for OPEC crude production stem from secondary sources. Graph 5.10: OPEC and world oil supply
88
89
90
91
92
93
27
28
29
30
31
32
Oct
12
Nov
12
Dec
12
Jan
13
Feb
13
Mar
13
Apr 1
3
May
13
Jun
13
Jul 1
3
Aug
13
Sep
13
Oct
13
Nov
13
Dec
13
Jan
14
Feb
14
Mar
14
Apr 1
4
May
14
Jun
14
Jul 1
4
Aug
14
Sep
14
mb/dmb/d
OPEC crude production (LHS) World supply (RHS)
OPEC Monthly Oil Market Report – October 2014 55

Product Markets and Refinery Operations
Product Markets and Refinery Operations Product markets in the Atlantic Basin continued to be supported by US gasoline developments as several unit outages caused inventories to drop and tightened the gasoline market, fuelling bullish sentiment and offsetting the weakness seen in middle distillates, thus allowing margins to continue their upward trend. In Asia, strong gasoline and fuel oil demand ‒ along with falling crude prices ‒ allowed margins to recover. Graph 6.1: Refinery margins, 2013-2014
US product markets strengthened during September as gasoline market fundamentals continued to be supported by a tight environment generated by fluid catalytic cracking (FCC) unit outages amid falling inventories. The refinery margin for WTI crude on the US Gulf Coast (USGC) showed a sharp gain of almost $4 to average $16/b in September. Meanwhile, the margin for Light Louisiana Sweet (LLS) crude on the USGC averaged $19/b during September, exhibiting a gain of around $4. European refining margins continued the recovery trend of the previous month, with light distillate crack spreads moving up on the back of higher export opportunities. The refinery margin for Brent crude in Northwest Europe showed a gain of more than $1 to average $5.8/b in September. Asian refining margins exhibited a sharp recovery during September as an increase in gasoline and fuel oil demand, along with falling crude prices, allowed crack spreads to rise across the barrel. Refinery margins in Singapore showed a gain of more than $3 during the previous month to average $3.1/b in September. Refinery operations Refinery utilization rates in the US continued at high levels, with refinery utilization averaging 90.6%, representing a drop of about 1.4 percentage points (pp) from a month earlier. This decline was due to some refinery outages along with the start of the autumn maintenance season. Healthy margins encouraged increasing refinery runs over the previous months, though this upward trend was affected in September by unscheduled unit shutdowns at several refineries.
-5
0
5
10
15
20
-5
0
5
10
15
20
Sep
13
Oct
13
Nov
13
Dec
13
Jan
14
Feb
14
Mar
14
Apr
14
May
14
Jun
14
Jul 1
4
Aug
14
Sep
14
US$/bUS$/b
WTI (US Gulf) Arab Heavy (US Gulf) Brent (Rotterdam)Dubai (Singapore) LLS (US Gulf)
56 OPEC Monthly Oil Market Report – October 2014
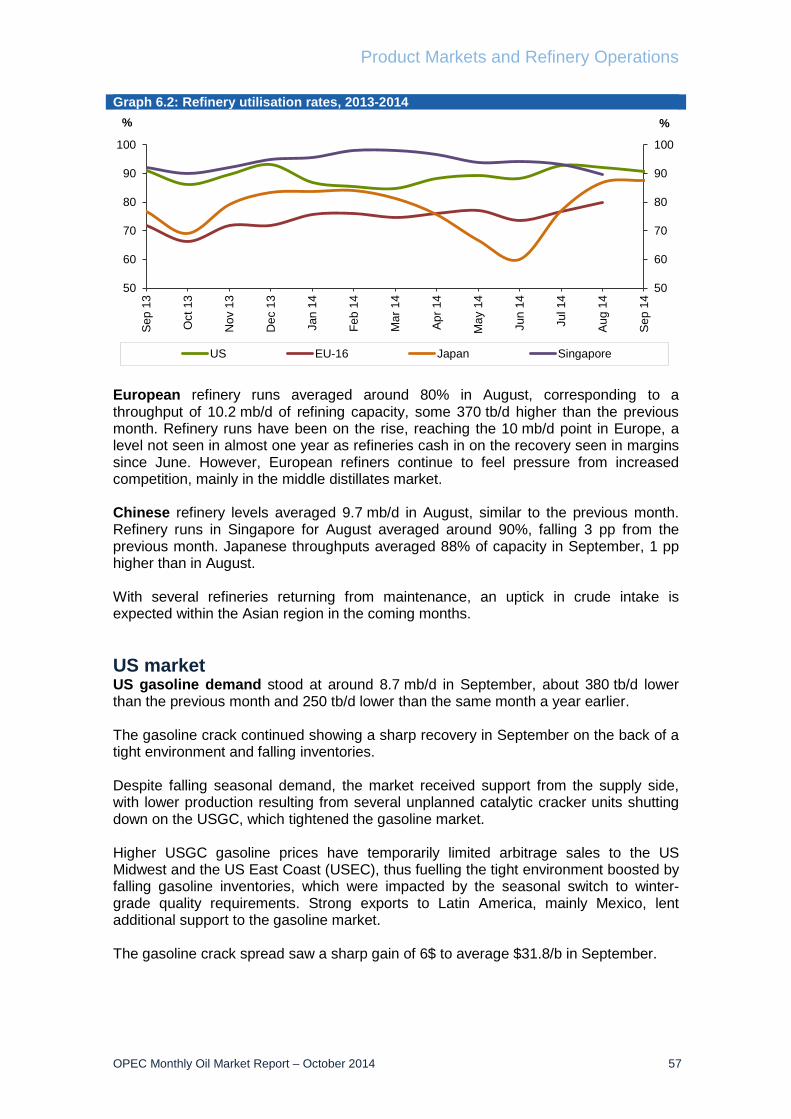
Product Markets and Refinery Operations
Graph 6.2: Refinery utilisation rates, 2013-2014
European refinery runs averaged around 80% in August, corresponding to a throughput of 10.2 mb/d of refining capacity, some 370 tb/d higher than the previous month. Refinery runs have been on the rise, reaching the 10 mb/d point in Europe, a level not seen in almost one year as refineries cash in on the recovery seen in margins since June. However, European refiners continue to feel pressure from increased competition, mainly in the middle distillates market. Chinese refinery levels averaged 9.7 mb/d in August, similar to the previous month. Refinery runs in Singapore for August averaged around 90%, falling 3 pp from the previous month. Japanese throughputs averaged 88% of capacity in September, 1 pp higher than in August. With several refineries returning from maintenance, an uptick in crude intake is expected within the Asian region in the coming months.
US market US gasoline demand stood at around 8.7 mb/d in September, about 380 tb/d lower than the previous month and 250 tb/d lower than the same month a year earlier. The gasoline crack continued showing a sharp recovery in September on the back of a tight environment and falling inventories. Despite falling seasonal demand, the market received support from the supply side, with lower production resulting from several unplanned catalytic cracker units shutting down on the USGC, which tightened the gasoline market. Higher USGC gasoline prices have temporarily limited arbitrage sales to the US Midwest and the US East Coast (USEC), thus fuelling the tight environment boosted by falling gasoline inventories, which were impacted by the seasonal switch to winter-grade quality requirements. Strong exports to Latin America, mainly Mexico, lent additional support to the gasoline market. The gasoline crack spread saw a sharp gain of 6$ to average $31.8/b in September.
50
60
70
80
90
100
50
60
70
80
90
100S
ep 1
3
Oct
13
Nov
13
Dec
13
Jan
14
Feb
14
Mar
14
Apr
14
May
14
Jun
14
Jul 1
4
Aug
14
Sep
14
%%
US EU-16 Japan Singapore
OPEC Monthly Oil Market Report – October 2014 57

Product Markets and Refinery Operations
Graph 6.3: US Gulf crack spread vs. WTI, 2013-2014
Middle distillate demand stood at around 3.8 mb/d in September, around 130 tb/d lower than the previous month and 50 tb/d above the same month a year earlier. The middle distillates market saw a loss this month and crack spreads weakened due to lower seasonal domestic demand amid bearish sentiment, fuelled by a lack of exports to Europe and a rise in distillate stocks of around 3 mb during September. Some support came from the export side as demand from Central and South America drew several diesel cargoes from the USGC, mainly to Argentina, Brazil and Ecuador. However, this was outweighed by the reduction seen in volumes of diesel sent to Europe as increasing inflows amid lower demand in the region limited US arbitrage. The USGC gasoil crack saw a loss of more than $2 versus the previous month’s levels to average around $18/b in September. At the bottom of the barrel, the fuel oil crack continued its recovery during September; however the uptick was limited by the higher availability of vacuum gasoil (VGO) due to outages at some fluid cracker units. The shutdown of some hydro-treating capacity has favored low sulfur fuel oil (LSFO) margins while lower runs and lighter crude processed by refineries has contributed to tightening in the market. The fuel oil crack in the USGC showed a slight gain of 40¢ in September. European market Product markets in Europe continued a moderate recovery with light distillate crack spreads moving upwards on the back of higher export opportunities, while middle distillates weakened on oversupply and low demand. The gasoline crack recovered in September due to higher export opportunities amid upcoming autumn maintenance. The gasoline market recovered in Europe because of a tightening environment, fuelled by planned refinery maintenance in the region along with a draw in gasoline
-10
0
10
20
30
40
-10
0
10
20
30
40S
ep 1
3
Oct
13
Nov
13
Dec
13
Jan
14
Feb
14
Mar
14
Apr
14
May
14
Jun
14
Jul 1
4
Aug
14
Sep
14
US$/bUS$/b
Prem.Gasoline Unl.93 Jet/Kero Gasoil/Diesel (0.05%S) Fuel oil (180c)
58 OPEC Monthly Oil Market Report – October 2014

Product Markets and Refinery Operations
inventories. Increasing trader interest in winter-grade quality gasoline volumes added further support to the market. In addition, higher exports of gasoline to West Africa, the Middle East and the US further supported the market. The gasoline crack spread against Brent showed a gain of almost $2 to average $20/b in September. The light distillate naphtha crack recovered some ground a month ago on the back of support from gasoline blenders amid export volumes to South Korea drawing some volumes from Europe, although the uptick was capped by the reduced arbitrage window to Asia in recent weeks, while domestic petrochemical demand remained thin. Graph 6.4: Rotterdam crack spreads vs. Brent, 2013-2014
Middle distillate cracks slightly weakened during September due to increasing inflows to the region amid weak demand. The ultra-low sulphur diesel (ULSD) crack in Northwest Europe partially kept its recovery seen the previous month on the back of a tight environment, fuelled by heavy scheduled refinery maintenance in the region amid expected lower export volumes of ULSD from Russia. However, this was outweighed by increasing inflows from the Middle East and India. Lack of arbitrage volumes to North and West Africa fuelled bearish sentiment in the market, causing the gasoil crack spread to lose some ground. The gasoil crack spread against Brent crude at Rotterdam showed a slight loss of 50¢ versus the previous month to average around $14.6/b in September. Looking forward, inflows are expected to increase to Europe in the coming weeks from the US, Russia and the Middle East, which may keep pressure on the gasoil market in the region. At the bottom of the barrel, fuel oil cracks recovered some ground in September on the back of tighter supplies due to reduced fuel production stemming from heavy refinery maintenance amid higher arbitrage volumes to Asia.
-20
-10
0
10
20
30
-20
-10
0
10
20
30
Sep
13
Oct
13
Nov
13
Dec
13
Jan
14
Feb
14
Mar
14
Apr 1
4
May
14
Jun
14
Jul 1
4
Aug
14
Sep
14
US$/bUS$/b
Prem.Gasoline Unl.98 ppm Jet/Kero Gasoil 10 ppm Fuel oil (1.0%S)
OPEC Monthly Oil Market Report – October 2014 59
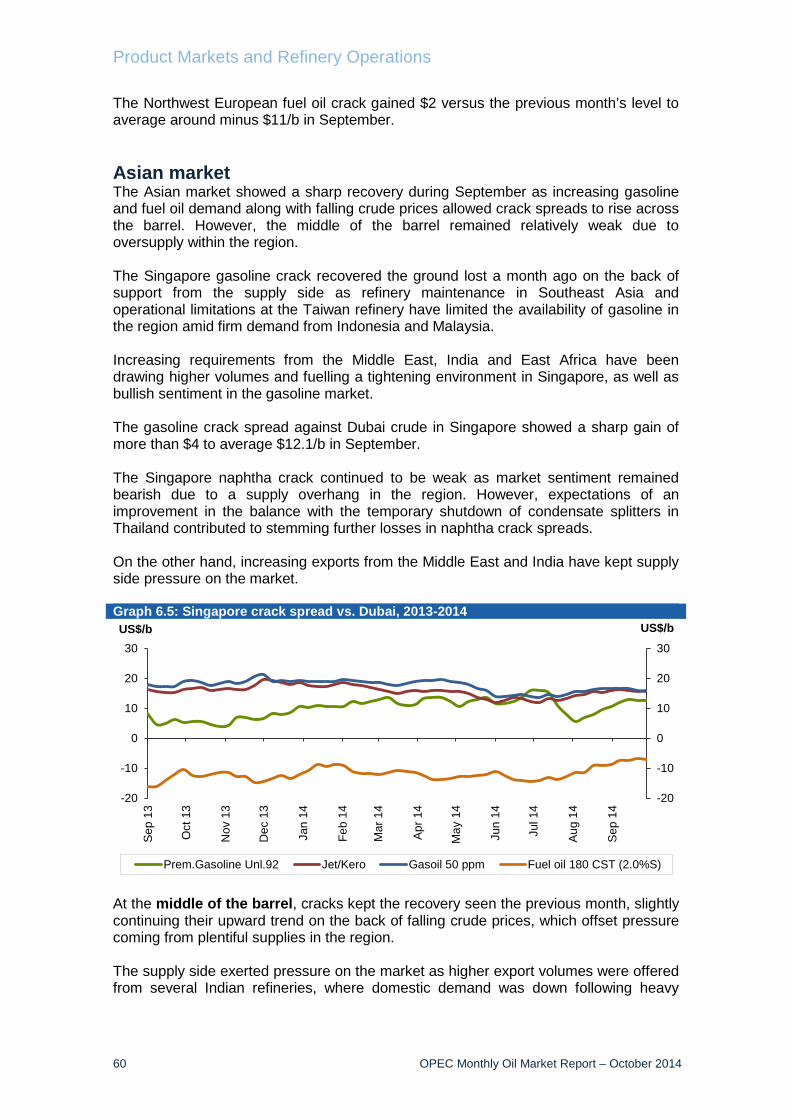
Product Markets and Refinery Operations
The Northwest European fuel oil crack gained $2 versus the previous month’s level to average around minus $11/b in September. Asian market The Asian market showed a sharp recovery during September as increasing gasoline and fuel oil demand along with falling crude prices allowed crack spreads to rise across the barrel. However, the middle of the barrel remained relatively weak due to oversupply within the region. The Singapore gasoline crack recovered the ground lost a month ago on the back of support from the supply side as refinery maintenance in Southeast Asia and operational limitations at the Taiwan refinery have limited the availability of gasoline in the region amid firm demand from Indonesia and Malaysia. Increasing requirements from the Middle East, India and East Africa have been drawing higher volumes and fuelling a tightening environment in Singapore, as well as bullish sentiment in the gasoline market. The gasoline crack spread against Dubai crude in Singapore showed a sharp gain of more than $4 to average $12.1/b in September. The Singapore naphtha crack continued to be weak as market sentiment remained bearish due to a supply overhang in the region. However, expectations of an improvement in the balance with the temporary shutdown of condensate splitters in Thailand contributed to stemming further losses in naphtha crack spreads. On the other hand, increasing exports from the Middle East and India have kept supply side pressure on the market. Graph 6.5: Singapore crack spread vs. Dubai, 2013-2014
At the middle of the barrel, cracks kept the recovery seen the previous month, slightly continuing their upward trend on the back of falling crude prices, which offset pressure coming from plentiful supplies in the region. The supply side exerted pressure on the market as higher export volumes were offered from several Indian refineries, where domestic demand was down following heavy
-20
-10
0
10
20
30
-20
-10
0
10
20
30
Sep
13
Oct
13
Nov
13
Dec
13
Jan
14
Feb
14
Mar
14
Apr 1
4
May
14
Jun
14
Jul 1
4
Aug
14
Sep
14US$/bUS$/b
Prem.Gasoline Unl.92 Jet/Kero Gasoil 50 ppm Fuel oil 180 CST (2.0%S)
60 OPEC Monthly Oil Market Report – October 2014

Product Markets and Refinery Operations
monsoon rainfall. Additional pressure came from rising availability in Japan, Taiwan and Thailand. In addition, pressure came from the demand side in the form of lower requirements from the Philippines and Vietnam. The gasoil crack spread in Singapore against Dubai showed a slight gain of 30¢ versus the previous month’s level to average around $16.4/b in September. Developments in crude prices played a role in this performance. The fuel oil market continued its recovery in Singapore on the back of tightening sentiment amid firm demand. Fuel oil cracks continued their upward trend over the month, with the crack spread supported by a tight environment in turn fuelled by the onset of the autumn maintenance season and lower regional fuel oil production, with refineries processing more light crudes. Bunker demand has shown some recovery amid higher fuel oil requirements from Egypt. The fuel oil crack spread in Singapore against Dubai gained almost $3 to average minus $7.6/b in September. Table 6.1: Refinery operations in selected OECD countries
Change ChangeJul 14 Aug 14 Sep 14 Sep/Aug Jul 14 Aug 14 Sep 14 Sep/Aug
US 16.51 16.40 16.13 -0.26 92.65 92.05 90.57 -1.48France 1.13 1.14 - - 74.91 75.71 - -Germany 1.75 1.97 - - 78.05 87.48 - -Italy 1.18 1.20 - - 55.63 56.77 - -UK 1.04 1.07 - - 67.96 70.26 - -Euro-16 9.84 10.21 - - 76.85 79.76 - -Japan 3.04 3.27 3.29 0.02 77.00 86.90 87.60 0.70
Sources: OPEC statistics, Argus, Euroilstock inventory report, IEA, EIA/DoE, METI and PAJ.
Refinery throughput, mb/d Refinery utilization, %
OPEC Monthly Oil Market Report – October 2014 61

Product Markets and Refinery Operations
Table 6.2: Refined product prices, US$/b
ChangeJul 14 Aug 14 Sep 14 Sep/Aug
US Gulf (Cargoes FOB):Naphtha 111.07 105.20 101.01 -4.19Premium gasoline (unleaded 93) 128.21 122.19 125.15 2.96Regular gasoline (unleaded 87) 119.96 116.47 111.15 -5.32Jet/Kerosene 119.18 120.21 115.27 -4.94Gasoil (0.2% S) 117.60 116.34 111.10 -5.24Fuel oil (1.0% S) 94.48 94.22 91.52 -2.70Fuel oil (3.0% S) 89.01 87.64 86.06 -1.58Rotterdam (Barges FoB):Naphtha 103.50 95.76 93.04 -2.72Premium gasoline (unleaded 98) 128.08 119.86 117.23 -2.63Jet/Kerosene 122.77 120.02 114.54 -5.48Gasoil/Diesel (10 ppm) 119.20 116.65 111.88 -4.77Fuel oil (1.0% S) 93.75 88.64 86.50 -2.14Fuel oil (3.5% S) 90.81 89.16 86.14 -3.02Mediterranean (Cargoes FOB):Naphtha 101.50 93.81 90.97 -2.84Premium gasoline* 122.91 115.19 113.54 -1.65Jet/Kerosene 120.19 117.47 112.10 -5.37Gasoil/Diesel* 119.77 117.07 112.15 -4.92Fuel oil (1.0% S) 94.49 89.68 88.60 -1.08Fuel oil (3.5% S) 91.00 88.87 85.92 -2.95Singapore (Cargoes FOB):Naphtha 106.34 98.87 94.45 -4.42Premium gasoline (unleaded 95) 121.99 111.35 110.58 -0.77Regular gasoline (unleaded 92) 119.78 109.26 108.61 -0.65Jet/Kerosene 118.79 116.60 112.48 -4.12Gasoil/Diesel (50 ppm) 120.24 117.78 112.90 -4.88Fuel oil (180 cst 2.0% S) 94.51 93.50 90.86 -2.64Fuel oil (380 cst 3.5% S) 93.35 91.86 89.14 -2.72
Sources: Platts and Argus Media.* Cost, insurance and freight (CIF).
62 OPEC Monthly Oil Market Report – October 2014

Tanker Market
Tanker Market The dirty spot tanker market continued to be under pressure in September for vessels of all sizes. Dirty spot market activity was at very low levels, especially in the Middle East. A drop in chartering activities resulted in a drop in freight rates, with daily earnings falling to the lowest levels in several months. VLCC spot freight rates fell by 17%, Suezmax rates decreased by 11% and Aframax freight rates fell by 17% over the previous month. The tanker market was dominated by a significant surplus of vessels combined with low activity, creating huge tonnage built up and rendering the market incapable of reacting positively even to occasional mishaps which should have otherwise supported freight rates to some extent. Positively, freight rates for the same segments still showed an improvement from the previous year by 13%, 24% and 6%, respectively. September was a rewarding month in the products market, as clean tanker freight rates saw gains in all classes, mainly on the back of an active market. East of Suez increased by a slight 1%, while West of Suez increased by 9% from the month before. Spot fixtures Chartering activity declined during September in all regions; total spot fixtures dropped by 4.8% m-o-m, while estimated OPEC spot fixtures fell by 6.6% compared with a month earlier to average 11.21 mb/d. Losses in fixtures were seen in all reported regions, as fixtures from the Middle East-to-West and those outside the Middle East dropped by 31.1% and 3.5%, respectively, while fixtures from the Middle East-to-East stayed flat from the previous month to average 5.79 mb/d. Table 7.1: Tanker chartering, sailings and arrivals, mb/d
ChangeJul 14 Aug 14 Sep 14 Sep 14/Aug 14
Spot CharteringAll areas 17.93 17.00 16.19 -0.81OPEC 12.59 12.00 11.21 -0.79Middle East/East 5.92 5.79 5.79 0.00Middle East/West 2.45 2.08 1.43 -0.65Outside Middle East 4.23 4.14 3.99 -0.15
SailingsOPEC 23.55 23.37 23.29 -0.09Middle East 17.21 17.04 16.97 -0.07
ArrivalsNorth America 8.58 8.77 8.73 -0.03Europe 12.39 12.42 12.36 -0.06Far East 8.37 8.26 8.09 -0.17West Asia 4.57 4.62 4.77 0.15
Sources: Oil Movements and Lloyd's Marine Intelligence Unit.
OPEC Monthly Oil Market Report – October 2014 63

Tanker Market
Sailings and arrivals OPEC sailings dropped by 0.09 mb/d in September from the previous month to stand at 23.29 mb/d. Similarly, sailings from the Middle East dropped by 0.07 mb/d. In addition, arrivals showed a drop in September at all ports, with the exception of West Asian ports, which showed higher arrivals from one month earlier by 0.15 mb/d. Arrivals from North America, Europe and the Far East registered declines of 0.3 mb/d, 0.5 mb/d and 0.17 mb/d, respectively. Spot freight rates VLCC In the VLCC sector, spot freight rates remained at low levels under the generally negative sentiment that has been dominating the tanker market. VLCC freight rates averaged WS36 points in September, down by 17% compared with one month ago. Graph 7.1: Monthly averages of crude oil spot freight rates
Middle East-to-East and Middle East-to-West spot freight rates decreased by 19% and 24%, respectively, to average WS40 and WS23 points. The VLCC market was under the control of charterers in September, mainly due to the limited number of deals fixed in the market. Each inquiry attracted a large number of offers, an obvious sign of tanker oversupply. Occasional gains were seen in the Middle East, however these were short-lived. Markets in the East were quiet, partially due to a holiday, while the Caribbean-to-East tonnage market was firm on several occasions. VLCC freight rates in West Africa dropped as they were influenced by freight rate movements in the Middle East, despite steady tonnage demand seen at the beginning of the month on the West Africa-to-East route. Freight rates for tankers operating on West Africa-to-East routes stood at WS45 points in September, down by 12% from the previous month, though 25% higher than the same month one year ago.
20406080100120140160180
20406080
100120140160180
Sep
13
Oct
13
Nov
13
Dec
13
Jan
14
Feb
14
Mar
14
Apr 1
4
May
14
Jun
14
Jul 1
4
Aug
14
Sep
14
WorldscaleWorldscale
Mediterranean/Northwest Europe (Aframax) West Africa/USGC (Suezmax)Middle East/Far East (VLCC)
64 OPEC Monthly Oil Market Report – October 2014

Tanker Market
Table 7.2: Spot tanker crude freight rates, Worldscale
Suezmax Following the same pattern, the Suezmax sector declined in September on both reported routes. Suezmax spot freight rates on the West Africa-to-East and West Africa-to-US Gulf routes decreased by 12% each compared with the previous month to average WS45 points and WS56 points, respectively. Limited activities and surplus tonnage supply kept freight rates subdued. In West Africa, the tonnage market started the month with a sufficient level of activity, however tonnage availability absorbed tonnage demand, leading to no increase in freight rates in that sector. Suezmax freight rates were also influenced by VLCC freight rates in West Africa. Depressed freight rates in the East discouraged ship owners from getting engaged in long voyages in that region; being positioned in the West is currently found to be a better option in anticipation of winter season demand. Freight rates declined in September despite open arbitrage for fuel oil from the West to the East. Rates for Mediterranean and Black Sea routes were reported to be steady for a time before being affected by increased vessel availability in the area. The situation in the Atlantic has been similar, with vessels piling up as owners prepare for the long-awaited winter season. Aframax Aframax rates were no exception in September, following the pattern of the larger tankers. The Aframax dirty market segment followed the same path as VLCC and Suezmax markets. Average Aframax spot freight rates lost 17% in September compared with the previous month, despite being 6% higher compared with the same month one year earlier. Aframax Indonesia-to-East spot freight rates declined by 15% to average WS94 points. The decline was driven by limited requirements and increased tonnage availability. Caribbean-to-US East Coast (USEC) spot freight rates showed the highest decline among all routes, dropping by 26% compared with one month earlier and 21% compared with one year earlier, reaching their lowest level in several months and leading to very low daily returns. The Aframax market in the North Sea and the Baltics has seen fewer cargoes as a result of maintenance taking place in Primorsk. Mediterranean-to-Mediterranean and Mediterranean-to-Northwest Europe Aframax spot freight rates dropped by 12% and 13%, respectively. The Mediterranean market decline was mainly attributed to low trade in North Africa and the Mediterranean, as
Size Change1,000 DWT Jul 14 Aug 14 Sep 14 Sep 14/Aug 14
CrudeMiddle East/East 230-280 49 49 39 -10Middle East/West 270-285 30 30 23 -8West Africa/East 260 51 51 45 -6West Africa/US Gulf Coast 130-135 85 64 58 -6Northwest Europe/US Gulf Coast 130-135 75 63 56 -7Indonesia/East 80-85 101 111 93 -18Caribbean/US East Coast 80-85 158 113 83 -30Mediterranean/Mediterranean 80-85 104 95 83 -12Mediterranean/Northwest Europe 80-85 96 88 76 -12
Sources: Galbraith’s tanker market report and Platts.
OPEC Monthly Oil Market Report – October 2014 65

Tanker Market
tonnage requirements remained low versus increased vessel availability in the region. Freight rates dropped in the Mediterranean despite delays at Trieste. Clean spot freight rates Clean tanker market sentiment saw a general improvement in September in both Suez directions, and all reported routes showed higher freight rates with an exception of tankers trading on the Middle East-to-East route, which experienced a slight decline of 1% from the month before. On average, East of Suez rates gained 1% and West of Suez rates edged up by 9% compared with last month. The month was active for all clean tanker classes, particularly long-range 1 (LR1) and long-range 2 (LR2) vessels. The LR1 vessel market in the East was reported to have reached its highest level this year so far, while medium-range (MR) vessels operating on the Middle East-to-East route showed a slight decline of 1% from the previous month and MR back haul voyages from the US Gulf Coast (USGC) remained at suitable levels. MR vessels also reported higher rates in the Mediterranean clean spot freight rate market for Mediterranean-to-Mediterranean and Mediterranean-to-Northwest Europe routes, both of which increased by 5% from the month before to average WS123 and WS133 points, respectively. The increase in Mediterranean freight rates was driven by a tight position list and an active market. Freight rates for tankers operating on the Northwest Europe-to-USEC increased by a notable 18% to average WS107 points on the back of active trading. Meanwhile, MR vessel trading on the Singapore-to-East route showed a smaller increase of 4%. Graph 7.2: Monthly average of clean spot freight rates
Table 7.3: Spot tanker product freight rates, Worldscale
60
80
100
120
140
160
180
60
80
100
120
140
160
180
Sep
13
Oct
13
Nov
13
Dec
13
Jan
14
Feb
14
Mar
14
Apr 1
4
May
14
Jun
14
Jul 1
4
Aug
14
Sep
14
WorldscaleWorldscale
Middle East/Far East Northwest Europe/USEC Mediterranean/Mediterranean
Size Change1,000 DWT Jul 14 Aug 14 Sep 14 Sep 14/Aug 14
ProductsMiddle East/East 30-35 105 125 123 -2Singapore/East 30-35 108 111 116 5Northwest Europe/US East Coast 33-37 88 91 109 18Mediterranean/Mediterranean 30-35 120 117 124 7Mediterranean/Northwest Europe 30-35 130 127 134 7
Sources: Galbraith’s tanker market report and Platts.
66 OPEC Monthly Oil Market Report – October 2014

Oil Trade
Oil Trade Preliminary data for September shows that US crude oil imports declined from a month earlier to average 7.46 mb/d as the driving season comes to an end. This is a drop from a year ago of 462 tb/d or 6%. US product monthly imports dropped significantly from the previous month by 336 tb/d to average 1.5 mb/d, while annually a larger drop of 613 tb/d or 29% was seen. Japan’s crude oil imports increased in August after declining for six consecutive months, rising by 254 tb/d or 8% to average 3.4 mb/d, though a y-o-y comparison of the country’s crude imports shows less volume than the previous year by 90 tb/d or 3%. Japan’s product imports dropped in August by 44 tb/d to average 587 tb/d, reflecting a loss of 7% m-o-m and a drop of 17% from the previous year. China’s crude oil imports increased in August following three consecutive months of decline, up by 338 tb/d or 6% in August to average 5.9 mb/d, while product imports increased by 78 tb/d from one month earlier, though still remaining below the previous year’s level by 148 tb/d. China’s product imports averaged 875 tb/d in August. India’s crude imports increased in August by 348 tb/d or 10% from the previous month to average 3.7 mb/d, though reflecting an annual drop of 416 tb/d or 10%. While the country’s product imports in August dropped by 71 tb/d from the previous month to average 441 tb/d, the y-o-y increase amounted to 40 tb/d. US Preliminary data for September shows that US crude oil imports dropped to average 7.46 mb/d, down by 189 tb/d from the previous month and also falling from the previous year by 462 tb/d or 6%. Year-to-date, US crude imports in September were 390 tb/d lower. US monthly product imports dropped significantly from the previous month by 336 tb/d to average 1.5 mb/d, while an annual comparison showed a larger drop of 613 tb/d or 29%. Year-to-date, product imports declined by 14%. US imports in September were affected by the end of the driving season. Graph 8.1: US imports of crude and petroleum products
Meanwhile, US product exports for September were 32 tb/d lower than seen one month ago, averaging 3.4 mb/d. Product exports were also down from one year ago by 131 tb/d or 4%.
4.55.05.56.06.57.07.58.08.5
0.0
0.5
1.0
1.5
2.0
2.5
Sep
13
Oct
13
Nov
13
Dec
13
Jan
14
Feb
14
Mar
14
Apr 1
4
May
14
Jun
14
Jul 1
4
Aug
14
Sep
14
mb/dmb/d
Others* Propane/propylene GasolineJet fuel/kerosene Fuel oil Crude (RHS)
*Others: Contains natural gas liquids, liquefied refinery gases (LRG's), other liquids and all finished petroleum productsexcept gasoline, jet fuel/kerosene, fuel oil and propane/propylene.
OPEC Monthly Oil Market Report – October 2014 67

Oil Trade
As a result, US total net imports dropped in September to average 5.2 mb/d, while falling tremendously from the previous year by 1.2 mb/d or 20%. Graph 8.2: US exports of crude and petroleum products
The top first and second suppliers to the US in July maintained the same order as seen the previous month. Canada remained the premier crude supplier to the US, accounting for 37% of total US crude imports, up by 50 tb/d from the previous month. Saudi Arabia maintained its position as second-largest supplier to the US, accounting for 16% of total imports; its volume gain increased by 214 tb/d. Venezuela came in as third top supplier, accounting for 16% of total US crude imports, an increase of 151 tb/d or 11% from a month ago. Crude imports from OPEC Member Countries increased in July from June by 336 tb/d or 11%, accounting for 44% of total US crude imports. Additionally, US product imports from OPEC Member Countries were higher by 27 tb/d or 13% from the previous month and a slight 5 tb/d or 2% from one year ago. Canada and Russia maintained their positions as first and second product suppliers to the US, accounting for 26% and 17% of products, respectively. In July, Canada exported slightly less products to the US compared with the previous month at 128 tb/d, flat from year-ago imports. Russian volumes were up by 77 tb/d from one month ago. India came in as the third-largest supplier to the US, increasing its exports by 34 tb/d. Table 8.1: US crude and product net imports, tb/d
US crude imports by region for July saw North America in the top position, averaging 2.8 mb/d. This was followed by Latin America, which stood at 2.2 mb/d, while the Middle East came in as third-greatest regional supplier with an average of 2.1 mb/d. Imports from Africa were down from the previous month by 33 tb/d to stand at 289 tb/d, while imports from Asia increased by 19 tb/d to average 42 tb/d.
050100150200250300350400450
0
1,000
2,000
3,000
4,000
5,000S
ep 1
3
Oct
13
Nov
13
Dec
13
Jan
14
Feb
14
Mar
14
Apr
14
May
14
Jun
14
Jul 1
4
Aug
14
Sep
14
tb/dtb/d
Others* Propane/propylene GasolineJet fuel/kerosene Fuel oil Crude (RHS)
*Others: Contains natural gas liquids, liquefied refinery gases (LRG's), other liquids and all finished petroleum productsexcept gasoline, jet fuel/kerosene, fuel oil and propane/propylene.
ChangeJul 14 Aug 14 Sep 14 Sep 14/Aug 14
Crude oil 7,222 7,313 7,086 -227Total products -2,229 -1,731 -1,863 -132Total crude and products 4,993 5,582 5,223 -359
68 OPEC Monthly Oil Market Report – October 2014

Oil Trade
Looking at crude imports by PADD region, in PADD 1 the highest crude imports to the East Coast were sourced from North America and averaged 270 tb/d. Imports from Africa declined by 100 tb/d or 38% to average 161 tb/d. Crude imports from Latin America to PADD 1 dropped by 14 tb/d to average 50 tb/d. Meanwhile, imports by PADD 2 were largely covered by North America, averaging 1.9 mb/d, a drop of 45 tb/d from the previous month. PADD 2 imported only 27 tb/d from the Middle East in July, while PADD 3 received higher imports from top supplying regions Latin America and the Middle East, up from a month earlier by 182 tb/d and 217 tb/d to average 1.8 mb/d and 1.5 mb/d, respectively. PADD 4 still imports its total requirement from North America and averaged 222 tb/d in July, a volume increase of 27 tb/d from the previous month. In PADD 5, the number one source of imports was the Middle East at 515 tb/d, despite a drop from a month earlier by 25 tb/d. Latin America and North America came in as the second and third biggest suppliers to PADD 5, exporting 289 tb/d and 198 tb/d, respectively in July, up by 50 tb/d and 15 tb/d from the previous month. Japan Japanese crude oil imports increased in August following a six-month fall, rising by 254 tb/d or 8% to average 3.4 mb/d. In a y-o-y comparison, crude imports were down from the previous year by 90 tb/d or 3%. As seen in the previous month, Saudi Arabia, the UAE and Qatar were the top crude suppliers to the country in August, with Saudi Arabia again in first position with a share of 29%, down by 68 tb/d from one month earlier. The UAE was second-largest supplier, with a share of 27% of total crude imports, while Qatar came third in August with a share of 13%. Volumes imported from the UAE and Qatar were up over the previous month by 93 tb/d and 75 tb/d, respectively. Contrarily, product imports dropped in August by 44 tb/d to average 587 tb/d, reflecting a loss of 7% m-o-m and a drop of 17% from the previous year. Japan's product sales fell 9.7% in August from a year ago. Graph 8.3: Japan’s imports of crude and petroleum products
Japan’s exports in August saw a marginal drop of 4 tb/d to average 470 tb/d. In a y-o-y comparison, the figure dropped 115 tb/d or 20%.
0
1
2
3
4
5
0
200
400
600
800
1,000
1,200
Aug
13
Sep
13
Oct
13
Nov
13
Dec
13
Jan
14
Feb
14
Mar
14
Apr 1
4
May
14
Jun
14
Jul 1
4
Aug
14
mb/dtb/d
Others* LPG Naphtha Fuel oil Crude oil
*Others: Contains gasoline, jet fuel, kerosene, gasoil, asphalt and paraffin wax.
OPEC Monthly Oil Market Report – October 2014 69

Oil Trade
Graph 8.4: Japan’s exports of petroleum products
Accordingly, Japanese net imports increased in August by 214 tb/d to average 3.5 mb/d, their highest level since April 2014, reflecting a monthly gain of 7% and an annual loss of 2%. Table 8.2: Japan’s crude and product net imports, tb/d
China China’s crude imports increased in August following three consecutive months of decline, rising 338 tb/d or 6% to average 5.9 mb/d. In an annual comparison, Chinese crude imports were higher than in the previous year by 887 tb/d or 17%. Year-to-date, the figures reflect an increase of 451 tb/d or 8%. At the same time, China reported higher crude stocks and more refinery runs. Saudi Arabia, Angola and Oman were the country’s top suppliers in August, accounting for 15%, 13% and 11%, respectively. Crude imports from Saudi Arabia were up from the previous month by 49 tb/d or 5%, while imports from Angola and Oman increased by 95 tb/d and 218 tb/d, respectively. Crude volumes imported from Russia were in fourth place in August, increasing by 99 tb/d. Chinese product imports rose by 78 tb/d from one month ago, though remaining below year-ago levels by 148 tb/d. Chinese product imports averaged 875 tb/d in August.
0
100
200
300
400
500
600
0
100
200
300
400
500
600
Aug
13
Sep
13
Oct
13
Nov
13
Dec
13
Jan
14
Feb
14
Mar
14
Apr
14
May
14
Jun
14
Jul 1
4
Aug
14
tb/dtb/d
Fuel oil Gasoil Jet fuel Others*
*Others: Contains LPG, gasoline, naphtha, kerosene, lubricating oil, asphalt and paraffin wax.
ChangeJun 14 Jul 14 Aug 14 Aug 14/Jul 14
Crude oil 3,011 3,097 3,352 254Total products 103 156 116 -40Total crude and products 3,114 3,254 3,468 214
70 OPEC Monthly Oil Market Report – October 2014
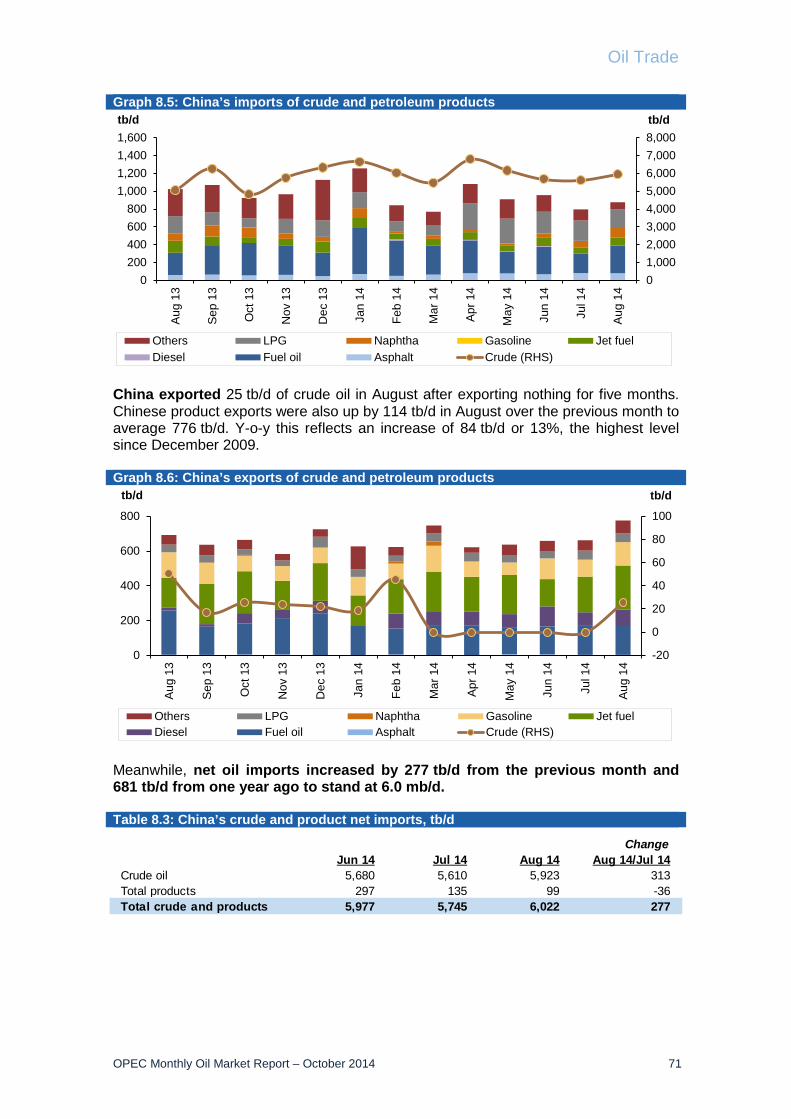
Oil Trade
Graph 8.5: China’s imports of crude and petroleum products
China exported 25 tb/d of crude oil in August after exporting nothing for five months. Chinese product exports were also up by 114 tb/d in August over the previous month to average 776 tb/d. Y-o-y this reflects an increase of 84 tb/d or 13%, the highest level since December 2009. Graph 8.6: China’s exports of crude and petroleum products
Meanwhile, net oil imports increased by 277 tb/d from the previous month and 681 tb/d from one year ago to stand at 6.0 mb/d. Table 8.3: China’s crude and product net imports, tb/d
01,0002,0003,0004,0005,0006,0007,0008,000
0200400600800
1,0001,2001,4001,600
Aug
13
Sep
13
Oct
13
Nov
13
Dec
13
Jan
14
Feb
14
Mar
14
Apr
14
May
14
Jun
14
Jul 1
4
Aug
14
tb/dtb/d
Others LPG Naphtha Gasoline Jet fuelDiesel Fuel oil Asphalt Crude (RHS)
-20
0
20
40
60
80
100
0
200
400
600
800
Aug
13
Sep
13
Oct
13
Nov
13
Dec
13
Jan
14
Feb
14
Mar
14
Apr
14
May
14
Jun
14
Jul 1
4
Aug
14
tb/dtb/d
Others LPG Naphtha Gasoline Jet fuelDiesel Fuel oil Asphalt Crude (RHS)
ChangeJun 14 Jul 14 Aug 14 Aug 14/Jul 14
Crude oil 5,680 5,610 5,923 313Total products 297 135 99 -36Total crude and products 5,977 5,745 6,022 277
OPEC Monthly Oil Market Report – October 2014 71

Oil Trade
India Indian crude imports increased in August by 348 tb/d or 10% over the previous month to average 3.7 mb/d, though still reflecting an annual drop of 416 tb/d or 10%. While product imports in August dropped by 71 tb/d from the previous month to average 441 tb/d, they increased y-o-y by 40 tb/d. Monthly imports of LPG and naphtha were lower, while imports of fuel oil remained at the same level as the previous month. At the same time, India’s domestic product sales rose by only 0.9%, the lowest increase in five months. Sufficient monsoon rains and an improved power supply reduced the need for products in the country. Graph 8.7: India’s imports of crude and petroleum products
India’s product exports, however, were up in August by 134 tb/d or 11% to average 1.3 mb/d. In a y-o-y comparison, product exports were lower than a year earlier by 249 tb/d or 15%. India’s monthly product exports were higher in all areas except kerosene, which remained stable from the previous month. Graph 8.8: India’s exports of petroleum products
Consequentially, India’s net imports increased by 143 tb/d to average 2.8 mb/d, reflecting an increase of 5% m-o-m, but a drop of 4% y-o-y.
0
1,000
2,000
3,000
4,000
5,000
0
100
200
300
400
500
600
Aug
13
Sep
13
Oct
13
Nov
13
Dec
13
Jan
14
Feb
14
Mar
14
Apr
14
May
14
Jun
14
Jul 1
4
Aug
14
tb/dtb/d
Others LPG Naphtha GasolineKerosene Gasoil Fuel oil Crude (RHS)
0
500
1,000
1,500
2,000
0
500
1,000
1,500
2,000
Aug
13
Sep
13
Oct
13
Nov
13
Dec
13
Jan
14
Feb
14
Mar
14
Apr
14
May
14
Jun
14
Jul 1
4
Aug
14
tb/dtb/d
Fuel oil Gasoil Jet fuel Gasoline Naphtha Others
72 OPEC Monthly Oil Market Report – October 2014

Oil Trade
Table 8.4: India’s crude and product net imports, tb/d
FSU In August, total crude oil exports from the former Soviet Union dropped by 234 tb/d or 4% to average 5.8 mb/d. Crude exports through the Russian pipeline declined as well, by 58 tb/d or 1.6%, to average 3.6 mb/d. Total shipments from the Black Sea dropped by 88 tb/d or 15% to average 496 tb/d, due to lower shipments from Novorossiysk. While total Baltic Sea exports dropped by a slight 5 tb/d in August, shipments from the Primorsk port terminal dropped by 49 tb/d. This drop was, however, counterbalanced by a 45 tb/d increase from the Ust-Luga terminal. Total Druzhba pipeline shipments increased by 24 tb/d to average 1 mb/d, while Kozmino shipments rose by 24 tb/d or 4% to average 528 tb/d. Exports through the Lukoil system declined from the previous month, while in the Barents Sea the Varandey offshore platform reported a drop of 17 tb/d to average 118 tb/d in August. In the Baltic Sea, the Kalinigrad port terminal exported an additional 15 tb/d to average 24 tb/d in August. Russian Far East total exports were up by 26 tb/d or 13% from the previous month primarily because exports from Aniva Bay port terminal were up. Total Central Asian exports declined by 82 tb/d to average 207 tb/d with a drop of 35 tb/d through Novorossiysk port terminal, while supplies through Kulevi, Supsa and Batumi port terminals remained flat from the previous month. In the Mediterranean Sea, BTC supplies dropped from one month ago by 69 tb/d or 9% to average 675 tb/d. However, FSU total product exports increased by a slight 14 tb/d or 0.4% from the previous month to average 3.4 mb/d. This overall gain in product exports comes as a result of several losses and gains in various products; fuel oil and naphtha exports increased, while exports of gasoil, VGO, and gasoline declined.
ChangeJun 14 Jul 14 Aug 14 Aug 14/Jul 14
Crude oil 3,956 3,385 3,734 348Total products -896 -693 -899 -206Total crude and products 3,059 2,692 2,835 143
Note: India data tab le does not include information for crude import and product export by Reliance Industries.
OPEC Monthly Oil Market Report – October 2014 73
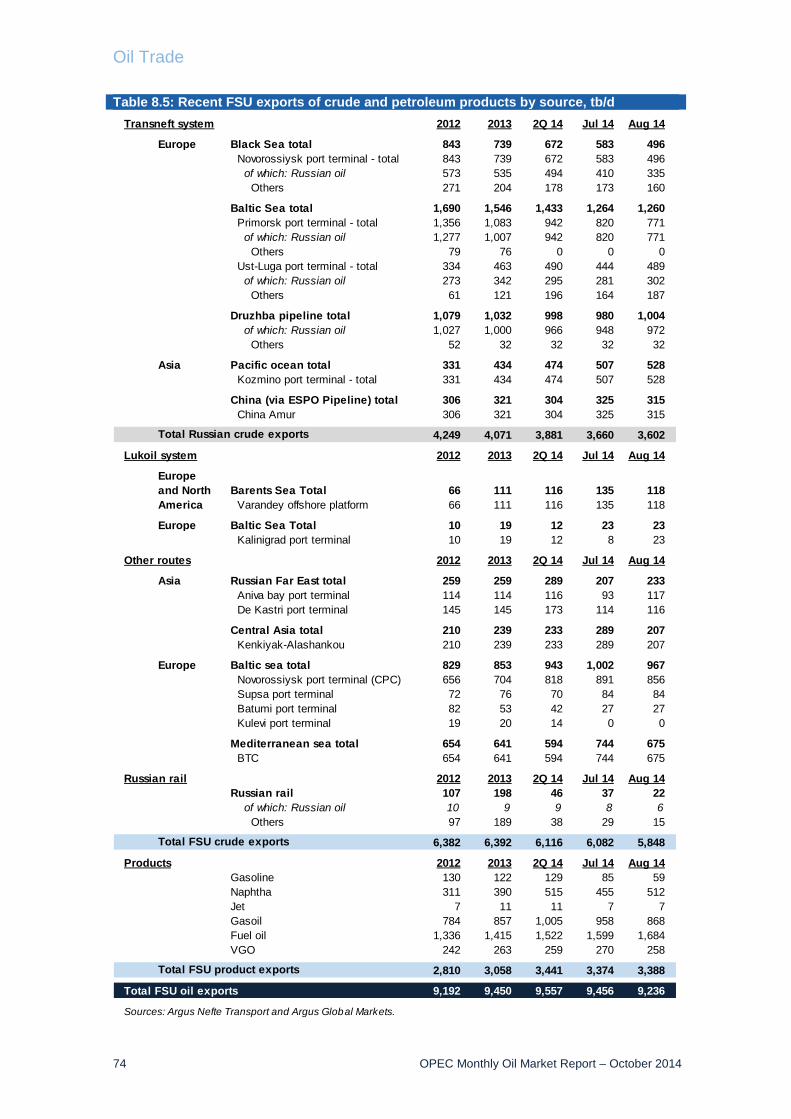
Oil Trade
Table 8.5: Recent FSU exports of crude and petroleum products by source, tb/d
Transneft system 2012 2013 2Q 14 Jul 14 Aug 14
Europe Black Sea total 843 739 672 583 496 Novorossiysk port terminal - total 843 739 672 583 496 of which: Russian oil 573 535 494 410 335 Others 271 204 178 173 160
Baltic Sea total 1,690 1,546 1,433 1,264 1,260 Primorsk port terminal - total 1,356 1,083 942 820 771 of which: Russian oil 1,277 1,007 942 820 771 Others 79 76 0 0 0 Ust-Luga port terminal - total 334 463 490 444 489 of which: Russian oil 273 342 295 281 302 Others 61 121 196 164 187
Druzhba pipeline total 1,079 1,032 998 980 1,004 of which: Russian oil 1,027 1,000 966 948 972 Others 52 32 32 32 32
Asia Pacific ocean total 331 434 474 507 528 Kozmino port terminal - total 331 434 474 507 528
China (via ESPO Pipeline) total 306 321 304 325 315 China Amur 306 321 304 325 315
4,249 4,071 3,881 3,660 3,602
Lukoil system 2012 2013 2Q 14 Jul 14 Aug 14
Barents Sea Total 66 111 116 135 118 Varandey offshore platform 66 111 116 135 118
Europe Baltic Sea Total 10 19 12 23 23 Kalinigrad port terminal 10 19 12 8 23
Other routes 2012 2013 2Q 14 Jul 14 Aug 14
Asia Russian Far East total 259 259 289 207 233 Aniva bay port terminal 114 114 116 93 117 De Kastri port terminal 145 145 173 114 116
Central Asia total 210 239 233 289 207 Kenkiyak-Alashankou 210 239 233 289 207
Europe Baltic sea total 829 853 943 1,002 967 Novorossiysk port terminal (CPC) 656 704 818 891 856 Supsa port terminal 72 76 70 84 84 Batumi port terminal 82 53 42 27 27 Kulevi port terminal 19 20 14 0 0
Mediterranean sea total 654 641 594 744 675 BTC 654 641 594 744 675
Russian rail 2012 2013 2Q 14 Jul 14 Aug 14Russian rail 107 198 46 37 22 of which: Russian oil 10 9 9 8 6 Others 97 189 38 29 15
6,382 6,392 6,116 6,082 5,848
Products 2012 2013 2Q 14 Jul 14 Aug 14Gasoline 130 122 129 85 59Naphtha 311 390 515 455 512Jet 7 11 11 7 7Gasoil 784 857 1,005 958 868Fuel oil 1,336 1,415 1,522 1,599 1,684VGO 242 263 259 270 258
2,810 3,058 3,441 3,374 3,388
Total FSU oil exports 9,192 9,450 9,557 9,456 9,236
Sources: Argus Nefte Transport and Argus Global Markets.
Total Russian crude exports
Europe and North America
Total FSU crude exports
Total FSU product exports
74 OPEC Monthly Oil Market Report – October 2014
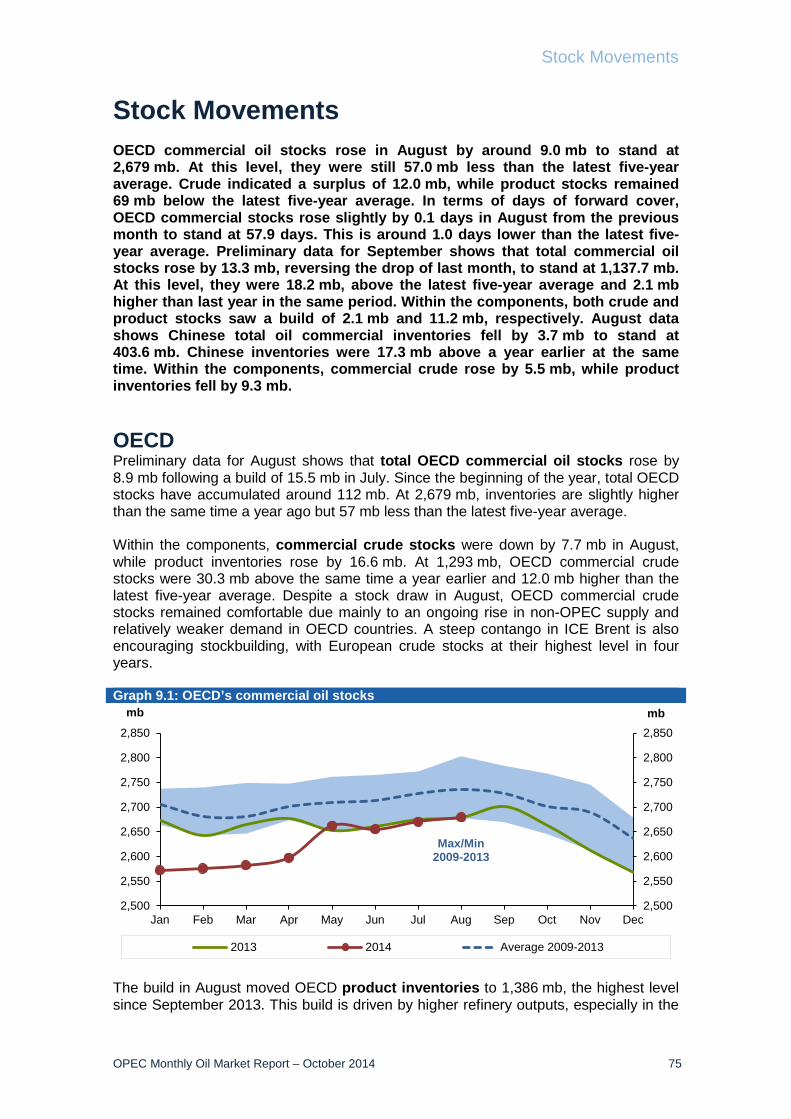
Stock Movements
Stock Movements OECD commercial oil stocks rose in August by around 9.0 mb to stand at 2,679 mb. At this level, they were still 57.0 mb less than the latest five-year average. Crude indicated a surplus of 12.0 mb, while product stocks remained 69 mb below the latest five-year average. In terms of days of forward cover, OECD commercial stocks rose slightly by 0.1 days in August from the previous month to stand at 57.9 days. This is around 1.0 days lower than the latest five-year average. Preliminary data for September shows that total commercial oil stocks rose by 13.3 mb, reversing the drop of last month, to stand at 1,137.7 mb. At this level, they were 18.2 mb, above the latest five-year average and 2.1 mb higher than last year in the same period. Within the components, both crude and product stocks saw a build of 2.1 mb and 11.2 mb, respectively. August data shows Chinese total oil commercial inventories fell by 3.7 mb to stand at 403.6 mb. Chinese inventories were 17.3 mb above a year earlier at the same time. Within the components, commercial crude rose by 5.5 mb, while product inventories fell by 9.3 mb. OECD Preliminary data for August shows that total OECD commercial oil stocks rose by 8.9 mb following a build of 15.5 mb in July. Since the beginning of the year, total OECD stocks have accumulated around 112 mb. At 2,679 mb, inventories are slightly higher than the same time a year ago but 57 mb less than the latest five-year average. Within the components, commercial crude stocks were down by 7.7 mb in August, while product inventories rose by 16.6 mb. At 1,293 mb, OECD commercial crude stocks were 30.3 mb above the same time a year earlier and 12.0 mb higher than the latest five-year average. Despite a stock draw in August, OECD commercial crude stocks remained comfortable due mainly to an ongoing rise in non-OPEC supply and relatively weaker demand in OECD countries. A steep contango in ICE Brent is also encouraging stockbuilding, with European crude stocks at their highest level in four years. Graph 9.1: OECD’s commercial oil stocks
The build in August moved OECD product inventories to 1,386 mb, the highest level since September 2013. This build is driven by higher refinery outputs, especially in the
2,500
2,550
2,600
2,650
2,700
2,750
2,800
2,850
2,500
2,550
2,600
2,650
2,700
2,750
2,800
2,850
Jan Feb Mar Apr May Jun Jul Aug Sep Oct Nov Dec
mbmb
2013 2014 Average 2009-2013
Max/Min2009-2013
OPEC Monthly Oil Market Report – October 2014 75
Stock Movements
US. Despite this build, OECD product stocks showed a deficit of 69.0 mb compared with the seasonal norm and were 29.4 mb below the same time a year ago. Middle distillates accounted for the total of the deficit with the five-year average. In terms of days of forward cover, OECD commercial stocks rose slightly by 0.1 days in August from the previous month to stand at 57.9 days. This is around 1.0 day lower than the latest five-year average, although indicating a surplus of 0.2 days over the same month a year earlier. OECD Americas’ forward cover was 1.0 day less than the historical average at 56.4 days in August, and OECD Asia Pacific stood at 1.4 days below the seasonal average to finish the month at 49.5 days. At the same time, OECD Europe indicated a deficit of 0.3 days, averaging 65.4 days in August. In August, commercial stocks in OECD Americas fell by 2.3 mb, following a build over the last six months, to end the month at 1,379 mb. At this level, inventories were around 6.0 mb above the seasonal norm and stood 14.7 mb below the same time a year ago. Within the components, product stocks saw a build of 6.8 mb, while crude experienced a drop of 9.1 mb. At the end of August, commercial crude oil stocks in OECD Americas fell, ending the month at 670 mb, which is 11.8 mb above the latest five-year average. However, they remained 7.8 mb lower than the same time a year ago. The drop in commercial crude stocks came mainly from an increase in US crude runs, which have been well above 16 mb/d for more than two months. In contrast, OECD Americas’ product stocks rose by 6.8 mb in August for the fifth consecutive month to stand at 709 mb. Despite this build, they remained 5.8 mb below the seasonal norm and 6.9 mb less than the same time a year ago. The build in product stocks came mainly from high US refinery output, while relatively higher exports limited a further build. OECD Europe’s commercial stocks rose by 5.4 mb in August following a build of 14.6 mb the previous month. At 902 mb, OECD Europe’s commercial stocks stood at 49.6 mb below the seasonal norm, but 23.3 mb above a year ago at the same time. Within the components, crude and product stocks rose by 3.1 mb and 2.3 mb, respectively. OECD Europe’s commercial crude stocks stood at 397 mb in August, 5.5 mb above the five-year average, indicating a surplus of 37.0 mb over the same period a year ago. European crude stocks have been accumulating more than 22 mb since May, driven by high supply from the Atlantic Basin as well as rising Libyan exports. The contango structure of ICE Brent has also encouraged a crude stock build in OECD Europe. OECD Europe’s commercial product stocks also rose, ending the month of August at 504 mb, but still showing a deficit of 55.2 mb below the seasonal norm and 13.7 mb lower than the same time a year ago. Ongoing weaker demand in Europe along with higher refinery output was behind the build in OECD Europe product stocks. OECD Asia Pacific commercial stocks rose by 5.8 mb in August, ending the month at 398 mb, 7.6 mb below the same period a year ago and 13.4 mb lower than the latest five-year average. Within the components, commercial crude stocks fell by 1.7 mb, while product stocks rose by 7.5 mb. Crude inventories ended the month of August at 225 mb and stood 1.1 mb above a year ago, but 5.3 mb less than the seasonal norm. OECD Asia Pacific’s total product inventories ended August at 173 mb, indicating a deficit of 8.7 mb compared with a year ago and 8.0 mb below the seasonal norm.
76 OPEC Monthly Oil Market Report – October 2014

Stock Movements
Table 9.1: OECD’s commercial stocks, mb
EU plus Norway Preliminary data for August shows that European stocks rose by 5.5 mb, following a build of 14.6 mb during the previous month to stand at 1,074.1 mb, the highest level since October 2013. This is 7.2 mb or 0.7% higher than the same time a year ago, though still 29.1 mb or 2.6% below the latest five-year average. The total stock build came from both crude and products, which increased by 3.1 mb and 2.3 mb, respectively. European crude inventories rose to a four-year high in August, reaching 480.0 mb. With this stock build, crude inventories stood at 10.0 mb or 2.2% above the same period a year earlier and were 12.1 mb or 2.6% above the latest five-year average. The build came mainly from continued increasing crude supplies in the Atlantic Basin as well as rising exports from Libya. ICE Brent’s contango structure also helped refiners build stocks. A greater build was limited by higher crude runs, which rose by 370,000 b/d from the previous month to stand at 10.2 mb/d. At this level, crude throughputs were nearly 100,000 b/d lower than the same period one year earlier. In August, refiners’ utilization rates were around 82.0%, 2.3 percentage points (pp) higher than the previous month. Graph 9.2: EU-15 plus Norway’s total oil stocks
OECD Europe’s product stocks also rose by 2.3 mb in August, following a build of 7.6 mb from the previous month to stand at 594.1 mb. Despite this build, European stocks were still 3.0 mb or 0.5% below a year ago at the same time and 41.2 mb or 6.5% below the seasonal norm. Within products, the picture was mixed; gasoline and distillate stocks experienced builds, while residual fuel oil and naphtha saw a draw. Gasoline stocks rose by 1.4 mb, ending August at 108.6 mb. At this level, gasoline stocks showed a slight surplus of 0.2% above a year ago, though they are in line with
1,040
1,060
1,080
1,100
1,120
1,140
1,160
1,180
1,040
1,060
1,080
1,100
1,120
1,140
1,160
1,180
Jan Feb Mar Apr May Jun Jul Aug Sep Oct Nov Dec
mbmb
2013 2014 Average 2009-2013
Max/Min2009-2013
ChangeJun 14 Jul 14 Aug 14 Aug 14/Jul 14 Aug 13
Crude oil 1,319 1,301 1,293 -7.7 1,263Products 1,336 1,370 1,386 16.6 1,416Total 2,655 2,670 2,679 8.9 2,678
Days of forward cover 57.6 57.8 57.9 0.1 57.7
OPEC Monthly Oil Market Report – October 2014 77
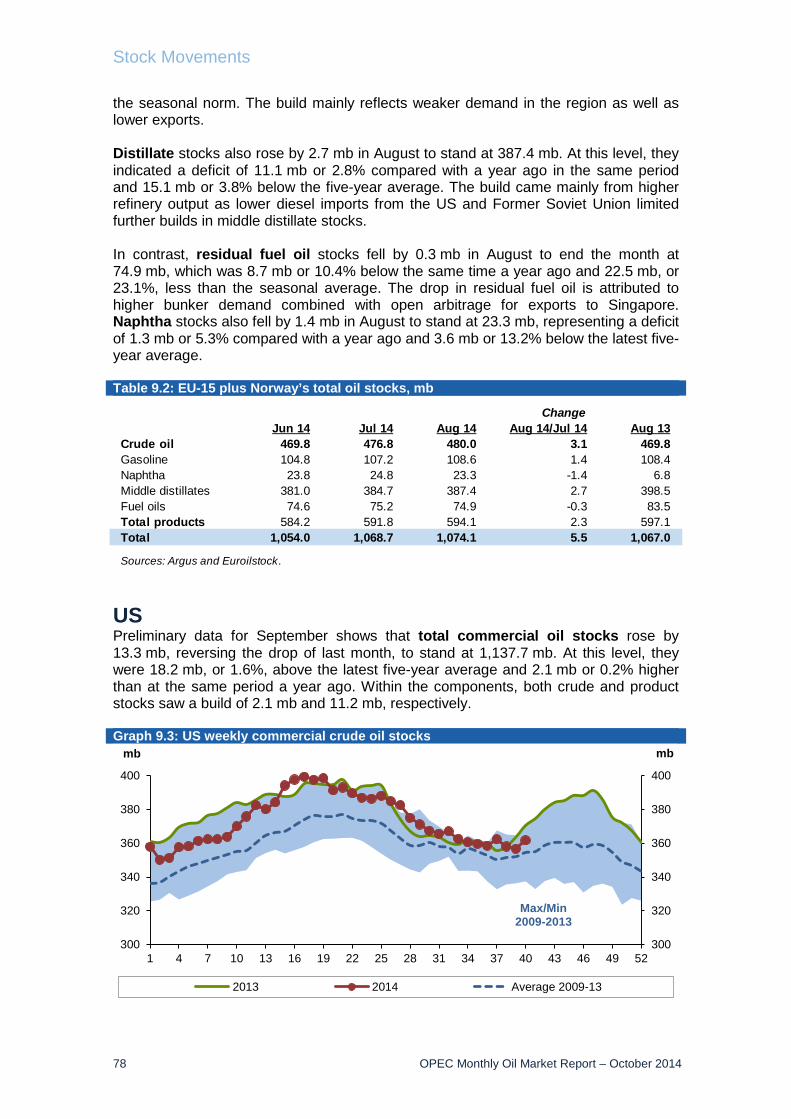
Stock Movements
the seasonal norm. The build mainly reflects weaker demand in the region as well as lower exports. Distillate stocks also rose by 2.7 mb in August to stand at 387.4 mb. At this level, they indicated a deficit of 11.1 mb or 2.8% compared with a year ago in the same period and 15.1 mb or 3.8% below the five-year average. The build came mainly from higher refinery output as lower diesel imports from the US and Former Soviet Union limited further builds in middle distillate stocks. In contrast, residual fuel oil stocks fell by 0.3 mb in August to end the month at 74.9 mb, which was 8.7 mb or 10.4% below the same time a year ago and 22.5 mb, or 23.1%, less than the seasonal average. The drop in residual fuel oil is attributed to higher bunker demand combined with open arbitrage for exports to Singapore. Naphtha stocks also fell by 1.4 mb in August to stand at 23.3 mb, representing a deficit of 1.3 mb or 5.3% compared with a year ago and 3.6 mb or 13.2% below the latest five-year average. Table 9.2: EU-15 plus Norway’s total oil stocks, mb
US Preliminary data for September shows that total commercial oil stocks rose by 13.3 mb, reversing the drop of last month, to stand at 1,137.7 mb. At this level, they were 18.2 mb, or 1.6%, above the latest five-year average and 2.1 mb or 0.2% higher than at the same period a year ago. Within the components, both crude and product stocks saw a build of 2.1 mb and 11.2 mb, respectively. Graph 9.3: US weekly commercial crude oil stocks
300
320
340
360
380
400
300
320
340
360
380
400
1 4 7 10 13 16 19 22 25 28 31 34 37 40 43 46 49 52
mbmb
2013 2014 Average 2009-13
Max/Min2009-2013
ChangeJun 14 Jul 14 Aug 14 Aug 14/Jul 14 Aug 13
Crude oil 469.8 476.8 480.0 3.1 469.8Gasoline 104.8 107.2 108.6 1.4 108.4Naphtha 23.8 24.8 23.3 -1.4 6.8Middle distillates 381.0 384.7 387.4 2.7 398.5Fuel oils 74.6 75.2 74.9 -0.3 83.5Total products 584.2 591.8 594.1 2.3 597.1Total 1,054.0 1,068.7 1,074.1 5.5 1,067.0
Sources: Argus and Euroilstock.
78 OPEC Monthly Oil Market Report – October 2014

Stock Movements
US commercial crude stocks rose in September reversing the build of the last three months to stand at 361.7 mb. Despite this stock build, crude oil commercial stocks finished the month of September at 9.5 mb or 2.6% below the same time last year, but remained 8.2 mb or 2.3% above the latest five-year average. The build in crude stocks was mainly driven by lower US crude oil refinery input, averaging around 16.1 mb/d, nearly 500,000 tb/d less than last month. Refineries operated at around 90.6% of operable capacity in September, 1.4 pp lower than the previous month. A further build in US commercial crude stocks was limited by lower crude imports. Indeed, US crude imports fell by around 150,000 b/d to stand at 7.5 mb/d. In contrast to the build in national inventories, stocks at Cushing, Oklahoma, fell by 1.4 mb in September to 18.9 mb, the lowest since end of July. At this level, Cushing inventories lost nearly 14.0 mb from a year ago at the same time. Total product stocks continued to rise for the sixth consecutive month, indicating a build of 11.2 mb to end September at 764.8 mb, and accumulating more than 90.0 mb since last April. At this level, US product stocks were 11.6 mb or 1.5% above the levels seen at the same time a year ago and showed a surplus of 10.0 mb or 1.3% above the seasonal norm. Within products, the picture was mixed. Gasoline stocks fell slightly by 0.3 mb in September following a drop of 7.0 mb in August. At 209.7 mb, gasoline stocks were 9.6 mb or 4.4% lower than the same period a year ago and 4.2 mb or 2.0% less than the latest five-year average. The decline came mainly from lower gasoline output, which declined by about 400,000 b/d to stand at 9.1 mb/d, while relatively lower implied demand, which held below 9.0 mb/d, limited a further stock draw in gasoline. In contrast, distillate stocks rose by 2.7 mb in September, reversing the fall of last month, to stand at 126.1 mb, which was still 23.0 mb or 15.8% below the five-year average and 2.5 mb or 1.9% less than the same period a year ago. The build in middle distillate stocks reflected lower apparent demand, which declined by about 100,000 b/d to stand at 3.8 mb/d. However, lower output, which declined by nearly 150,000 b/d to average 4.8 mb/d limited a further build in distillate stocks. Graph 9.4: US weekly distillate stocks
Residual fuel oil stocks also fell by 0.7 mb to end September at 35.8 mb, which is 0.1 mb or 0.1% higher than last year in the same period, while they remained 0.3 mb or 9.2% less than the seasonal norm. Jet fuel stocks rose strongly by 6.1 mb ending September at 40.7 mb, which is 0.4 mb or 1.0% less than the same month a year ago
100
110
120
130
140
150
160
170
180
100
110
120
130
140
150
160
170
180
1 4 7 10 13 16 19 22 25 28 31 34 37 40 43 46 49 52
mbmb
2013 2014 Average 2009-13
Max/Min2009-2013
OPEC Monthly Oil Market Report – October 2014 79

Stock Movements
and 4.1 mb or 9.2% below the latest five-year average. The build in jet fuel was driven by combination of higher output as well as reduced apparent demand. Table 9.3: US onland commercial petroleum stocks, mb
Japan In Japan, total commercial oil stocks rose by 5.8 mb to stand at 168.4 mb, the highest level since June 2013. At this level, Japanese oil inventories are 7.7 mb or 4.8% higher than a year ago, but remained 4.1 mb or 2.4% lower than the five-year average. Within components, product stocks rose by 7.5 mb, while crude stocks fell by 1.7 mb/d. Japanese commercial crude oil stocks declined in August to stand at 98.1 mb. Despite this drop, they were 13.3 mb or 15.7% above year-ago levels at the same time, and 2.3 mb or 2.4% below the seasonal norm. The stock draw in crude oil was driven by higher crude runs, which rose by around 188 tb/d, or 6.0%, to average 3.3 mb/d, though still nearly 7.7% lower than the previous year at the same time. High crude oil imports limited a further drop in crude oil stocks. Indeed, crude oil imports rose by around 254,000 b/d or 8.2% to average 3.4 mb/d but were down 2.6% over the same period a year ago. Direct crude burning in power plants fell by nearly 27% in August compared with the previous month, averaging 97 tb/d and showing a decline of 58% over the same period a year ago. Graph 9.5: Japan’s commercial oil stocks
In contrast, Japan’s total product inventories rose by 7.5 mb in August for the second consecutive month. At 70.3 mb, product stocks still showed a deficit of 5.6 mb or 7.4% compared with the same time a year ago and remained below the five-year average
140
150
160
170
180
190
140
150
160
170
180
190
Jan Feb Mar Apr May Jun Jul Aug Sep Oct Nov Dec
mbmb
2013 2014 Average 2009-2013
Max/Min2009-2013
ChangeJul 14 Aug 14 Sep 14 Sep 14/Aug 14 Sep 13
Crude oil 368.7 359.6 361.7 2.1 373.0Gasoline 217.0 210.0 209.7 -0.3 219.8Distillate fuel 125.6 123.4 126.1 2.7 129.3Residual fuel oil 35.7 36.5 35.8 -0.7 35.6Jet fuel 35.5 34.6 40.7 6.1 41.1Total 1,126.7 1,124.4 1,137.7 13.3 1,137.4SPR 691.0 691.0 691.0 0.0 696.0
Source: US Department of Energy’s Energy Information Administration.
80 OPEC Monthly Oil Market Report – October 2014

Stock Movements
with a deficit of 6.4 mb or 8.4%. The build was driven by high refinery output, which increased by almost 185,000 b/d to average 3.0 mb/d in August, but still remained 9.3% below one year earlier during the same period. Higher product sales, which increased by 2.1% in August, limited a further build in product stocks. However, Japan’s total oil product sales in August fell 9.7% from a year earlier, reaching their lowest monthly rate since 1986. With the exception of gasoline, all products witnessed a stock build. Distillate stocks rose by 6.5 mb in August for the second month to stand at 32.8 mb. At this level, distillate stocks were still 3.2 mb or 8.9% below the same period a year ago and 2.9 mb or 8.2% lower than the seasonal average. All distillate components experienced a build in August. Jet fuel inventories rose by 10.4% on the back of lower domestic sales, which decreased by almost 10.4% in August, compared with the previous month. Kerosene stocks rose by 38.6%, driven by higher output, which almost doubled from the previous month. Gasoil inventories went up by 19.6% on the back of a 5% decline in domestic sales. Total residual fuel oil stocks also rose by 0.9 mb to end the month of August at 17.0 mb, which is 1.2 mb or 7.5% above a year ago and 0.5 mb or 3.3% higher than the latest five-year average. Within fuel oil components, fuel oil A stocks and fuel oil B.C stocks rose by 8.7% and 3.9%, respectively. The build in residual oil was driven by higher output combined with lower consumption. Naphtha stocks rose by 0.5 mb, to finish the month of August at 9.9 mb, still indicating a deficit of 0.8 mb, or 7.6%, compared with a year ago and 1.5 mb, or 12.8%, below the seasonal norm. The stock build came mainly from higher output, which increased by nearly 20%. Higher domestic sales have limited a further build in naphtha stocks. In contrast, gasoline stocks fell by 0.4 mb in August, reversing the build of the previous month to stand at 10.6 mb, which is 2.8 mb or 20.9% less than at the same time the previous year and 2.6 mb or 19.5% below the five-year average. Higher domestic sales, which rose by 10.2%, were behind the drop in gasoline stocks. However higher refinery output limited a further drop in gasoline inventories. Table 9.4: Japan’s commercial oil stocks*, mb
China The latest information for August shows Chinese total oil commercial inventories fell by 3.7 mb, after increasing by nearly 12 mb in July. At 403.6 mb, Chinese inventories were 17.3 mb above year-ago levels at the same time. Within the components, commercial crude rose by 5.5 mb, while product inventories fell by 9.3 mb. At 265.8 mb, commercial crude stocks show a surplus of 36 mb compared with the same
ChangeJun 14 Jul 14 Aug 14 Aug 14/Jul 14 Aug 13
Crude oil 104.5 99.7 98.1 -1.7 85.0Gasoline 10.8 11.0 10.6 -0.4 13.4Naphtha 8.9 9.4 9.9 0.5 10.7Middle distillates 23.6 26.3 32.8 6.5 36.0Residual fuel oil 14.7 16.1 17.0 0.9 15.8Total products 58.1 62.8 70.3 7.5 75.9Total** 162.6 162.6 168.4 5.8 160.9
* At end of month.** Includes crude oil and main products only.Source: Ministry of Economy, Trade and Industry, Japan.
OPEC Monthly Oil Market Report – October 2014 81

Stock Movements
period one year earlier. The build in commercial crude stocks came mainly from higher imports, as increasing refining runs limited a further build. In contrast, total product stocks in China dropped by 9.3 mb in August for the second consecutive month to stand at 147.0 mb. At this level, Chinese product stocks were 0.9 mb below a year ago at the same time. The fall in product stocks could be attributed to relatively higher Chinese demand in August. Within products, gasoline inventories fell by 2.2 mb to stand at 62.5 mb; diesel stocks also fell by 7.1 mb, ending the month of August at 62.5 mb, while kerosene inventories indicated a slight build of 0.1 mb to stand at 15.0 mb. Table 9.5: China’s commercial oil stocks, mb
Singapore and Amsterdam-Rotterdam-Antwerp (ARA) At the end of August, product stocks in Singapore rose slightly by 0.1 mb for the second consecutive month to stand at 40.4 mb. At this level, they still represented a deficit of 2.4 mb or 5.5% over the same period of the previous year. Within products, light distillates rose, while middle distillates and fuel oil experienced a drop. Light distillate stocks came up by 1.4 mb in August, reversing the drop of the previous three months, to stand at 11.1 mb. At this level, light distillate stocks remained at 0.5 mb, or 4.9% above the same time a year ago. In contrast, middle distillate stocks fell by 0.2 mb for the second consecutive month, mainly due to higher exports. At 10.8 mb/d, middle distillate stocks stood at 1.3 mb, or 14.2%, above a year ago in the same period. Residual fuel oil stocks also fell by 0.4 mb in August to stand at 18.4 mb. This drop is mainly driven by higher marine bunker demand. At this level, residual fuel oil stocks stood at 4.2 mb, or 18.6%, below the same period one year earlier. Product stocks in Amsterdam-Rotterdam-Antwerp (ARA) rose slightly by 0.5 mb in August to stand at 36.3 mb. Product stocks in ARA were 6.2 mb, or 20.5%, above a year ago at the same time. Within products, the picture was mixed as gasoline and gasoil experienced builds, while jet oil, residual fuel oil and naphtha saw a drop. Gasoline stocks rose by 0.6 mb to end the month of August at 6.9 mb, which is 0.8 mb, or 13.3%, higher than the same period one year earlier. This build is driven by lower demand in the region. Gasoil also rose by 0.9 mb for the fifth consecutive month, ending August at 20.4 mb. At this level, gasoil stocks are 4.9 mb or 31.9% higher than the same period one year earlier. In contrast, residual fuel oil fell by 0.5 mb, mainly due to higher exports. At 4.0 mb, residual fuel stood at 0.8 mb or 9.6% lower than a year ago at the same time. Jet oil and naphtha stocks fell by 0.3 mb and 0.1 mb to stand at 3.0 mb and 2.1 mb, respectively. Jet fuel stocks stood at 0.3 mb or 9.6% below a year ago at the same time, while naphtha was 1.6 mb higher than the same period a year ago.
ChangeJun 14 Jul 14 Aug 14 Aug 14/Jul 14 Aug 13
Crude oil 246.0 260.3 265.8 5.5 246.1Gasoline 63.2 62.5 60.3 -2.2 55.1Diesel 70.3 69.6 62.5 -7.1 72.3Jet kerosene 16.0 14.9 15.0 0.1 12.8Total products 149.6 147.0 137.8 -9.3 140.2
Total 395.6 407.3 403.6 -3.7 386.2
Source: OPEC Secretariat analysis.
82 OPEC Monthly Oil Market Report – October 2014

Balance of Supply and Demand
Balance of Supply and Demand Demand for OPEC crude in 2014 remained unchanged from the previous report to stand at 29.5 mb/d, which is 0.8 mb/d lower than the 2013 level. Demand for OPEC crude in 2015 was also unchanged to average 29.2 mb/d, 0.3 mb/d less than this year. Forecast for 2014 Demand for OPEC crude for 2014 has remained unchanged from the previous report. The demand for OPEC crude is estimated at 29.5 mb/d in 2014, representing a decrease of 0.8 mb/d from the year-ago level. The first and the second quarters are estimated to show a decline of 0.9 mb/d and 1.5 mb/d, respectively, versus the same period last year. The third quarter is expected to decline by 0.5 mb/d while the fourth quarter is forecast to increase by 0.2 mb/d compared with the same quarter last year. Table 10.1: Summarized supply/demand balance for 2014, mb/d
Forecast for 2015 Demand for OPEC crude for 2015 also remained in line with the previous assessment. The demand for OPEC crude is projected at 29.2 mb/d, representing a decrease of 0.3 mb/d from the estimated 2014 level. The first quarter is expected to decline by 0.4 mb/d compared with the same period last year, while the second quarter is forecast to decline by 0.1 mb/d. The third and the fourth quarters are projected to see a contraction of 0.2 mb/d and 0.3 mb/d, respectively, from the same period in the previous year. Table 10.2: Summarized supply/demand balance for 2015, mb/d
2013 1Q14 2Q14 3Q14 4Q14 2014(a) World oil demand 90.14 90.16 90.11 91.96 92.50 91.19 Non-OPEC supply 54.23 55.59 55.77 55.86 56.42 55.91 OPEC NGLs and non-conventionals 5.65 5.73 5.79 5.86 5.93 5.83(b) Total supply excluding OPEC crude 59.88 61.33 61.56 61.71 62.35 61.74
Difference (a-b) 30.26 28.83 28.55 30.25 30.15 29.45OPEC crude oil production 30.20 29.84 29.76 30.20Balance -0.06 1.01 1.21 -0.05
Totals may not add up due to independent rounding.
2014 1Q15 2Q15 3Q15 4Q15 2015(a) World oil demand 91.19 91.36 91.31 93.18 93.64 92.38 Non-OPEC supply 55.91 57.07 56.85 57.04 57.65 57.16 OPEC NGLs and non-conventionals 5.83 5.89 5.98 6.08 6.18 6.03(b) Total supply excluding OPEC crude 61.74 62.96 62.83 63.12 63.83 63.19
Difference (a-b) 29.45 28.40 28.49 30.06 29.81 29.20
Totals may not add up due to independent rounding.
OPEC Monthly Oil Market Report – October 2014 83

Balance of Supply and Demand
Graph 10.1: Balance of supply and demand
26
27
28
29
30
31
32
26
27
28
29
30
31
32
1Q14 2Q14 3Q14 4Q14 1Q15 2Q15 3Q15 4Q15
mb/dmb/d
OPEC crude production Required OPEC crude
84 OPEC Monthly Oil Market Report – October 2014
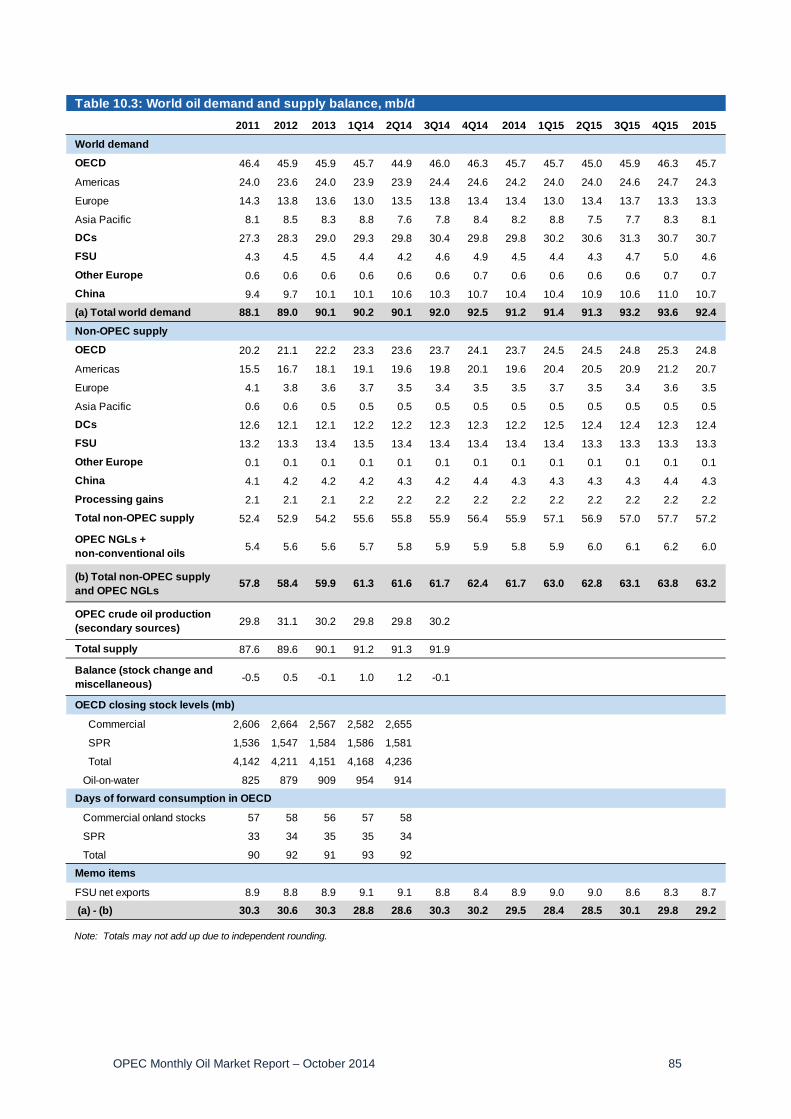
Table 10.3: World oil demand and supply balance, mb/d2011 2012 2013 1Q14 2Q14 3Q14 4Q14 2014 1Q15 2Q15 3Q15 4Q15 2015
World demand
OECD 46.4 45.9 45.9 45.7 44.9 46.0 46.3 45.7 45.7 45.0 45.9 46.3 45.7
Americas 24.0 23.6 24.0 23.9 23.9 24.4 24.6 24.2 24.0 24.0 24.6 24.7 24.3
Europe 14.3 13.8 13.6 13.0 13.5 13.8 13.4 13.4 13.0 13.4 13.7 13.3 13.3
Asia Pacific 8.1 8.5 8.3 8.8 7.6 7.8 8.4 8.2 8.8 7.5 7.7 8.3 8.1
DCs 27.3 28.3 29.0 29.3 29.8 30.4 29.8 29.8 30.2 30.6 31.3 30.7 30.7
FSU 4.3 4.5 4.5 4.4 4.2 4.6 4.9 4.5 4.4 4.3 4.7 5.0 4.6
Other Europe 0.6 0.6 0.6 0.6 0.6 0.6 0.7 0.6 0.6 0.6 0.6 0.7 0.7
China 9.4 9.7 10.1 10.1 10.6 10.3 10.7 10.4 10.4 10.9 10.6 11.0 10.7
(a) Total world demand 88.1 89.0 90.1 90.2 90.1 92.0 92.5 91.2 91.4 91.3 93.2 93.6 92.4
Non-OPEC supply
OECD 20.2 21.1 22.2 23.3 23.6 23.7 24.1 23.7 24.5 24.5 24.8 25.3 24.8
Americas 15.5 16.7 18.1 19.1 19.6 19.8 20.1 19.6 20.4 20.5 20.9 21.2 20.7
Europe 4.1 3.8 3.6 3.7 3.5 3.4 3.5 3.5 3.7 3.5 3.4 3.6 3.5
Asia Pacific 0.6 0.6 0.5 0.5 0.5 0.5 0.5 0.5 0.5 0.5 0.5 0.5 0.5
DCs 12.6 12.1 12.1 12.2 12.2 12.3 12.3 12.2 12.5 12.4 12.4 12.3 12.4
FSU 13.2 13.3 13.4 13.5 13.4 13.4 13.4 13.4 13.4 13.3 13.3 13.3 13.3
Other Europe 0.1 0.1 0.1 0.1 0.1 0.1 0.1 0.1 0.1 0.1 0.1 0.1 0.1
China 4.1 4.2 4.2 4.2 4.3 4.2 4.4 4.3 4.3 4.3 4.3 4.4 4.3
Processing gains 2.1 2.1 2.1 2.2 2.2 2.2 2.2 2.2 2.2 2.2 2.2 2.2 2.2
Total non-OPEC supply 52.4 52.9 54.2 55.6 55.8 55.9 56.4 55.9 57.1 56.9 57.0 57.7 57.2
OPEC NGLs + non-conventional oils 5.4 5.6 5.6 5.7 5.8 5.9 5.9 5.8 5.9 6.0 6.1 6.2 6.0
(b) Total non-OPEC supply and OPEC NGLs 57.8 58.4 59.9 61.3 61.6 61.7 62.4 61.7 63.0 62.8 63.1 63.8 63.2
OPEC crude oil production (secondary sources) 29.8 31.1 30.2 29.8 29.8 30.2
Total supply 87.6 89.6 90.1 91.2 91.3 91.9
Balance (stock change and miscellaneous) -0.5 0.5 -0.1 1.0 1.2 -0.1
OECD closing stock levels (mb)
Commercial 2,606 2,664 2,567 2,582 2,655
SPR 1,536 1,547 1,584 1,586 1,581
Total 4,142 4,211 4,151 4,168 4,236
Oil-on-water 825 879 909 954 914
Days of forward consumption in OECD
Commercial onland stocks 57 58 56 57 58
SPR 33 34 35 35 34
Total 90 92 91 93 92
Memo items
FSU net exports 8.9 8.8 8.9 9.1 9.1 8.8 8.4 8.9 9.0 9.0 8.6 8.3 8.7
(a) - (b) 30.3 30.6 30.3 28.8 28.6 30.3 30.2 29.5 28.4 28.5 30.1 29.8 29.2
Note: Totals may not add up due to independent rounding.
OPEC Monthly Oil Market Report – October 2014 85

Table 10.4: World oil demand/supply balance: changes from last month's table* , mb/d2011 2012 2013 1Q14 2Q14 3Q14 4Q14 2014 1Q15 2Q15 3Q15 4Q15 2015
World demand
OECD - - - - - - - - - - - - -
Americas - - - - - - - - - - - - -
Europe - - - - - - - - - - - - -
Asia Pacific - - - - - - - - - - - - -
DCs - - - - - - - - - - - - -
FSU - 0.1 - - - - - - - - - - -
Other Europe - - - - - - - - - - - - -
China - - - - - - - - - - - - -
(a) Total world demand - 0.1 - - - - - - - - - - -
World demand growth - 0.1 -0.1 - - - - - - - - - -
Non-OPEC supply
OECD - - - - - - - - - - - - -
Americas - - - - - - 0.1 - 0.1 0.1 0.1 0.1 0.1
Europe - - - - - - -0.1 - -0.1 -0.1 -0.1 -0.1 -0.1
Asia Pacific - - - - - - - - - - - - -
DCs - - - - - - - - - - - - -
FSU - - - - - 0.1 - - - - - - -
Other Europe - - - - - - - - - - - - -
China - - - - - - - - - - - - -
Processing gains - - - - - - - - - - - - -
Total non-OPEC supply - - - - - - - - - - - - -
Total non-OPEC supply growth - - - - - - - - - - - - -
OPEC NGLs + non-conventionals - - - - - - - - - - - - -
(b) Total non-OPEC supply and OPEC NGLs - - - - - - - - - - - - -
OPEC crude oil production (secondary sources) - - - - - -
Total supply - - - - - -
Balance (stock change and miscellaneous) - -0.1 - - - -
OECD closing stock levels (mb)
Commercial - - 1 - -16
SPR - - - - 3
Total - - 1 - -13
Oil-on-water - - - - -
Days of forward consumption in OECD
Commercial onland stocks - - - - -
SPR - - - - -
Total - - - - -
Memo items
FSU net exports - -0.1 - - - 0.1 - - - - - - -
(a) - (b) - 0.1 - - - - - - - - - - -
* This compares Table 10.3 in this issue of the MOMR with Table 10.3 in the September 2014 issue. This table shows only where changes have occurred.
86 OPEC Monthly Oil Market Report – October 2014

Table 10.5: OECD oil stocks and oil on water at the end of period
2011 2012 2013 2Q12 3Q12 4Q12 1Q13 2Q13 3Q13 4Q13 1Q14 2Q14
Closing stock levels, mb
OECD onland commercial 2,606 2,664 2,567 2,688 2,730 2,664 2,665 2,661 2,701 2,567 2,582 2,655
Americas 1,308 1,365 1,316 1,362 1,385 1,365 1,349 1,378 1,404 1,316 1,311 1,381
Europe 905 901 869 913 917 901 904 873 885 869 873 882
Asia Pacific 392 397 382 413 428 397 413 409 413 382 399 392
OECD SPR 1,536 1,547 1,584 1,539 1,542 1,547 1,581 1,577 1,582 1,584 1,586 1,581
Americas 697 696 697 697 696 696 697 697 697 697 697 692
Europe 426 436 470 429 433 436 472 471 472 470 470 471
Asia Pacific 414 415 417 413 414 415 413 409 413 417 418 419
OECD total 4,142 4,211 4,151 4,227 4,272 4,211 4,247 4,238 4,283 4,151 4,168 4,236
Oil-on-water 825 879 909 812 844 879 942 871 878 909 954 914
Days of forward consumption in OECD
OECD onland commercial 57 58 56 59 59 58 59 58 58 56 57 58
Americas 55 57 55 57 58 58 57 57 58 55 55 57
Europe 66 66 65 66 67 68 65 63 65 67 65 64
Asia Pacific 46 48 46 50 49 45 53 51 48 43 52 49
OECD SPR 33 34 35 34 33 34 35 34 34 35 35 34
Americas 29 29 29 29 29 29 29 29 29 29 29 28
Europe 31 32 35 31 32 33 34 34 35 36 35 34
Asia Pacific 49 50 51 50 47 47 53 51 48 47 54 53
OECD total 90 92 91 92 92 92 94 92 92 91 93 92
OPEC Monthly Oil Market Report – October 2014 87

Table 10.6: Non-OPEC supply and OPEC natural gas liquids, mb/dChange Change
2011 2012 2013 3Q14 4Q14 2014 14/13 1Q15 2Q15 3Q15 4Q15 2015 15/14US 9.0 10.0 11.2 12.9 13.0 12.6 1.4 13.2 13.3 13.6 13.9 13.5 0.9Canada 3.5 3.8 4.0 4.1 4.2 4.2 0.2 4.4 4.4 4.4 4.6 4.4 0.2Mexico 2.9 2.9 2.9 2.8 2.8 2.8 -0.1 2.8 2.8 2.8 2.8 2.8 0.0OECD Americas* 15.5 16.7 18.1 19.8 20.1 19.6 1.5 20.4 20.5 20.9 21.2 20.7 1.1Norway 2.0 1.9 1.8 1.9 1.9 1.9 0.0 2.0 1.9 1.8 2.0 1.9 0.0UK 1.1 1.0 0.9 0.7 0.8 0.8 0.0 0.9 0.8 0.8 0.9 0.8 0.0Denmark 0.2 0.2 0.2 0.2 0.1 0.2 0.0 0.2 0.1 0.1 0.1 0.1 0.0Other OECD Europe 0.7 0.7 0.7 0.7 0.7 0.7 0.0 0.7 0.7 0.7 0.6 0.7 0.0OECD Europe 4.1 3.8 3.6 3.4 3.5 3.5 0.0 3.7 3.5 3.4 3.6 3.5 0.0Australia 0.5 0.5 0.4 0.4 0.4 0.4 0.0 0.4 0.4 0.4 0.4 0.4 0.0Other Asia Pacific 0.1 0.1 0.1 0.1 0.1 0.1 0.0 0.1 0.1 0.1 0.1 0.1 0.0OECD Asia Pacific 0.6 0.6 0.5 0.5 0.5 0.5 0.0 0.5 0.5 0.5 0.5 0.5 0.0Total OECD 20.2 21.1 22.2 23.7 24.1 23.7 1.5 24.5 24.5 24.8 25.3 24.8 1.1Brunei 0.2 0.2 0.1 0.1 0.1 0.1 0.0 0.1 0.1 0.1 0.1 0.1 0.0India 0.9 0.9 0.9 0.9 0.9 0.9 0.0 0.9 0.9 0.9 0.8 0.9 0.0Indonesia 1.0 1.0 0.9 0.9 0.9 0.9 0.0 0.9 0.9 0.9 0.9 0.9 0.0Malaysia 0.7 0.7 0.7 0.7 0.7 0.7 0.0 0.7 0.7 0.6 0.6 0.7 0.0Thailand 0.3 0.4 0.4 0.4 0.3 0.4 0.0 0.4 0.4 0.4 0.3 0.3 0.0Vietnam 0.4 0.4 0.4 0.3 0.4 0.4 0.0 0.4 0.4 0.4 0.4 0.4 0.0Asia others 0.2 0.2 0.2 0.2 0.2 0.2 0.0 0.2 0.3 0.3 0.3 0.3 0.0Other Asia 3.6 3.7 3.6 3.4 3.5 3.5 -0.1 3.6 3.5 3.5 3.5 3.5 0.0Argentina 0.7 0.7 0.7 0.7 0.7 0.7 0.0 0.7 0.7 0.7 0.7 0.7 0.0Brazil 2.6 2.6 2.6 2.9 3.0 2.8 0.2 3.0 3.0 3.1 3.1 3.0 0.2Colombia 0.9 1.0 1.0 1.0 1.0 1.0 0.0 1.0 1.0 0.9 1.0 1.0 0.0Trinidad & Tobago 0.1 0.1 0.1 0.1 0.1 0.1 0.0 0.1 0.1 0.1 0.1 0.1 0.0L. America others 0.3 0.3 0.3 0.3 0.3 0.3 0.0 0.3 0.3 0.3 0.3 0.3 0.0Latin America 4.7 4.7 4.8 5.0 5.1 5.0 0.2 5.1 5.1 5.1 5.2 5.1 0.2Bahrain 0.2 0.2 0.2 0.2 0.2 0.2 0.0 0.2 0.2 0.2 0.2 0.2 0.0Oman 0.9 0.9 0.9 1.0 1.0 1.0 0.0 1.0 1.0 1.0 1.0 1.0 0.0Syria 0.4 0.2 0.1 0.0 0.0 0.0 0.0 0.0 0.0 0.0 0.0 0.0 0.0Yemen 0.2 0.2 0.1 0.1 0.1 0.1 0.0 0.1 0.1 0.1 0.1 0.1 0.0Middle East 1.7 1.5 1.4 1.4 1.3 1.3 0.0 1.4 1.4 1.3 1.3 1.4 0.0Chad 0.1 0.1 0.1 0.1 0.1 0.1 0.0 0.1 0.1 0.1 0.1 0.1 0.0Congo 0.3 0.3 0.3 0.3 0.3 0.3 0.0 0.3 0.3 0.3 0.3 0.3 0.0Egypt 0.7 0.7 0.7 0.7 0.7 0.7 0.0 0.7 0.7 0.7 0.6 0.7 0.0Equatorial Guinea 0.3 0.3 0.3 0.3 0.3 0.3 0.0 0.3 0.3 0.3 0.3 0.3 0.0Gabon 0.3 0.2 0.2 0.2 0.2 0.2 0.0 0.2 0.2 0.2 0.2 0.2 0.0South Africa 0.2 0.2 0.2 0.2 0.2 0.2 0.0 0.2 0.2 0.2 0.2 0.2 0.0Sudans 0.4 0.1 0.2 0.3 0.3 0.3 0.1 0.3 0.3 0.3 0.3 0.3 0.0Africa other 0.3 0.3 0.3 0.3 0.3 0.3 0.0 0.4 0.3 0.3 0.3 0.3 0.0Africa 2.6 2.3 2.4 2.4 2.4 2.5 0.1 2.5 2.4 2.4 2.4 2.4 0.0Total DCs 12.6 12.1 12.1 12.3 12.3 12.2 0.1 12.5 12.4 12.4 12.3 12.4 0.2FSU 13.2 13.3 13.4 13.4 13.4 13.4 0.0 13.4 13.3 13.3 13.3 13.3 -0.1 Russia 10.3 10.4 10.5 10.5 10.5 10.5 0.0 10.5 10.5 10.5 10.5 10.5 0.0 Kazakhstan 1.6 1.6 1.6 1.6 1.6 1.6 0.0 1.6 1.6 1.6 1.6 1.6 0.0 Azerbaijan 1.0 0.9 0.9 0.9 0.9 0.9 0.0 0.9 0.9 0.8 0.9 0.9 0.0 FSU others 0.4 0.4 0.4 0.4 0.4 0.4 0.0 0.4 0.4 0.4 0.4 0.4 0.0Other Europe 0.1 0.1 0.1 0.1 0.1 0.1 0.0 0.1 0.1 0.1 0.1 0.1 0.0China 4.1 4.2 4.2 4.2 4.4 4.3 0.0 4.3 4.3 4.3 4.4 4.3 0.1
Non-OPEC production 50.3 50.7 52.1 53.7 54.3 53.7 1.6 54.9 54.7 54.9 55.5 55.0 1.2
Processing gains 2.1 2.1 2.1 2.2 2.2 2.2 0.0 2.2 2.2 2.2 2.2 2.2 0.0Non-OPEC supply 52.4 52.9 54.2 55.9 56.4 55.9 1.7 57.1 56.9 57.0 57.7 57.2 1.2OPEC NGL 5.2 5.4 5.4 5.6 5.7 5.6 0.2 5.6 5.7 5.8 5.9 5.8 0.2OPEC non-conventional 0.1 0.2 0.2 0.3 0.3 0.3 0.0 0.3 0.3 0.3 0.3 0.3 0.0OPEC (NGL+NCF) 5.4 5.6 5.6 5.9 5.9 5.8 0.2 5.9 6.0 6.1 6.2 6.0 0.2Non-OPEC & OPEC (NGL+NCF) 57.8 58.4 59.9 61.7 62.4 61.7 1.9 63.0 62.8 63.1 63.8 63.2 1.4
* Chile has been included in OECD Americas.Note: Totals may not add up due to independent rounding.
88 OPEC Monthly Oil Market Report – October 2014

Table 10.7: World Rig CountChange Change
2010 2011 2012 2013 13/12 4Q13 1Q14 2Q14 3Q14 Aug 14 Sep 14 Sep/AugUS 1,541 1,881 1,919 1,761 -158 1,758 1,780 1,852 1,904 1,905 1,930 25Canada 347 423 366 354 -12 379 526 202 385 399 407 8Mexico 97 94 106 106 0 101 93 87 85 81 87 6Americas 1,985 2,398 2,391 2,221 -170 2,238 2,400 2,140 2,374 2,385 2,424 39Norway 18 17 17 20 2 18 17 18 15 12 15 3UK 19 16 18 17 -1 14 15 17 15 16 13 -3Europe 94 118 119 135 16 133 135 146 148 143 148 5Asia Pacific 21 17 24 27 3 25 28 27 25 26 25 -1Total OECD 2,100 2,532 2,534 2,383 -151 2,396 2,563 2,314 2,547 2,554 2,597 43Other Asia 248 239 217 219 2 219 230 221 231 229 235 6Latin America 205 195 180 166 -14 168 164 176 174 177 170 -7Middle East 156 104 110 76 -33 86 84 85 82 79 82 3Africa 19 2 7 16 9 24 27 30 24 24 23 -1Total DCs 628 540 513 477 -36 497 504 512 511 509 510 1Non-OPEC rig count 2,727 3,072 3,047 2,860 -187 2,894 3,067 2,826 3,058 3,063 3,107 44
Algeria 25 31 36 47 11 47 49 46 48 50 45 -5Angola 9 10 9 11 2 14 16 16 14 14 14 0Ecuador 11 12 20 26 6 26 25 25 26 27 24 -3Iran** 52 54 54 54 0 54 54 54 54 54 54 0Iraq** 36 36 58 83 25 92 89 93 75 74 58 -16Kuwait** 20 57 57 58 1 57 60 60 68 68 69 1Libya** 16 8 12 15 3 14 15 10 8 4 5 1Nigeria 15 36 36 37 1 36 35 31 32 33 30 -3Qatar 9 8 8 9 1 8 11 11 11 10 10 0Saudi Arabia 67 100 112 114 3 115 125 132 137 137 138 1UAE 13 21 24 28 4 30 30 33 37 36 37 1Venezuela 70 122 117 121 3 121 121 114 122 125 121 -4OPEC rig count 342 494 542 602 60 614 629 624 631 632 605 -27
Worldwide rig count* 3,069 3,566 3,589 3,462 -127 3,508 3,696 3,450 3,689 3,695 3,712 17of which: Oil 1,701 2,257 2,654 2,611 -43 2,631 2,819 2,687 2,851 2,852 2,852 0 Gas 1,325 1,262 886 746 -140 769 780 671 744 746 766 20 Others 43 49 52 109 57 110 99 95 96 99 96 -3
Note: Totals may not add up due to independent rounding. * Excludes China and FSU.na: Not available. ** Estimated figure when Baker Hughes Incorporated did Sources: Baker Hughes Incorporated & Secretariat's estimates. not reported the data.
OPEC Monthly Oil Market Report – October 2014 89
Contributors to the OPEC Monthly Oil Market Report Editor-in-Chief Omar S. Abdul-Hamid, Director, Research Division email: [email protected] Editor Hojatollah Ghanimi Fard, Head, Petroleum Studies Department email: [email protected] Analysts Crude Oil Price Movements Eissa Alzerma
email: [email protected]
Commodity Markets Hector Hurtado email: [email protected]
World Economy Afshin Javan email: [email protected] Imad Alam Al-Deen email: [email protected] Joerg Spitzy email: [email protected]
World Oil Demand Hassan Balfakeih email: [email protected]
World Oil Supply Mohammad Ali Danesh email: [email protected]
Product Markets and Refinery Operations Elio Rodriguez email: [email protected]
Tanker Market and Oil Trade Anisah Almadhayyan email: [email protected]
Stock Movements Aziz Yahyai email: [email protected]
Technical and editorial team Aziz Yahyai email: [email protected] Douglas Linton email: [email protected]
Data Services Adedapo Odulaja, Head, Data Services Department ([email protected]), Hossein Hassani, Statistical Systems Coordinator ([email protected]), Pantelis Christodoulides (World Oil Demand and Stock Movements), Klaus Stoeger (World Oil Supply), Harvir Kalirai (World Economy), Mouhamad Moudassir (Product Markets and Refinery Operations), Mohammad Sattar (Crude Oil Price Movements), Anna Gredinger (Tanker Market and Oil Trade) Editing, production, design and circulation Alvino-Mario Fantini, Maureen MacNeill, Scott Laury, Viveca Hameder, Hataichanok Leimlehner, Evelyn Oduro-Kwateng, Andrea Birnbach
90 OPEC Monthly Oil Market Report – October 2014

Disclaimer
The data, analysis and any other information contained in the Monthly Oil Market Report (the “MOMR”) is for informational purposes only and is not intended as a substitute for advice from your business, finance, investment consultant or other professional. The views expressed in the MOMR are those of the OPEC Secretariat and do not necessarily reflect the views of its Governing Bodies and/or individual OPEC Member Countries.
Whilst reasonable efforts have been made to ensure the accuracy of the MOMR’s content, the OPEC Secretariat makes no warranties or representations as to its accuracy, currency reference or comprehensiveness, and assumes no liability or responsibility for any inaccuracy, error or omission, or for any loss or damage arising in connection with or attributable to any action or decision taken as a result of using or relying on the information in the MOMR.
The MOMR may contain references to material(s) from third parties whose copyright must be acknowledged by obtaining necessary authorization from the copyright owner(s). The OPEC Secretariat shall not be liable or responsible for any unauthorized use of third party material(s). All rights of the Publication shall be reserved to the OPEC Secretariat, including every exclusive economic right, in full or per excerpts, with special reference but without limitation, to the right to publish it by press and/or by any communications medium whatsoever, including Internet; translate, include in a data base, make changes, transform and process for any kind of use, including radio, television or cinema adaptations, as well as sound-video recording, audio-visual screenplays and electronic processing of any kind and nature whatsoever.
Full reproduction, copying or transmission of the MOMR is not permitted in any form or by any means by third parties without the OPEC Secretariat’s written permission, however the information contained therein may be used and/or reproduced for educational and other non-commercial purposes without the OPEC Secretariat’s prior written permission, provided that OPEC is fully acknowledged as the copyright holder.
OPEC Monthly Oil Market Report – October 2014 91

Next report to be issued on 12 November 2014.
OPEC Basket average price US$/b
September OPEC crude production mb/d, according to secondary sources
Economic growth rate per cent
down 4.77 in September
up 0.40 in September
September 2014 95.98
August 2014 100.75
Year to date 103.78
September 2014 30.47
August 2014 30.07
World OECD US Japan Euro-zone China India
2014 3.2 1.8 2.1 0.8 0.7 7.4 5.5
2015 3.6 2.1 2.6 1.2 1.1 7.2 5.8
Supply and demand mb/d
OECD commercial stocks mb
2014 14/13 2015 15/14
World demand 91.2 1.1 World demand 92.4 1.2
Non-OPEC supply 55.9 1.7 Non-OPEC supply 57.2 1.2
OPEC NGLs 5.8 0.2 OPEC NGLs 6.0 0.2
Difference 29.5 –0.8 Difference 29.2 –0.3
Jun 14 Jul 14 Aug 14 Aug 14/Jul 14 Aug 13Crude oil 1,319 1,301 1,293 –7.7 1,263
Products 1,336 1,370 1,386 16.6 1,416
Total 2,655 2,670 2,679 8.9 2,678
Days of forward cover 57.6 57.8 57.9 0.1 57.7