MOMENTUM - bbnc.net · 2 bbnc fy2018 annual report message to our shareholders 3 message to our...
34
BBNC FY2018 ANNUAL REPORT MOMENTUM
Transcript of MOMENTUM - bbnc.net · 2 bbnc fy2018 annual report message to our shareholders 3 message to our...
B B N C F Y 2 0 1 8 A N N U A L R E P O R T
MOMENTUM

15BOARD AND MANAGEMENT
17FINANCIALS & MANAGEMENT DISCUSSION AND ANALYSIS
31INDEPENDENT
AUDITORS' REPORT
32CONSOLIDATED
FINANCIAL STATEMENTS
61AUDIT COMMITTEE REPORT
62STATEMENT OF
MANAGEMENT RESPONSIBILITY
MOMENTUMTABLE OF CONTENTS
02MESSAGE TO OUR
SHAREHOLDERS
04FY2018 HIGHLIGHTS
06OUR CULTURE
10OUR PEOPLE
12OUR LANDS
14ABOUT BBNC

2 3BBNC FY2018 ANNUAL REPORT MESSAGE TO OUR SHAREHOLDERS
MESSAGE TO OUR SHAREHOLDERS
FY2018 WAS A YEAR OF BOTH GAINING TRACTION AND STAYING THE COURSE.
“
here is a saying that those in Bristol
Bay’s communities know well: being
up on step. It’s when your boat
reaches a certain speed and levels out on the
water. It’s steadied, hitting its stride, on its way.
In FY2018, BBNC got up on step. One could
argue that we’ve been there—or close to it—for a
while now, but this year there was no question.
We delivered our best net income performance
in company history, introduced new initiatives
and enhanced existing ones, and marked our
20th consecutive year of sustaining a predictable
and increasing dividend. It was a year of both
gaining traction and staying the course. As a
result, our financial health is solid and our
momentum is strong.
We continued to push the envelope in FY2018 as
we have always done, approaching our work with
the innovative and bold spirit that has defined our
culture for generations. We have never been afraid
to do things differently, to be curious and creative
A YEAR OFMOMENTUM
in starting new programs or in exploring new ways
of doing business. This thinking has shaped our
purpose as an Alaska Native Corporation from
the beginning, and will continue to do so for
years to come.
BBNC’s history has been building to this time.
We got our start. Worked hard, took risks.
Learned from our successes and misses. Tried
and tried again. Expanded, diversified, scaled
back when it was the right thing to do. Built
experience and expertise, achieved financial
stability and growth, responded to the needs
of our shareholders and subsidiaries. Stood up
for what’s right as stewards of our lands, people,
and Native way of life. Through it all, gaining and
maintaining. Now we’re moving into the next
phase of BBNC’s journey, with clear-eyed
optimism and excitement for what comes next.
We won’t stop doing what got us here. There is
still much work to be done.
Joseph L. ChythlookCHAIRMAN OF THE BOARD
Jason MetrokinPRESIDENT & CHIEF EXECUTIVE OFFICER
As we close the book on FY2018 and move
headlong into the current fiscal year, we invite
you to keep your own momentum going. Keep
doing what makes our shareholder community
such a great and vibrant one. Keep celebrating
our shared traditions, history, and values. And as
always, keep making your voices heard, clear and
strong; Bristol Bay is counting on it and we are
listening, up on step together.
With appreciation,
T

OUR ANC
$103,063,000NET INCOME
Total FY2018 net income—a 151% increase over last year and the
strongest result in BBNC’s history
5OUR ANC4 BBNC FY2018 ANNUAL REPORT
10,376
20 YEARS
500+ TRAINING PROGRAMS
DIVIDENDS
SHAREHOLDERS
EDUCATION
WAGES
Of predictable and increasing dividends paid
Paid in shareholder wages by BBNC and its
subsidiaries in FY2018Shareholders took part in
employment and training
support services offered by
BBNC in FY2018
Total number of BBNC shareholders
FY2018 HIGHLIGHTS
$14.1 MILLION
Awarded to students through the BBNCEF
Higher Education/Vocational Education Scholarship
program and the Short-Term Vocational Education
program in FY2018.
$823,000

7OUR CULTURE
WE WANT TO HELP OUR COMMUNITIES OFFER ACTIVITIES THAT ARE MEANINGFUL AND RELEVANT TO OUR PEOPLE AND CULTURE.
SHARING OUR NATIVE WAY OF LIFE
“
Ricardo LopezBBNCEF Program Officer, Cultural Heritage Program
ake salt fish. Sew a kuspuk or dance
fan. Sing centuries-old songs and
learn the traditional names and
honored histories of places. Discover medicinal
plants, carve soapstone, build a sled or salmon net
from scratch. Gather with village Elders to share
old stories and hone new skills.
These are some of the many ways that our Alaska
Native culture has, and continues to, come to life
across the Bristol Bay region. It’s a culture that
has shaped our people for generations and is
at the heart of BBNC’s work; one that embodies
momentum in its forward-facing spirit and lasting
imprint on this place we call home.
The BBNC Education Foundation’s Cultural
Heritage and Native Place Names programs
work to strengthen this imprint by preserving,
celebrating, and promoting our cultural traditions
and Native way of life. The programs support
organizations in the Bristol Bay region that engage
BBNC shareholders, descendants, and community
members in a range of educational and cultural
activities. Grant awards through the programs
range from $1,000 to $5,000.
OUR CULTURE
M
6 BBNC FY2018 ANNUAL REPORT

8 BBNC FY2018 ANNUAL REPORT
“The grants we get to award are for very affirming,
positive, and joyful activities,” says Ricardo Lopez,
Cultural Heritage Program Officer, who joined the
BBNCEF staff in December 2017. “Whether it’s a
school project or a summer youth camp, it will help
strengthen our cultural identity. And we know that
even a modest grant can make a big impact.”
FY2018 saw both programs sustain and build that
impact throughout the region:
• A special grant cycle specifically for summer
youth culture camp activities throughout the
region was introduced, with nine camps taking
place as a result. Nine more culture camps
will take place in villages from Clark's Point to
Nondalton this summer.
• The programs now accept grant applications
on a rolling basis to be more responsive to
community needs and activities throughout
the calendar year.
• The Cultural Heritage Program began to
explore the concept of a regional culture camp,
working with BBNC, its land, shareholder
and corporate relations, and shareholder
development departments to explore
concepts and opportunities through culture
camps to sustain Alaska Native cultural identity
for shareholders and descendants.
• The Native Place Names program awarded
additional grants for activities dedicated to
Native language preservation, including a
series of hikes and discussions for youth and
Elders in Togiak.
• BBNCEF streamlined elements of program
guidelines to improve the accessibility and
ease of grant applications.
“As much as culture changes and evolves with
time, you’ve got to have good roots and continue
to grow,” says Lopez. “Our roots in Bristol Bay go
deep. The cultural activities supported by the
Foundation are a reminder of that. They say, ‘you’re
a strong person, we are resilient people, and you
come from a proud and vibrant culture that you
should know about.’ Even if you don’t practice
subsistence activities on a regular basis, even if
it’s just one week a summer, connecting with our
culture and sharing these experiences will build a
stronger community and future.”
$78,000 Total awarded in the Native Place Names and
Cultural Heritage grant in FY2018
28
9OUR CULTURE
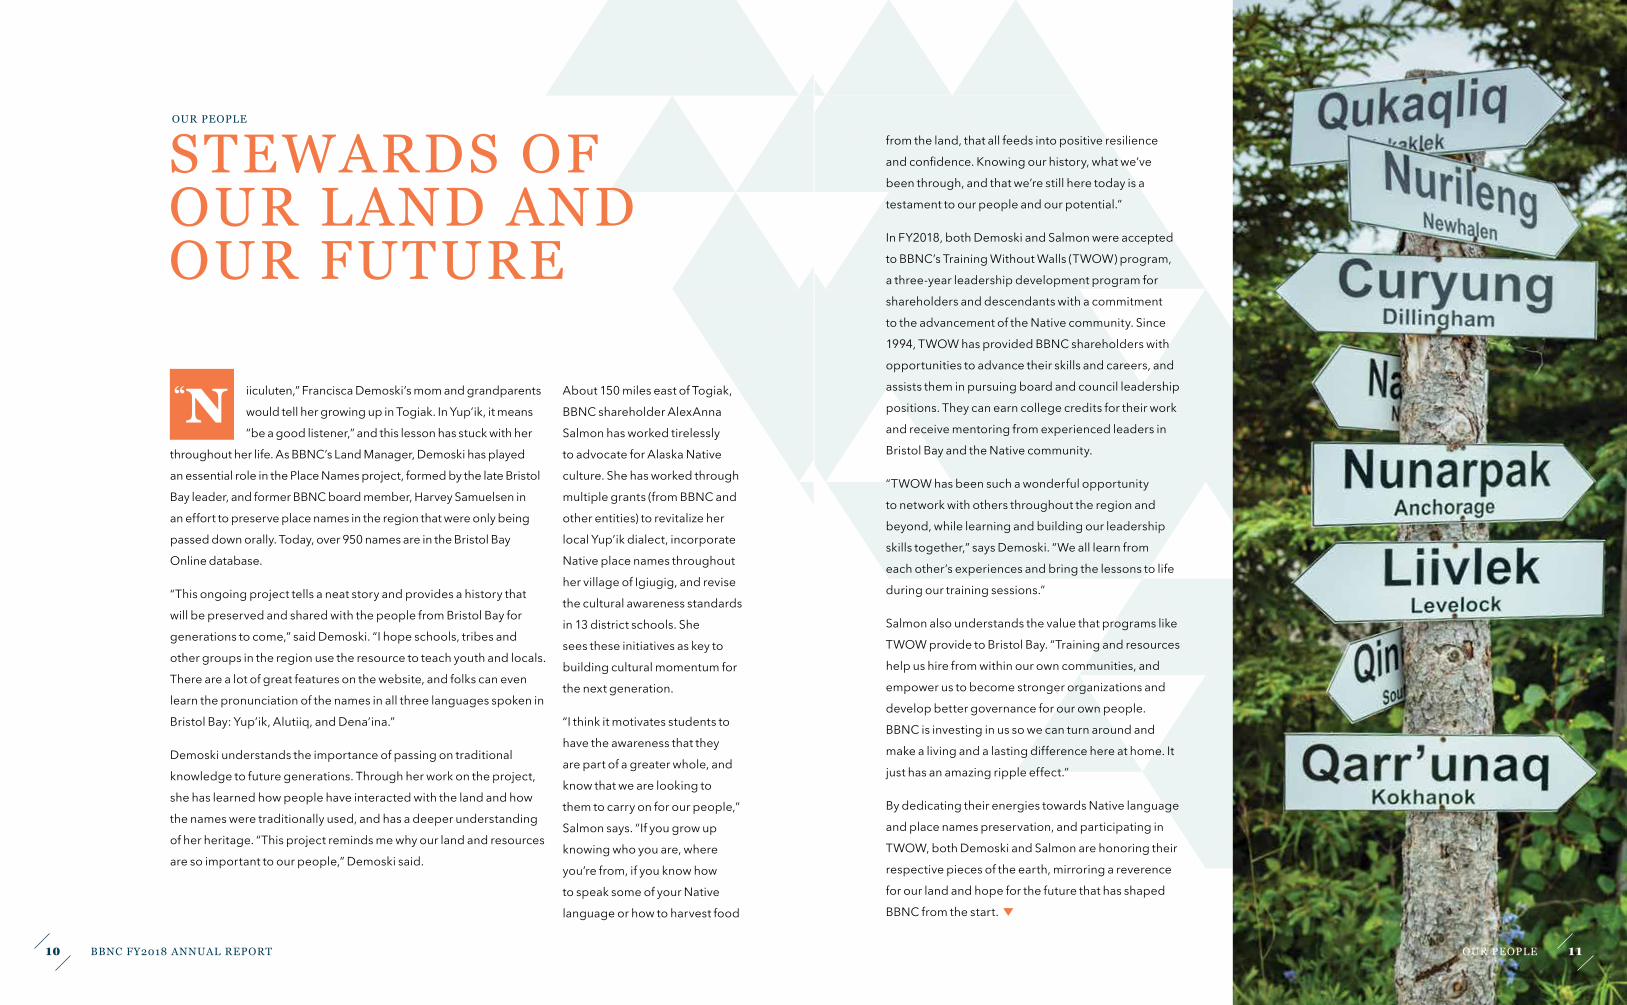
Yup'ik place name signs in
Igiugig, funded by a BBNCEF
Place Names grant
10 BBNC FY2018 ANNUAL REPORT
iiculuten,” Francisca Demoski’s mom and grandparents
would tell her growing up in Togiak. In Yup’ik, it means
“be a good listener,” and this lesson has stuck with her
throughout her life. As BBNC’s Land Manager, Demoski has played
an essential role in the Place Names project, formed by the late Bristol
Bay leader, and former BBNC board member, Harvey Samuelsen in
an effort to preserve place names in the region that were only being
passed down orally. Today, over 950 names are in the Bristol Bay
Online database.
“This ongoing project tells a neat story and provides a history that
will be preserved and shared with the people from Bristol Bay for
generations to come,” said Demoski. “I hope schools, tribes and
other groups in the region use the resource to teach youth and locals.
There are a lot of great features on the website, and folks can even
learn the pronunciation of the names in all three languages spoken in
Bristol Bay: Yup’ik, Alutiiq, and Dena’ina.”
Demoski understands the importance of passing on traditional
knowledge to future generations. Through her work on the project,
she has learned how people have interacted with the land and how
the names were traditionally used, and has a deeper understanding
of her heritage. “This project reminds me why our land and resources
are so important to our people,” Demoski said.
STEWARDS OF OUR LAND AND OUR FUTURE
About 150 miles east of Togiak,
BBNC shareholder AlexAnna
Salmon has worked tirelessly
to advocate for Alaska Native
culture. She has worked through
multiple grants (from BBNC and
other entities) to revitalize her
local Yup’ik dialect, incorporate
Native place names throughout
her village of Igiugig, and revise
the cultural awareness standards
in 13 district schools. She
sees these initiatives as key to
building cultural momentum for
the next generation.
“I think it motivates students to
have the awareness that they
are part of a greater whole, and
know that we are looking to
them to carry on for our people,”
Salmon says. “If you grow up
knowing who you are, where
you’re from, if you know how
to speak some of your Native
language or how to harvest food
OUR PEOPLE
“N
11OUR PEOPLE
from the land, that all feeds into positive resilience
and confidence. Knowing our history, what we’ve
been through, and that we’re still here today is a
testament to our people and our potential.”
In FY2018, both Demoski and Salmon were accepted
to BBNC’s Training Without Walls (TWOW) program,
a three-year leadership development program for
shareholders and descendants with a commitment
to the advancement of the Native community. Since
1994, TWOW has provided BBNC shareholders with
opportunities to advance their skills and careers, and
assists them in pursuing board and council leadership
positions. They can earn college credits for their work
and receive mentoring from experienced leaders in
Bristol Bay and the Native community.
“TWOW has been such a wonderful opportunity
to network with others throughout the region and
beyond, while learning and building our leadership
skills together,” says Demoski. “We all learn from
each other’s experiences and bring the lessons to life
during our training sessions.”
Salmon also understands the value that programs like
TWOW provide to Bristol Bay. “Training and resources
help us hire from within our own communities, and
empower us to become stronger organizations and
develop better governance for our own people.
BBNC is investing in us so we can turn around and
make a living and a lasting difference here at home. It
just has an amazing ripple effect.”
By dedicating their energies towards Native language
and place names preservation, and participating in
TWOW, both Demoski and Salmon are honoring their
respective pieces of the earth, mirroring a reverence
for our land and hope for the future that has shaped
BBNC from the start.

13OUR LANDS
THE MORE LOCALLY-ACCESSIBLE MATERIAL SITES WE CAN HAVE, THE BETTER ABLE WE’RE GOING TO BE TO EFFECTIVELY AND COST-EFFICIENTLY SUPPLY THE MATERIAL NEEDS FOR INFRASTRUCTURE PROJECTS AROUND OUR REGION. BRISTOL BAY WILL BE BETTER OFF AS A RESULT.
40
The size of the Bristol Bay region. BBNC
is responsible for roughly 12 percent of
that expanse—3 million acres of subsurface
lands and 116,000 acres of surface lands.
$5.0 BBNC Land Department’s 5-year goal
for investing in land and infrastructure
projects throughout Bristol Bay.
50%BBNC reduced the Snake Lake Quarry
entry road’s incline from 16% to 8%, making
it much safer and easier for trucks to access
and transport rock.
MILLION
MILLIONACRES
LESS STEEP
PROTECTIONAND PROGRESS
bundant, sustaining, and pristine. Vast and breathtaking. Steeped in
heritage, history, and culture. Ours to celebrate and preserve.
A deep reverence for Bristol Bay’s lands and waters is shared by those who call this
place home, and has long guided BBNC’s values, policies, and operations. Our
Land Department continued to play a critical role in the protection and responsible
development of our region’s land in FY2018, balancing financial growth with the
respect that Bristol Bay deserves.
7,500 Total weight of a recent Snake Lake Quarry
sale of armor rock for an erosion project
in Mekoryuk, AK.
2.0The amount of rock that BBNC is currently
permitted for as part of its FY2018 re-opening
of the Snake Lake Quarry north of Dillingham.
The rock will be used for infrastructure and
construction projects across Bristol Bay and
beyond for years to come, including fortifying
creek and river banks to reduce erosion.
MILLION CUBIC YARDS
TONS
“
Daniel CheyetteBBNC Vice President, Land & Natural Resourceson the re-opening of the Snake Lake Quarry, BBNC’s largest Lands initiative of FY2018
OUR LANDS
A
12 BBNC FY2018 ANNUAL REPORT

15ABOUT BBNC
EXECUTIVE MANAGEMENT TEAM
BOARD OF DIRECTORS
Back row: Diedre Hill, Everette Anderson, Peter Andrew Jr., H. Robin Samuelsen Jr., Kimberly Williams,
and Karl Hill. Front row: Shawn Aspelund, Marie Paul, Russell S. Nelson, Joseph L. Chythlook,
Dorothy M. Larson, and Melvin C. Brown.
Left to right: Nancy Schierhorn,
Executive Vice President,
Chief Development Officer;
April Ferguson, Executive Vice
President & General Counsel;
Jason Metrokin, President &
Chief Executive Officer;
Scott Torrison, Executive
Vice President & Chief
Operating Officer; Ryan York,
Executive Vice President &
Chief Financial Officer.
MOMENTUMABOUT BBNC
14 BBNC FY2018 ANNUAL REPORT
CORPORATE PROFILEBristol Bay Native Corporation (BBNC) is
a responsible Alaska Native investment
corporation dedicated to the mission of
“Enriching Our Native Way of Life.” Established
through the Alaska Native Claims Settlement Act
of 1971 (ANCSA), BBNC works to protect the land
in Bristol Bay, celebrate the legacy of its people,
and enhance the lives of its shareholders.
VALUES• Respect the people, land and natural
resources that are the basis for our culture
and the Native way of life.
• Responsibly manage natural resources,
prioritizing the cultural and economic value
of the Bristol Bay fishery.
• Responsibly manage financial resources,
leading to a continuous source of dividends
and benefits for our shareholders.
• Maintain integrity and fairness in our
dealings with all stakeholders.
MISSIONEnriching Our Native Way of Life.
VISIONTo protect the land in the Bristol Bay region,
celebrate the legacy of its people, and
enhance the lives of BBNC shareholders.
GOALS• Build the financial strength of BBNC.
• Pay predictable and increasing
shareholder dividends.
• Balance responsible development
and protection of our lands, fisheries
and resources.
• Increase shareholder employment and
development opportunities.
• Support educational, cultural and
social initiatives that positively affect
shareholders and descendants.
• Help to develop economic opportunities
in the Bristol Bay region.

17ABOUT BBNC
MOMENTUMFINANCIALS FY2018
16 BBNC FY2018 ANNUAL REPORT 17FINANCIALS
MANAGEMENT’S DISCUSSION AND ANALYSISManagement’s Discussion and Analysis (MD&A) is intended to provide readers of the financial statements with a narrative of the company’s financial condition as seen through the eyes of management. The MD&A should be read together with the Consolidated Financial Statements and accompanying Notes included in this Annual Report. Within the MD&A, we make certain state-ments that are forward-looking in nature. In making these statements, we use current information and our expecta-tions of future events; these are subject to assumptions,
risks and uncertainties that could change at any time and could cause actual results to differ materially from those expressed or implied by such statements, and these should be considered with the understanding of their inherent uncertainty. Forward-looking statements included in the MD&A are made only as of the date of this MD&A, and we assume no obligation to update any written or oral forward-looking statements made by us or on our behalf as a result of new information, future events or other factors.
CORPORATE PROFILE
FISCAL YEAR
2018 2017 2016
BBNC revenues $ 1,659,345,000 1,525,181,000 1,512,022,000
BBNC earnings before interest, taxes, and noncontrolling interests $ 58,761,000 66,410,000 38,759,000
BBNC earnings after interest, taxes, and noncontrolling interests $ 103,063,000 41,021,000 43,689,000
Cash provided by operating activities $ 45,687,000 94,985,000 74,154,000
Regular dividends declared $ 20,200,000 18,796,000 17,499,000
Regular dividends per share $ 37 35 32
Regular shares outstanding 540,100 540,100 540,100
Average shareholder hire 198 202 171
Bristol Bay Native Corporation (BBNC or the Corporation) is an Alaska Native Regional Corporation created pursuant to the Alaska Native Claims Settlement Act of 1971 (ANC-SA). Congress enacted ANCSA to resolve longstanding conflicts surrounding aboriginal land claims in Alaska and to stimulate economic development throughout Alaska. The Corporation was incorporated as a for-profit corpo-ration to benefit Alaska Natives with ties to the Bristol Bay region and at March 31, 2018, the Corporation had 10,376 shareholders. ANCSA provided the Corporation with a monetary entitlement from the federal government of $32.7 million and the right to 3,079,553 acres of federal lands. At March 31, 2018, stockholders’ equity retained by the Corporation has grown to $480.0 million, and cash dis-tributions to shareholders have exceeded $220.0 million.
BBNC is primarily a holding company and as such derives substantially all of its cash flow from its subsidiaries and its portfolio of passive investments which are the Company’s primary two asset allocations. We rely on profits from both to repay our creditors, to fund shareholder dividends, to
fund shareholder education opportunities and to fund corporate general and administrative costs. BBNC’s ability to fund each of these cash uses and to simultaneously grow the Corporation’s assets is subject to the profitability of our subsidiary businesses and the portfolio.
The BBNC Board of Directors approved a five-year stra-tegic plan for FY2017 through FY2021. The plan and the Corporation’s efforts focus on the pursuit of the following six strategic goals:
• Build the financial strength of BBNC.
• Pay predictable and increasing shareholder dividends.
• Balance responsible development and protection of our lands, fisheries and resources.
• Increase shareholder employment and development opportunities.
18 19BBNC FY2018 ANNUAL REPORT FINANCIALS
In order to increase the footprint of the benefits afforded by 8(a) contracting opportunities to our shareholders, village corporations and tribes within the Bristol Bay region, the Corporation is currently implementing a strategic initia-tive that includes establishing joint ventures and mentor protégé arrangements between BBNC government con-tracting subsidiaries and participating village corporations and tribes within the Bristol Bay region.
Branded as BBNC’s In-Region Government Contracting (IGC) initiative, the goals are as follows:
• increase in-region federal contract awards and successful performance rates,
• leverage BBNC subsidiaries capacity, experience and knowledge,
• create returns for BBNC, tribes and village corporations, and
• develop and provide extensive training to village corporations and tribes and their managers to increase their knowledge of federal government contracting programs and regulations and corporate governance to ensure full compliance for government contracting requirements.
Through the IGC initiative, BBNC developed three module training programs consisting of three two-day segments on topics such as corporate governance and formation, understanding financial statements, govern-ment contracting 101, 8(a) eligibility and applications and SBA compliance. As part of the IGC initiative, BBNC brings its experience to bear in aiding the village corporations and tribes to prepare to bid, win and perform contracts all while providing a level of quality to our customers that is consistent with BBNC’s long history of being a valued contractor to the federal government.
Investment earnings from the Portfolio are expected to be below those of FY2018. However, it should be noted that FY2018 was an exceptionally strong year for the market. Our asset allocation strategy within the Portfolio is meant to accomplish a desired rate of return with the least risk possible. Nonetheless, the returns we will experience will be reflective of broader trends in world financial markets.
BBNC continues to seek out attractive investments in the form of new acquisitions and “bolt-on” acquisitions to our existing business lines. We anticipate financing acquisitions through a mix of equity and debt capital. The Corporation’s debt load remains modest and we continue to enjoy access to abundant, low-cost debt financing. Both factors enable the Corporation to take on additional debt for acquisitions if and when deemed appropriated by management.
• Support educational, cultural and social initiatives that positively affect shareholders and descendants.
• Help to develop economic opportunities in the Bristol Bay region.
In order to meet the strategic goals, the Corporation must generate sufficient earnings. To that end, BBNC’s assets have been allocated to a variety of businesses that operate throughout Alaska and across the United States. As noted above, the Corporation’s assets are primarily allocated in two key areas: to a passive portfolio of investments (the Portfolio) and to our operating subsidiary compa-nies. There is also a small allocation to corporate assets which includes the Corporation’s headquarters building in Anchorage, Alaska.
The Portfolio is comprised of a variety of assets including marketable securities and liquid and non-liquid alternative investments. Management classifies the operating subsidiaries into four distinct business lines which are:
• Construction
• Government Services
• Industrial Services
• Tourism
The Corporation also has earnings from natural resource activities that are primarily comprised of certain revenue sharing payments received from other Alaska Native cor-porations as required under ANCSA.
The following pages are management’s outlook for FY2019 and view of the Corporation’s FY2018 results in total, for the Portfolio and of the business lines. In order to improve readability, in some cases these results are presented in a different format than the Consolidated Financial Statements.
FY2019 OUTLOOKManagement expects FY2019 to bring both challenges and opportunities across the broad landscape of BBNC’s business activities. Management expects overall earnings before income taxes to be greater in FY2019, due to consis-tent profit in most business lines and a significant reduction of losses in Industrial Services.
One of the largest subsidiaries in the Industrial Services business line is Peak Oilfield Service Company LLC (Peak). Peak and the other subsidiaries in this business line conduct substantially all of their operations within the State of Alaska. Uncertainty in the Alaska oil and gas industry driven by the precipitous drop in oil prices during FY2016 negatively affected earnings of our companies in this business line in FY2018. To what extent we will see increased recovery of revenues and margins remains to be seen. However, risks have been somewhat mitigated by the strong position-ing of our subsidiaries within the industry, and significant reductions in operating costs. Our companies are some of the safest and most efficient contractors working in Alaska, providing many services that are essential to our custom-ers. Our large fleet of exceptionally maintained equipment stands ready to serve the needs of our customers and our
customer base includes some of the strongest oil and gas companies operating in the state.
The Construction business line is expected to generate earnings slightly below those seen in FY2018. The federal government is the largest customer in the business line. Downward pressure on earnings continues to come from a variety of sources including continued negative changes to the Small Business Administration’s 8(a) program and from an operating environment where competitors are willing to work for slim margins. Our goal is to provide work for our customers at a price that results in the overall best value to the customer but also provides a profit for our shareholders.
The federal government is the primary customer for the Government Services business line. Challenges to the 8(a) program previously mentioned form headwinds in the industry. Earnings in FY2019 are expected to remain consistent from levels seen in recent years. Last year, BBNC made certain changes to the strategic alignment and management team within the business line in order to respond to the needs of our customers.

20 21BBNC FY2018 ANNUAL REPORT FINANCIALS
INDUSTRIAL SERVICES
The following table displays results of Industrial Services earnings, before interest and taxes for the fiscal year ended (in thousands):
FISCAL YEAR
2018 2017 2016
REVENUES
Industrial Services $ 867,764 764,541 788,107
COSTS AND EXPENSES
Industrial Services 872,822 767,941 772,132
Earnings from Industrial Services $ (5,058) (3,400) 15,975
The Industrial Services business line consists of the hold-ing company Bristol Bay Industrial, LLC and its companies Peak, Kakivik Asset Management (Kakivik), CCI Industrial Services (CIS), Alaska Directional, LLC, PetroCard and Bristol Alliance Fuels, LLC (BAF). Peak provides specialty services to the oil and gas industry in locations includ-ing Alaska’s Prudhoe Bay, Anchorage, Kenai, Valdez, and Palmer, and to a small extent, North Dakota. Peak provides a wide variety of services including crane services, rig moving, ice road construction, drilling support, general civil work, construction, trucking, facility operations and maintenance support, tank cleaning, and power systems. Kakivik specializes in nondestructive testing and inspec-tion. CIS provides a diverse array of specialty services to the oil and gas industry. Alaska Directional, LLC provides project management, directional drilling, trenching, plow-ing, cellular towers, and communications infrastructure services. PetroCard, a reputable fuel distributor in the Pacific Northwest, is based in Kent, Washington and
distributes fuel products through cardlock sites, mobile fueling and wholesale sales to commercial customers through facilities located primarily in Washington and Oregon. BAF, a fuel distributor in Dillingham, Alaska, helps to fulfill BBNC’s strategic goals of developing econom-ic opportunities in the Bristol Bay region, building the financial strength of BBNC, and increasing sharehold-er employment and development opportunities. The success of the Industrial Services business line can be attributed to the focus on quality safety programs that customers demand in this industry.
The Industrial Services business line is the Corporation’s largest source of shareholder hire. Average shareholder hire for this business line was 115 individuals with wages in excess of $8.4 million paid to shareholders in FY2018. The Industrial Services business line is expected to continue to play a key role in pursuit of the goals established within the Corporation’s strategic plan.
RESULTS OF OPERATIONSCONSOLIDATED RESULTS
The following table displays Consolidated Results for the fiscal year ended (in thousands except earnings per share and weighted average shares outstanding):
FISCAL YEAR
2018 2017 2016
REVENUES
Operating business lines $ 1,619,162 1,491,404 1,503,960
Investment earnings 27,959 24,789 (63)
Natural resources and royalty income 10,677 6,904 5,954
Other 1,547 2,084 2,171
Total revenue 1,659,345 1,525,181 1,512,022
COSTS AND EXPENSES
Cost of operating business lines 1,573,247 1,436,309 1,446,837
Cost of investment management 1,432 962 1,765
Corporate general and administrative expense 23,385 19,266 21,248
Interest 1,885 1,714 (107)
Other 2,520 2,234 3,413
1,602,469 1,460,485 1,473,156
Earnings from operations 56,876 64,696 38,866
Income tax benefit (expense) 46,348 (23,564) 4,875
Net earnings 103,224 41,132 43,741
Less income attributable to noncontrolling interest (161) (111) (52)
Net earnings attributable to Bristol Bay Native Corporation $ 103,063 41,021 43,689
Earnings per share $ 191 76 81
Weighted average shares outstanding 540,100 540,100 540,100
BBNC’s FY2018 earnings from operations were less than experienced in the previous fiscal year. Revenues from the operating business lines were $127.8 million higher than the prior year, primarily due to the effect the increase in gallons sold and fuel price per gallon had on the rev-enues of Industrial Services. Revenues from our portfolio investment earnings were more than the prior year by $3.2 million and were primarily due to better than expected returns from Corporation’s liquid alternative holdings and U.S. equity holdings.
Costs of the operating business lines were more than the prior year by $136.9 million, which was primarily due to the effect of the increase in gallons sold and fuel price per gallon on the expenses of Industrial Services. BBNC’s net earnings were $62.0 million more than prior year which equates to an increase in earnings per share of $115 from the prior year.
22 23BBNC FY2018 ANNUAL REPORT FINANCIALS
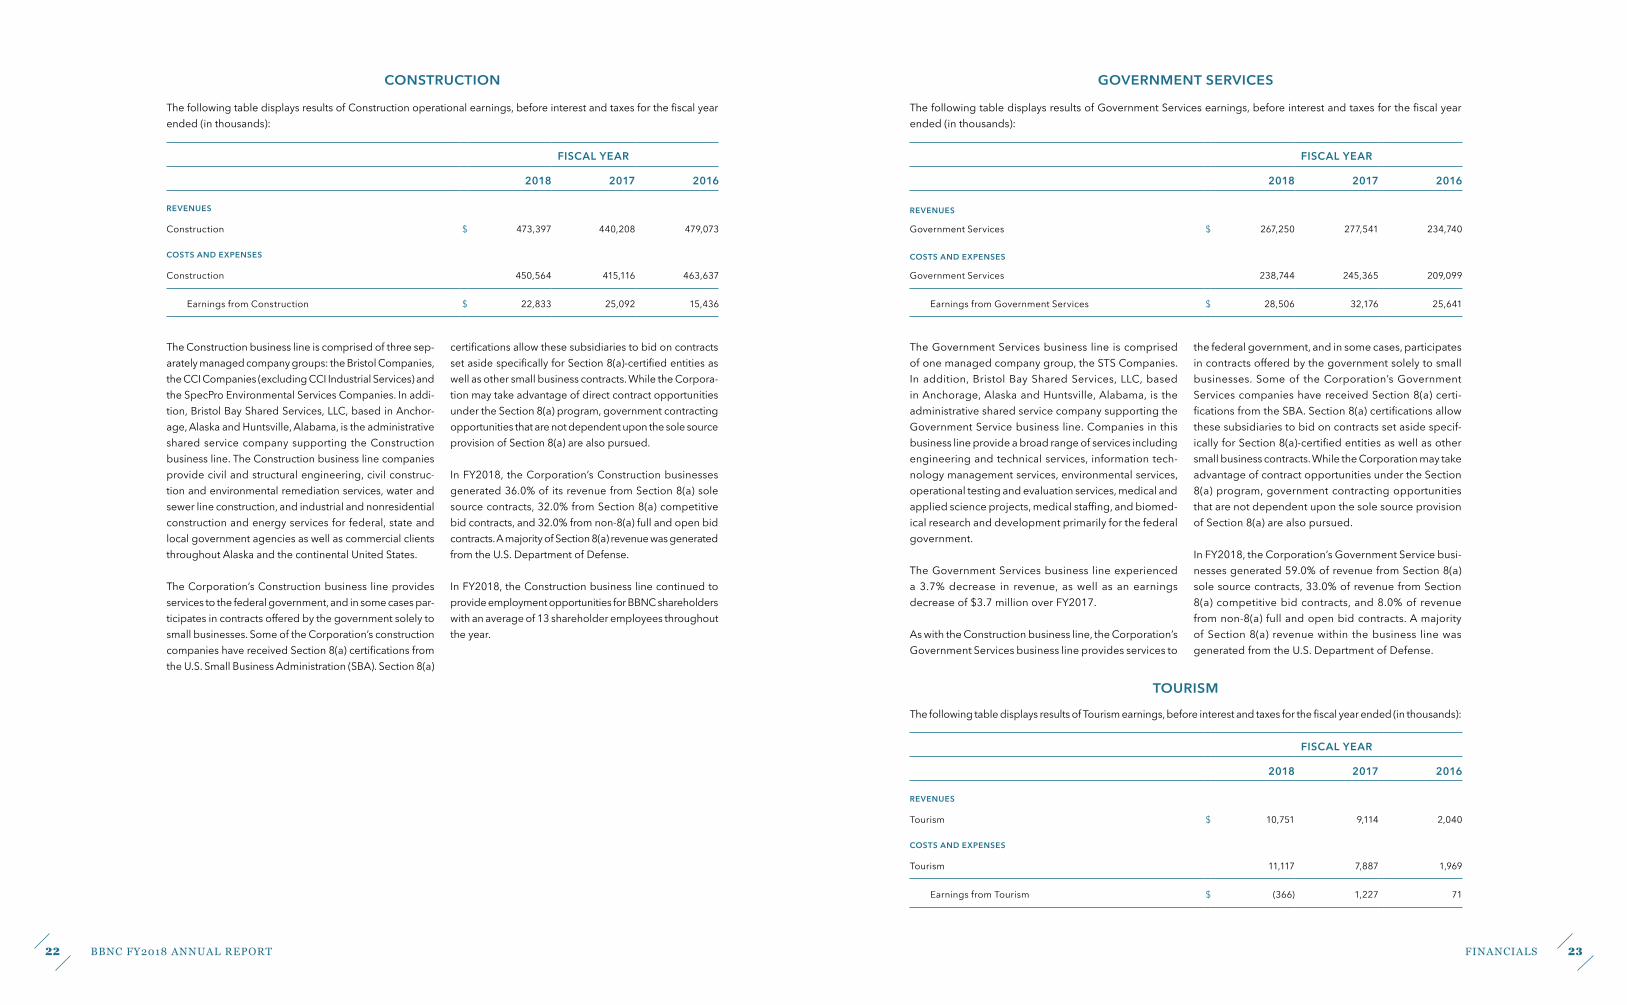
GOVERNMENT SERVICES
The following table displays results of Government Services earnings, before interest and taxes for the fiscal year ended (in thousands):
FISCAL YEAR
2018 2017 2016
REVENUES
Government Services $ 267,250 277,541 234,740
COSTS AND EXPENSES
Government Services 238,744 245,365 209,099
Earnings from Government Services $ 28,506 32,176 25,641
The Government Services business line is comprised of one managed company group, the STS Companies. In addition, Bristol Bay Shared Services, LLC, based in Anchorage, Alaska and Huntsville, Alabama, is the administrative shared service company supporting the Government Service business line. Companies in this business line provide a broad range of services including engineering and technical services, information tech-nology management services, environmental services, operational testing and evaluation services, medical and applied science projects, medical staffing, and biomed-ical research and development primarily for the federal government.
The Government Services business line experienced a 3.7% decrease in revenue, as well as an earnings decrease of $3.7 million over FY2017.
As with the Construction business line, the Corporation’s Government Services business line provides services to
the federal government, and in some cases, participates in contracts offered by the government solely to small businesses. Some of the Corporation’s Government Services companies have received Section 8(a) certi-fications from the SBA. Section 8(a) certifications allow these subsidiaries to bid on contracts set aside specif-ically for Section 8(a)-certified entities as well as other small business contracts. While the Corporation may take advantage of contract opportunities under the Section 8(a) program, government contracting opportunities that are not dependent upon the sole source provision of Section 8(a) are also pursued.
In FY2018, the Corporation’s Government Service busi-nesses generated 59.0% of revenue from Section 8(a) sole source contracts, 33.0% of revenue from Section 8(a) competitive bid contracts, and 8.0% of revenue from non-8(a) full and open bid contracts. A majority of Section 8(a) revenue within the business line was generated from the U.S. Department of Defense.
TOURISM
The following table displays results of Tourism earnings, before interest and taxes for the fiscal year ended (in thousands):
FISCAL YEAR
2018 2017 2016
REVENUES
Tourism $ 10,751 9,114 2,040
COSTS AND EXPENSES
Tourism 11,117 7,887 1,969
Earnings from Tourism $ (366) 1,227 71
CONSTRUCTION
The following table displays results of Construction operational earnings, before interest and taxes for the fiscal year ended (in thousands):
FISCAL YEAR
2018 2017 2016
REVENUES
Construction $ 473,397 440,208 479,073
COSTS AND EXPENSES
Construction 450,564 415,116 463,637
Earnings from Construction $ 22,833 25,092 15,436
The Construction business line is comprised of three sep-arately managed company groups: the Bristol Companies, the CCI Companies (excluding CCI Industrial Services) and the SpecPro Environmental Services Companies. In addi-tion, Bristol Bay Shared Services, LLC, based in Anchor-age, Alaska and Huntsville, Alabama, is the administrative shared service company supporting the Construction business line. The Construction business line companies provide civil and structural engineering, civil construc-tion and environmental remediation services, water and sewer line construction, and industrial and nonresidential construction and energy services for federal, state and local government agencies as well as commercial clients throughout Alaska and the continental United States.
The Corporation’s Construction business line provides services to the federal government, and in some cases par-ticipates in contracts offered by the government solely to small businesses. Some of the Corporation’s construction companies have received Section 8(a) certifications from the U.S. Small Business Administration (SBA). Section 8(a)
certifications allow these subsidiaries to bid on contracts set aside specifically for Section 8(a)-certified entities as well as other small business contracts. While the Corpora-tion may take advantage of direct contract opportunities under the Section 8(a) program, government contracting opportunities that are not dependent upon the sole source provision of Section 8(a) are also pursued.
In FY2018, the Corporation’s Construction businesses generated 36.0% of its revenue from Section 8(a) sole source contracts, 32.0% from Section 8(a) competitive bid contracts, and 32.0% from non-8(a) full and open bid contracts. A majority of Section 8(a) revenue was generated from the U.S. Department of Defense.
In FY2018, the Construction business line continued to provide employment opportunities for BBNC shareholders with an average of 13 shareholder employees throughout the year.

24 25BBNC FY2018 ANNUAL REPORT FINANCIALS
Natural Resource earnings consist primarily of 7(i) revenue sharing, net of the 50% distribution to village corporations and at-large shareholders that the Corporation receives from other regional Alaska Native Corporations. 7(i) receipts received are primarily from NANA Regional Corporation and Arctic Slope Regional Corporation. The Corporation distributes 50% of these receipts to village corporations and at-large shareholders as 7(j) payments.
Revenue from the sale of the Corporation’s natural resources, primarily gravel, rock and sand, is driven largely by resource development and infrastructure improvement activities in the Bristol Bay region. Revenues from the sale of natural resources tend to fluctuate from year-to-year. The Corpo-ration continues to advocate for responsible development of natural resources on BBNC lands and other lands within the BBNC region. We are committed to supporting a strong business climate that encourages investment in natural resource activities throughout the entire State of Alaska.
GENERAL AND ADMINISTRATIVE EXPENSESCorporate general and administrative expenses (G&A) increased from $19.3 million in FY2017 to $23.4 million in FY2018. G&A expenses are incurred by the Corporation in its efforts to provide corporate governance and oversight of its increasingly complex subsidiary operations, pursue new investments, protect the Corporation’s assets and
provide shareholder services. Corporate G&A increased by $4.0 million, primarily as a result of additional health insurance and workers compensation claims incurred on the Corporation’s self-insured plans in FY2018. G&A as a percentage of revenue was 1.4%, 1.3% and 1.4% in FY2018, FY2017 and FY2016, respectively.
TAXESThe following table displays our income tax (benefit) expense for the fiscal year ended (in thousands):
FISCAL YEAR
2018 2017 2016
Current income tax (benefit) expense $ (6,471) 21,160 (1,558)
Deferred income tax (benefit) expense (39,877) 2,404 (3,317)
Total income tax (benefit) expense $ (46,348) 23,564 (4,875)
Total tax (benefit) expense is comprised of current and deferred federal and state taxes which are primarily income based. To a lesser extent, the Corporation is subject to certain foreign income tax expense. Current tax expense represents expected taxes the Corporation will pay to taxing authorities on taxable income generated within the fiscal year plus or minus any prior year tax adjustments. Deferred tax expense represents the current year change in deferred tax assets net of changes in the Corporation’s deferred tax liabilities. Deferred tax assets and liabilities arise in the normal course of business and represent future differences between taxable income and book income
reported in the Corporation’s annual report. These differ-ences are expected and exist because of a lack of parity with respect to when certain items of income and expense are recognized under the tax code compared to treat-ment under Generally Accepted Accounting Principles. Our average blended tax rate is approximately 31.5% of earnings from operations.
During 2018, the Corporation sold oil and gas rights rec-ognizing a significant tax loss generating net operating losses, resulting in a deferred income tax benefit.
The Tourism business line consists of the holding company Bristol Bay Alaska Tourism, LLC and its companies Katmailand, Inc., Katmai Air, LLC, Katmai Lodge, LLC, Katmai Air Leasing, LLC, and Mission Lodge. The Katmai companies provide visitors with world renowned sport fishing, bear viewing, and lodging in Katmai National Park, located in Bristol Bay. Mission Lodge is an all-inclusive seasonal
fishing lodge on Lake Aleknagik near Dillingham in Bristol Bay. The Tourism business line provides opportunity for shareholder hire and development in the region. Management continues to seek opportunities to grow the Tourism business line through targeted acquisitions throughout the Bristol Bay region.
PORTFOLIO INVESTMENTS
The following table displays results of the Portfolio for the fiscal year ended (in thousands):
FISCAL YEAR
2018 2017 2016
REVENUES
Investment earnings (losses) $ 27,959 24,789 (63)
COSTS AND EXPENSES
Investment management 1,432 962 1,765
Earnings (losses) from Investments $ 26,527 23,827 (1,828)
The Corporation recognizes Portfolio earnings primarily from investments in public and private passive invest-ments including marketable securities, private equity placements and a number of commercial real estate investments located primarily in Anchorage, Alaska.
The Portfolio is managed pursuant to an investment policy which provides for a diversified asset allocation of equity securities, alternative investments, fixed income securi-ties, and cash. Real estate and alternative investments are often private, non-publicly-traded equity interests. The allocation to each of these four investment classes was developed with the help of the Corporation’s external investment advisor using modern portfolio theory. The
established policy allocation to different investment classes is designed to achieve a target annual return of 8.1% while exposing the Corporation to the lowest level of risk possible. At March 31, 2018, the total market value of the Portfolio was $223.1 million compared to $194.3 million at March 31, 2017. Portfolio holdings in private, non-publicly-traded investments were $72.4 million at March 31, 2018, compared to $54.7 million at March 31, 2017. The Corporation’s Portfolio generated investment earnings of $28.0 million, reflective of the broader trends in the equity markets, during 2018. The Corporation’s Portfolio returns are benchmarked against a custom index that approximates our investment allocation targets.
NATURAL RESOURCE MANAGEMENT
The following table displays results of Natural Resource earnings for the fiscal year ended (in thousands):
FISCAL YEAR
2018 2017 2016
REVENUES
Natural Resources
7(i) revenue sharing net of 7(j) distributions $ 10,375 6,713 5,671
Natural Resources 302 191 283
Earnings from Natural Resources $ 10,677 6,904 5,954

26 27BBNC FY2018 ANNUAL REPORT FINANCIALS
FISCAL YEAR
2018 2017 2016
Total available line of credit 53,582 32,307 59,077
Total liquidity $ 203,719 200,753 230,108
To meet both our short- and long-term liquidity require-ments we look to a variety of funding sources, both inter-nal and external. Our primary source of liquidity is cash generated from operating activities and from Portfolio earnings. In order to meet additional liquidity needs at the parent level, the Corporation has a line of credit with which it may draw upon to fund cash needs. The primary
line of credit has a ceiling of $75 million and is secured by marketable securities. If further acquisition opportunities arise, the Corporation will consider the costs and benefits of additional debt sources. Our cash flow from operations and access to short-term debt gives management confi-dence that the Corporation’s liquidity needs can be met in both the short- and long-term.
SIGNIFICANT SOURCES AND USES OF CAPITALThe following table displays sources/uses of cash and capital structure for the fiscal year ended (in thousands):
FISCAL YEAR
2018 2017 2016
SOURCES/USES OF CAPITAL
Cash flows from operating activities $ 45,687 94,985 74,154
Cash flows from investing activities (30,080) (53,726) (42,343)
Cash flows from financing activities (76,151) (28,427) (21,948)
Increase (decrease) in cash and cash equivalents $ (60,544) 12,832 9,863
CAPITAL STRUCTURE
Short and long-term debt $ 39,577 97,483 107,417
Total shareholders’ equity 480,031 397,315 374,676
Total capital $ 519,608 494,798 482,093
Debt to equity ratio 8.24% 24.54% 28.67%
OPERATING ACTIVITIES
The operating activity section of the statement of cash flows reconciles net income to the amount of cash provid-ed by operating transactions. Cash flows from operating activities was $45.7 million which was primarily comprised of net income of $103.2 million plus depreciation expense of $22.6 million less $26.1 million in gain on sale of marketable securities and $39.9 million in deferred tax benefits. For FY2017, cash flows from operating activities
was $95.0 million which was primarily comprised of net income of $41.1 million plus depreciation expense of $24.2 million and other changes in working capital. For FY2016, cash flows from operating activities was $74.2 million which was primarily comprised of net income of $43.7 million plus depreciation expense of $25.9 million and other changes in working capital.
BALANCE SHEETThe following table displays key balance sheet data as of March 31, for the fiscal year ended (in thousands):
FISCAL YEAR
2018 2017 2016
Cash and cash equivalents $ 24,615 85,159 72,327
Marketable securities 150,763 139,563 141,427
Other current assets 220,019 180,898 168,834
Investment in unconsolidated affiliates 29,994 19,187 21,421
Other investments 42,359 35,519 22,099
Other assets 3,139 3,994 3,604
Deferred taxes 14,096 0 0
Property, plant and equipment, net 148,344 155,240 161,012
Goodwill and intangible assets 66,531 66,942 52,326
Total assets 699,860 686,502 643,050
Current liabilities 185,254 179,365 151,501
Long-term liabilities 34,575 109,822 116,873
Total shareholders’ equity 480,031 397,315 374,676
Cash and cash equivalents decreased primarily due to the Corporation’s reinvestment in marketable securities and other investments. Other investments continue to increase as the Corporation increases its investments in alternative investments held in partnership and partner-ship-like entities where the Corporation owns less than 100% of the entity. Property, plant and equipment, net of depreciation, decreased from FY2017 to FY2018 due
to additional depreciation primarily at Peak and a write off of fixed assets in FY2018. Peak owns and operates a significant fleet of equipment and vehicles.
Long-term liabilities decreased from FY2017 to FY2018 as the Corporation continues to pay down long-term debt. BBNC shareholders equity continues to grow as a result of increased earnings net of dividends paid to shareholders.
LIQUIDITY AND CAPITAL RESOURCESThe following table displays total liquidity and capital resources as of March 31, for the fiscal year ended (in thousands):
FISCAL YEAR
2018 2017 2016
AVAILABLE FUNDS
Cash and cash equivalents $ 24,615 85,159 72,327
Marketable securities 150,763 139,563 141,427
Less: collateral on marketable securities (25,241) (56,276) (42,723)
Total available funds $ 150,137 168,446 171,031
AVAILABLE LINE OF CREDIT
Total line of credit 57,332 35,607 62,277
Less: outstanding letters of credit (3,750) (3,300) (3,200)

28 29BBNC FY2018 ANNUAL REPORT FINANCIALS
piloting, health and human services, occupational safety and health training, and medical assistant training. Provid-ing increased support for these types of programs is one of the Foundation’s long-term objectives.
Recognizing the value of job skills that do not require four-year college degrees, the Foundation also awards scholarships to help pay for vocational training and provides assistance for shareholders to attend various vocational training programs. This program specifically assists those that are in need of specialized certification or training in order to enhance their employment or career opportunities. In many instances, vocational assistance recipients, who are also shareholders, have used their certifications to be eligible for employment by the Cor-poration and its subsidiaries. The Corporation funded over $1.0 million in contributions to the BBNC Education Foundation in FY2018.
The Corporation further hosts the Bristol Bay Leadership Forum, a two-day session that provides Bristol Bay area vil-lage corporation, village council, borough, and city council leaders with an opportunity to meet with business, govern-
ment, and Native leaders, to share experiences, discuss issues affecting the people they represent, explore solutions to common problems and to consider new opportunities that may help lead to economic, educational and cultural benefits.
In FY2012, the Corporation initiated an Elder’s Benefit Program. Eligible original shareholders age 65 or older began receiving a benefit of $125 per quarter beginning in the third quarter of FY2012. In October 2013, share-holders approved establishment and funding of an Elders’ settlement trust, which was funded with a $10.8 million contribution from the Corporation in FY2015. Distributions from the trust to eligible shareholders are not taxable to the shareholders to the extent they are paid out of the current year or cumulative undistributed income of the trust.
The Corporation’s operations allow BBNC to provide meaningful career opportunities for our shareholders. During FY2018, our shareholder employment was a total of 198 shareholder employees. Total shareholder wages paid in FY2018 were $14.1 million. We continue to focus on expanding opportunities for shareholder employment.
CRITICAL ACCOUNTING ESTIMATESThe Corporation’s consolidated financial statements are prepared in accordance with generally accepted accounting principles. Significant accounting policies are discussed in note 1 Nature of Operations and Sum-mary of Significant Accounting Policies accompanying the consolidated financial statements of this report. In connection with the preparation of the financial state-ments, management is required to make assumptions and estimates about future events, and apply judgments that affect the reported amounts of assets, liabilities, revenues, expenses and related disclosures. Amounts recognized in the financial statements from such esti-
mates are necessary based on numerous assumptions involving varying and potentially significant degrees of judgment and uncertainty. Actual results may differ from management’s assumptions and estimates.
Areas in which accounting estimates could be different from the final results include accounts receivable, esti-mates of total contract costs for fixed price contracts, the fair value of investments, impairment of long-live assets, intangibles and goodwill, the tax valuation of oil and gas rights, and deferred tax assets, among others.
INVESTING ACTIVITIES
Net cash activity from investment activity is typically con-sistent unless significant acquisition activity occurs during a fiscal year. FY2018, FY2017 and FY2016 are reflective
of the Corporation’s normalized uses of cash for investing activities on a year-to-year basis.
FINANCING ACTIVITIES
Financing activities include transactions involving share-holder dividends, noncontrolling interests and borrowings and repayments of debt. Cash used by financing activities in FY2018 includes shareholder dividends of $20.1 mil-lion. FY2018 had increased cash flows used in financing activities due to increased payment on the line of credit compared to subsequent years.
Our total capital structure consists of the original monies received by the Corporation under ANCSA on behalf of its shareholders, funds provided by debt financing arrange-ments and accumulated earnings that have not been paid out in dividends. The overall increase in total capital in FY2018 is comprised of the fiscal year earnings offset by dividends paid.
We continue to monitor the Corporation’s debt-to-equity ratio and intend to maintain an appropriate balance of debt and liquidity. Management expects that doing so will enable us to both meet our financial obligations and ready the Corporation to take advantage of strategic opportunites in the future.
BBNC retains ownership of approximately 3.1 million acres of subsurface and approximately 100,000 acres of surface real estate. BBNC shareholder’s equity does not include the value of lands conveyed as a result of ANCSA, which cannot be readily estimated. Consistent with most Alaska Native Corporations, the Corporation did not record a value for such lands due to the inability to establish the value of those lands at the time of conveyance, especially considering the time and expense of obtaining appraisals.
DIVIDENDS AND SHAREHOLDER BENEFITSThe following table displays total dividends paid in each of the fiscal years ended (in thousands):
FISCAL YEAR
2018 2017 2016
Regular dividends declared $ 20,200 18,796 17,499
Cumulative dividends declared, since inception $ 220,872 200,672 181,876
Many of the benefits provided to our shareholders are a result of profits derived from federal government contract-ing. The Corporation’s long-term strategy is to enhance its financial strength while paying increasing shareholder dividends and promoting educational and employment opportunities. The core of our success is our focus on education and protecting our cultural heritage. We are committed to training our future generations. Since 1986, the Corporation has provided education scholarships to its shareholders pursuing both higher education degrees and vocational certifications.
In 1992, BBNC formally incorporated the BBNC Education Foundation (the Foundation) as a 501(c)(3) entity and has continued to invest in education and training through the Foundation. Scholarship recipients have graduated with bachelors, masters, and other advanced degrees, such as a Ph.D. in Anthropology, Doctors of Medicine, Doctors of Veterinary Medicine, Juris Doctor (Law), and degrees in engineering, business administration, education, nursing, guidance counseling, environmental science, economics and philosophy and associate degrees and other vocation-al certifications in dental therapy, culinary arts, professional

30 31BBNC FY2018 ANNUAL REPORT FINANCIALS
INDEPENDENT AUDITORS’ REPORTThe Board of Directors and Stockholders Bristol Bay Native Corporation:
We have audited the accompanying consolidated financial statements of Bristol Bay Native Corporation and its subsid-iaries, which comprise the consolidated balance sheets as of March 31, 2018 and 2017, and the related consolidated statements of operations, changes in stockholders’ equity, and cash flows for each of the years in the three-year period ended March 31, 2018, and the related notes to the consolidated financial statements.
MANAGEMENT’S RESPONSIBILITY FOR THE FINANCIAL STATEMENTS
Management is responsible for the preparation and fair presentation of these consolidated financial statements in accordance with U.S. generally accepted accounting principles; this includes the design, implementation, and main-tenance of internal control relevant to the preparation and fair presentation of consolidated financial statements that are free from material misstatement, whether due to fraud or error.
AUDITORS’ RESPONSIBILITY
Our responsibility is to express an opinion on these consolidated financial statements based on our audits. We conducted our audits in accordance with auditing standards generally accepted in the United States of America. Those standards require that we plan and perform the audit to obtain reasonable assurance about whether the consolidated financial statements are free from material misstatement.
An audit involves performing procedures to obtain audit evidence about the amounts and disclosures in the consoli-dated financial statements. The procedures selected depend on the auditors’ judgment, including the assessment of the risks of material misstatement of the consolidated financial statements, whether due to fraud or error. In making those risk assessments, the auditor considers internal control relevant to the entity’s preparation and fair presentation of the consolidated financial statements in order to design audit procedures that are appropriate in the circumstances, but not for the purpose of expressing an opinion on the effectiveness of the entity’s internal control. Accordingly, we express no such opinion. An audit also includes evaluating the appropriateness of accounting policies used and the reasonableness of significant accounting estimates made by management, as well as evaluating the overall presentation of the consolidated financial statements.
We believe that the audit evidence we have obtained is sufficient and appropriate to provide a basis for our audit opinion.
OPINION
In our opinion, the consolidated financial statements referred to above present fairly, in all material respects, the financial position of Bristol Bay Native Corporation and its subsidiaries as of March 31, 2018 and 2017, and the results of their operations and their cash flows for each of the years in the three-year period ended March 31, 2018, in accordance with U.S. generally accepted accounting principles.
Anchorage, Alaska June 8, 2018
TEN YEAR FINANCIAL SUMMARY(In thousands except share data, ratios, and percentages)
2018 2017 2016 2015 2014 2013 2012 2011 2010 2009
REVENUES
Investment income $ 27,959 24,789 (63) 11,442 25,167 14,254 5,537 14,935 23,282 (34,293)
Industrial Services 867,764 764,541 788,107 1,069,079 1,153,597 1,136,637 1,212,609 986,510 825,659 1,041,693
Construction 473,397 440,208 479,073 414,033 404,907 517,799 449,868 401,608 375,776 268,503
Government Services 267,250 277,541 234,740 228,720 240,823 282,821 287,186 256,247 152,199 102,296
Tourism 10,751 9,114 2,040 1,861 1,890 1,493 0 0 0 0
Natural Resources 10,677 6,904 5,954 10,186 8,396 6,524 9,877 7,648 3,965 12,706
Other income (1) 1,547 2,084 2,171 763 1,114 2,252 430 252 1,515 666
TOTAL OPERATING REVENUE 1,659,345 1,525,181 1,512,022 1,736,084 1,835,894 1,961,780 1,965,507 1,667,200 1,382,396 1,391,571COSTS AND EXPENSES (1) 1,602,469 1,460,485 1,473,156 1,662,248 1,753,661 1,892,521 1,898,335 1,597,930 1,346,170 1,394,362
Earnings from operations 56,876 64,696 38,866 73,836 82,233 69,259 67,172 69,270 36,226 (2,791)
Income tax benefit (expense), net of extraordinary benefit
46,348 (23,564) 4,875 (28,000) (33,047) (27,941) 3,054 (26,253) (4,289) 8,853
Earnings applicable to noncontrolling interests
(161) (111) (52) (945) (36) 0 0 0 0 (888)
NET EARNINGS (LOSS) $ 103,063 41,021 43,689 44,891 49,150 41,318 70,226 43,017 31,937 5,174
CASH FLOW DATA
Net cash provided by operating activities
$ 45,687 94,985 74,154 89,618 120,534 30,489 36,975 17,484 5,631 56,439
Net capital expenditures 15,106 13,772 10,656 19,552 7,215 18,014 16,992 5,669 5,750 8,548
Addition (reduction) to long-term debt
(57,906) (9,934) (3,727) (862) 62,851 18,974 (11,648) (2,731) 6,884 (11,146)
Dividends paid 20,111 18,796 17,499 27,313 14,981 13,883 12,070 7,453 6,913 6,481
SHAREHOLDER DATA
Earnings (loss) per share $ 191.00 76.00 81.00 83.00 91.00 76.51 130.02 79.65 59.13 9.58
Dividends per share 37.40 34.80 32.40 30.00 27.00 25.00 22.00 13.80 12.80 12.00
Return on average stockholders’ equity
23.5% 10.6% 11.7% 12.9% 14.8% 14.6% 29.2% 22.2% 19.6% 3.4%
FINANCIAL POSITION
Cash and equivalents $ 24,615 85,159 72,327 62,464 49,471 38,214 46,135 35,118 25,521 26,170
Working capital (1) 59,380 86,692 89,660 89,135 59,827 37,931 71,655 10,469 27,479 34,340
Marketable equity securities at fair market value
150,763 139,563 141,427 133,445 136,807 176,781 115,202 97,830 84,820 59,645
Property, plant and equipment, at cost
148,344 155,240 161,012 170,630 174,337 70,263 56,940 46,481 46,748 47,170
Total assets 699,860 686,502 643,050 656,621 629,922 559,034 518,703 448,322 370,456 305,896
Long-term debt (including current maturities)
39,577 97,483 107,417 111,144 112,006 49,155 30,181 41,829 44,560 37,676
Stockholders’ equity 480,031 397,315 374,676 349,376 330,897 296,732 269,297 211,141 175,577 150,553
RATIOS
Current ratio (1) 1.3 1.5 1.6 1.5 1.3 1.2 1.3 1.1 1.2 1.3
Long-term debt to equity ratio 0.08 0.25 0.29 0.32 0.34 0.17 0.11 0.20 0.25 0.25
NOTES: (1) Marketable equity securities have not been included as part of current assets for this computation

32 33BBNC FY2018 ANNUAL REPORT FINANCIALS
BRISTOL BAY NATIVE CORPORATION AND SUBSIDIARIESCONSOLIDATED BALANCE SHEETS
March 31, 2018 and 2017 (In thousands, except shares)
LIABILITIES AND STOCKHOLDERS’ EQUITY
2018 2017
CURRENT LIABILITIES
Notes payable (note 9) $ 3,174 1,000
Accounts payable 77,819 54,832
Accrued liabilities (note 11) 76,516 86,930
Billings in excess of costs and earnings (note 1(m)) 21,341 21,848
Unclaimed dividends 1,402 1,313
Current maturities of long-term debt (note 10) 5,002 13,442
TOTAL CURRENT LIABILITIES 185,254 179,365
Long-term debt, less current maturities (note 10) 34,575 84,041
Deferred taxes (note 12) — 25,781
TOTAL LIABILITIES 219,829 289,187
Stockholders’ equity
Class A common stock, no par value. Authorized, 1,000,000 shares; issued and outstanding, 488,500 shares (note 2)
29,571 29,571
Class B common stock, no par value. Authorized, 300,000 shares; issued and outstanding, 51,600 shares (note 2)
3,124 3,124
Retained earnings 447,062 364,199
Total stockholders’ equity attributable to Bristol Bay Native Corporation 479,757 396,894
Noncontrolling interest 274 421
Total stockholders’ equity 480,031 397,315
Commitments and contingencies (notes 6, 9, 10, 11, 12, 13, 14, and 15)
TOTAL LIABILITIES AND STOCKHOLDERS' EQUITY $ 699,860 686,502
See accompanying notes to consolidated financial statements.
BRISTOL BAY NATIVE CORPORATION AND SUBSIDIARIESCONSOLIDATED BALANCE SHEETS
March 31, 2018 and 2017 (In thousands, except shares)
ASSETS
2018 2017
CURRENT ASSETS
Cash and cash equivalents $ 24,615 85,159
Marketable securities (notes 5 and 7) 150,763 139,563
Accounts receivable:
Trade, net (note 8) 180,799 144,602
Natural resources (note 1(l)) 252 4,424
Inventories 5,479 4,173
Costs and earnings in excess of billings (note 1(m)) 21,895 19,931
Prepaid expenses and refundable taxes 8,094 263
Notes receivable (note 1(g)) 3,500 7,505
TOTAL CURRENT ASSETS 395,397 405,620
Investments in unconsolidated affiliates (note 6) 29,994 19,187
Other investments (note 7) 42,359 35,519
Other assets 3,139 3,994
Deferred taxes (note 12) 14,096 —
Property, plant, and equipment, at cost (notes 1(i) and 10):
Land 14,719 13,660
Buildings 49,757 51,205
Leasehold improvements 26,883 22,126
Machinery and equipment 182,077 180,019
273,436 267,010
Less accumulated depreciation 125,092 111,770
148,344 155,240
Intangible assets, net (note 4) 24,812 26,323
Goodwill (notes 1(j) and 4) 41,719 40,619
TOTAL ASSETS $ 699,860 686,502

34 35BBNC FY2018 ANNUAL REPORT FINANCIALS
BRISTOL BAY NATIVE CORPORATION AND SUBSIDIARIES
CONSOLIDATED STATEMENTS OF CHANGES IN STOCKHOLDERS’ EQUITYYears ended March 31, 2018, 2017, and 2016 (In thousands)
COMMON STOCKRETAINED EARNINGS
TOTAL SHAREHOLDERS’
EQUITY ATTRIBUTABLE
TO BRISTOL BAY NATIVE
CORPORATION
NON-CONTROLLING
INTERESTS
TOTAL STOCKHOLDERS’
EQUITY
CLASS A CLASS B
Balance, April 1, 2015 $ 29,571 3,124 315,784 348,479 897 349,376
Dividends ($32.40 per share)
— — (17,499) (17,499) — (17,499)
Net earnings — — 43,689 43,689 52 43,741
Distributions to noncontrolling interest — — — — (942) (942)
Balance, March 31, 2016 29,571 3,124 341,974 374,669 7 374,676
Dividends ($34.80 per share)
— — (18,796) (18,796) — (18,796)
Net earnings — — 41,021 41,021 111 41,132
Distributions to noncontrolling interest — — — — 303 303
Balance, March 31, 2017 29,571 3,124 364,199 396,894 421 397,315
Dividends ($37.40 per share) — — (20,200) (20,200) — (20,200)
Net earnings — — 103,063 103,063 161 103,224
Distributions to noncontrolling interest — — — — (308) (308)
Balance, March 31, 2018 $ 29,571 3,124 447,062 479,757 274 480,031
See accompanying notes to consolidated financial statements.
BRISTOL BAY NATIVE CORPORATION AND SUBSIDIARIES
CONSOLIDATED STATEMENTS OF OPERATIONSYears ended March 31, 2018, 2017, and 2016 (In thousands, except shares and per share data)
2018 2017 2016
REVENUES
Industrial services $ 867,764 764,541 788,107
Construction 473,397 440,208 479,073
Government services 267,250 277,541 234,740
Tourism 10,751 9,114 2,040
Investment earnings (notes 5, 6 and 7) 27,959 24,789 (63)
Natural resources 10,677 6,904 5,954
Other 1,547 2,084 2,171
1,659,345 1,525,181 1,512,022
COSTS AND EXPENSES
Cost of industrial services 872,822 767,941 772,132
Cost of construction 450,564 415,116 463,637
Cost of government services 238,744 245,365 209,099
Cost of tourism 11,117 7,887 1,969
Cost of investment management 1,432 962 1,765
Corporate general and administrative expense 23,385 19,266 21,248
Interest 1,885 1,714 (107)
Other 2,520 2,234 3,413
1,602,469 1,460,485 1,473,156
Earnings from operations 56,876 64,696 38,866
Income tax benefit (expense) (note 12) 46,348 (23,564) 4,875
NET EARNINGS 103,224 41,132 43,741
Less income attributable to noncontrolling interest (161) (111) (52)
NET EARNINGS ATTRIBUTABLE TO BRISTOL BAY NATIVE CORPORATION $ 103,063 41,021 43,689
Earnings per share $ 191 76 81
Weighted average shares outstanding 540,100 540,100 540,100
See accompanying notes to consolidated financial statements.

36 37BBNC FY2018 ANNUAL REPORT FINANCIALS
BRISTOL BAY NATIVE CORPORATION AND SUBSIDIARIES
CONSOLIDATED STATEMENTS OF CASH FLOWS (CONTINUED)Years ended March 31, 2018, 2017, and 2016 (In thousands)
2018 2017 2016
CASH FLOWS FROM INVESTING ACTIVITIES:
Acquisition of businesses, net of cash acquired (4,256) (23,087) (15,591)
(Issuance of) collection on notes receivable 4,005 (7,505) —
Return of capital from unconsolidated affiliates 3,679 1,752 —
Investment in unconsolidated affiliates (15,220) — (1,814)
Purchase of other investments (5,463) (18,695) (14,282)
Return of capital from other investments 2,281 7,581 —
Additions to property, plant, and equipment (15,106) (13,772) (10,656)
Net cash used in investing activities (30,080) (53,726) (42,343)
CASH FLOWS FROM FINANCING ACTIVITIES:
Proceeds from long-term debt 29,000 54,832 60,571
Repayment of long-term debt (86,906) (64,766) (64,298)
Proceeds of notes payable 2,174 — 220
Contributions from (distributions to) noncontrolling interests (308) 303 (942)
Dividends paid (20,111) (18,796) (17,499)
Net cash used in financing activities (76,151) (28,427) (21,948)
Increase (decrease) in cash and cash equivalents (60,544) 12,832 9,863
CASH AND CASH EQUIVALENTS:
Beginning of year 85,159 72,327 62,464
End of year $ 24,615 85,159 72,327
SUPPLEMENTAL DISCLOSURE OF CASH FLOW INFORMATION:
CASH PAID DURING THE YEAR FOR:
Interest $ 2,435 1,769 2,157
Income taxes paid 9,549 7,639 25,168
Income taxes refunded 3,234 — —
SUPPLEMENTAL SCHEDULE OF NONCASH INVESTING AND FINANCING ACTIVITIES:
Future payments based upon earnings in connection with acquisition 1,100 — —
Holdback payments in connection with acquisitions — 2,855 1,550
See accompanying notes to consolidated financial statements.
BRISTOL BAY NATIVE CORPORATION AND SUBSIDIARIES
CONSOLIDATED STATEMENTS OF CASH FLOWSYears ended March 31, 2018, 2017, and 2016 (In thousands)
2018 2017 2016
CASH FLOWS FROM OPERATING ACTIVITIES:
NET EARNINGS $ 103,224 41,132 43,741
Adjustments to reconcile net earnings to cash provided by operating activities:
Equity in losses from unconsolidated affiliates 734 482 398
Unrealized depreciation (appreciation) of marketable securities and other investments 6,126 (15,864) 9,234
Depreciation and amortization 22,588 24,156 25,856
(Gain) loss on disposal of property plant and equipment (67) 74 (246)
Property and equipment abandonment and impairment losses 3,292 8,916 —
Gain on sale of marketable securities and other investments (26,074) (2,776) (1,540)
Gain on interest rate swap (156) (394) (65)
Deferred taxes (39,877) 2,404 (3,317)
Bad debt expense 135 248 357
Changes in operating assets and liabilities that provided (used) cash, net of acquisitions:
Accounts receivable (29,766) (14,553) 42,859
Costs and earnings in excess of billings (1,947) 1,246 1,927
Billings in excess of costs (962) 3,886 343
Recognition (reversal) of forward losses on construction contracts (2) 133 (1,585)
Net (purchase) sale of marketable securities 5,090 18,198 (15,676)
Inventories (1,306) 788 2,418
Accounts payable 22,987 (6,121) (6,589)
Accrued liabilities and other (18,332) 33,030 (23,961)
Net cash provided by operating activities 45,687 94,985 74,154

38 39BBNC FY2018 ANNUAL REPORT FINANCIALS
The Corporation consolidates majority owned subsidiaries that are not considered variable interest entities for which the Corporation exercises operational control. The Corporation will also consolidate any variable interest entities of which it is the primary beneficiary. The Corporation consolidates AN-AN, C, LLC as the primary beneficiary of a variable interest entity. Included in the Corporation’s consolidated balance sheet as of March 31, 2018, is $18,820,000 of assets and $12,541,000 of liabilities of AN-AN, C, LLC, consisting primarily of a building and the associated long-term loan payable for the building. The Corporation contributed $6,463,000 of equity and guarantees the long-term loan payable of AN-AN, C, LLC.
All significant intercompany accounts and transactions have been eliminated in consolidation.
(C) CASH AND CASH EQUIVALENTSCash and cash equivalents include cash and investments with initial maturities, at the time of purchase, of three months or less. Money market mutual funds that are part of the investment portfolio are not considered to be cash equivalents and are included in marketable securities.
(D) MARKETABLE SECURITIESMarketable securities are used to supplement cash provided by operations in order to fund corporate overhead and shareholder dividends. The marketable securities are recorded at fair value and are classified as trading. The Corporation includes net unrealized gains and losses as a part of investment earnings. Realized gains or losses resulting from the sale of securities are also included in investment earnings. Cost of securities is determined using the first-in, first-out method. Interest income is recorded on the accrual basis. Dividends are recorded on the ex-dividend date.
(E) INVESTMENTS IN UNCONSOLIDATED AFFILIATESInvestments in unconsolidated affiliates are accounted for using the cost or the equity method, depending on whether the Corporation has the ability to exercise significant influence over operating and financial policies of an investee. Under the cost method, investments are carried at acquisition cost and distributions are recognized as income when received. Under the equity method, the Corporation’s share of affiliate earnings is included in income when earned, and distributions are credited to the investment when received. For flowthrough entities (i.e., partnerships, limited liability companies, subchapter S corporations, etc.), the ability to exercise significant influence is presumed to exist if the percentage of ownership is equal to or greater than 3 to 5%. For other entities, significant influence is presumed to exist if the percentage of ownership is equal to or greater than 20%. The Corporation’s share of earnings or losses is determined either by its respective ownership percentage or, when appropriate, by using the hypothetical liquidation at book value method (HLBV). When using the HLBV, the Corporation evaluates at each balance sheet date, the amount it would receive or be obligated to pay if the investee were liquidated. The difference between this amount at the beginning of the period compared to end of the period plus cash received from the investments during the period and less amounts contributed to the investment during the period, represents the Corporation’s earnings or losses for the period from such investment.
Cost method investments are reviewed for impairment in the occurrence of a triggering event indicating impairment. Equity method investments are analyzed for impairment on an ongoing basis. An impairment charge is recorded whenever the fair value of the investment is considered to be less than the carrying amount and the impairment is considered other than temporary.
(F) TRADE ACCOUNTS RECEIVABLETrade accounts receivable are recorded at the invoiced amount and do not bear interest. The allowance for doubtful accounts is management’s best estimate of the amount of probable credit losses in existing accounts receivable. The Corporation determines the allowance based on its historical write off experience and current economic conditions. Past due balances over 60 days in a specified amount are reviewed individually for collectability. All other balances are reviewed in aggregate. Account balances are charged off against the allowance after all means of collection have been exhausted and the potential for recovery is considered remote. The Corporation does not have any off balance sheet credit exposure related to its customers. The allowance for uncollectible accounts was $828,000 and $716,000 at March 31, 2018 and 2017, respectively.
BRISTOL BAY NATIVE CORPORATION AND SUBSIDIARIES
NOTES TO CONSOLIDATED FINANCIAL STATEMENTSMarch 31, 2018 and 2017
(1) NATURE OF OPERATIONS AND SUMMARY OF SIGNIFICANT ACCOUNTING POLICIES
(A) NATURE OF OPERATIONSThe operations of Bristol Bay Native Corporation (Corporation) include the following business lines:
• Industrial services (includes petroleum distribution)
• Construction
• Government services
• Tourism
• Portfolio of public and private passive investments, some of which are managed by outside investment managers
• Subsurface and other natural resource management
(B) PRINCIPLES OF CONSOLIDATIONThe accompanying consolidated financial statements include the accounts of the Corporation and its wholly, and majority owned, subsidiaries:
Bristol Resources, Inc.Bristol Bay Corporate Services, Inc.Bristol Bay Architects, Inc.*Bristol Bay Parking, LLCBristol Bay Development LLCBristol Bay Development Fund, LLCAN-AN, C, LLCArctic Holdings, LLCPetroCard, Inc. (PC)Bristol Alliance Fuels, LLCBristol Bay Petroleum Properties, LLCKatmailand, Inc.Katmai Air, LLCKatmai Lodge, LLCKatmai Air Leasing, LLCBristol Bay Mission Lodge, LLCBristol Environmental Solutions, LLCBristol Construction Services, LLCBristol Design Build Services, LLCBristol Environmental Remediation Services, LLCBristol Engineering Services CorporationBristol General Contractors, LLCBristol Industries, LLCSES Electrical LLC
SES Civil Contractors LLCSES Energy Services LLCBadger Technical Services, LLCBristol Bay Shared Services, LLCDefendSafe, LLCEagle Applied Sciences LLCEagle Medical Services, LLCEagle Integrated Healthcare, LLCEagle Global Scientific, LLCGlacier Technical Solutions, LLCGlacier Technologies LLCMedPro Technologies, LLCBristol Infrastructure Design Services, LLCSpecPro, Inc.SpecPro Professional Services LLCBristol Site Contractors, LLC SES Infrastructure Services, LLCCCI Construction Services, LLC CCI Energy and Construction Services, LLCCCI Group, LLCCCI, Inc.CCI Mechanical, LLCCCI Solutions, LLCCCI General Contractors, LLC
CCI Utility Services, LLCCCI Facility Contractors, LLCCCI Facility Support Services, LLCAerostar SES LLCSES Construction and Fuel Services LLCSpecPro Environmental Services LLCWorkforce Resources, LLCSpecPro Technical Services LLCSpecPro Management Services, LLCSTS Systems Integration, LLCSTS Systems Support, LLCSTS Solutions and Training, LLCTekPro Services, LLCTekPro Support Services, LLCVista International Operations, Inc.Vista Technical Services, LLCVista Defense Technologies LLCBristol Bay Industrial, LLCPeak Oilfield Service Company LLCCCI Industrial Services, LLCKakivik Asset Management, LLCAlaska Directional, LLCBristol Bay Alaska Tourism, LLC
*No significant activity in 2018, 2017 or 2016.

40 41BBNC FY2018 ANNUAL REPORT FINANCIALS
The Corporation performs its annual impairment review of goodwill at March 31, and when a triggering event occurs between annual impairment tests. No impairment loss was recorded in 2018, 2017 or 2016. The reporting units assessed for impairment include Industrial Services Group (ISG) group, SpecPro Technical Services (STS) group, and SpecPro Environmental Services (SES) group.
Intangible assets with finite lives are recorded at cost and are primarily amortized on a straightline basis over the esti-mated period of economic benefit. The Corporation reviews intangible assets with finite lives for impairment whenever events or changes in circumstances indicate that the carrying value of the assets may not be recoverable. Recoverability of these intangible assets is assessed based on the undiscounted future cash flows expected to result from the use of the asset. If the undiscounted future cash flows are less than the carrying value, the purchased intangible assets are considered to be impaired. The amounts of the impairment loss, if any, is measured as the difference between the carrying amount of these assets and the fair value based on a discounted cash flow approach or, when available and appropriate, to comparable market values. The Corporation has not acquired intangible assets with indefinite lives.
(K) IMPAIRMENT OF LONG-LIVED ASSETSLong-lived assets are reviewed for impairment whenever events or changes in circumstances indicate that the carrying amount of an asset may not be recoverable. Recoverability of assets to be held and used is measured by a comparison of the carrying amount of the assets to the future undiscounted net cash flows expected to be generated by the asset. If such assets are considered to be impaired, the impairment to be recognized is measured by the amount by which the carrying amount of the assets exceeds the fair value of the assets. Assets to be disposed of are reported at the lower of the carrying amount, or fair value, less the cost to sell.
(L) NATURAL RESOURCE REVENUESNatural resource revenues are derived from sand and gravel quarry operations, and natural resource revenues dis-tributable to the Corporation from other Alaska Native Regional Corporations, under Section 7(i) of the Alaska Native Claims Settlement Act. Revenues distributable under Section 7(i) are recorded when received or when the amount is determined, and receipt is assured. Natural resource revenues are recorded net of amounts distributable under Section 7(j) of the Alaska Native Claims Settlement Act.
(M) REVENUE AND COST RECOGNITIONIn general, the Corporation recognizes revenue when the following criteria are met: services have been performed, or delivery has occurred, collection of the receivable is probable, persuasive evidence of an arrangement exists, and the sales price is fixed and determinable.
The Corporation’s industrial services, government services, and construction revenues are derived from fixed price, time and material, and cost plus contracts to provide services under various federal, state, and commercial contracts. Revenue on fixed price contracts is recognized by the percentage of completion method based on the proportion of costs incurred to date to management’s best estimate of total contract costs. Revenues from time and material contracts and cost plus contracts are recognized currently as the work is performed. Change orders are not included in contract revenue until agreed upon and approved by the customer and Corporation regarding both scope and price. Claims are not included in contract revenue until it is probable that the claim will result in additional contract revenue and the amount can be reliably estimated, or when amounts have been received. Contract costs include all direct costs and any indirect, or overhead, costs allocable to contracts. Included in indirect or overhead are allocable general and administrative to the extent such costs are allowable under government procurement regulations and recoverable under the contract. Revisions in cost and profit estimates are made during the course of work and are reflected when facts that require revision become known. Provision for losses on uncompleted contracts is made in the period in which such losses are identified.
(G) NOTES RECEIVABLENotes receivable are recorded at the original principal amount plus interest accrued, less payments made to date. Interest is compounded based on the terms of the individual loan agreement, and may not be accrued in the case of probable uncollectible amounts. The notes receivable at March 31, 2018, is a promissory note from a company which bears interest at 16% per annum with principal and unpaid interest due June 30, 2018.
Allowance for notes receivable losses are maintained at levels deemed adequate by management to provide for probable and inherent losses, and provisions for notes receivable losses are added to, and charge offs deducted from, the respective allowance for notes receivable losses. At March 31, 2018 and 2017, there were no allowances for notes receivable losses.
Notes receivable are considered impaired when, based on current information and events, it is probable that the Cor-poration will be unable to collect scheduled payments of principal and interest when due according to the contractual terms of the note agreements. Impairment is measured by comparing the estimated fair value, less selling costs (net realizable value) of the underlying collateral against the recorded investment of the loan. Notes receivable are charged off when all possible means of collection have been exhausted, and the remaining balance due is deemed uncollectible. For the years ended March 31, 2018, 2017 and 2016, there were no impairment charges.
(H) INVENTORIESInventories, which consist primarily of petroleum products, are stated at the lower of cost (principally, first-in, first-out) or net realizable value.
(I) PROPERTY, PLANT, AND EQUIPMENTProperty, plant, and equipment are recorded at cost. Depreciation of property, plant, and equipment is provided based on the estimated useful lives of the respective assets using the straightline method. Estimated lives for buildings are 10 to 40 years, and for machinery and equipment, 3 to 10 years. Leasehold improvements are amortized straightline over the shorter of the lease term or estimated useful life of the asset. The Corporation recorded depreciation expense of $19,237,000, $21,742,000 and $23,867,000 for the years ended March 31, 2018, 2017 and 2016, respectively. For the years ended March 31, 2018 and 2017, certain assets on the North Slope were abandoned and written off or impaired in the amount of $3,292,000 and $8,916,000, respectively, which is included in cost of industrial services.
The cost of current repairs and maintenance is charged to expense, while the cost of betterment is capitalized.
(J) GOODWILL AND INTANGIBLESGoodwill is an asset representing the future economic benefits arising from other assets acquired in a business combination that are not individually identified and separately recognized. Goodwill is reviewed for impairment at least annually. The Corporation has an option to assess qualitative factors to determine whether the existence of events or circumstances leads to a determination that it is more likely than not that the fair value of a reporting unit is less than its carrying amount. If after assessing the totality of events or circumstances, the Corporation determines it is not more likely than not that the fair value of a reporting unit is less than its carrying amount, then performing the two-step goodwill impairment test is unnecessary. However, if the Corporation concludes otherwise, the Corporation is required to perform the first step of the two-step impairment test. Under the first step, the fair value of the reporting unit is compared with its carrying value (including goodwill). If the fair value of the reporting unit is less than its carrying value, an indication of goodwill impairment exists for the reporting unit, and the entity must perform step two of the impairment test (measurement). Under step two, an impairment loss is recognized for any excess of the carrying amount of the reporting unit’s goodwill over the implied fair value of that goodwill. The implied fair value of goodwill is determined by allocating the fair value of the reporting unit in a manner similar to a purchase price allocation and the residual fair value after this allocation is the implied fair value of the reporting unit’s goodwill. Fair value of the reporting unit is determined using a discounted cash flow analysis. If the fair value of the reporting unit exceeds its carrying value, step two does not need to be performed.

42 43BBNC FY2018 ANNUAL REPORT FINANCIALS
(O) INCOME TAXESThe Corporation and its subsidiaries file consolidated federal and state income tax returns. The Corporation accounts for income taxes on the liability method. Income tax expense includes income taxes currently payable and those deferred because of differences between financial statement and tax basis of assets and liabilities. The Corporation records a valuation allowance to reduce the amount of the gross deferred tax assets to the amount that is more likely than not to be realized. Factors considered in determining the amount of the valuation allowance include historical levels of taxable income, projected levels of taxable income in future years, expected future Corporation trends in results from existing operations, and the scheduled reversal of deferred tax liabilities. Deferred tax liabilities are recorded as they arise. The effect on deferred tax assets and liabilities of a change in tax law or rates are recognized in earnings in the period that includes the enactment date. The tax benefit from tax deductible contributions to settlement trusts is recognized as a reduction to income tax expense from continuing operations.
The Corporation recognizes the effect of income tax positions only if those positions are more likely than not of being sustained. Recognized income tax positions are measured at the largest amount that is greater than 50% likely of being realized. Changes in recognition or measurement are reflected in the period in which the change in judgment occurs.
The Corporation records penalties and interest related to unrecognized tax benefits as part of interest expense.
(P) USE OF ESTIMATESThe preparation of consolidated financial statements in conformity with the U.S. generally accepted accounting principles requires management to make estimates and assumptions that affect the amounts reported in the financial statements. These estimates are based on management’s current judgment and may differ from actual results. Significant items subject to estimates and assumptions include accounts receivable, estimates of total contract costs for fixed price contracts, the fair value of investments, impairment of long lived assets, intangibles, goodwill, the tax valuation of oil and gas rights, and deferred tax assets.
(Q) RECLASSIFICATIONSBeginning in 2018, the Corporation has combined the operations of petroleum distribution into industrial services. Accordingly, the Corporation has reclassified certain amounts relating to its prior period results to conform to its current period presentation.
(R) RECENTLY ISSUED ACCOUNTING PRONOUNCEMENTSIn May 2014, the FASB issued ASU 2014-09, Revenue from Contracts with Customers (Topic 606). ASC Update 2014-09 provides guidance for the recognition, measurement, and disclosure of revenue related to the transfer of promised goods or services to customers. ASU 2015-14 deferred the effective date of ASU 2014-09 for fiscal years beginning after December 15, 2018. The Corporation will begin application of ASC 2014-09 on April 1, 2019. The Corporation is evaluating the effect on its results of operations, financial position, and cash flows.
In January 2016, the FASB issued ASU 2016-01, Financial Instruments — Overall (Subtopic 825-10). ASU 2016-01 require equity investments (except those accounted for under the equity method of accounting, or those that result in consolidation of the investee) to be measured at fair value with changes in fair value recognized in net income. In addition, ASU 2016-01 simplifies the impairment assessment of equity investments without readily determinable fair values by requiring a qualitative assessment to identify impairment. The update is effective for years beginning after December 15, 2018. The Corporation has early adopted in FY2018 the elimination of the requirement to disclose the fair value of financial instruments measured at amortized cost. The Corporation will adopt the remainder of the new standard on April 1, 2019. The Corporation is evaluating the effect on its results of operations, financial position, and cash flows.
In February 2016, the FASB issued ASU 2016-02, Leases (Topic 842). ASU 2016-02 establishes the principles to report transparent and economically neutral information about the assets and liabilities that arise from leases. The update is effective for years beginning after December 15, 2019, with early adoption permitted. The Corporation will begin application of ASU 2016-02 on April 1, 2020. While the Corporation continues to assess the effect of adoption, it currently believes the most significant changes relate to the recognition of new right of use assets and lease liabilities on the consolidated balance sheets for equipment and warehouse operating leases.
The costs and estimated earnings on contracts in progress include costs and estimated earnings on firm fixed price contracts. The following table reconciles costs incurred, earnings, and billings to date on contracts in progress at March 31 (in thousands):
2018 2017
Costs incurred on contracts in progress to date 1,528,083 1,173,974
Estimated earnings to date $ 197,738 150,973
Contract revenue earned to date 1,725,821 1,324,947
Less billings to date (1,725,267) (1,326,864)
Contracts revenue adjustment required to reflect percentage of completion $ 554 (1,917)
Included in the consolidated balance sheets are costs and estimated earnings on contracts in progress compared to billings and consist of the following, at March 31 (in thousands):
2018 2017
Costs and earnings in excess of billings on uncompleted projects $ 21,895 19,931
Billings in excess of costs and earnings on uncompleted contracts (21,341) (21,848)
$ 554 (1,917)
Costs and earnings in excess of amounts billed are classified as current assets under “costs and earnings in excess of billings.” Billings in excess of costs and earnings are classified under current liabilities as “billings in excess of costs and earnings.” Contract retentions are included in accounts receivable.
Where the Corporation, acting in an agency capacity, by agreement, has transferred all significant risk to vendors, manufacturers, or purchasers, the Corporation records only the net profit in contract services revenues. Gross volume from such activity excluded from the financial statements totaled $7,323,000, $10,859,000 and $9,939,000 for fiscal years 2018, 2017 and 2016, respectively.
Revenue from petroleum sales is recognized when the related goods are sold, and all significant obligations of the Corporation have been satisfied, which generally occurs at time of delivery. Petroleum revenues and the cost of petroleum operations, generated from purchases outside the PC network, are recorded gross of state and federal fuel taxes. PC is not responsible for collecting or remitting fuel tax for petroleum revenues from fuel directly acquired by the Corporation. Included in petroleum sales operations and costs of petroleum sales operations is $105.6 million, $101.0 million and $92.6 million of state and federal fuel taxes for the years ended March 31, 2018, 2017 and 2016, respectively.
(N) INTEREST RATE SWAPFrom time to time, the Corporation enters into interest rate swaps as a means to hedge against the uncertainty of future increases in interest rates on the Corporation’s long-term debt. The Corporation applies Financial Accounting Standard Board (FASB) Accounting Standards Codification (ASC) Topic 815, Derivatives and Hedging, which, among other provisions, requires that all interest rate swaps be recognized as either assets or liabilities in the consolidated balance sheet and measured at fair value. Gains and losses resulting from changes in the fair value are recorded in other comprehensive income when the swaps qualify for hedge accounting. The change in the fair value of swaps that do not qualify as a hedge must be included as part of earnings. The fair values of interest rate swaps are included in accrued liabilities with the effect on earnings included as part of interest expense.
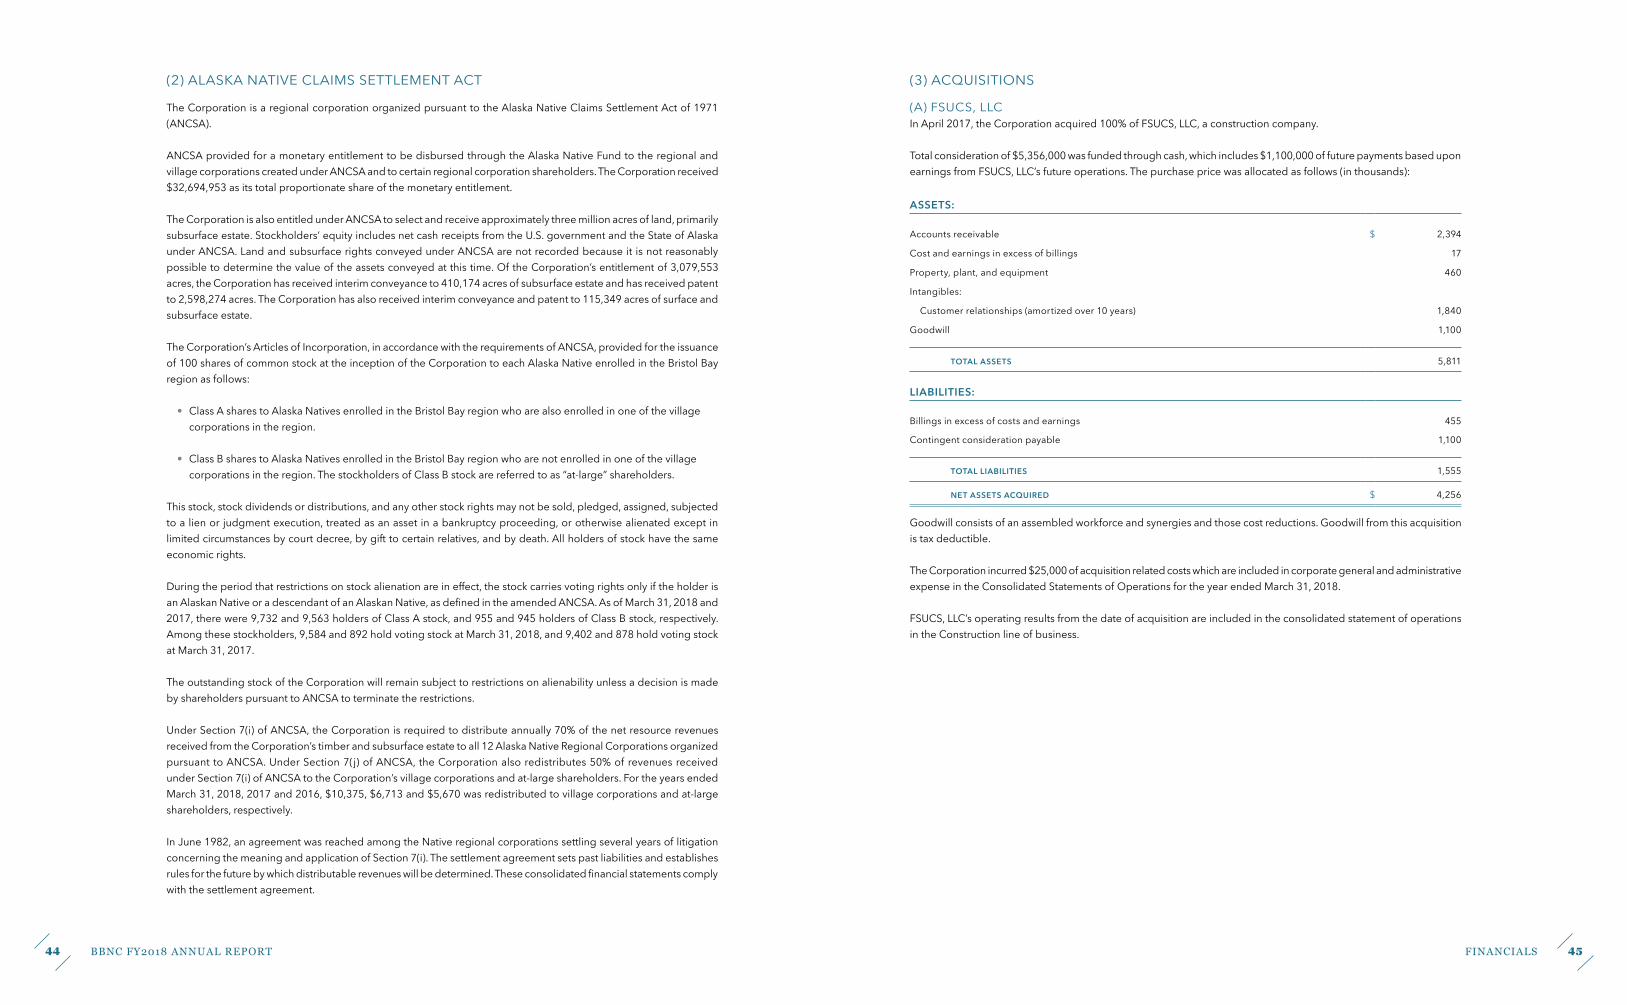
44 45BBNC FY2018 ANNUAL REPORT FINANCIALS
(3) ACQUISITIONS
(A) FSUCS, LLCIn April 2017, the Corporation acquired 100% of FSUCS, LLC, a construction company.
Total consideration of $5,356,000 was funded through cash, which includes $1,100,000 of future payments based upon earnings from FSUCS, LLC’s future operations. The purchase price was allocated as follows (in thousands):
ASSETS:
Accounts receivable $ 2,394
Cost and earnings in excess of billings 17
Property, plant, and equipment 460
Intangibles:
Customer relationships (amortized over 10 years) 1,840
Goodwill 1,100
TOTAL ASSETS 5,811
LIABILITIES:
Billings in excess of costs and earnings 455
Contingent consideration payable 1,100
TOTAL LIABILITIES 1,555
NET ASSETS ACQUIRED $ 4,256
Goodwill consists of an assembled workforce and synergies and those cost reductions. Goodwill from this acquisition is tax deductible.
The Corporation incurred $25,000 of acquisition related costs which are included in corporate general and administrative expense in the Consolidated Statements of Operations for the year ended March 31, 2018.
FSUCS, LLC’s operating results from the date of acquisition are included in the consolidated statement of operations in the Construction line of business.
(2) ALASKA NATIVE CLAIMS SETTLEMENT ACT
The Corporation is a regional corporation organized pursuant to the Alaska Native Claims Settlement Act of 1971 (ANCSA).
ANCSA provided for a monetary entitlement to be disbursed through the Alaska Native Fund to the regional and village corporations created under ANCSA and to certain regional corporation shareholders. The Corporation received $32,694,953 as its total proportionate share of the monetary entitlement.
The Corporation is also entitled under ANCSA to select and receive approximately three million acres of land, primarily subsurface estate. Stockholders’ equity includes net cash receipts from the U.S. government and the State of Alaska under ANCSA. Land and subsurface rights conveyed under ANCSA are not recorded because it is not reasonably possible to determine the value of the assets conveyed at this time. Of the Corporation’s entitlement of 3,079,553 acres, the Corporation has received interim conveyance to 410,174 acres of subsurface estate and has received patent to 2,598,274 acres. The Corporation has also received interim conveyance and patent to 115,349 acres of surface and subsurface estate.
The Corporation’s Articles of Incorporation, in accordance with the requirements of ANCSA, provided for the issuance of 100 shares of common stock at the inception of the Corporation to each Alaska Native enrolled in the Bristol Bay region as follows:
• Class A shares to Alaska Natives enrolled in the Bristol Bay region who are also enrolled in one of the village corporations in the region.
• Class B shares to Alaska Natives enrolled in the Bristol Bay region who are not enrolled in one of the village corporations in the region. The stockholders of Class B stock are referred to as “at-large” shareholders.
This stock, stock dividends or distributions, and any other stock rights may not be sold, pledged, assigned, subjected to a lien or judgment execution, treated as an asset in a bankruptcy proceeding, or otherwise alienated except in limited circumstances by court decree, by gift to certain relatives, and by death. All holders of stock have the same economic rights.
During the period that restrictions on stock alienation are in effect, the stock carries voting rights only if the holder is an Alaskan Native or a descendant of an Alaskan Native, as defined in the amended ANCSA. As of March 31, 2018 and 2017, there were 9,732 and 9,563 holders of Class A stock, and 955 and 945 holders of Class B stock, respectively. Among these stockholders, 9,584 and 892 hold voting stock at March 31, 2018, and 9,402 and 878 hold voting stock at March 31, 2017.
The outstanding stock of the Corporation will remain subject to restrictions on alienability unless a decision is made by shareholders pursuant to ANCSA to terminate the restrictions.
Under Section 7(i) of ANCSA, the Corporation is required to distribute annually 70% of the net resource revenues received from the Corporation’s timber and subsurface estate to all 12 Alaska Native Regional Corporations organized pursuant to ANCSA. Under Section 7(j) of ANCSA, the Corporation also redistributes 50% of revenues received under Section 7(i) of ANCSA to the Corporation’s village corporations and at-large shareholders. For the years ended March 31, 2018, 2017 and 2016, $10,375, $6,713 and $5,670 was redistributed to village corporations and at-large shareholders, respectively.
In June 1982, an agreement was reached among the Native regional corporations settling several years of litigation concerning the meaning and application of Section 7(i). The settlement agreement sets past liabilities and establishes rules for the future by which distributable revenues will be determined. These consolidated financial statements comply with the settlement agreement.

46 47BBNC FY2018 ANNUAL REPORT FINANCIALS
(4) GOODWILL AND INTANGIBLES
The change in the carrying amount of Goodwill for the years ended March 31, 2018 and 2017 are as follows (in thousands):
BALANCE AS OF APRIL 1, 2016 $ 38,770
Acquisition of Alaska Directional 1,849
BALANCE AS OF MARCH 31, 2017 $ 40,619
Acquisition of FSUCS, LCC 1,100
BALANCE AS OF MARCH 31, 2018 41,719
The changes in the carrying amount of Intangibles for the years ended March 31, 2018 and 2017 are as follows (in thousands):
BAF PC ASL BBML PEAK KATMAI AK DIR FSUCS TOTAL
BALANCE AS OF APRIL 1, 2016 $ 5,803 3,252 2,347 47 2,107 — — — 13,556
ACQUISITIONS
Customer relationships $ — — — — — 500 5,049 — 5,549
Noncompete agreements — — — — — 100 2,162 — 2,262
Trade names — — — — — 1,450 2,948 — 4,398
Contractual — — — — — 2,972 — — 2,972
AMORTIZATION
Customer relationships (200) (320) (234) (43) (336) (42) (43) — (1,218)
Noncompete agreements (150) — (309) — (140) (17) (36) — (652)
Trade names (89) — (91) — (102) (81) (16) — (379)
Contractual backlog — — — — — (165) — — (165)
BALANCE AS OF MARCH 31, 2017 $ 5,364 2,932 1,713 4 1,529 4,717 10,064 — 26,323
ACQUISITIONS
Customer relationships $ — — — — — — — 1,840 1,840
AMORTIZATION
Customer relationships (202) (320) (234) (4) (337) (50) (504) (184) (1,835)
Noncompete agreements (150) — — — (140) (20) (432) — (742)
Trade names (89) — (91) — (102) (97) (197) — (576)
Contractual — — — — — (198) — — (198)
BALANCE AS OF MARCH 31, 2018 $ 4,923 2,612 1,388 — 950 4,352 8,931 1,656 24,812
There are no cumulative impairments of Goodwill or Intangibles as of March 31, 2018 and 2017.
Estimated amortization expense for the next five years, and years thereafter, is $3.2 million in 2019, $2.9 million in 2020, $2.8 million in 2021, $2.7 million in 2022, $2.0 million in 2023, and $11.2 million for years thereafter.
(B) ALASKA DIRECTIONAL, LLC AND KATMAI GROUPIn March 2017, the Corporation acquired 100% of Alaska Directional, LLC, an industrial services company. In May 2016, the Corporation acquired 100% of Katmailand, Inc., Katmai Air, LLC, Katmai Lodge, LLC, and Katmai Air Leasing, LLC (Katmai Group), a tourism company.
Total consideration of $27,555,000 was funded through cash and debt financing, with no contingent consideration, for the acquisitions in aggregate. In aggregate, the purchase price was allocated as follows (in thousands):
ASSETS:
Cash $ 4,468
Accounts receivable 169
Prepaid expenses 247
Inventory 237
Property, plant and equipment 11,188
Intangibles:
Trade names (amortized over 15 years) 4,398
Customer relationships (amortized over 10 years) 5,549
Noncompete agreements (amortized over 5 years) 2,262
Contractual (amortized over 15 years) 2,972
Goodwill 1,849
TOTAL ASSETS 33,339
LIABILITIES:
Accounts payable 231
Accrued liabilities 5,553
TOTAL LIABILITIES 5,784
NET ASSETS ACQUIRED $ 27,555
Goodwill consists of an assembled workforce and synergies and those cost reductions. Goodwill from this acquisition is tax deductible.
The Corporation incurred $267,000 of acquisition-related costs which are included in corporate general and adminis-trative expense in the Consolidated Statements of Operations for the year ended March 31, 2017.
Alaska Directional and Katmai Group operating results from the date of acquisition are included in the consolidated statement of operations in the Industrial Services and Tourism lines of business, respectively.

48 49BBNC FY2018 ANNUAL REPORT FINANCIALS
Investment earnings (losses) consist of the following (in thousands):
YEAR ENDED MARCH 31
2018 2017 2016
Dividends $ 4,805 3,331 1,955
Interest 1,689 1,047 704
Gain on sale of marketable securities, and other investments, net 26,074 2,776 1,540
Unrealized (depreciation) appreciation of marketable securities (9,784) 13,558 (9,234)
$ 22,784 20,712 (5,035)
(6) INVESTMENTS IN UNCONSOLIDATED AFFILIATES
The Corporation has interests in various affiliates and joint ventures. The companies, the business in which they are engaged, the percentage of ownership at March 31, 2018, and investment amount were as follows at March 31 (in thousands):
BUSINESSPERCENTAGE
OF OWNERSHIP 2018 2017
Cost method investments Varies Varies $ 1,868 2,051
EQUITY METHOD INVESTMENTS:
JL-BBNC, LLC Real Estate 16.67 % 3,590 4,277
JL-Palms, LLC Real Estate 37.67 581 1,940
JL-LFGTE, LLC Energy 20.00 1,273 1,681
CenterPoint West, LLC Real Estate 10.00 2,214 2,297
International Office Building, LLC Real Estate 20.00 2,130 2,221
JL Office Tower, LLC Real Estate 5.00 2,104 2,092
FACP-Natural Gas Storage, LLC Energy 45.00 1,178 1,275
JL-Raintree, LLC Real Estate 26.92 — 649
JL Orlando Hotel 4, LLC Real Estate 20.00 483 483
ADESCO, LLC Marine 19.00 81 99
Vista Chenhall Tek JV, LLC Contracting 49.00 34 55
MECX-BTS JV, LLC Contracting 49.00 5 6
Three Star MedPro Tech JV, LLC Contracting 49.00 (11) 59
EA-SCF, JV Contracting 49.00 1 2
Woodbine Legacy Investment Partners, LLC Real Estate 6.77 4,792 —
JL-Triton, LLC Real Estate 21.44 1,813 —
JL-Keahotel Investor, LLC Real Estate 38.49 2,368 —
JL-Anchorage Hotels, LLC Real Estate 33.87 4,829 —
JL Assurance Messanine Partners, LLC Financing 15.94 661 —
$ 29,994 19,187
(5) MARKETABLE SECURITIES
The cost and fair value of marketable securities included in the trading portfolio at March 31 are as follows (in thousands):
2018
COST
GROSS UNREALIZED
HOLDING GAINS
GROSS UNREALIZED
HOLDING LOSSES
FAIR VALUE
Money market mutual funds $ 30,612 — — 30,612
EQUITIES:
Domestic 25,837 12,404 (289) 37,952
International 34,979 5,044 (15) 40,008
Mutual Funds 43,000 — (809) 42,191
$ 134,428 17,448 (1,113) 150,763
2017
COST
GROSS UNREALIZED
HOLDING GAINS
GROSS UNREALIZED
HOLDING LOSSES
FAIR VALUE
Money market mutual funds $ 5,843 — — 5,843
EQUITIES:
Domestic 71,357 22,955 (305) 94,007
International 19,183 3,760 (426) 22,517
Mutual Funds 4,897 186 — 5,083
FIXED INCOME SECURITIES:
Government 2,482 17 — 2,499
Government-sponsored 1,895 — (36) 1,859
International government 147 — (10) 137
Mortgage-backed 418 — (6) 412
Corporate-domestic 6,425 77 (44) 6,458
Corporate-international 797 22 (71) 748
$ 113,444 27,017 (898) 139,563
The Corporation’s revolving note agreement, disclosed in note 10, requires collateral of marketable securities valued at $25,241,000 as of March 31, 2018. Collateral value is determined by multiplying the applicable advance percentage provided in the collateral table for each type of eligible collateral pledged to the bank.

50 51BBNC FY2018 ANNUAL REPORT FINANCIALS
(7) FAIR VALUE MEASUREMENTS
FASB ASC Topic 820 establishes a fair value hierarchy that prioritizes the inputs to valuation techniques used to measure fair value. The hierarchy gives the highest priority to unadjusted quoted prices in active markets for identical assets or liabilities (Level 1 measurements) and the lowest priority to measurements involving significant unobservable inputs (Level 3 measurements). The three levels of the fair value hierarchy are as follows:
• Level 1 inputs are quoted prices (unadjusted) in active markets for identical assets or liabilities that the Corporation has the ability to access at the measurement date.
• Level 2 inputs are inputs other than quoted prices included within Level 1 that are observable for the asset or liability, either directly or indirectly.
• Level 3 inputs are unobservable inputs for the asset or liability.
(A) FAIR VALUE MEASUREMENTS ON A RECURRING BASISFinancial assets and liabilities are classified in their entirety based on the lowest level of input that is significant to the fair value measurements. The Corporation assessment of the significance of a particular input to the fair value measurements requires judgment and may affect the valuation of the assets and liabilities being measured and their level within the fair value hierarchy.
The following tables present the balances of assets and liabilities measured at fair value on a recurring basis as of March 31, 2018 and 2017 at each hierarchical level (in thousands):
MARCH 31, 2018
TOTAL LEVEL 1 LEVEL 2 LEVEL 3
ASSETS
TRADING SECURITIES:
Money market funds $ 30,612 30,612 — —
EQUITIES:
Domestic 37,952 37,952 — —
International 40,008 40,008 — —
Mutual funds 42,191 42,191 — —
TOTAL TRADING SECURITIES $ 150,763 150,763 — —
LIABILITIES
Interest rate swaps $ 114 — 114 —
Summarized combined unaudited financial information for the Corporation’s equity method investments is as follows (in thousands):
MARCH 31
2018 2017
Current assets $ 67,584 14,929
Noncurrent assets 541,856 283,866
TOTAL ASSETS $ 609,440 298,795
Current liabilities $ 22,938 5,238
Noncurrent liabilities 352,805 194,327
Equity 233,697 99,230
TOTAL LIABILITIES AND EQUITY $ 609,440 298,795
MARCH 31
2018 2017 2016
Revenues $ 137,856 57,034 26,162
Expenses 141,367 60,843 26,196
NET EARNINGS $ (3,511) (3,809) (34)
Equity in losses of affiliates allocable to the Corporation $ (734) (482) (398)
Investment earnings include the following (in thousands):
MARCH 31
2018 2017 2016
Earnings on investments $ 98 165 1,288
Losses from unconsolidated affiliates (734) (482) (398)
Lease revenue from portfolio 2,153 2,088 1,470
$ 1,517 1,771 2,360

52 53BBNC FY2018 ANNUAL REPORT FINANCIALS
(C) INVESTMENTS AT NET ASSET VALUEThe Corporation uses Net Asset Value (NAV) to determine the fair value of all the underlying investments which (a) do not have a readily determinable fair value and (b) prepare their financial statements consistent with the measurement principles of an investment company or have the attributes of an investment company. These investments, which are included in other investments on the consolidated balance sheets, primarily include private equity investment funds that cannot be redeemed with the investees, but the Corporation receives distributions through the liquidation of the underlying assets of the investees. The Corporation’s estimates of the period of time over which the underlying assets are expected to be liquidated by the investees are noted in the below table.
The following table provides information for investments using NAV to determine fair value as of March 31 (in thousands):
MARCH 31, 2018
NUMBER OF FUNDS FAIR VALUE
ESTIMATED LIQUIDATION
PERIODREDEMPTION
FREQUENCY
Finance and lending (a) 1 $ 8,893 1 to 6 years None
Finance and lending (a) 1 12,015 — Quarterly
Global (b) 1 4,504 1 to 11 years None
Global (b) 1 4,632 — Daily
North America (c) 1 6,905 1 to 11 years None
Distressed Opportunities (d) 2 5,410 1 to 12 years None
$ 42,359
MARCH 31, 2017
NUMBER OF FUNDS FAIR VALUE
ESTIMATED LIQUIDATION
PERIODREDEMPTION
FREQUENCY
Finance and lending (a) 1 $ 7,101 1 to 6 years None
Finance and lending (a) 1 11,172 — Quarterly
Global (b) 1 3,485 1 to 11 years None
Global (b) 1 3,466 — Daily
North America (c) 1 5,260 1 to 11 years None
Distressed Opportunities (d) 2 5,035 1 to 12 years None
$ 35,519
(a) The funds’ primary investment objective is to make investments through direct origination and through secondary market transactions in first and second lien corporate loans and securities, and to a lesser extent, preferred stock, convertible securities, participation interests, swaps, and other contractual for derivative rights or instruments.
(b) The funds’ primary investment objective is to purchase and manage investments in the global markets. Investments include equity and debt securities, preferred stock, convertible securities, participation interest, swaps, and other contractual for derivative rights or instruments. These investments are invested in a broad range of industries.
MARCH 31, 2017
TOTAL LEVEL 1 LEVEL 2 LEVEL 3
ASSETS
TRADING SECURITIES:
Money market funds $ 5,843 5,843 — —
EQUITIES:
Domestic 94,007 94,007 — —
International 22,517 22,517 — —
Mutual funds 5,083 5,083 — —
FIXED INCOME SECURITIES:
Government 2,499 — 2,499 —
Government-sponsored 1,859 — 1,859 —
International government 137 — 137 —
Mortgage-backed 412 — 412 —
Corporate-domestic 6,458 — 6,458 —
Corporate-international 748 — 748 —
TOTAL TRADING SECURITIES $ 139,563 127,450 12,113 —
LIABILITIES
Interest rate swaps $ (42) — (42) —
(B) FAIR VALUE MEASUREMENTS ON A NONRECURRING BASISThe following table presents fair value measurements of nonfinancial assets that are measured at fair value on a nonrecurring basis at March 31, 2018 and 2017 (in thousands):
TOTAL LEVEL 1 LEVEL 2 LEVEL 3TOTAL
LOSSES
2018
Property and equipment $ 49,180 — 49,180 — 3,292
2017
Property and equipment 56,681 — 56,681 — 8,916
During 2018 and 2017, as a result of the decreased economic activity in Alaska and North Dakota’s oilfields, the Corporation performed an impairment analysis on its property and equipment used in oilfield services. The estimated undiscounted future cash flows generated by the property and equipment were deemed to be less than its carrying value. The carrying value of the property and equipment was reduced to fair value. Management estimated fair value based on observable market transactions involving sales of comparable equipment.

54 55BBNC FY2018 ANNUAL REPORT FINANCIALS
(9) NOTES PAYABLE
Notes payable consists of the following (in thousands):
MARCH 31
2018 2017
$60,000,000 bank line of credit, interest based at PC’s option at LIBOR plus 0.80% (2.68% at March 31, 2018), secured by PC’s accounts receivable, commitment expires June 1, 2019
$ 2,174 —
$1,000,000 short-term notes payable by PC to village corporations, interest at 3.13%, notes due on October 31, 2018, guaranteed by the corporation
1,000 1,000
$ 3,174 1,000
PC entered into the Fourth Amendment to the September 30, 2010, Wells Fargo line of credit as amended, effective in May 2016. The maximum borrowings available under the facility are $60.0 million, and borrowing capacity was determined on a borrowing base of 80% of eligible accounts receivable which secures the line of credit. For the years ended March 31, 2018 and 2017, PC borrowed up to $4.1 and $3.3 million, respectively, against the line of credit. As of March 31, 2018, PC’s eligible accounts receivable totaled $40.9 million. This amended line of credit expires on June 1, 2019, and includes financial covenant requirements that PC maintain a minimum tangible net worth and a minimum fixed charge coverage ratio.
(10) LONG-TERM DEBT
Long-term debt consists of the following (in thousands):
MARCH 31
2018 2017
$75,000,000 revolving note payable to bank, interest based upon the London Interbank Offering Rate (LIBOR) in effect as draws are made plus 0.3% (2.41% at March 31, 2018), collateralized by marketable securities, commitment expires June 1, 2019
$ 17,668 39,393
$14,700,000 term loan payable to bank, interest based upon the LIBOR in effect plus 1.70% (3.58% at March 31, 2018) payable in monthly amortizing payments for eight years starting December 2012, the balance remaining due December 2019, secured by a deed of trust on a building and assignment of rents
12,540 12,977
$60,000,000 term loan payable to bank interest based upon the LIBOR in effect plus a margin ranging from 1.75 to 3.50% based on a quarterly ratio of funded debt to EBITDA (4.50% at March 31, 2018) payable in monthly payments of $714,000 for five years starting November 2013, fully paid March 2018, secured by assets of Peak Oilfield Service Company LLC and guaranteed by the Corporation
— 31,428
$8,000,000 term loan payable to bank interest based upon the LIBOR in effect at month-end plus 1.25% (3.13% at March 31, 2018) payable in monthly payments of $100,437 for five years starting December 1, 2020, the remaining balance due November 1, 2020, which is unsecured
5,378 6,378
$10,000,000 term loan payable to bank, interest based upon the LIBOR in effect plus 1.25% (3.13% at March 31, 2018) payable in monthly amortizing payments for three years starting May 2016, the balance remaining due May 2019, which is unsecured
3,991 7,307
39,577 97,483
Less current maturities (5,002) (13,442)
$ 34,575 84,041
(c) The funds’ primary investment objective is to purchase and manage investment opportunities primarily in the United States and Canada. Investments include equity and debt securities, preferred stock, convertible securities, participation interest, swaps, and other contractual for derivative rights or instruments. These investments are invested in a broad range of industries.
(d) The fund invests in pooled investment vehicles managed by investment managers and direct investments. Portfolio investments typically involve direct or indirect securities of companies undergoing financial distress, operating difficulties, and significant restructuring.
The changes in investments using NAV reported as other investments on the consolidated balance sheet are as follows (in thousands):
MARCH 31
2018 2017
Beginning balance $ 35,519 22,099
Purchases 5,463 18,695
Return of capital (2,281) (7,581)
Unrealized gains included in investment earnings 3,658 2,306
Ending balance $ 42,359 35,519
The Corporation has an outstanding commitment to invest an additional $7,524,000 in the above funds.
(D) FAIR VALUE OPTIONASC 825 Financial Instruments provides the Corporation with an option to measure many financial instruments and certain other items at fair value. Under this guidance, unrealized gains and losses on items for which the fair value option (FVO) has been elected are reported in investment earnings at each reporting period. As a result of the Corporation electing this option, the Corporation records all of its private equity investment funds, which are included in other investments on the consolidated balance sheets at fair value. The Corporation records this financial instrument at fair value in order to measure those assets at amounts that more accurately reflect the current economic environment in which the Corporation operates.
(8) ACCOUNT TRADE RECEIVABLE
MARCH 31
2018 2017
ACCOUNTS RECEIVABLE, TRADE (IN THOUSANDS):
Billed accounts receivable $ 166,198 137,108
Unbilled accounts receivable 15,429 8,043
Contract retainage — 167
ACCOUNTS RECEIVABLE, TRADE (IN THOUSANDS) 181,627 145,318
Less allowance for doubtful accounts (828) (716)
TOTAL ACCOUNTS RECEIVABLE, TRADE, NET $ 180,799 144,602

56 57BBNC FY2018 ANNUAL REPORT FINANCIALS
(12) INCOME TAXES
On December 22, 2017, the Tax Cuts and Jobs Act (the Act) was signed into law. Among other provisions, the Act reduces the Federal statutory corporate income tax rate from 35% to 21% and allows the Corporation to elect annually to deduct contributions made to its settlement trust, subject to limitations. This rate reduction did have a significant impact on the Corporation’s provision for income taxes for the year ended March 31, 2018, due to the one-time impact resulting from the revaluation of deferred tax assets and liabilities to reflect the new lower rate. Recognition of the income tax impact of the Corporation’s election to deduct its contributions to its settlement trust was also significant.
The components of income tax expense (benefit) for the years ended March 31, 2018, 2017 and 2016 are as follows (in thousands):
2018 2017 2016
CURRENT:
Federal $ (6,681) 17,522 (4,818)
State 210 3,638 3,260
(6,471) 21,160 (1,558)
DEFERRED:
Federal (33,384) 1,927 (2,631)
State (6,493) 477 (686)
(39,877) 2,404 (3,317)
$ (46,348) 23,564 (4,875)
Income tax expense (benefit) differs from the amounts computed by applying the U.S. federal income tax rate of 31.5% for 2018 and 35.0% for 2017 and 2016 to pretax income as a result of the following (in thousands):
2018 2017 2016
Computed expected tax expense $ 17,916 22,631 13,586
State income tax (benefit) expense, net of federal effect (6,062) 2,883 1,647
Benefit of permanent differences (466) (1,001) (519)
Tax basis of oil and gas rights (42,378) — (19,540)
Settlement trust contributors (3,780) — —
Tax credits (4,263) — —
Other, including change in tax rates (7,315) (949) (49)
$ (46,348) 23,564 (4,875)
Scheduled principal payments on long-term debt are as follows (in thousands):
2019 $ 5,002
2020 31,479
2021 3,096
2022 —
2023 —
Thereafter —
TOTAL $ 39,577
The Corporation’s revolving note agreement requires collateral of marketable securities. Collateral value is determined by multiplying the applicable advance percentage provided in the collateral table for each type of eligible collateral pledged to the bank.
The $14,700,000 term loan payable has certain financial loan covenants that consist of a minimum basic fixed charge coverage ratio, unencumbered liquid assets, and debt service coverage ratio.
The $60,000,000 term loan payable has certain financial loan covenants that consist of a minimum basic fixed charge coverage ratio, minimum net worth, and maximum leverage ratio.
On December 1, 2012, through an interest rate swap agreement, the Corporation changed the interest rate on the $14,700,000 term loan to fix the floating LIBOR. Through December 1, 2019, the fixed rate is 1.716%. The swap’s fair value of the estimated termination asset of $114,000 at March 31, 2018, is included in other assets decreasing interest expense by $156,000 in 2018.
(11) BENEFIT PLANS
The Corporation maintains a 401(k) savings plan that contains a safe harbor matching contribution up to 5% of covered wages for all contributing employees. In addition, at the discretion of the Corporation’s Board of Directors, the Corporation may make a profit sharing contribution to the plan. Employee contributions were matched up to 5% of the employees’ salaries in 2018, 2017 and 2016, respectively. Amounts expensed for the plan for the years ended March 31, 2018, 2017 and 2016 were $14,984,000, $13,854,000 and $12,243,000, respectively.
The Corporation is self-insured for healthcare, which covers the majority of employees of the Corporation and its wholly owned subsidiaries. The cost of providing the benefits for employees and dependents is limited to agreed upon stop loss levels of $500,000 per claim on March 31, 2018 and 2017, the Corporation had accrued liabilities of approximately $5,178,000 and $4,647,000, respectively.
The Corporation has a large deductible insurance plan for workers’ compensation covering all employees except foreign employees and employees in the states of Washington, North Dakota, Wyoming, and Ohio on March 31, 2018 and 2017, the Corporation had accrued liabilities recorded of approximately $2,926,000 and $2,502,000, of which $1,319,000 and $1,809,000, respectively, was for workers’ compensation claims incurred but not reported. At March 31, 2018 and 2017, the Corporation had a $3,750,000 and $3,300,000, respectively, letter of credit balance held by its workers’ compensation insurer pursuant to the terms of a collateral agreement with the insurer.

58 59BBNC FY2018 ANNUAL REPORT FINANCIALS
During 2018, the Corporation recorded tax benefits related to research credits for fiscal years ended March 31, 2014, 2015, 2016, 2017 and 2018 for federal and state returns of $2,931,000 and $250,000, respectively. A portion of the unrecognized tax benefit related to research credits has been presented in the financial statements as a reduction of the deferred tax asset for research credits.
There are currently no extensions of the normal statute of limitations period for IRS examinations for any fiscal year. For years before 2014, the Corporation is no longer subject to U.S. federal or state income tax examinations. Unrecognized tax benefits amount to $81.8 million at March 31, 2018.
The Corporation’s policy is to recognize the tax basis of an ANCSA asset when either a sale or first commercial devel-opment occurs. For 2018, the Corporation has ANCSA assets where the tax basis has been determined, and there are no current plans for sale or commercial development. If the tax basis of these assets were recognized, gross deferred tax assets would increase by approximately $40.6 million, and a valuation allowance would also be established in the amount of $40.6 million.
(13) LEASES
PC leases most of its fueling sites and administrative office space under noncancelable operating leases, which expire at various times through 2028. Peak Oilfield Service Company leases most of its operational sites and administrative office space under noncancelable operating leases which expire at various times through 2025. CCI Industrial Services leases a warehouse and administrative offices under leases that expire through 2025. Some of the PC leases also require a contingent rent based upon gallons of fuel sold. Included in total rental expenses for March 31, 2018, 2017 and 2016 are contingent rents of $118,000, $86,000 and $112,000, respectively. At March 31, 2018, the minimum rental commitments under noncancelable operating leases payable over the remaining lives of the leases are as follows (in thousands):
MINIMUM RENTALS
2019 8,287
2020 6,635
2021 5,940
2022 5,354
2023 5,177
Thereafter 5,143
$ 36,536
Total rental expense charged to operations in 2018, 2017 and 2016 was $9,590,000, $9,190,000 and $7,821,000, respectively.
Commencing in November 2012, the Corporation entered into a noncancelable operating lease of a building and land with a tenant expiring in 10 years. This building under lease had an aggregate cost and accumulated depreci-ation of $15,695,000 and $2,080,000 on March 31, 2018, and an aggregate cost and accumulated depreciation of $15,695,000 and $1,687,740 on March 31, 2017, respectively.
Commencing in July 2016, the Corporation entered into a noncancelable operating lease of land and buildings with a tenant expiring in 25 years. This land and building under lease had an aggregate cost and accumulated depreciation of $3,493,000 and $148,000 on March 31, 2018, and an aggregate cost of $3,463,000 on March 31, 2017.
The income tax effects of temporary differences that give rise to significant portions of the deferred tax assets and deferred tax liabilities at March 31, 2018 and 2017 are presented below:
2018 2017
DEFERRED TAX ASSETS:
Net operating loss-state $ 6,287 50
Net operating loss-federal $ 22,987 —
Tax credits 1,968 —
Accounts receivable allowance 222 294
Prepaid expenses and other 153 96
Incurred-but-not-reported claims 367 816
Accrued liabilities 4,430 6,672
TOTAL GROSS DEFERRED TAX ASSETS 36,414 7,928
DEFERRED TAX LIABILITIES:
Property, plant, and equipment (12,274) (17,668)
Intangibles (2,358) (2,955)
Unrealized holding gains on investments (4,373) (10,737)
Investment in joint ventures (3,313) (2,349)
TOTAL GROSS DEFERRED TAX LIABILITIES (22,318) (33,709)
NET DEFERRED TAX ASSET (LIABILITY) $ 14,096 (25,781)
In assessing the realizability of deferred tax assets, management considers whether it is more likely than not that some portion or all of the deferred tax assets will not be realized. The ultimate realization of deferred tax assets is dependent upon the generation of future taxable income during the periods in which those temporary differences become deductible. Management considers the scheduled reversal of deferred tax liabilities (including the effect of available carryback and carryforward periods), projected future taxable income, and tax-planning strategies in making this assessment. Based upon the level of historical taxable income and projections for future taxable income over the periods in which the deferred tax assets are deductible, management believes it is more likely than not that the Corporation will realize the benefits of these deductible differences and carryforwards. The amount of the deferred tax asset considered realizable, however, could be reduced in the near term if estimates of future taxable income during the carryforward period are reduced.
The Corporation has an income tax receivable at March 31, 2018, of $6,393,000 included in prepaid expenses and refundable taxes.
During 2018, the Corporation sold the oil and gas rights on 47,170 acres for $155,000 and recognized a loss of approximately $246,145,000 for tax purposes. The tax loss offset 2018 taxable income and generated federal and state net operating losses of approximately $190,743,000 and $172,865,000, respectively. A portion of the unrecognized tax benefit related to the sale of ANCSA subsurface properties has been presented in the financial statements as a reduction of the deferred tax asset for net operating losses.
During 2018, the Corporation recorded a tax benefit related to its FY15 contribution of $10,779,000 to the BBNC Elders’ Trust. As a result of this change, the Corporation expects to receive federal and state tax refunds of approximately $3,780,000 and $750,000, respectively.

60 61BBNC FY2018 ANNUAL REPORT FINANCIALS
At March 31, 2018, the minimum future rental revenues under these noncancelable operating leases are as follows (in thousands):
MINIMUM RENTALS
2019 $ 2,197
2020 2,286
2021 2,385
2022 2,485
2023 2,590
Thereafter 17,577
$ 29,520
(14) CONTINGENCIES
In the normal course of business, the Corporation may be a participant in legal proceedings related to the conduct of its businesses that will result in contingent liabilities or contingent assets that are not reflected in the accompanying consolidated financial statements. In the opinion of management, the financial position, results of operations, or liquidity of the Corporation will not be materially affected by any such current legal proceeding.
The Corporation has entered into contracts to provide services to commercial and government agencies. The majority of these contracts are subject to audits and potential adjustments by the respective customer. At this time, there are no pending audits or audit adjustments on the government contracts. Management believes that any adjustments that could potentially be made under the contract will not have a significant impact on the Corporation’s financial position, results of operation, or liquidity.
(15) CREDIT RISK
The Corporation maintains its cash in accounts with third party financial institutions which, at times, may exceed federally insured limits. The Corporation has not experienced any losses in such accounts.
(16) CONCENTRATION OF REVENUE AND RECEIVABLES
During fiscal year 2018, 95% of the Corporation’s government and construction services revenues were derived from contracts with U.S. government agencies. A significant portion of these contracts were granted under the Small Business Administration (SBA) 8(a) program that exempts U.S. government granting agencies from certain federal procurement regulations when awarding contracts to 8(a) participants. The SBA further exempts awarding agencies from certain contract size limitations when awarding contracts to 8(a) participants owned by Alaska Native Corporations. Changes in U.S. government spending, the 8(a) program, or both, could have a significant positive or negative impact on the liquidity, results of financial operations, and financial condition of the Corporation. As of March 31, 2018, 49% of trade accounts receivable are due from government agencies.
(17) SUBSEQUENT EVENTS
On May 23, 2018, the Board of Directors of the Corporation declared a $10.10 share dividend payable to shareholders of record of Class A and B stock as of May 15, 2018. The dividend was paid on June 1, 2018. The total dividend amount was approximately $5,455,000.
The Corporation has evaluated subsequent events from the consolidated balance sheet date through June 8, 2018, the date at which the consolidated financial statements were available to be issued, and determined there are no other items to disclose.
AUDIT COMMITTEE REPORTJune 8, 2018
The Audit Committee of the Board of Directors of Bristol Bay Native Corporation (BBNC) is responsible for providing independent, objective oversight of the Corporation’s accounting functions and internal controls over financial reporting (internal controls) in accordance with the Charter of the Audit Committee. The Audit Committee is comprised of four (4) directors appointed by the Chairman, Board of Directors. Management is responsible for the Corporation’s internal controls and financial reporting process. The independent auditors are responsible for performing an independent audit of the Corporation’s consolidated financial statements in accordance with auditing standards generally accepted in the United States of America and to issue a report thereon. The Audit Committee’s responsibility is to assist the Board in monitoring and overseeing these processes.
In connection with those responsibilities, the Audit Committee met with management and the independent auditors to review and discuss the March 31, 2018, consolidated financial statements. The Audit Committee also discussed with the independent auditors the following matters required by the AICPA Auditing Standards-Section 380, The Auditor’s Communications with those Charged with Governance:
• The independent auditors’ responsibilities with regard to the financial statement audit.
• Planned scope and timing of the audit.
• The independent auditors’ concurrence with the qualitative aspects of the Corporation’s significant accounting practices, including accounting policies, accounting estimates, and financial statement disclosures.
• No identified audit adjustments recorded and no audit adjustments proposed but not recorded.
• No disagreements with Management that would cause a modification of auditors’ report.
• No consultation with other independent accountants.
• Other information in documents containing audited financial statements.
• The relationship between the independent auditors and the Corporation that may bear on the auditor’s independence.
Based upon the Audit Committee’s discussion with management and the independent auditors, and the Audit Commit-tee’s review of the representation of management and the independent auditors, the Audit Committee recommended that the Board of Directors accept and include the audited consolidated financial statements in the Corporation’s Annual Report to Shareholders for the year ended March 31, 2018.
Everette AndersonAUDIT COMMITTEE CHAIR
Other audit commitee members:KARL HILL MELVIN BROWN KIMBERLY WILLIAMS

18 BBNC FY2018 ANNUAL REPORT
PG. 4: Perryville, AK. PG. 6: Togiak Culture
Camp participants. PG. 9: (TOP) Curyung
Tribal Council culture camp participants gather
to learn about boats and commercial fishing,
Dillingham, AK; (BOTTOM) Willie Wassillie
carving ivory in his studio, Togiak, AK. PG. 11:
Place Names project signage in Iguigig, AK. PG.
12: View of the Wood River near Dillingham,
AK. INSIDE BACK COVER: Perryville, AK.
62 BBNC FY2018 ANNUAL REPORT
STATEMENT OF MANAGEMENT RESPONSIBILITYJune 8, 2018
The management of Bristol Bay Native Corporation has a fiduciary responsibility to the Shareholders of the Corporation to maintain an adequate system of internal controls surrounding financial reporting. This includes the fair presentation of the financial condition and results of the Corporation’s operations, in accordance with Generally Accepted Accounting Principles, as included in the audited financial statements and the Annual Report. Management takes this responsibility very seriously and promotes the concept of good internal control by communicating the importance of internal control to all levels of the organization.
Management has established a system of internal controls designed to provide reasonable assurance that financial reports are timely and accurate, the Corporation complies with laws and regulations in the conduct of its business, and that operations are generally conducted in an efficient and effective manner. These internal controls also help ensure that business is transacted in accordance with corporate policy, including ethics and integrity guidelines estab-lished by the Corporation. No system of internal controls can provide complete assurance in any of these areas, and effective internal controls are no guarantee of the success of any business venture. But in pursuing Bristol Bay Native Corporation’s mission, vision, and goals, management is committed to maintaining rigorous and effective oversight over the operations and administration of the Corporation’s business, through an effective internal control structure.
The internal control structure surrounding financial reporting is monitored on an ongoing basis by the individuals responsible for the controls, and on a more structured basis by Internal Audit. Internal controls are also subject to an annual assessment by the Corporation’s external auditors, to facilitate the adequate planning and execution of the audit of financial statements. Appropriate actions are taken to address identified deficiencies in internal controls.
This letter serves as management’s acknowledgment of its responsibility for the accurate and timely preparation and distribution of financial information, including the financial statements presented in this Annual Report. Management has prepared the audited financial statements included in the Annual Report and is not aware of any untrue statements of material fact or omissions thereof that would make the statements misleading. Based on management’s knowledge, the financial statements and other financial information included in the Annual Report fairly present, in all material respects, the financial condition and results of operations of the Corporation as of, and for, the periods presented.
Joseph L. Chythlook CHARIMAN, BOARD OF DIRECTORS
Jason MetrokinPRESIDENT AND CHIEF EXECUTIVE OFFICER
Ryan YorkEXECUTIVE VICE PRESIDENT AND CHIEF FINANCIAL OFFICER

111 WEST 16TH AVENUE, SUITE 400 | ANCHORAGE, AK 99501
907.278.3602 | WWW.BBNC.NET