Molybdenum(VI) Oxosulfato Complexes in MoO K S O K ... - DTU
12
Molybdenum(VI) Oxosulfato Complexes in MoO 3 −K 2 S 2 O 7 −K 2 SO 4 Molten Mixtures: Stoichiometry, Vibrational Properties, and Molecular Structures Angelos G. Kalampounias, † George Tsilomelekis, † Rolf W. Berg, ‡ and Soghomon Boghosian* ,† † Department of Chemical Engineering, University of Patras and Institute of Chemical Engineering and High Temperature Chemical Processes (FORTH/ICE-HT), GR-26500 Patras, Greece ‡ Chemistry Department, The Technical University of Denmark, DK-2800 Kongens Lyngby, Denmark * S Supporting Information ABSTRACT: The structural and vibrational properties of molybdenum(VI) oxosulfato complexes formed in MoO 3 −K 2 S 2 O 7 and MoO 3 −K 2 S 2 O 7 −K 2 SO 4 molten mixtures under an O 2 atmosphere and static equilibrium conditions were studied by Raman spectroscopy at temperatures of 400−640 °C. The corresponding composition effects were explored in the X MoO 3 0 =0−0.5 range. MoO 3 undergoes a dissolution reaction in molten K 2 S 2 O 7 , and the Raman spectra point to the formation of molybdenum(VI) oxosulfato complexes. The MoO stretching region of the Raman spectrum provides sound evidence for the occurrence of a dioxo Mo(O) 2 configuration as a core. The stoichiometry of the dissolution reaction MoO 3 + nS 2 O 7 2− → C 2n− was inferred by exploiting the Raman band intensities, and it was found that n = 1. Therefore, depending on the MoO 3 content, monomeric MoO 2 (SO 4 ) 2 2− and/or associated [MoO 2 (SO 4 ) 2 ] m 2m− complexes are formed in the binary MoO 3 −K 2 S 2 O 7 molten system, and pertinent structural models are proposed in full consistency with the Raman data. A 6-fold coordination around Mo is inferred. Adjacent MoO 2 2+ cores are linked by bidentate bridging sulfates. With increasing temperature at concentrated melts (i.e., high X MoO 3 0 ), the observed spectral changes can be explained by partial dissociation of [MoO 2 (SO 4 ) 2 ] m 2m− by detachment of S 2 O 7 2− and formation of a MoOMo bridge. Addition of K 2 SO 4 in MoO 3 −K 2 S 2 O 7 results in a “follow-up” reaction and formation of MoO 2 (SO 4 ) 3 4− and/or associated [MoO 2 (SO 4 ) 3 ] m 4m− complexes in the ternary MoO 3 −K 2 S 2 O 7 −K 2 SO 4 molten system. The 6- fold Mo coordination comprises two oxide ligands and four O atoms linking to coordinated sulfate groups in various environments of reduced symmetry. The most characteristic Raman bands for the molybdenum(VI) oxosulfato complexes pertain to the Mo(O) 2 stretching modes: (1) at 957 (polarized) and 918 (depolarized) cm −1 for the ν s and ν as Mo(O) 2 modes of MoO 2 (SO 4 ) 2 2− and [MoO 2 (SO 4 ) 2 ] m 2m− and (2) at 935 (polarized) and 895 (depolarized) cm −1 for the respective modes of MoO 2 (SO 4 ) 3 4− and [MoO 2 (SO 4 ) 3 ] m 4m− . The results were tested and found to be in accordance with ab initio quantum chemical calculations carried out on [MoO 2 (SO 4 ) 3 ] 4− and [{MoO 2 } 2 (SO 4 ) 4 (μ-SO 4 ) 2 ] 8− ions, in assumed isolated gaseous free states, at the DFT/B3LYP (HF) level and with the 3-21G basis set. The calculations included determination of vibrational infrared and Raman spectra, by use of force constants in the Gaussian 03W program. ■ INTRODUCTION The structure of the vanadium(V) oxosulfato complexes formed following the dissolution of V 2 O 5 in molten alkali pyrosulfates, alkali sulfates, and mixtures thereof has been studied extensively 1−3 because of the importance of the pertinent molten salts as constituents of the supported liquid catalytic phase of the sulfuric acid catalyst. 4 Interestingly, a number of other transition-metal oxides have also been found to exhibit solubility in molten alkali pyrosulfate and alkali pyrosulfate/alkali sulfate mixtures, forming metal oxosulfato complexes. A procedure for inferring the stoichiometry of such solutes in molten salt solvents has been derived, based on Received: July 6, 2012 Revised: August 14, 2012 Published: August 14, 2012 Article pubs.acs.org/JPCA © 2012 American Chemical Society 8861 dx.doi.org/10.1021/jp306701k | J. Phys. Chem. A 2012, 116, 8861−8872
Transcript of Molybdenum(VI) Oxosulfato Complexes in MoO K S O K ... - DTU

Molybdenum(VI) Oxosulfato Complexes in MoO3−K2S2O7−K2SO4Molten Mixtures: Stoichiometry, Vibrational Properties, andMolecular StructuresAngelos G. Kalampounias,† George Tsilomelekis,† Rolf W. Berg,‡ and Soghomon Boghosian*,†
†Department of Chemical Engineering, University of Patras and Institute of Chemical Engineering and High Temperature ChemicalProcesses (FORTH/ICE-HT), GR-26500 Patras, Greece‡Chemistry Department, The Technical University of Denmark, DK-2800 Kongens Lyngby, Denmark
*S Supporting Information
ABSTRACT: The structural and vibrational properties of molybdenum(VI) oxosulfato complexes formed in MoO3−K2S2O7and MoO3−K2S2O7−K2SO4 molten mixtures under an O2 atmosphere and static equilibrium conditions were studied by Ramanspectroscopy at temperatures of 400−640 °C. The corresponding composition effects were explored in the XMoO3
0 = 0−0.5 range.MoO3 undergoes a dissolution reaction in molten K2S2O7, and the Raman spectra point to the formation of molybdenum(VI)oxosulfato complexes. The MoO stretching region of the Raman spectrum provides sound evidence for the occurrence of adioxo Mo(O)2 configuration as a core. The stoichiometry of the dissolution reaction MoO3 + nS2O7
2− → C2n− was inferred byexploiting the Raman band intensities, and it was found that n = 1. Therefore, depending on the MoO3 content, monomericMoO2(SO4)2
2− and/or associated [MoO2(SO4)2]m2m− complexes are formed in the binary MoO3−K2S2O7 molten system, and
pertinent structural models are proposed in full consistency with the Raman data. A 6-fold coordination around Mo is inferred.Adjacent MoO2
2+ cores are linked by bidentate bridging sulfates. With increasing temperature at concentrated melts (i.e., highXMoO3
0 ), the observed spectral changes can be explained by partial dissociation of [MoO2(SO4)2]m2m− by detachment of S2O7
2−
and formation of a MoOMo bridge. Addition of K2SO4 in MoO3−K2S2O7 results in a “follow-up” reaction and formation ofMoO2(SO4)3
4− and/or associated [MoO2(SO4)3]m4m− complexes in the ternary MoO3−K2S2O7−K2SO4 molten system. The 6-
fold Mo coordination comprises two oxide ligands and four O atoms linking to coordinated sulfate groups in variousenvironments of reduced symmetry. The most characteristic Raman bands for the molybdenum(VI) oxosulfato complexespertain to the Mo(O)2 stretching modes: (1) at 957 (polarized) and 918 (depolarized) cm−1 for the νs and νas Mo(O)2modes of MoO2(SO4)2
2− and [MoO2(SO4)2]m2m− and (2) at 935 (polarized) and 895 (depolarized) cm−1 for the respective
modes of MoO2(SO4)34− and [MoO2(SO4)3]m
4m−. The results were tested and found to be in accordance with ab initio quantumchemical calculations carried out on [MoO2(SO4)3]
4− and [{MoO2}2(SO4)4(μ-SO4)2]8− ions, in assumed isolated gaseous free
states, at the DFT/B3LYP (HF) level and with the 3-21G basis set. The calculations included determination of vibrationalinfrared and Raman spectra, by use of force constants in the Gaussian 03W program.
■ INTRODUCTION
The structure of the vanadium(V) oxosulfato complexesformed following the dissolution of V2O5 in molten alkalipyrosulfates, alkali sulfates, and mixtures thereof has beenstudied extensively1−3 because of the importance of thepertinent molten salts as constituents of the supported liquidcatalytic phase of the sulfuric acid catalyst.4 Interestingly, anumber of other transition-metal oxides have also been found
to exhibit solubility in molten alkali pyrosulfate and alkalipyrosulfate/alkali sulfate mixtures, forming metal oxosulfatocomplexes. A procedure for inferring the stoichiometry of suchsolutes in molten salt solvents has been derived, based on
Received: July 6, 2012Revised: August 14, 2012Published: August 14, 2012
Article
pubs.acs.org/JPCA
© 2012 American Chemical Society 8861 dx.doi.org/10.1021/jp306701k | J. Phys. Chem. A 2012, 116, 8861−8872

Raman band intensity correlations.5 The dissolution of metaloxides at moderate or elevated temperatures (such as in moltenpyrosulfate) has drawn interest from the point of view of metalore extraction and recovery of metal oxides (e.g., catalyst activephases consisting of V2O5, WO3, Nb2O5, MoO3, ZnO; catalystcarriers such as TiO2, ZrO2). Thus, high-temperature Ramanspectroscopy has been used for establishing the stoichiometryas well as the structural and vibrational properties of the metaloxosulfato complexes formed by dissolution of ZnO in moltenK2S2O7 and Na2S2O7
6 and of Nb2O5 and WO3 in moltenK2S2O7 and K2S2O7−K2SO4.
7,8 In addition, by cooling therespective precursor melts under appropriate gas atmospheres,a large family of crystalline compounds has been synthesizedand subjected to single-crystal X-ray analysis, thereby enablingthe structural characterization of VIII,9−11 VIV,12−15 VV,16,17
NbV,18 TaV,18 WVI,19−21 and MoVI 22,23 crystalline sulfato oroxosulfato complexes. Notably, the precipitation of VIII, VIV,and VV crystalline salts has been shown to be responsible forthe deactivation of the sulfuric acid catalyst, causing depletionof the active phase from its V content.4,24−26
Although the type of complexes formed during thedissolution of molybdenum(VI) oxide in pure molten alkalipyrosulfate is not known, it is expected that MoVI forms anionicsulfato and/or oxosulfato complexes in molten pyrosulfates inanalogy to VV,1−3 NbV,7 and WVI.8 The present study isconcerned with the structural and vibrational properties of thecomplexes formed in the molten binary MoO3−K2S2O7 andternary MoO3−K2S2O7−K2SO4 systems. Raman spectroscopywas used at temperatures of 400−650 °C under staticequilibrium conditions for studying the molten mixtures withXMoO3
0 = 0−0.5 (XMoO3
0 denotes the initial MoO3 mole fractionin the MoO3−K2S2O7 binary mixture). Incremental amounts ofK2SO4 were added to each binary mixture with n(SO4
2−)/n(Mo) = 0−2, where n(SO4
2−)/n(Mo) (hereafter denoted Y) isthe number of moles of K2SO4 added per Mo atom in eachmixture. The use of the Raman data obtained for the moltenmixtures is shown to be adequate for inferring thestoichiometry of the MoO3 dissolution reaction
+ →− −nMoO S O C n3 2 7
2 2(1)
The effects of temperature and composition on the Ramanspectra of the MoO3−K2S2O7 and MoO3−K2S2O7−K2SO4systems were investigated to establish the existence of thestructural units present in conjunction with consistentexperimental band assignments also based on comparison totheoretical spectra predicted by ab initio DFT/B3LYPcalculations with Gaussian 3-21G basis sets. These results adddetailed confidence to our present understanding of thechemistry of the systems. Moreover, from the point of viewof more topical interest, the Raman band characteristics (i.e.,band wavenumber, intensity and polarization properties) ofMoO stretching modes in oxomolybdenum cores ofmolybdenum(VI) oxosulfato complexes are expected to shedadditional light in the debate concerning the configuration of(MoOx)n sites in supported MoO3 catalysts.
27−30
■ EXPERIMENTAL SECTIONMaterials and Sample Preparation. The samples were
prepared by mixing MoO3 (Alfa Aesar, dried in vacuo for 1 h at140 °C before use) with K2SO4 (Fluka) and K2S2O7 made bythermal decomposition of K2S2O8 (Fluka), as describedpreviously.31 All handling of chemicals and filling of the
Raman optical cells [made of cylindrical fused silica tubing (6 ±0.1 mm o.d., 4 ± 0.1 mm i.d., and ∼3 cm length for the partcontaining the molten salts)] took place in a dry nitrogen-filledglovebox. The total amount of salt mixture added into each cellwas 400 mg. Proper mixing of the components was necessary,as the melting point of MoO3 (795 °C) is very high comparedto the fusion temperatures of the MoO3−K2S2O7 and MoO3−K2S2O7−K2SO4 mixtures. Thus, the optical cells were filledeither by transferring MoO3 and K2SO4 with approximatelyone-half of the K2S2O7 into the cell and then adding theremaining K2S2O7 on top or by grinding all componentsintimately in an agate mortar before transferring the mixtureinto the optical cell. The samples were sealed under a lowpressure (ca. 0.2 bar) of O2 (L’Air Liquide, 99.99%) to preventself-reduction of MoVI. Afterward, they were equilibrated at500−550 °C for a few days (up to 1 week) before Ramanspectra were recorded. The dissolution of MoO3 in moltenK2S2O7, although slow, was extensive; it was possible todissolve up to 50 mol % MoO3. Upon dissolution of whitemolybdenum oxide in colorless molten potassium pyrosulfate,the resulting melts became transparent yellow (pale to darkdepending on the MoO3 content) and viscous. Intermittently, itwas necessary to remove bubbles and/or accelerate thedissolution of solids by torching the samples. Lowering thesample temperature could cause the appearance of whiteneedles in the bulk melt, presumably due to the precipitation ofcrystalline complexes. Fast cooling of samples with high MoO3contents by immersion in water or liquid nitrogen led to theformation of glasses.The symbol Xi
0 is used to denote the mole fraction ofunreacted component i in the MoO3−K2S2O7 binary mixture(weighed amount) before any reaction had started. Thecomposition of the ternary mixture is defined by combiningXMoO3
0 (neglecting K2SO4) with the ratio Y [Y = n(SO42−)/
n(Mo)] of the number of sulfate groups added per Mo atom,which was varied between 0 and 2. After adequate equilibrationat 550 °C, all binary MoO3−K2S2O7 mixtures with XMoO3
0 = 0−0.5 were in the liquid (molten) state at 400 °C. The dissolutionof MoO3 was further facilitated in ternary mixtures wheresulfate was also present. Table 1 and Figure 1 summarize thecompositions of the samples made during the course of thepresent work.
Raman Spectroscopy. The Raman furnace for the opticalcells and the systematics for obtaining Raman spectra frommolten salts and vapors at high temperatures have beendescribed in detail elsewhere.2,3,5,32,33 Raman spectra wereexcited by the linearly polarized 532-nm line of an air-cooleddiode-pumped continuous-wave laser (Excelsior series, Spectra-Physics). The laser power at the sample was set at ∼100 mW.Raman spectra were recorded in a horizontal 90° scatteringgeometry using a collecting lens system (90- and 150-mm focallengths); the collected scattered light was passed through anotch filter to reject the Rayleigh scattering and analyzed with aJobin-Yvon IHR-320 (ISA-Horiba group) monochromatorequipped with a −70 °C thermoelectrically cooled charge-coupled device detector. The notch was tilted such that bandscould be detected quite close to the excitation line. Theresolution of the instrument was set at 2 cm−1 for the whole setof measurements. Both polarized (VV, vertical polarization ofthe incident laser and vertical analysis of the scattered light)and depolarized (VH, vertical polarization of the incident laserand horizontal analysis of the scattered light) scattering
The Journal of Physical Chemistry A Article
dx.doi.org/10.1021/jp306701k | J. Phys. Chem. A 2012, 116, 8861−88728862

geometries were employed. This was achieved with the aid of aset of Glan and Glan−Thompson polarizers (Hale) withextinction coefficients better than 10−6 and 10−7, respectively. Acalibration procedure using a CCl4 sample was regularly appliedto check the polarization and possible monochromator drifts.Accumulation times were adjusted to provide a very high signal-to-noise ratio.Modeling Structure and Vibrational Spectroscopy. Ab
initio quantum chemical molecular orbital calculations wereperformed using the Gaussian 03W program package34 on a 3-GHz personal computer as described previously.35 As inputdata, guessed geometries of monomeric MoO2(SO4)3
4− anddimeric [{MoO2}2(SO4)4(μ-SO4)2]
8− were used, constructed
in analogy with the established structures of theK4[MoO2(SO4)3]
22 and K8[{WO2}2(SO4)4(μ-SO4)2] crys-tals.20 The geometries of ions in a hypothetical gaseous freestate (without surrounding cations and without assuming anysymmetry) were optimized, minimizing the electronic energy asa function of the geometry under tight optimizationconvergence criteria using the modified GDIIS algorithm.Hartree−Fock/Kohn−Sham density functional theory (DFT)procedures were used with the spin-restricted Becke’s three-parameter approximation hybrid exchange functional (B3), theLee−Yang−Parr correlation and exchange functions (LYP),and Pople’s polarization split-valence Gaussian basis setfunctions without polarization functions or diffuse orbitals(B3LYP, 3-21G). The reason for this simple choice was the lackof a better set of functions for molybdenum. For[MoO2(SO4)3]
4−, the DFT/B3LYP/3-21G procedure involved408 basis functions, 756 primitive Gaussian functions, 408Cartesian basis functions, and 206 α and 206 β electrons. Forthe dimer, the calculation was about twice as complicated. Theoptimized results are given as sums of electronic and thermalfree energies in atomic units (hartrees), not including the zero-point energy correction. The vibrational frequencies andeigenvectors for each normal mode were calculated withoutadjusting force constants. The spectra were calculated with afactor of 1.22 scaling of the wavenumber values, and the hightemperature was modeled by assuming Gaussian band shapes of20 cm−1 half-widths at band half-heights.
■ RESULTS AND DISCUSSIONRaman Spectra of Binary MoO3−K2S2O7 Molten
Mixtures. Several cells were made, containing MoO3−K2S2O7 mixtures with initial MoO3 mole fractions in therange XMoO3
0 = 0−0.5 (for sample compositions, see Table 1,
cells 1−7); sealed under an oxygen atmosphere (PO2= 0.2
atm); and heated until dissolution and equilibrium wereattained. Raman spectra were recorded at four differenttemperatures in the range of 400−640 °C. Figure 2 showsrepresentative Raman spectra obtained for all molten MoO3−K2S2O7 samples at 450 °C, together with the Raman spectra ofpure molten K2S2O7, which are well-known
3,36 and are includedin Figure 2 for comparison. The most characteristic bands dueto the S2O7
2− ion in molten K2S2O7 at 450 °C occur at 1085cm−1 (terminal stretching), 730 cm−1 (bridging SOSstretching), and 318 cm−1 (SOS deformation). Upondissolution of MoO3, several new bands emerge in the Ramanspectra that can be attributed to MoVI complex formation, andtheir wavenumbers and polarization characteristics arecompiled in Table 2. In total, 11 polarized and 5 depolarizedbands are observed due to the MoVI complex formed. Notably,with increasing formal content of MoO3, the intensities of allbands ascribed to the complex(es) increase monotonicallyrelative to the intensities of the S2O7
2− bands, therebyindicating that all of the bands arise from one type of MoVI
complex. This is further justified by the lack of compositioneffects in the relative intensities of the bands ascribed to thecomplex. Furthermore, the bands due to the solvent S2O7
2− ionappear to diminish, indicating that the dissolution reactiontakes place at the expense of S2O7
2− and results in theformation of one complex species, most likely according to eq 1(see earlier). The bands due to the MoVI complex predominatein the Raman spectra of molten mixtures with XMoO3
0 ≥ 0.25. Asmall remainder of the main S2O7
2− 1085 cm−1 band can be
Table 1. Relative Molar Compositions, XMoO3
0 ,a andIndicators of Incremental Sulfate Content, n(SO4
2−)/n(Mo),of MoO3−K2S2O7−K2SO4 Samples, along with OrdinaryMole Fractions,b XMoO3
and XK2SO4
cell no. XMoO3
0 a Y = n(SO42−)/n(Mo) XMoO3
b XK2SO4
b
1 0 − 0 02 0.102 − 0.102 03 0.200 − 0.200 04 0.249 − 0.249 05 0.330 − 0.330 06 0.402 − 0.402 07 0.500 − 0.500 08 0.201 0.51 0.182 0.0939 0.203 0.99 0.169 0.16710 0.203 1.98 0.145 0.28611 0.249 0.51 0.221 0.11212 0.250 1.01 0.199 0.20213 0.249 2.01 0.166 0.33314 0.329 0.50 0.283 0.14215 0.329 1.01 0.247 0.24916 0.330 2.00 0.199 0.39717 0.500 0.51 0.398 0.20218 0.499 1.01 0.332 0.33519 0.497 2.01 0.249 0.500
aXMoO3
0 denotes the mol fractions of unreacted components of the
MoO3−K2S2O7 binary mixture (weighed amounts) before any reactionhad started and any K2SO4 had been added. bXMoO3
, XK2SO4, and XK2SO7
denote the ordinary mole fractions, which sum to 1 in thehomogeneous melt.
Figure 1. Ternary diagram of the mole fractions showing thecompositions of the samples.
The Journal of Physical Chemistry A Article
dx.doi.org/10.1021/jp306701k | J. Phys. Chem. A 2012, 116, 8861−88728863

seen in the Raman spectrum obtained for the XMoO3
0 = 0.5sample, and the structural implications of this observation arediscussed in a later section (vide infra).The most prominent bands attributable to the MoVI complex
(C2n−) are the 1046, 957, and 389 cm−1 polarized bands andthe 918 cm−1 depolarized band, the last of which can bediscerned in the VH spectrum of the XMoO3
0 = 0.5 sampledisplayed in Figure 2. Among these bands, the 957 cm−1
polarized band and the 918 cm−1 depolarized band occur inthe MoO stretching region. Interestingly, the occurrence ofone polarized band and one depolarized band in the MoOstretching region is, in principle, suggestive of a dioxo OMoO configuration. A dioxo MO2 (M = transition metal)unit has two stretching modes (both Raman-active), namely, asymmetric mode (νs) and an antisymmetric mode (νas), wherethe symmetric stretching mode exhibits a much higher Ramanintensity and has a wavenumber that is 10−40 cm−1 highercompared to the corresponding vibrational properties of theantisymmetric mode.37 Moreover, in contrast to the νs mode,which exhibits a polarized Raman band, the νas mode isdepolarized, as expected. The wavenumbers, Raman intensities,and polarization properties of the 957 and 918 cm−1 bandsconstitute an exact match of the vibrational properties expectedfor a dioxo MoVIO2
2+ unit and are therefore assigned as beingdue to the νs and νas Mo(O)2 stretching modes, respectively.Notably, MoIVO2 matrix-isolated molecules at 4 K exhibit thecorresponding pair of νs/νas modes at 948/899 cm−1,respectively,38 in good agreement with the 957/918 cm−1
counterparts observed in Figure 2 for the MoO22+ core of the
MoVI complex. Measured wavenumbers of MoO stretchingvibrations, for mono-oxo and dioxo Mo model compounds ofinterest to the present study, are compiled in Table 3(including references). Often, the gaseous transition-metaloxyhalides are used as models for predicting the vibrationalpositions of oxometallic functionalities. However, such aprediction is not straightforward because the ligand field (andthe coordination) around the Mo atom is expected to affect thewavenumbers of the Mo(O)2 entities. Thus, for compoundswith comparable configurations, ligands with high electro-negativity (e.g., halides) create an environment around the Moatom that tends to strengthen the MoO bond. This is in fullconformity with the trends seen in Table 3.Among the rest of the observed bands due to the MoVI
complex, those located at wavenumbers higher than 450 cm−1
can be assigned to sulfate vibrational modes in environments ofreduced symmetry due to coordination and/or bridging. Thefundamentals for the ideal tetrahedral Td sulfate conformationspan the irreducible representation
ν ν ν νΓ = + + +A ( ) E( ) 2F ( )vib 1 1 2 2 3 4
Group theory predicts Raman activity for all modes, whereasonly the F2 modes are infrared-allowed; modes labeled ν1 andν3 are stretchings within the approximation of weak couplings,whereas modes ν2 and ν4 are bendings. Moreover, the “ideal”wavenumbers for the four fundamentals are known fromRaman spectra of aqueous solutions: ν1(A1) ≈ 980 cm−1, ν2(E)≈ 450 cm−1, ν3(F2) ≈ 1100 cm−1, and ν4(F2) ≈ 615 cm−1.37
However, symmetry alterations caused by coordination andbridging are expected to perturb the ideal behavior and give riseto band shifts, degeneracy lifts, and symmetry reduction of thesulfate modes. In particular, the terminal SO stretching of acoordinated SO4 moiety is expected to be blue-shifted, and
Figure 2. Raman spectra of molten MoO3−K2S2O7 mixtures (0 <XMoO3
0 < 0.50) in an oxygen atmosphere (PO2= 0.2 atm) at 450 °C.
XMoO3
0 denotes the mole fraction of MoO3. Laser wavelength, λ0 = 532nm; laser power, w = 100 mW; resolution, 2 cm−1.
Table 2. Raman Band Wavenumbers (cm−1) andAssignments for Molybdenum(VI) Oxosulfato ComplexesFormed in Molten MoO3−K2S2O7/O2(l) and MoO3−K2S2O7−K2SO4/O2(l) Mixturesa
MoO3−K2S2O7(l) binary mixturesMoO3−K2S2O7−K2SO4(l) ternary
mixtures
bandlocation at450 °Cb(cm−1)
tentative assignment forMoO2(SO4)2
2−(l) and[MoO2(SO4)2]n
2n−(l)
bandlocation at635 °C(cm−1)
tentative assignment forMoO2(SO4)3
4−(l) and[MoO2(SO4)3]n
4n−(l)
1270 (w,dp)
ν3(SO4) (1220) (w,dp)
ν3(SO4)
1180 (m,p)
ν3(SO4)
1155 (w,dp)
ν3(SO4) 1175 (m,p)
ν3(SO4)
1085 (w,p)
ν1(S2O7)
1046 (s, p) ν1(SO4) 1041 (vs,p)
ν1(SO4)
957 (vs, p) νs[Mo(O)2] 935 (s, p) νs[Mo(O)2]918 (s, dp) νas[Mo(O)2] 895 (s, dp) νas[Mo(O)2]∼880 (br,p?)c
ν(MoOMo)
664 (m, p) ν4(SO4) 657 (s, p) ν4(SO4)622 (w, p) ν4(SO4) 600 (m,
dp)ν4(SO4)
590 (w,dp)
ν4(SO4)
540 (w, p) ν2(SO4) ? 498 (m, p) ν2(SO4)480 (w, p?) ν2(SO4) 476 (w, p) ν2(SO4)389 (s, p) ν(MoO) 383 (s, p) ν(MoO)280 (sh, p) 273 (s, p)236 (s, dp) νbending[Mo(O)2] 230 (m,
dp)νbending[Mo(O)2]
aAbbreviations: s, strong; m, medium; w, weak; br, broad; v, very; sh,shoulder; p, polarized; dp, depolarized. bSee Figure 2. cObscured band(see Figure 6).
The Journal of Physical Chemistry A Article
dx.doi.org/10.1021/jp306701k | J. Phys. Chem. A 2012, 116, 8861−88728864

therefore, the 1046 cm−1 polarized band can be assigned to therespective mode of a coordinated SO4
2− group (see Table 2).Bands due to the MoVI complex with wavenumbers below 450cm−1 are assigned either to Mo(O)2 bendings or to MoOmodes [not belonging to the Mo(O)2 core that also exhibitsthe 957/918 cm−1 symmetric and antisymmetric counterpartmodes] within the coordination sphere around Mo.Stoichiometry of the MoVI Complex in the Binary
MoO3−K2S2O7 System. The above preliminary assignment ofthe 957 cm−1 polarized band and the 918 cm−1 depolarizedband as being due to the νs and νas modes, respectively, of adioxo MoO2
2+ unit and the observation of one single polarizedband in the SO terminal stretching region (1046 cm−1) isadequate for inferring that the MoVI complex formed accordingto eq 1 consists of MoO2
2+ and SO42− units. The determination
of the stoichiometry of reaction 1 from the Raman data (e.g.,Figure 2) is based on the application of a procedure1,5 thatcorrelates the relative Raman band intensities with thestoichiometric coefficient, n. Reaction 1 is assumed to becomplete (i.e., MoO3 is completely dissolved), and eachequilibrium mixture is assumed to consist of the complexspecies formed, C2n−, and the remainder of the S2O7
2−. Thebasic concept of the method originates from the theory ofvibrational Raman scattering from an assembly of randomlyoriented molecules, for which detailed derivations and formulascan be found in ref 45. For the purpose of the present analysis,we note that the measured integrated Raman intensity due to avibrational fundamental ν(i) of species j, Ij,ν(i), is directly relatedto the number of moles of species j, Nj, contained in thescattering volume according to
ν=νI A
f i TN
1[ ( ), ]j i j, ( )
(2)
where f [ν(i),T] is the Boltzmann thermal population factor
ν ν= − −⎡⎣⎢
⎤⎦⎥f i T
hc ikT
[ ( ), ] 1 exp( )
which disentangles the experimentally measured Ramanintensities from temperature effects. Factors including molec-
ular scattering properties, excitation laser wavelength, andinstrumental response are embodied in the parameter A. Fordetermining the stoichiometry, n, we note that the intensityquotient
ν
ν= ν
ν
−
−
− − −
− − −I
I f T N
I f T N
{ [ (S O ), ]}/
{ [ (C ), ]}/n0 S O , (S O ) 2 7
2eq,S O
C , (C )2
eq,Cn n n
2 72
2 72
2 72
2 2 2 (3)
expressing the ratio of the scattering power per ion of S2O72− to
the scattering power per ion of C2n− should be a universalconstant independent of cell composition and total amounts ofmoles contained in the scattering volume. Neq,S2O7
2− and Neq,C2n−
are the numbers of moles of the components S2O72− and C2n−
present in each final equilibrium mixture. Now, if one assumesthat eq 1 is the only stoichiometric process taking place,Neq,S2O7
2− and Neq,C2n− can be expressed in terms of the
stoichiometry as
= −− −N N nNeq,S O S O0
MoO0
2 72
2 72
3 (4)
=−N Neq,C MoO0
n23 (5)
Therefore, it turns out that, if a correct choice of n is made, eq 3should result in the same value of I0 using the Neq,S2O7
2− andNeq,C
2n− values computed for each initial composition togetherwith the Raman intensity data from each corresponding cell.Although it is immaterial which particular band represents eachspecies, it is preferable that bands due to symmetric modes thatdo not overlap with other bands be chosen. As a general rule,the band choice should pertain to strong, sharp, symmetric, andpolarized bands.Six binary MoO3−K2S2O7 mixtures were prepared (cells 2−7
in Table 1), and the Raman spectra of the corresponding meltswere recorded under static equilibrium (Figure 2). The 957cm−1 band due to symmetric Mo(O)2 stretching was chosenas representative of the MoVI complex (C2n−), and the 1085cm−1 symmetric stretching was chosen as representative ofS2O7
2−. The integrated Raman intensities (peak areas) werethen measured for each cell. The pertinent data are compiled inTable S1 (Supporting Information). I0 was then computed for
Table 3. MoO Stretching Wavenumbers for Different Mono-Oxo and Dioxo Molybdenum Compounds
compound νs[Mo(O)2]a (cm−1) νas[Mo(O)2]
b (cm−1) ν(MoO) (cm−1) ref(s)
MοIVO2c 948 899 38
MoO2Cl2 994 972 39996 966 40997 971 41996d 968d 42
MoO2Br2 995 970 37MoO2(L
n)EtOH 937 902 43[MoO2(SO4)2]n
2n− 957 918 this work[MoO2(SO4)3]n
4n− 935 895 this work[MoOCl4]
− e 1008 37MoOCl4 1015 37, 39MoOF4 1030 39
1050 37H3SiM12O40
f 1006 44(MoOx)n/TiO2 994 29, 30(MoOx)n/ZrO2 985−995g 27(MoOx)n/Al2O3 994−1002g 27
aSymmetric stretching. bAntisymmetric stretching. cIn a neon matrix (4 K). dIn a N2 matrix.eMo(IV). fKeggin cluster, containing mono-oxo Mo
O units. gDepending on Mo loading.
The Journal of Physical Chemistry A Article
dx.doi.org/10.1021/jp306701k | J. Phys. Chem. A 2012, 116, 8861−88728865

four parametric choices for n (i.e., n = 0.5, 1, 1.5, and 2) for allsix mixtures, as summarized in Table S2 (SupportingInformation). Figure 3 shows plots of the I0 quotient as a
function of XMoO3
0 for the four choices of n. The correct value ofn giving rise to a constant value for I0 is obviously n = 1, asillustrated by the horizontal line in Figure 3. Thus, the productformula of reaction 1 is MoS2O10
2−. A plausible structuralinterpretation is that the MoVI complex contains a MoO2
2+ coreand coordinated SO4
2− ligands in accordance with the followingsimplest form for reaction 1
+ →− −MoO S O MoO (SO )3 2 72
2 4 22
(6)
Although the results shown in Figure 3 are based on the Ramanspectra obtained for the molten MoO3−K2S2O7 mixtures at 450
°C, the same value for the stoichiometry (n = 1) was foundusing the spectral data obtained at 400, 550, and 640 °C(results not shown). Therefore, reaction 6 must be thestoichiometric process taking place in the temperature rangeof 400−640 °C. However, it should be regarded only as ascheme accounting for the formation of the MoO2(SO4)2
2−
unit, which should occur only as a monomer in dilute melts,whereas associated polymeric [MoO2(SO4)2]m
2m− units and/orthree-dimensional [MoO2(SO4)2]m
2m− networks are expectedto be formed for increasing XMoO3
0 . In the same context, it
should be noted that melts with XMoO3
0 ≥ 0.2 exhibit highviscosity and glass-forming ability upon quenching.
St ructura l Models for MoO2 (SO4 ) 22− and
[MoO2(SO4)2]m2m−: Structural Alterations upon Heating.
Taking into account the fact that the MoVI complex consists ofa dioxo MoO2
2+ core and two coordinated sulfate groups, itturns out that the simplest and most plausible structural modelfor MoO2(SO4)2
2− is the one shown in Figure 4A, involvinghexa coordination for Mo in conformity with its coordinationchemistry. The Mo atom is located in the center of a MoO6(distorted) octahedron, of which the apical and one equatorialposition are occupied by two oxide ligands forming a bentdioxo MoO2
2+ unit, whereas the remaining four positions of thefirst coordination sphere are occupied by the two bidentatechelating sulfates. One bidentate chelate sulfate group iscoordinated to the equatorial plane, and the other iscoordinated to the remaining axial and equatorial vertexes ofthe octahedron. However, it is known that transition-metaloxosulfato complexes tend to associate to each other throughbridging bidentate sulfate groups, forming chainlike ornetworklike polymeric anionic complexes.1−3,7,8,46−49 It isevident that the extent of association of MoO2(SO4)2
2− unitsis favored with increasing XMoO3
0 . Figure 4B shows possiblealternative structural models for the [MoO2(SO4)2]m
2m− chainsand/or networks. The association between adjacent MoO2
2+
cores can take place either by single bidentate bridging sulfate
Figure 3. Plot of the intensity quotient, I0, for four assumed values ofthe stoichiometric coefficient, n.
Figure 4. (A) Plausible structural model for the monomeric MoO2(SO4)22− complex with two chelate sulfate groups. (B) Alternative structural
models for associated/polymeric [MoO2(SO4)2]m2m− species. Model I involves one bridging sulfate and one bidentate chelating sulfate per Mo.
Model II involves molybdenum chains connected by both double and single bridging sulfates.
The Journal of Physical Chemistry A Article
dx.doi.org/10.1021/jp306701k | J. Phys. Chem. A 2012, 116, 8861−88728866

groups, giving rise to the formation of chains (model I in Figure4B), or by double bidentate bridging sulfates, thereby enablingthe three-dimensional growth of the polymers formed (modelII in Figure 4B). As shown in Figure 4B, within structuralmodel II, it is possible that two adjacent MoO2
2+ cores sharetwo bidentate bridging sulfates, thereby forming a doublesulfate bridge. The types of sulfate groups participating instructural models I and II (Figure 4B) include bidentatebridging (models I and II) and bidentate chelating groups(model I) with similar local symmetries, thereby justifying themoderate splitting of the degenerate ν2, ν3, and ν4 sulfatemodes observed in the Raman spectra of Figure 2.We now focus on an interesting composition and temper-
ature effect. From the context of the discussion on thestoichiometry of the MoVI complex, it turns out that a 1:1MoO3−K2S2O7 (i.e., XMoO3
0 = 0.50) molten mixture would reactstoichiometrically (mMoO3 + mS2O7
2− → [MoO2(SO4)2]m2m−)
with complete consumption of the pyrosulfate. However, asseen in the Raman spectrum obtained for the XMoO3
0 = 0.50sample at 450 °C (Figure 2) the characteristic 1085 cm−1
S2O72− band persists, thereby attesting to the presence of a
small amount of S2O72−, despite the complete consumption of
MoO3. An inspection (Figure 5) of the temperature depend-
ence (in the range of 400−640 °C) of the Raman spectra forthe XMoO3
0 = 0.50 sample in the stretching vibrationalwavenumber region reveals that the relative intensity of theS2O7
2− band increases with increasing temperature. Further-more, as seen in Figure 5, the 957/918 cm−1 MoO2 νs/νasstretching feature broadens, developing a low-frequency wing,and undergoes a ∼4 cm−1 blue shift with increasingtemperature. Actually, the 4 cm−1 blue shift is essentiallymuch more significant if one takes into account the fact that, inthe absence of other effects, a red shift would be expected withincreasing temperature because of Boltzmann distributionfactors and the closer packing of thermally excited vibrational
levels. Indeed, contrary to the νs/νas feature (blue shifting by∼4 cm−1), the corresponding S2O7
2− and SO42− bands are red-
shifted by 8 and 6 cm−1, respectively. Upon deconvolution ofthe pertinent spectral envelope (Figure 6), a broad band
appears at ∼880 cm−1, and its intensity increases withincreasing temperature (see Figure 6 inset). The observationsare interpreted to indicate that, with increasing temperature, anequilibrium shift takes place, resulting in release of S2O7
2−
together with a slight structural alteration in the coordinationaround Mo that that tends to strengthen the Mo(O)2 bondsslightly. Now, taking into account that the ca. 880 cm−1 broadband (Figure 6) lies in the expected region for MoOMofunctionalities,27,29,30 a scenario accounting for all of the aboveobservations is proposed in Figure 7, as follows. Withincreasing temperatures, cleavage of the double bidentatesulfate bridge takes place, resulting in detachment of a S2O7
2−
moiety and creation of a MoOMo bridge and asimultaneous “defect” in the coordination number of Mo,that is locally lowered from 6 to 5 in a pseudo-octahedralarrangement, thereby accounting for a slight strengthening ofthe bond order within the Mo(O)2 unit. The effect takesplace exclusively in melts with XMoO3
0 equal to or slightly lower
than 0.50, because an excess of S2O72− (i.e., for XMoO3
0 ≤ 0.40)would shift the scenario shown in Figure 7 to the left. Seenfrom a different angle, if the complete conversion had takenplace in a 1:1 MoO3−K2S2O7 (i.e., XMoO3
0 = 0.50) moltenmixture, it would be possible for the free energy of the systemto fall to an even lower value, if some of the MoVI complexformed were to dissociate according to the scheme in Figure 7,on account of the free energy of mixing of the species formed asa result of the proposed dissociation.
Figure 5. Temperature dependence of Raman spectra obtained formolten MoO3−K2S2O7 mixtures with XMoO3
0 = 0.50 in an oxygen
atmosphere (PO2= 0.2 atm). For spectrum recording parameters, see
the caption of Figure 2.
Figure 6. Temperature dependence of deconvoluted polarized (VV)Raman spectra obtained for molten MoO3−K2S2O7 mixtures withXMoO3
0 = 0.50 in an oxygen atmosphere (PO2= 0.2 atm). Open circles,
experimental data (only 20% of the points are shown for clarity); thicksolid red line, total fit curve; thin green lines, individual modesmodeled by Gaussian functions; thick blue solid line, 883 cm−1 mode,assigned to MoOMo functionalities. Inset: Temperature depend-ence of the 883 cm−1 band intensity. For spectrum recordingparameters, see the caption of Figure 2.
The Journal of Physical Chemistry A Article
dx.doi.org/10.1021/jp306701k | J. Phys. Chem. A 2012, 116, 8861−88728867
The first part of Table 2 compiles the detailed bandassignments, together with the intensity and polarizationcharacteristics in accordance with the structural modelproposed for the MoO2(SO4)2
2− complex.Raman Spectra of Ternary MoO3−K2S2O7−K2SO4
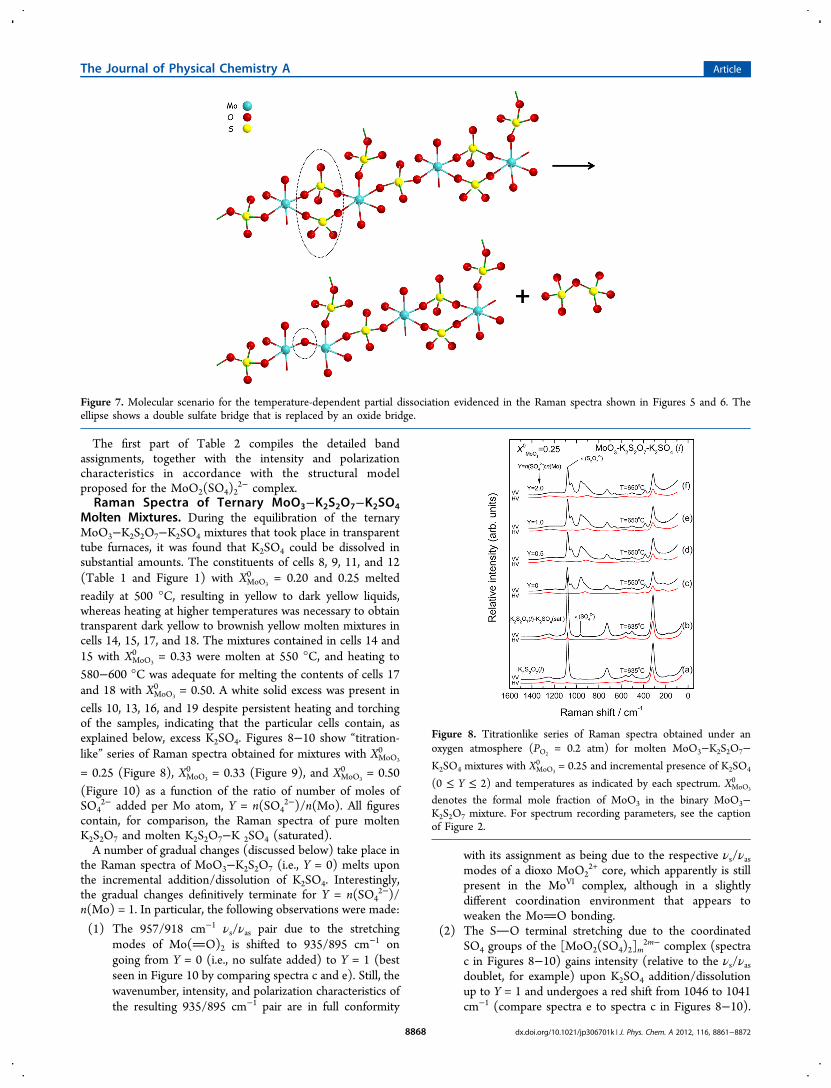
Molten Mixtures. During the equilibration of the ternaryMoO3−K2S2O7−K2SO4 mixtures that took place in transparenttube furnaces, it was found that K2SO4 could be dissolved insubstantial amounts. The constituents of cells 8, 9, 11, and 12(Table 1 and Figure 1) with XMoO3
0 = 0.20 and 0.25 meltedreadily at 500 °C, resulting in yellow to dark yellow liquids,whereas heating at higher temperatures was necessary to obtaintransparent dark yellow to brownish yellow molten mixtures incells 14, 15, 17, and 18. The mixtures contained in cells 14 and15 with XMoO3
0 = 0.33 were molten at 550 °C, and heating to580−600 °C was adequate for melting the contents of cells 17and 18 with XMoO3
0 = 0.50. A white solid excess was present incells 10, 13, 16, and 19 despite persistent heating and torchingof the samples, indicating that the particular cells contain, asexplained below, excess K2SO4. Figures 8−10 show “titration-like” series of Raman spectra obtained for mixtures with XMoO3
0
= 0.25 (Figure 8), XMoO3
0 = 0.33 (Figure 9), and XMoO3
0 = 0.50(Figure 10) as a function of the ratio of number of moles ofSO4
2− added per Mo atom, Y = n(SO42−)/n(Mo). All figures
contain, for comparison, the Raman spectra of pure moltenK2S2O7 and molten K2S2O7−K 2SO4 (saturated).A number of gradual changes (discussed below) take place in
the Raman spectra of MoO3−K2S2O7 (i.e., Y = 0) melts uponthe incremental addition/dissolution of K2SO4. Interestingly,the gradual changes definitively terminate for Y = n(SO4
2−)/n(Mo) = 1. In particular, the following observations were made:
(1) The 957/918 cm−1 νs/νas pair due to the stretchingmodes of Mo(O)2 is shifted to 935/895 cm−1 ongoing from Y = 0 (i.e., no sulfate added) to Y = 1 (bestseen in Figure 10 by comparing spectra c and e). Still, thewavenumber, intensity, and polarization characteristics ofthe resulting 935/895 cm−1 pair are in full conformity
with its assignment as being due to the respective νs/νasmodes of a dioxo MoO2
2+ core, which apparently is stillpresent in the MoVI complex, although in a slightlydifferent coordination environment that appears toweaken the MoO bonding.
(2) The SO terminal stretching due to the coordinatedSO4 groups of the [MoO2(SO4)2]m
2m− complex (spectrac in Figures 8−10) gains intensity (relative to the νs/νasdoublet, for example) upon K2SO4 addition/dissolutionup to Y = 1 and undergoes a red shift from 1046 to 1041cm−1 (compare spectra e to spectra c in Figures 8−10).
Figure 7. Molecular scenario for the temperature-dependent partial dissociation evidenced in the Raman spectra shown in Figures 5 and 6. Theellipse shows a double sulfate bridge that is replaced by an oxide bridge.
Figure 8. Titrationlike series of Raman spectra obtained under anoxygen atmosphere (PO2
= 0.2 atm) for molten MoO3−K2S2O7−K2SO4 mixtures with XMoO3
0 = 0.25 and incremental presence of K2SO4
(0 ≤ Y ≤ 2) and temperatures as indicated by each spectrum. XMoO3
0
denotes the formal mole fraction of MoO3 in the binary MoO3−K2S2O7 mixture. For spectrum recording parameters, see the captionof Figure 2.
The Journal of Physical Chemistry A Article
dx.doi.org/10.1021/jp306701k | J. Phys. Chem. A 2012, 116, 8861−88728868

This is interpreted to indicate that more sulfate groups(actually one more SO4 per Mo) are involved in the firstcoordination sphere of Mo.
(3) The 965 cm−1 v1(SO42−) band appears in all Raman
spectra of ternary mixtures with Y = 0.5 and Y = 1(Figures 8−10), because K2SO4 has a finite solubility inmolten K2S2O7, as judged also by comparing, for
example, spectra labeled a and b in Figures 8−10.Significantly, with increasing XMoO3
0 , this band becomesless prominent (spectra d and e in Figure 9) and/or ishardly seen (spectra d and e in Figure 10) because of themuch lower available amounts of free S2O7
2− and thesubsequent lower capacity for “physically” dissolvingSO4
2−.(4) Excess added K2SO4 (i.e., Y = 2) results in precipitation
of K2SO4 in the form of a white “cloud” in the bottom ofthe cell. The characteristic v1(SO4
2−) band at 965 cm−1 isseen in spectra f of Figures 8−10, superimposed on theνs/νas doublet.
These observations conform with a proposal according towhich the MoVI complex formed in the ternary MoO3−K2S2O7−K2SO4 molten system still consists of a MoO2
2+ dioxocore and coordinated sulfate ligands. More specifically, thespectral evidence described above points to a reaction“following up” the 1:1 reaction taking place in the binaryMoO3−K2S2O7 molten system with the involvement of onemore SO4 ligand coordinated per Mo atom in a 1:1:1 MoO3/K2S2O7/K2SO4 stoichiometry according to
+ + →− − −m m mMoO S O SO [MoO (SO ) ]mm
3 2 72
42
2 4 34
(7)
where the reaction is written in a generalized form to accountfor the formation of associated/polymeric molybdenum(VI)oxosulfato complexes. Figure 11 shows the Raman spectra
obtained at 650 °C for the ternary MoO3−K2S2O7−K2SO4mixtures with Y = n(SO4
2−)/n(Mo) = 1 and formal MoO3
contents of XMoO3
0 = 0.20 (Figure 11b), XMoO3
0 = 0.25 (Figure
11c), XMoO3
0 = 0.33 (Figure 11d), and XMoO3
0 = 0.50 (Figure
11e). It is seen that, with increasing XMoO3
0 , the bands ascribedt o t h e mo l y bd enum(V I ) o xo s u l f a t o c omp l e x ,
Figure 9. Titrationlike series of Raman spectra obtained under anoxygen atmosphere (PO2
= 0.2 atm) for molten MoO3−K2S2O7−K2SO4 mixtures with XMoO3
0 = 0.33 and incremental presence of K2SO4
(0 ≤ Y ≤ 2) and temperatures as indicated by each spectrum. XMoO3
0
denotes the formal mole fraction of MoO3 in the binary MoO3−K2S2O7 mixture. For spectrum recording parameters, see the captionof Figure 2.
Figure 10. Titrationlike series of Raman spectra obtained under anoxygen atmosphere (PO2
= 0.2 atm) for molten MoO3−K2S2O7−K2SO4 mixtures with XMoO3
0 = 0.50 and incremental presence of K2SO4
(0 ≤ Y ≤ 2) and temperatures as indicated by each spectrum. XMoO3
0
denotes the formal mole fraction of MoO3 in the binary MoO3−K2S2O7 mixture. For spectrum recording parameters, see the captionof Figure 2.
Figure 11. Raman spectra of molten MoO3−K2S2O7−K2SO4 mixtureswith Y = 1 [i.e., n(SO4
2−)/n(Mo) = 1] obtained in an oxygenatmosphere (PO2
= 0.2 atm) at 650 °C with XMoO3
0 as indicated by each
spectrum. XMoO3
0 denotes the formal mole fraction of MoO3 in thebinary MoO3−K2S2O7 mixture. For spectrum recording parameters,see the caption of Figure 2.
The Journal of Physical Chemistry A Article
dx.doi.org/10.1021/jp306701k | J. Phys. Chem. A 2012, 116, 8861−88728869

[MoO2(SO4)3]m4m−, increase in intensity relative to the
intensities of the “solvent”’ bands due to S2O72− and SO4
2−.The second part of Table 2 summarizes Raman band
wavenumbers, intensity and polarization characteristics, andband assignments, as discussed in the next section, along withthe proposed structural models for [MoO2(SO4)3]m
4m−.St ructura l Mode ls for MoO2(SO4 ) 3
4− and[MoO2(SO4)3]m
4m−. The proposed structural models forMoO2(SO4)3
4− in its monomeric and associated/polymericform, [MoO2(SO4)3]m
4m−, are inspired from the crystalstructures of the compounds K4MoO2(SO4)3 andNa4MoO2(SO4)3, respectively.22,23 As stated earlier, in thecontext of the discussion pertaining to Figures 8−10, theexistence of a strong polarized band at 935 cm−1 and a weakerdepolarized band at 895 cm−1 is in full conformity with theoccurrence of a dioxo MoO2
2+ unit (i.e., corresponding to itssymmetric and antisymmetric stretching modes) withinMoO2(SO4)3
4− and [MoO2(SO4)3]m4m−. By taking into
account the established existence of a dioxo MoO22+ core
with coordinated sulfate ligands and invoking a 6-foldcoordination for Mo, we propose the structural model depictedin Figure 12A for the monomeric MoO2(SO4)3
4− anionic
complex. The proposed configuration involves two unidentatesulfate groups and one bidentate chelating group. The oxideligands occupy one apical and one equatorial position, therebyforming a bent MoO2
2+ unit. The remaining four corners of theMoO6 distorted octahedron constituting the first coordinationsphere of Mo comprise O atoms linking to two unidentate andone bidentate chelating SO4 groups. With increasing formalcontent of MoO3, the bidentate chelating sulfate group “opensup” to become bridging to an adjacent Mo atom, and the vacantcoordination site can be occupied by a bridging sulfate fromanother adjacent MoO2(SO4)3
4− unit, thereby leading to thedouble bridged associated/polymeric configurations shown inFigure 12B,C.Of special interest is the following discussion on the
vibrational properties of the [MoO2(SO4)2]m2m− and
[MoO2(SO4)3]m4m− molybdenum(VI) oxosulfato complexes
formed in the MoO3−K2S2O7 and MoO3−K2S2O7−K2SO4
molten mixtures, respectively. The νs/νas pair of the Mo(O)2 symmetric and antisymmetric stretching modes occurs at935/895 cm−1 for the MoO2(SO4)3
4− complex, that is, ca. 25cm−1 lower compared to the respective 957/918 cm−1
counterparts of the MoO2(SO4)22− complex. The wave-
numbers, band relative intensities, and polarization character-istics of both νs/νas pairs are in full conformity with theexpected vibrational properties for symmetric and antisym-metric stretching modes of a transition-metal dioxo M(O)2unit (see also Table 3 for a summary of characteristicvibrational wavenumbers). The more congested coordinationaround the Mo atom of the MoO2(SO4)3
4− complex (i.e., onemore sulfate per Mo compared to the MoO2(SO4)2
2− species(see the proposed structural models in Figures 4 and 12)accounts for slightly weaker bonding within its MoO2
2+ coresand lower band wavenumbers for its νs/νas modes.Furthermore, the occurrence of unidentate SO4 groupsamong the SO4 groups within the MoO2(SO4)3
4− complexformed in the ternary system justifies a lower wavenumber forthe terminal SO stretching compared with the (exclusively)bidentate SO4 units participating in the MoO2(SO4)2
2− and[MoO2(SO4)2]m
2m− complexes in the binary system (1041versus 1046 cm−1).
Ab Init io Model ing of MoO2(SO4)34− and
[{MoO2}2(SO4)4(μ-SO4)2]8−. Based on the crystal structures
of K4[MoO2(SO4)3]22 and K8[{W
VIO2(SO4)2}2(μ-SO4)2],20 we
calculated optimized geometric structures for the[MoO2(SO4)3]
4− anion and the analogous MoVI anion[{MoVIO2(SO4)2}2(μ-SO4)2]
8− (see Figure 12A,B). Themodeling was limited to the available 3-21G basis set formolybdenum, but the predicted geometry for the[MoO2(SO4)3]
4− anion came out with reasonable parameters,as seen in Table S3 (Supporting Information). From thatgeometry, we calculated the vibrational modes for[MoO2(SO4)3]
4− (see Table S4, Supporting Information) andthe spectrum (shown in Figure 13). The structure andspectrum were calculated with the Gaussian 03W program.34
The calculated wavenumbers had to be scaled by a factor of1.22 to obtain acceptable values compared to experiment, butthis is understandable because the 3-21G basis set is verysimple. The chosen 3-21G basis set is the largest all-electron setavailable for molybdenum in Gaussian. This level of theory isknown to be deficient for hypervalent molecules because of alack of polarization functions, and anions generally requirediffuse functions. The use of this 3-21G set would result in SO distances that are too long and frequencies that are too small.This explains the need for scaling by a number larger than 1. Itshould be remembered that the corresponding experimentalmixture XMoO3
0 = 0.50 and Y = 1 (see Figure 10e) was in a stateof equilibrium and, therefore, even for MoO3/K2S2O7/K2SO4 =1:1:1 (in analogy with what was seen for tungsten21), gavesignals corresponding to the content of S2O7
2−. The bandshapes at the high experimental temperature were modeled byassuming Gaussian shapes of 20 cm−1 half-widths at half-heights. Two configurations were tried for the monomer, butthe one similar to that of the crystal structure22 was found to bethe most stable (Figure 12A). It seems that chelation takingplace opposite to the two oxide ligands (from [MoO2]
2+) ispreferred (minimum energy = −6194.34847461 Ha) relative toa configuration where the two oxide ligands (in [MoO2]
2+) areopposite to one terminal sulfate and one of the chelations(minimum energy = −6194.33727020 Ha). For the dimer
Figure 12. (A) Structural model for the monomer MoO2(SO4)34−
molten complex, according to ab initio DFT/B3LYP/3-21Gcalculations. (B) Structural model for the [{MoVIO2(SO4)2}2(μ-SO4)2]
8− dimer complex with two bridging sulfate groups and fourunidentate terminal sulfate groups. (C) Plausible section of anassociated/polymeric [MoO2(SO4)3]m
4m− molten complex.
The Journal of Physical Chemistry A Article
dx.doi.org/10.1021/jp306701k | J. Phys. Chem. A 2012, 116, 8861−88728870

[{MoVIO2(SO4)2}2(μ-SO4)2]8−, the calculated minimum was
found to be −12387.69014870 Ha (= −6193.84505745 × 2Ha). The structure of the optimized dimer geometry is given inFigure 12B, and the spectrum is also included in Figure 13. The102 normal modes of the dimer appear similar to the 48 modesof the monomer (Table S4, Supporting Information). Becausethe sulfates in the dimer are all unidentately terminal bound,the spectrum is simpler, and the minimum energy is not as lowas in the monomer.
■ CONCLUSIONSSolid molybdenum(VI) oxide dissolves in considerableamounts (i.e., up to XMoO3
0 = 0.50) in molten K2S2O7 atelevated temperatures (400 °C). The effects of compositionand temperature on the molecular structure and vibrationalproperties of the molybdenum(VI) oxosulfato complexesformed were studied by Raman spectroscopy up to 640 °Cand for 0 ≤ XMoO3
0 ≤ 0.50. The spectral features are fullyconsistent with the occurrence of a dioxo MoO2
2+ configurationas a core, with Mo in a distorted octahedral 6-fold coordination.The Raman band intensities were used to infer thestoichiometry of the complex formation reaction, and incombination with the vibrational properties established, it wasfound that the dissolution reaction has a 1:1 stoichiometry, thatis
+ →− −m mMoO S O [MoO (SO ) ]mm
3 2 72
2 4 22
accounting for the formation of monomeric (m = 1) species indilute melts and associated/polymeric units (m > 1) in moreconcentrated melts. Two bidentate chelating sulfates arepresent in the Mo coordination sphere in the case ofmomomeric MoO2(SO4)2
2−, whereas alternative possibilitiesinvolving bidentate bridging sulfates are incurred in the case of
polymeric [MoO2(SO4)2]m2m− units. The symmetric and
antisymmetric OMoO stretching (νs and νas) occur at957 cm−1 (strong, polarized) and 918 cm−1 (medium,depolarized), respectively, whereas the terminal SO stretch-ing of coordinated sulfates is observed at 1046 cm−1. Withincreasing temperature in concentrated melts (i.e., XMoO3
0 ≥0.40), a partial dissociation is evidenced, leading to theformation of MoOMo bridges as “defects” within thepolymeric chains.The study of the corresponding dissolution reaction of
MoO3 in K2S2O7 when K2SO4 is also present showed that amodified molybdenum(VI) oxosulfato complex is formedaccording to
+ + →− − −m m mMoO S O SO [MoO (SO ) ]mm
3 2 72
42
2 4 34
The Raman spectra showed that the resulting MoVI complexstill contains a dioxo MoO2
2+ core with the Mo atom in amodified distorted octahedral 6-fold coordination. Thecoordination sphere around each Mo atom involves (apartfrom the two oxide ligands) two unidentate sulfates and twobidentate bridging sulfates in a congested structural environ-ment, as a result of which the νs/νas Mo(O)2 stretchingcounterparts occur at lower wavenumbers, namely, 935 cm−1
(strong, polarized) and 895 cm−1 (medium, depolarized),respectively. Detailed structural models are proposed for theMoVI complexes in full consistency with the Raman bandassignments and ab initio modeling.
■ ASSOCIATED CONTENT*S Supporting InformationRelative integrated reduced Raman intensities (peak areas inarbitrary units) of representative bands of the C2n− MoVI
complex (at 957 cm−1) and the S2O72− solvent (at 1085
cm−1) measured from the Raman spectra of molten MoO3−K2S2O7 mixtures at 450 °C (Table S1); calculated equilibriummole fractions of MoVI complex (C2n−) and S2O7
2− and valuesof I0 (based on the main complex band at 957 cm−1) for variousassumed possible values for the stoichiometric coefficient, n, ofeq 1 (Table S2); comparison of the geometric parameters of anisolated [MoO2(SO4)3]
4− ion calculated by ab initio/DFTmethods (restricted B3LYP/3-21G) and found for the X-raystructure of the K4[MoO2(SO4)3]
22 (Table S3); and calculatedvibrational spectra and assignments for the [MoO2(SO4)3]
4−
ion (Table S4). This material is available free of charge via theInternet at http://pubs.acs.org.
■ AUTHOR INFORMATIONCorresponding Author*E-mail: [email protected]. Phone +30-2610 969557.NotesThe authors declare no competing financial interest.
■ REFERENCES(1) Boghosian, S.; Borup, F.; Chrissanthopoulos, A. Catal. Lett. 1997,48, 145.(2) Boghosian, S. J. Chem. Soc., Faraday Trans. 1998, 94, 3463.(3) Boghosian, S.; Chrissanthopoulos, A.; Fehrmann, R. J. Phys.Chem. B 2002, 106, 49.(4) Lapina, O. B.; Bal’zhinimaev, B.; Boghosian, S.; Eriksen, K. M.;Fehrmann, R. Catal. Today 1999, 51, 469.(5) Boghosian, S.; Berg, R. W. Appl. Spectrosc. 1999, 53, 565.(6) Berg, R. W.; Thorup, N. Inorg. Chem. 2005, 44, 3485.
Figure 13. Comparison of the experimental Raman spectrum for themolten ternary mixture with XMoO3
0 = 0.50 and Y = 1 at 650 °C (top)and spectra of monomeric [MoO2(SO4)3]
4− and dimeric[{MoVIO2(SO4)2}2(μ-SO4)2]
8− ions calculated by ab initio DFT/B3LYP/3-21G modeling in the isolated state. The calculatedwavenumbers have been scaled by a factor of 1.22. Band shapeswere modeled by assuming Gaussian shapes of 20 cm−1 half-widths athalf-heights, corresponding approximately to the high temperature of650 °C.
The Journal of Physical Chemistry A Article
dx.doi.org/10.1021/jp306701k | J. Phys. Chem. A 2012, 116, 8861−88728871

(7) Paulsen, A. L.; Borup, F.; Berg, R. W.; Boghosian, S. J. Phys.Chem. A 2010, 114, 7485.(8) Paulsen, A. L.; Kalampounias, A. G.; Berg, R. W.; Boghosian, S. J.Phys. Chem. A 2011, 115, 4214.(9) Fehrmann, R.; Krebs, B.; Papatheodorou, G. N.; Berg, R. W.;Bjerrum, N. J. Inorg. Chem. 1986, 25, 1571.(10) Berg, R. W.; Boghosian, S.; Bjerrum, N. J.; Fehrmann, R.; Krebs,B.; Strater, N.; Mortensen, O. S.; Papatheodorou, G. N. Inorg. Chem.1993, 32, 4714.(11) Boghosian, S.; Fehrmann, R.; Nielsen, K. Acta Chem. Scand.1994, 48, 724.(12) Fehrmann, R.; Boghosian, S.; Berg, R. W.; Papatheodorou, G.N.; Nielsen, K.; Bjerrum, N. J. Inorg. Chem. 1989, 28, 1847.(13) Fehrmann, R.; Boghosian, S.; Berg, R. W.; Papatheodorou, G.N.; Nielsen, K.; Bjerrum, N. J. Inorg. Chem. 1990, 29, 3294.(14) Boghosian, S.; Eriksen, K. M.; Fehrmann, R.; Nielsen, K. ActaChem. Scand. 1995, 49, 703.(15) Nielsen, K.; Boghosian, S.; Fehrmann, R.; Berg, R. W. ActaChem. Scand. 1999, 53, 15.(16) Karydis, D. A.; Boghosian, S.; Nielsen, K.; Eriksen, K. M.;Fehrmann, R. Inorg. Chem. 2002, 41, 2417.(17) Rasmussen, S. B.; Boghosian, S.; Nielsen, K.; Eriksen, K. M.;Fehrmann, R. Inorg. Chem. 2004, 43, 3697.(18) Borup, F.; Berg, R. W.; Nielsen, K. Acta Chem. Scand. 1990, 44,328.(19) Stah̊l, K.; Berg, R. W. Acta Crystallogr. E: Struct. Rep. Online2009, E64, i88.(20) Cline Schaf̈fer, S. J.; Berg, R. W. Acta Crystallogr. E: Struct. Rep.Online 2005, E61, i49.(21) Berg, R. W.; Ferre,́ I. M.; Cline Schaf̈fer, S. J. Vib. Spectrosc.2006, 42, 346.(22) Cline Schaf̈fer, S. J.; Berg, R. W. Acta Crystallogr. E: Struct. Rep.Online 2008, E64, i20.(23) Cline Schaf̈fer, S. J.; Berg, R. W. Acta Crystallogr. E: Struct. Rep.Online 2008, E64, i73.(24) Boghosian, S.; Fehrmann, R.; Bjerrum, N. J.; Papatheodorou, G.N. J. Catal. 1989, 119, 121.(25) Eriksen, K. M.; Karydis, D. A.; Boghosian, S.; Fehrmann, R. J.Catal. 1995, 155, 32.(26) Christodoulakis, A.; Boghosian, S. J. Catal. 2003, 215, 139.(27) Tsilomelekis, G.; Boghosian, S. Catal. Today 2010, 158, 146.(28) Tian, H.; Roberets, C. A.; Wachs, I. E. J. Phys. Chem. C 2010,114, 14110.(29) Tsilomelekis, G.; Boghosian, S. J. Phys. Chem. C 2011, 115,2146.(30) Tsilomelekis, G.; Boghosian, S. Phys. Chem. Chem. Phys. 2012,14, 2216.(31) Hansen, N. H.; Fehrmann, R.; Bjerrum, N. J. Inorg. Chem. 1982,21, 744.(32) Boghosian, S.; Papatheodorou, G. N. J. Phys. Chem. 1989, 93,415.(33) Knudsen, C.; Kalampounias, A. G.; Fehrmann, R.; Boghosian, S.J. Phys. Chem. B 2008, 112, 11996.(34) Frisch, M. J.; Trucks, G. W.; Schlegel, H. B.; Scuseria, G. E.;Robb, M. A.; Cheeseman, J. R.; Montgomery, J. A., Jr.; Vreven, T.;Kudin, K. N.; Burant, J. C.; Millam, J. M.; Iyengar, S. S.; Tomasi, J.;Barone, V.; Mennucci, B.; Cossi, M.; Scalmani, G.; Rega, N.;Petersson, G. A.; Nakatsuji, H.; Hada, M.; Ehara, M.; Toyota, K.;Fukuda, R.; Hasegawa, J.; Ishida, M.; Nakajima, T.; Honda, Y.; Kitao,O.; Nakai, H.; Klene, M.; Li, X.; Knox, J. E.; Hratchian, H. P.; Cross, J.B.; Bakken, V.; Adamo, C.; Jaramillo, J.; Gomperts, R.; Stratmann, R.E.; Yazyev, O.; Austin, A. J.; Cammi, R.; Pomelli, C.; Ochterski, J. W.;Ayala, P. Y.; Morokuma, K.; Voth, G. A.; Salvador, P.; Dannenberg, J.J.; Zakrzewski, V. G.; Dapprich, S.; Daniels, A. D.; Strain, M. C.;Farkas, O.; Malick, D. K.; Rabuck, A. D.; Raghavachari, K.; Foresman,J. B.; Ortiz, J. V.; Cui, Q.; Baboul, A. G.; Clifford, S.; Cioslowski, J.;Stefanov, B. B.; Liu, G.; Liashenko, A.; Piskorz, P.; Komaromi, I.;Martin, R. L.; Fox, D. J.; Keith, T.; Al-Laham, M. A.; Peng, C. Y.;Nanayakkara, A.; Challacombe, M.; Gill, P. M. W.; Johnson, B.; Chen,
W.; Wong, M. W.; Gonzalez, C.; Pople, J. A. Gaussian 03W, revisionB.04; Gaussian, Inc.: Pittsburgh, PA, 2003.(35) Berg, R. W. Z. Naturforsch. A 2007, 62a, 157.(36) Dyekjaer, J. D.; Berg, R. W.; Johansen, H. J. Phys. Chem. A 2003,107, 5826.(37) Nakamoto, K. Infrared and Raman Spectra of Inorganic andCoordination Compounds, 6th ed.; Wiley Interscience: New York, 2009.(38) Hewett, W. D., Jr; Newton, J. H.; Weltner, W., Jr. J. Phys. Chem.1975, 24, 2640.(39) Ward, B. G.; Stafford, F. G. Inorg. Chem. 1968, 7, 2569.(40) Beattie, I. R.; Livingstone, K. M. S.; Reynolds, D. J.; Ozin, G. A.J. Chem. Soc. A 1970, 1210.(41) Neikrik, D. L.; Fagerli, J. C.; Smith, M. L.; Mosman, D.; Devore,T. C. J. Mol. Struct. 1991, 244, 165.(42) Levason, W.; Narayanaswamy, R.; Ogden, J. S.; Rest, A. J.; Turff,J. W. J. Chem. Soc., Dalton Trans. 1982, 2010.(43) Gupta., S.; Barik, A. K.; Pal, S.; Hazra, A.; Roy, S.; Butcher, R. J.;Kar, S. K. Polyhedron 2007, 26, 133.(44) Lee, E. L.; Wachs, I. E. J. Phys. Chem. C 2007, 111, 14410.(45) Long, D. A. Raman Spectroscopy, McGraw-Hill; London, 1977;Chapter 4.(46) Fehrmann, R.; Gaune-Escard, M.; Bjerrum, N. J. Inorg. Chem.1986, 25, 1132.(47) Hatem, G.; Fehrmann, R.; Gaune-Escard, M.; Bjerrum, N. J. J.Phys. Chem. 1987, 91, 195.(48) Folkmann, G.; Hatem, G.; Fehrmann, R.; Gaune-Escard, M.;Bjerrum, N. J. Inorg. Chem. 1993, 32, 1559.(49) Karydis, D. A.; Erisken, K. M.; Fehrmann, R.; Boghosian, S. J.Chem. Soc., Dalton Trans. 1994, 2151.
The Journal of Physical Chemistry A Article
dx.doi.org/10.1021/jp306701k | J. Phys. Chem. A 2012, 116, 8861−88728872


![2410U10-1 – NEW AS S16-2410U10-1 CHEMISTRY – …pmt.physicsandmathstutor.com/download/Chemistry/A-level...2.ive the oxidation number of molybdenum in the ion MoO G 4 2 –. [1]](https://static.fdocuments.in/doc/165x107/5adb1d9d7f8b9a6d7e8d9368/2410u10-1-new-as-s16-2410u10-1-chemistry-pmt-the-oxidation-number-of.jpg)