Molecular component in the Milky Way IRAM Summer School Lecture 2 Françoise COMBES.
Upload
agnes-ballCategory
view
214download
0
Molecules at high z, Perspectives
SAAS-FEE Lecture 8
Françoise COMBES
2
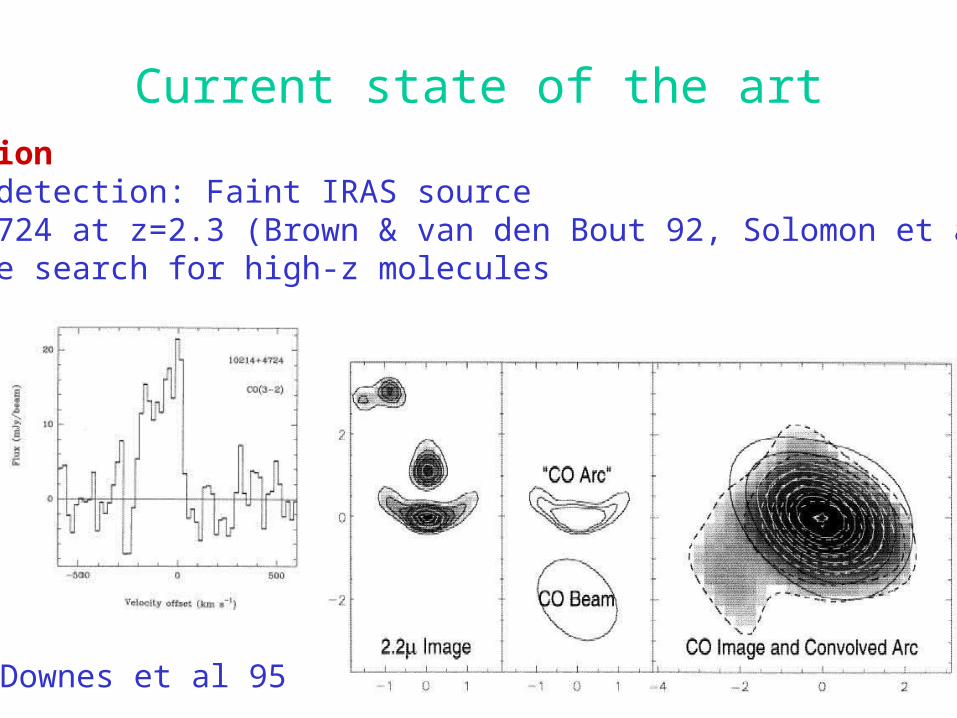
Current state of the artCO emissionthe 1st detection: Faint IRAS sourceF10214+4724 at z=2.3 (Brown & van den Bout 92, Solomon et al 92)drove the search for high-z molecules
Downes et al 95
3
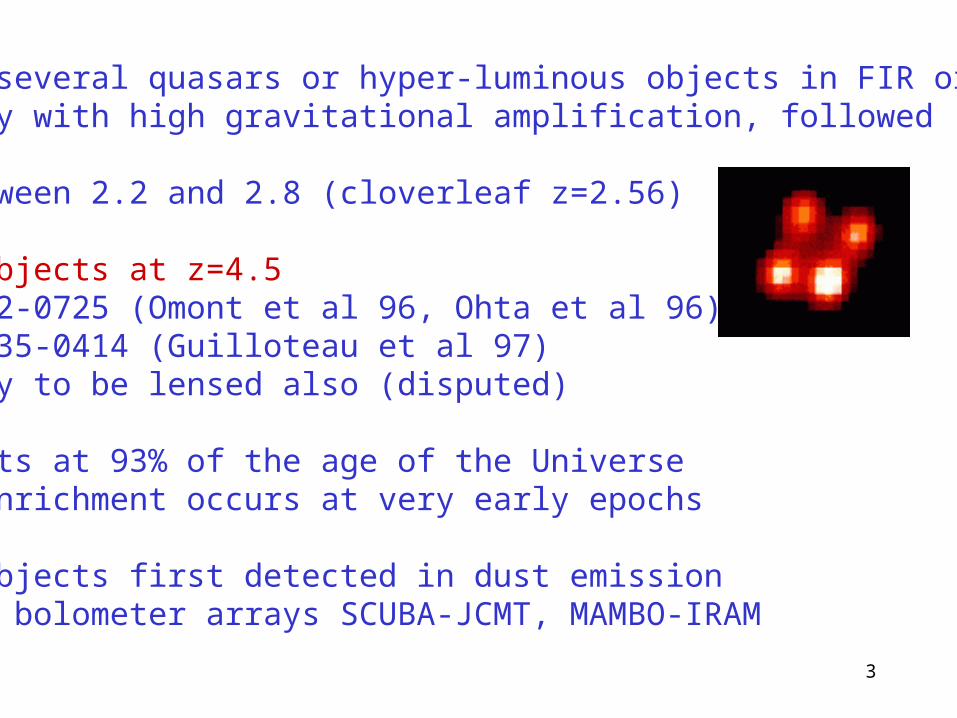
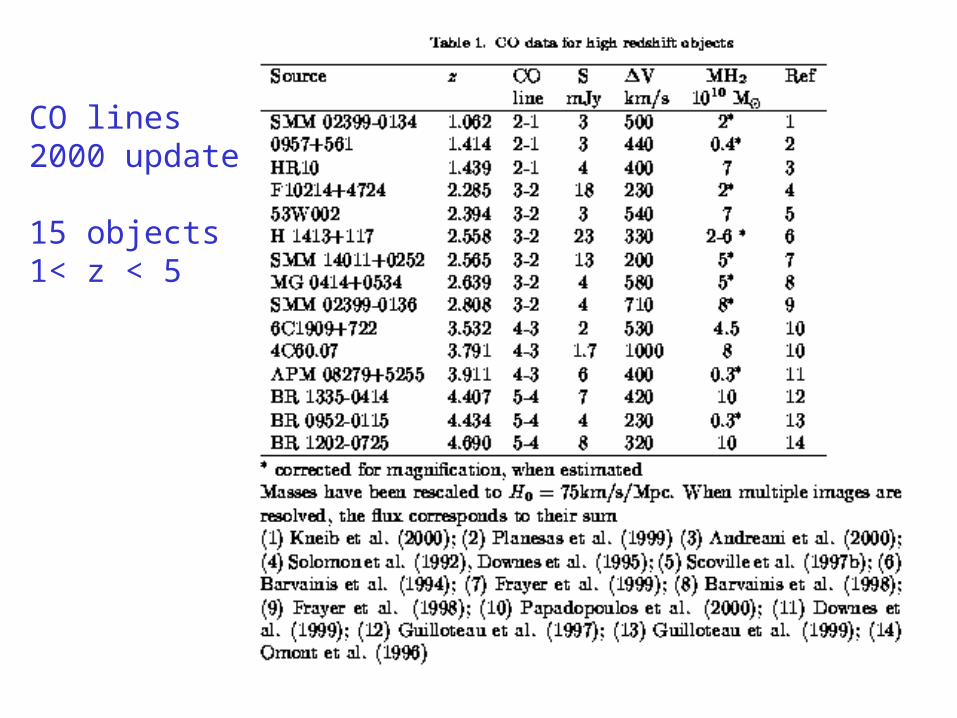
Then several quasars or hyper-luminous objects in FIR or submm,mostly with high gravitational amplification, followed
z between 2.2 and 2.8 (cloverleaf z=2.56)
Two objects at z=4.5BR1202-0725 (Omont et al 96, Ohta et al 96)BR 1335-0414 (Guilloteau et al 97)likely to be lensed also (disputed)
Objects at 93% of the age of the Universe==> enrichment occurs at very early epochs
All objects first detected in dust emissionsubmm bolometer arrays SCUBA-JCMT, MAMBO-IRAM
4
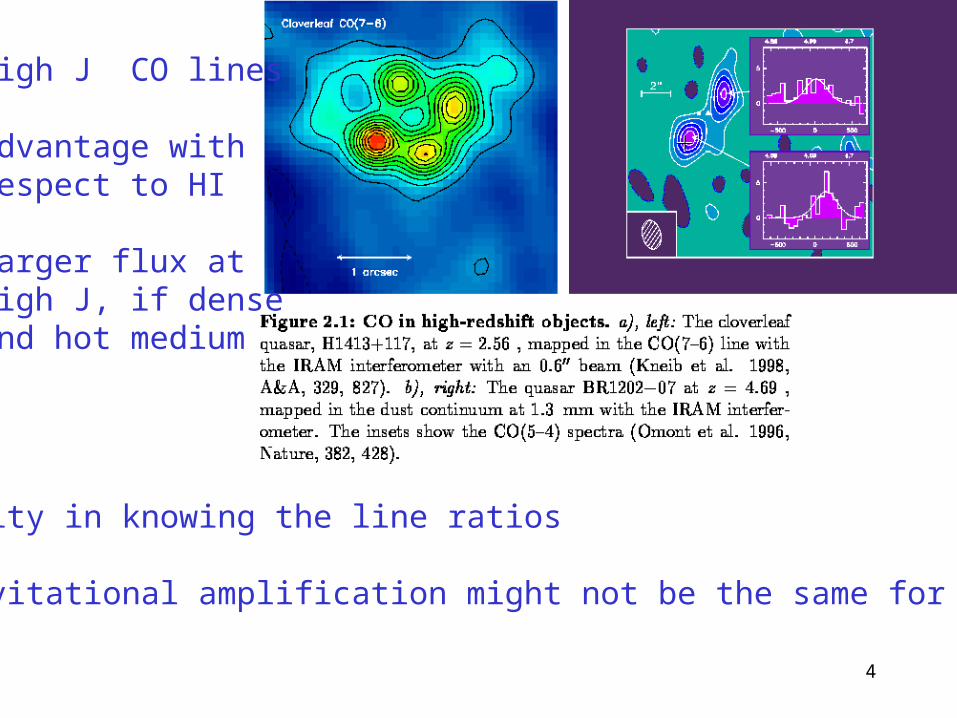
High J CO lines
Advantage with respect to HI
Larger flux athigh J, if denseand hot medium
Difficulty in knowing the line ratios
The gravitational amplification might not be the same for all lines!
5
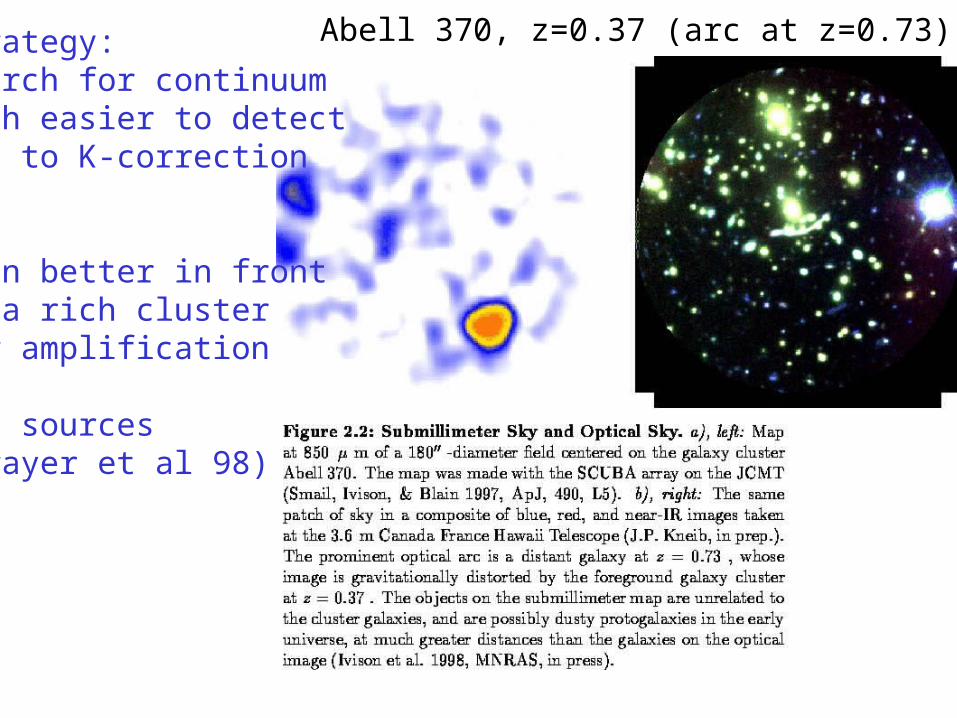
Strategy:search for continuummuch easier to detectdue to K-correction
Even better in frontof a rich clusterfor amplification
SMM sources(Frayer et al 98)
Abell 370, z=0.37 (arc at z=0.73)
6
CO lines2000 update
15 objects1< z < 5
7
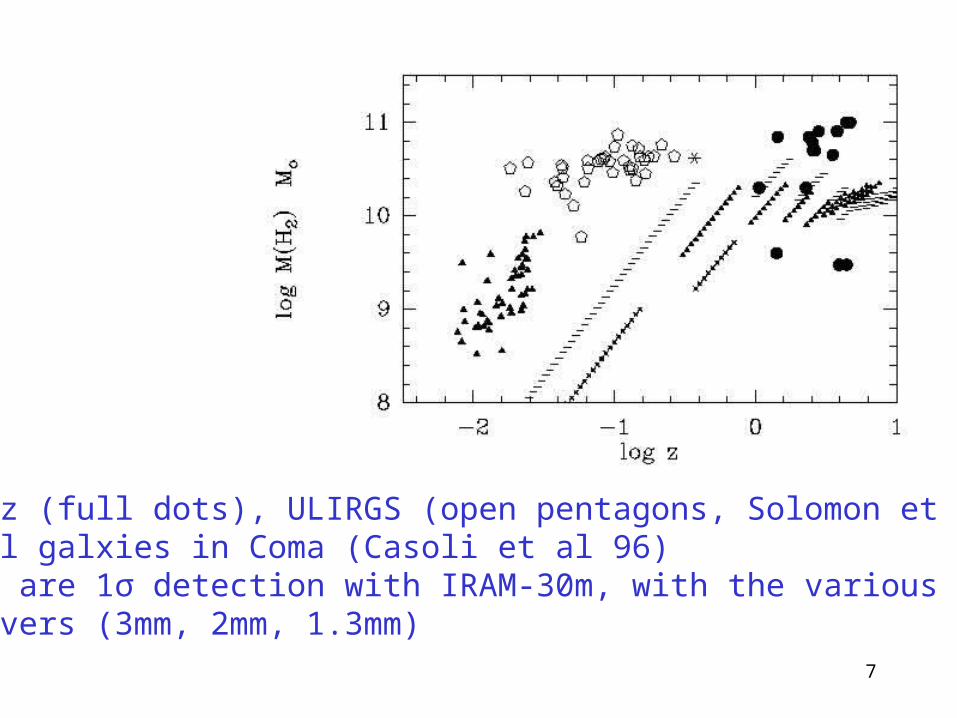
High-z (full dots), ULIRGS (open pentagons, Solomon et al 97)normal galxies in Coma (Casoli et al 96)Lines are 1σ detection with IRAM-30m, with the variousreceivers (3mm, 2mm, 1.3mm)
8
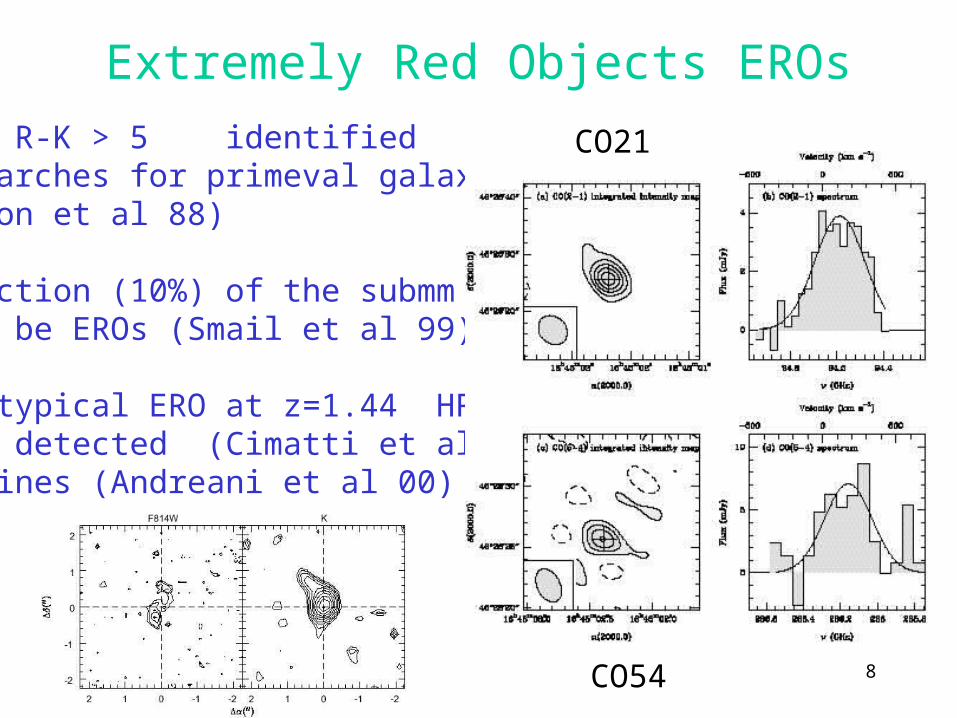
Extremely Red Objects EROs
EROS R-K > 5 identified in searches for primeval galaxies(Elston et al 88)
A fraction (10%) of the submm could be EROs (Smail et al 99)
Prototypical ERO at z=1.44 HR10submm detected (Cimatti et al 98) CO lines (Andreani et al 00)
CO21
CO54
9
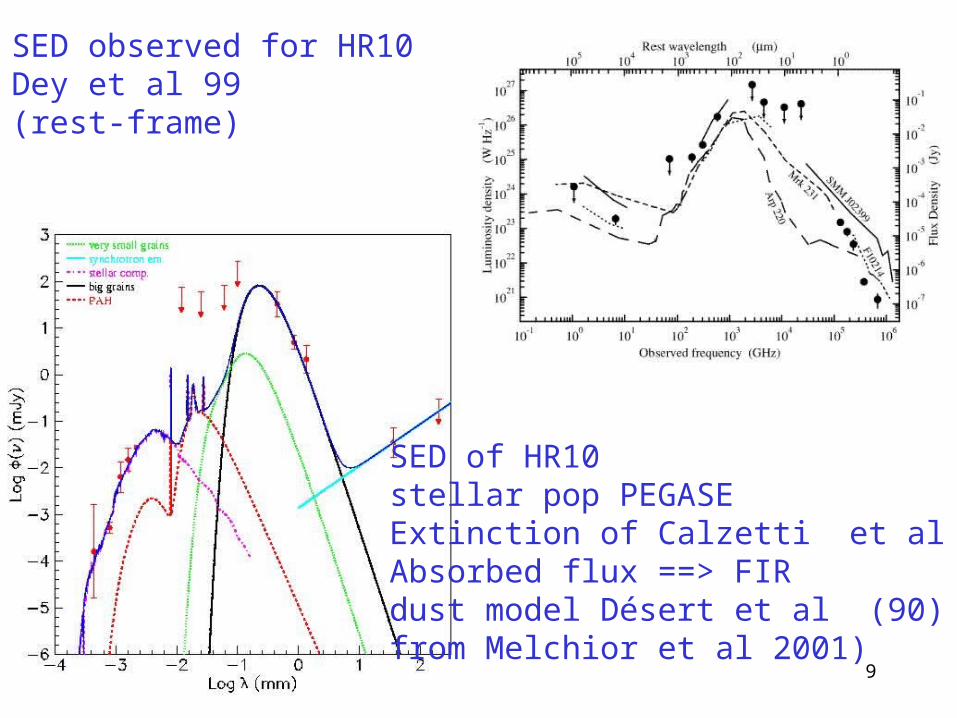
SED of HR10 stellar pop PEGASEExtinction of Calzetti et al (00)Absorbed flux ==> FIRdust model Désert et al (90)from Melchior et al 2001)
SED observed for HR10Dey et al 99(rest-frame)
10
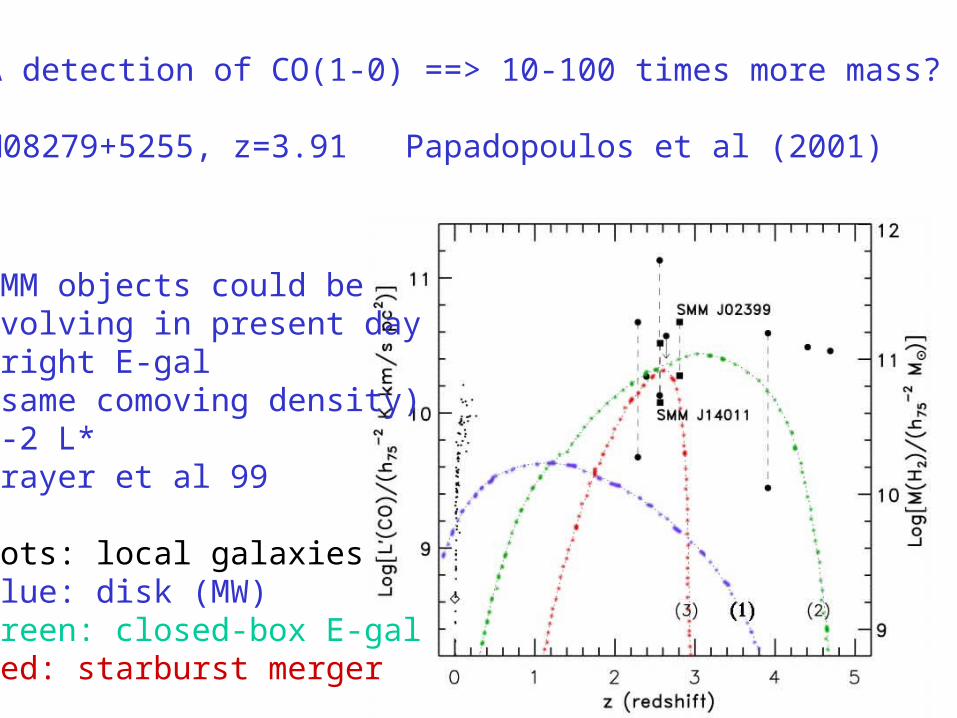
VLA detection of CO(1-0) ==> 10-100 times more mass?
APM08279+5255, z=3.91 Papadopoulos et al (2001)
SMM objects could beevolving in present daybright E-gal(same comoving density)1-2 L*Frayer et al 99
dots: local galaxiesblue: disk (MW)green: closed-box E-galred: starburst merger
11
Modelisation of a starburst
Common characteristics
Very high molecular masses 1010 - 1011 MoHigh temperatures of dust: 30-50K up to 100K (200K if QSO?)If demagnified, similar to the ULIRGs at z=0.1 (Solomon et al 97)
Very small sizes: below 1kpc (300pc disks)Interferometric mapping (cf Arp220)In these conditions, the average column density is around 1024cm-2
and the dust becomes optically thick at λ < 150μ
cf black-body model
12
These high central condensations are supposed to be formedduring mergers, when the gas is driven in by gravitational torques
Up to 50% of the dynamical mass could be in the form of H2 inmergers (Scoville et al 1991)
The average density is 104cm-3, 100 times denser than in normal disksClouds themselves are denser, as in Galactic centers (tidal stresses)
The medium must be very clumpy, since high-density tracers indicateeven higher densitiesand the ratio of HCN/CO even increases for these objects
SED peaks at 100μ with a flux of 1-3 Jy at z=0.1at z=4-5, a few mJy at 1.2mm (Omont et al 96)
13
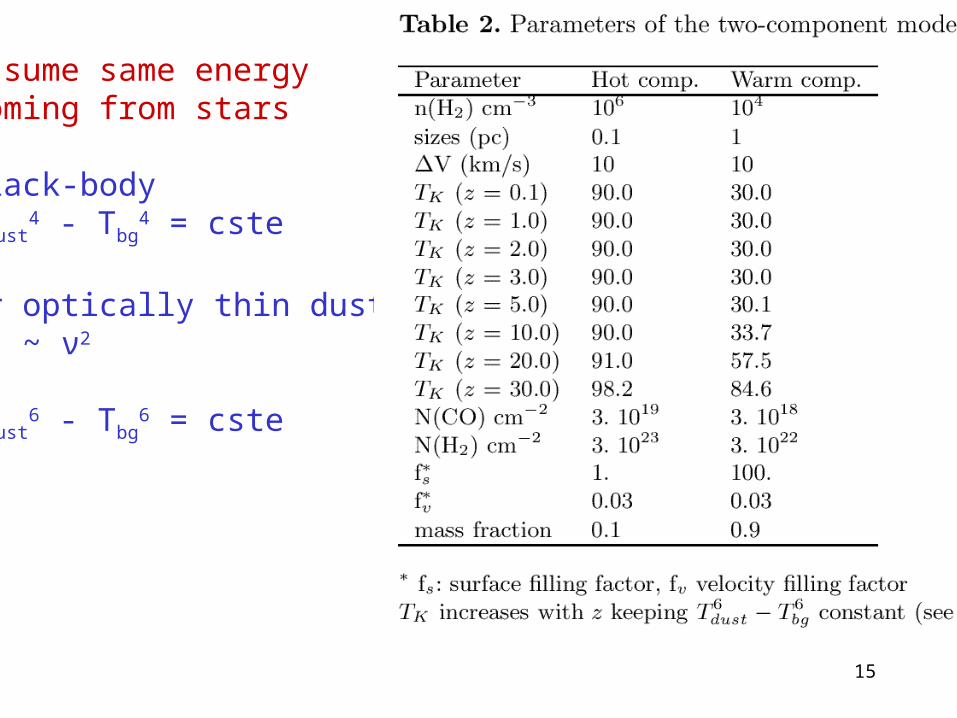
Simple two components model
The central starburst can be considered as the accumulationof very active star-forming complexes, such as Orion(typically 8.6 107 clouds of 700Mo each)
Total mass 6 1010Mo in 1kpc diameter
Two components, both with low filling factor
the dense and hot component: star forming cores 106cm-3, 90Keach embedded in a cloud 104cm-3, 30K
Individual velocity dispersion of 10km/sEmbedded in the rotational gradient of the galaxy, 300km/s
14
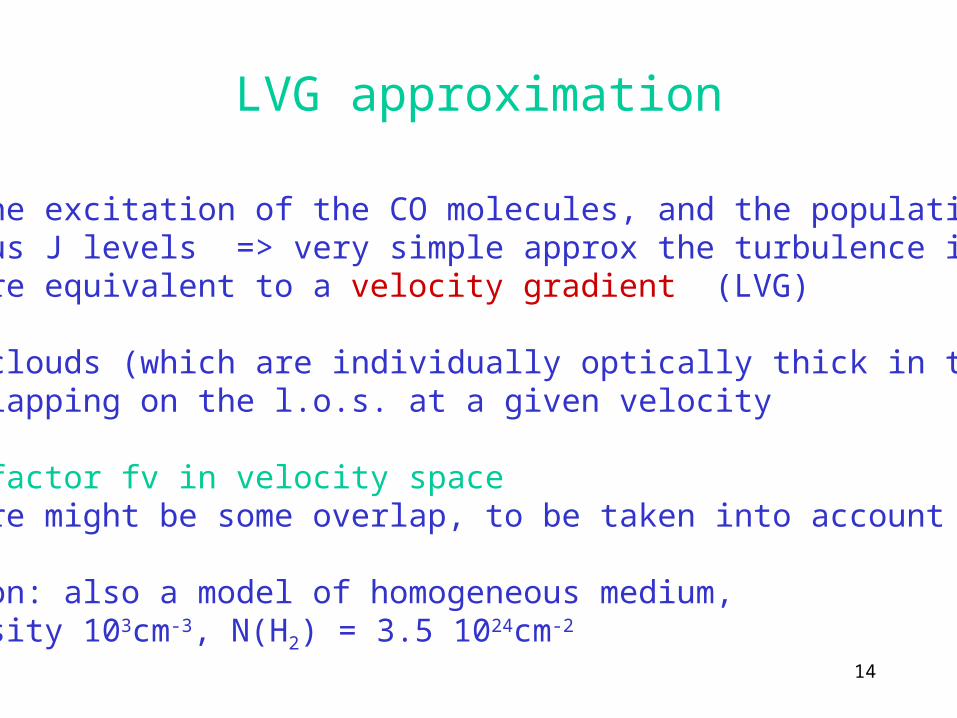
LVG approximation
To compute the excitation of the CO molecules, and the populationof the various J levels => very simple approx the turbulence insidethe clouds are equivalent to a velocity gradient (LVG)
Most of the clouds (which are individually optically thick in the CO lines)are not overlapping on the l.o.s. at a given velocity
==> filling factor fv in velocity spaceIn fact, there might be some overlap, to be taken into account
For comparison: also a model of homogeneous medium,T = 50K, density 103cm-3, N(H2) = 3.5 1024cm-2
15
Assume same energycoming from stars
Black-body Tdust
4 - Tbg4 = cste
or optically thin dustτ ~ ν2
Tdust6 - Tbg
6 = cste
16
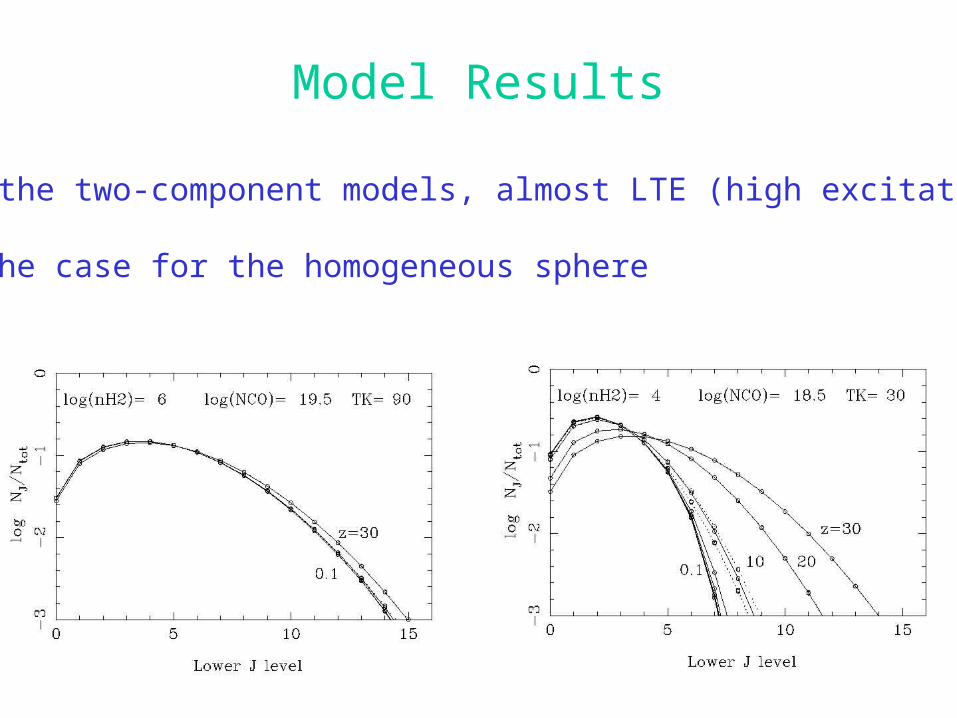
Model Results
With the two-component models, almost LTE (high excitation)
Not the case for the homogeneous sphere

17
Homogeneous sphere
Tdust6 - Tbg
6 = cste
CO lines
Submmcontinuum
18
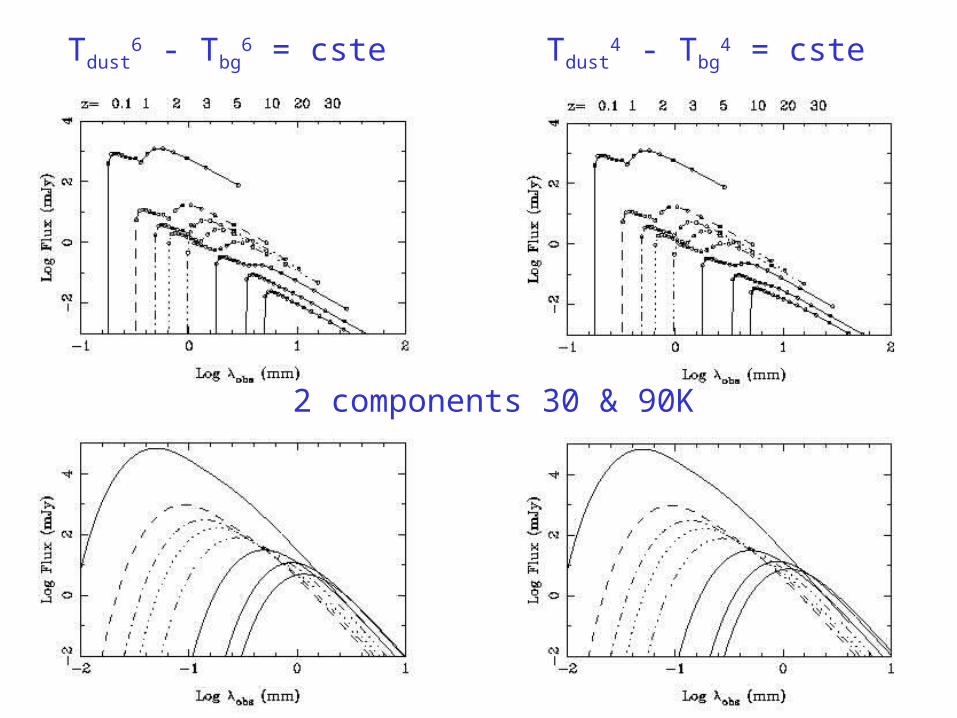
Tdust6 - Tbg
6 = cste Tdust4 - Tbg
4 = cste
2 components 30 & 90K
19
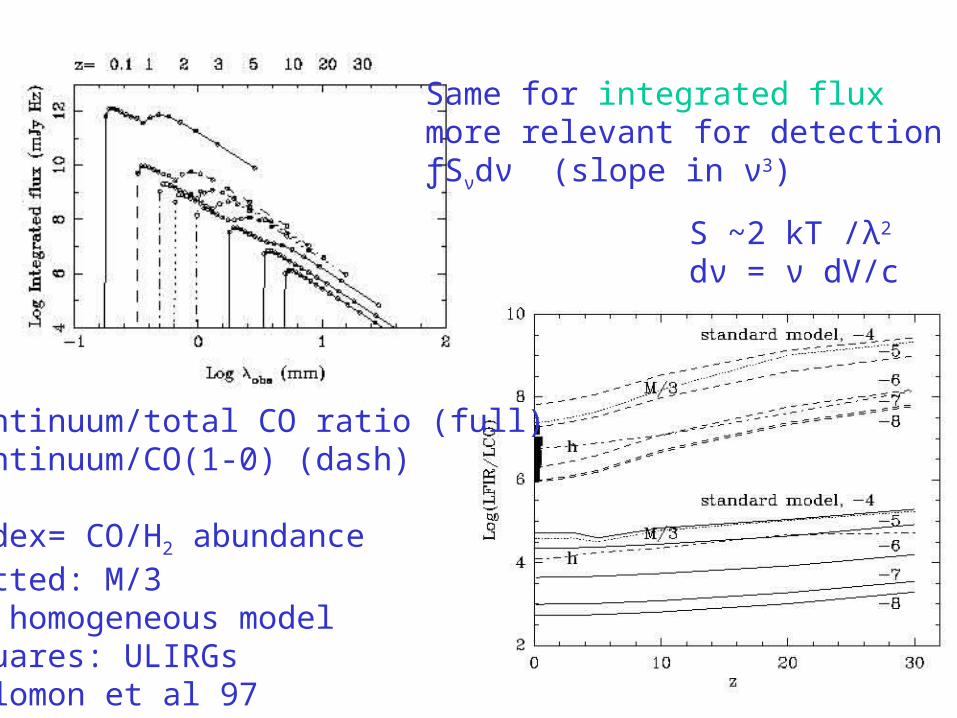
Same for integrated fluxmore relevant for detectionƒSνdν (slope in ν3)
S ~2 kT /λ2
dν = ν dV/c
Continuum/total CO ratio (full)Continuum/CO(1-0) (dash)
index= CO/H2 abundancedotted: M/3h: homogeneous modelsquares: ULIRGsSolomon et al 97
20
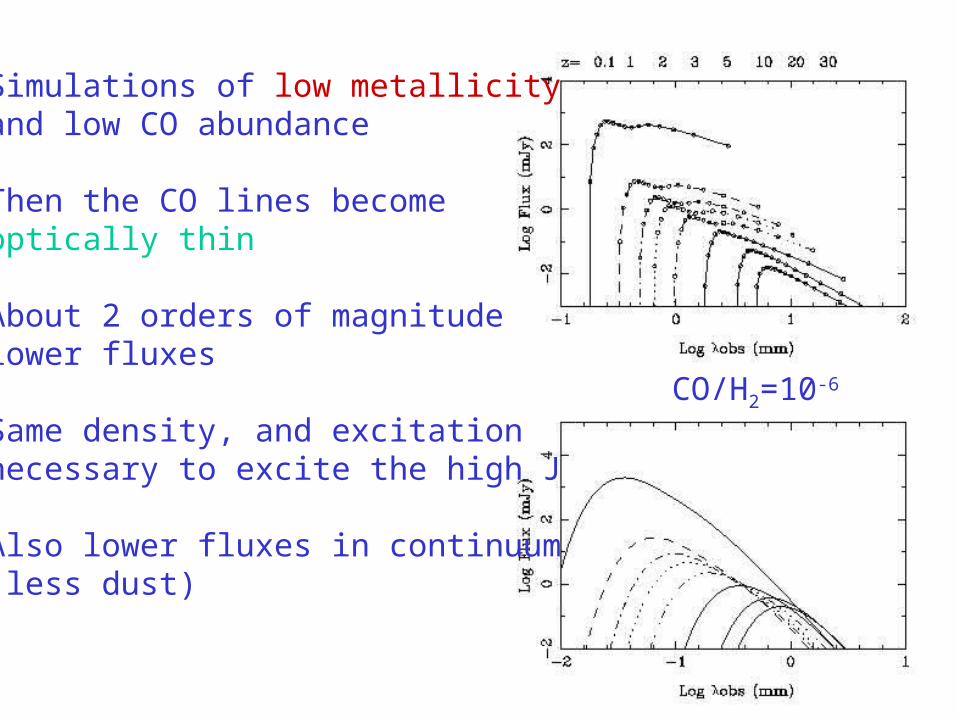
Simulations of low metallicityand low CO abundance
Then the CO lines becomeoptically thin
About 2 orders of magnitude lower fluxes
Same density, and excitationnecessary to excite the high J
Also lower fluxes in continuum(less dust)
CO/H2=10-6
21
Comparison with continuum
•The CO emission has no negative K-correction, in part becauseof optical thickness==> much more difficult to observe than dust emission
•No need to observe at high ν selection rules reduce the observed frequencyfor T=90K, the dust peaks at ~60μ, and the CO at ~600μ
•The increase of the background temperature does not helpin detecting the CO lines, in spite of the higher degree ofexcitationMolecular gas at T=Tbg always undetectable
TA* = (f(Tex)-f(Tbg)) (1 - e-τ)
22
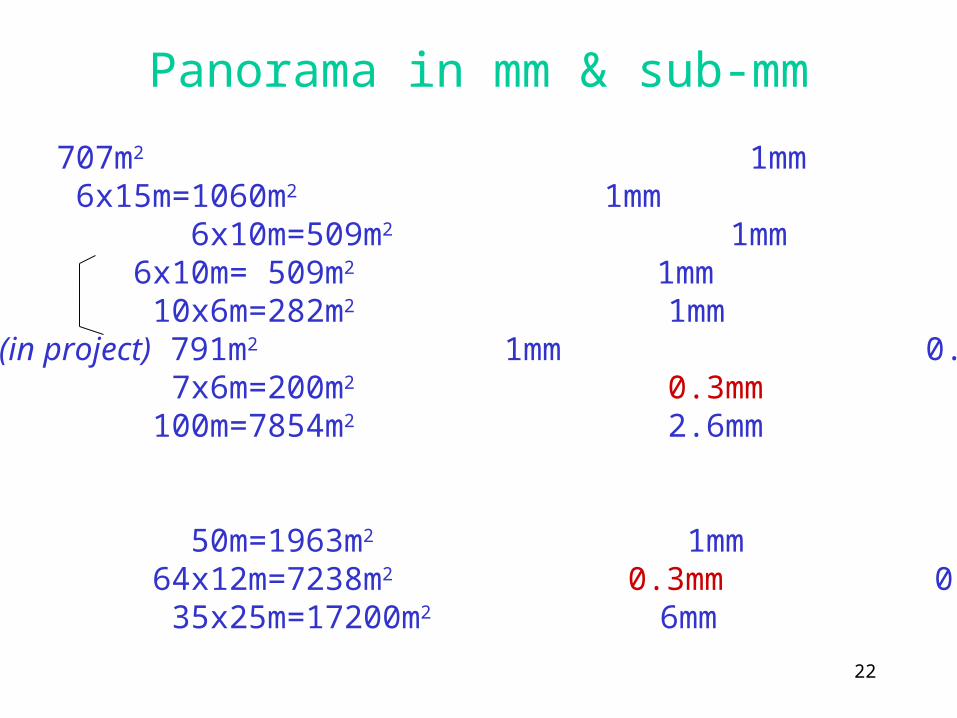
Panorama in mm & sub-mm
IRAM-30m 707m2 1mm 10"IRAM-PdB 6x15m=1060m2 1mm 0.5"NRO 6x10m=509m2 1mm 0.5"OVRO 6x10m= 509m2 1mm 0.5"BIMA 10x6m=282m2 1mm 0.5"=> CARMA (in project) 791m2 1mm 0.5"SMA 7x6m=200m2 0.3mm 0.1"GBT 100m=7854m2 2.6mm 7"
In projectLMT 50m=1963m2 1mm 6"ALMA 64x12m=7238m2 0.3mm 0.1-0.01"EVLA 35x25m=17200m2 6mm 0.004"
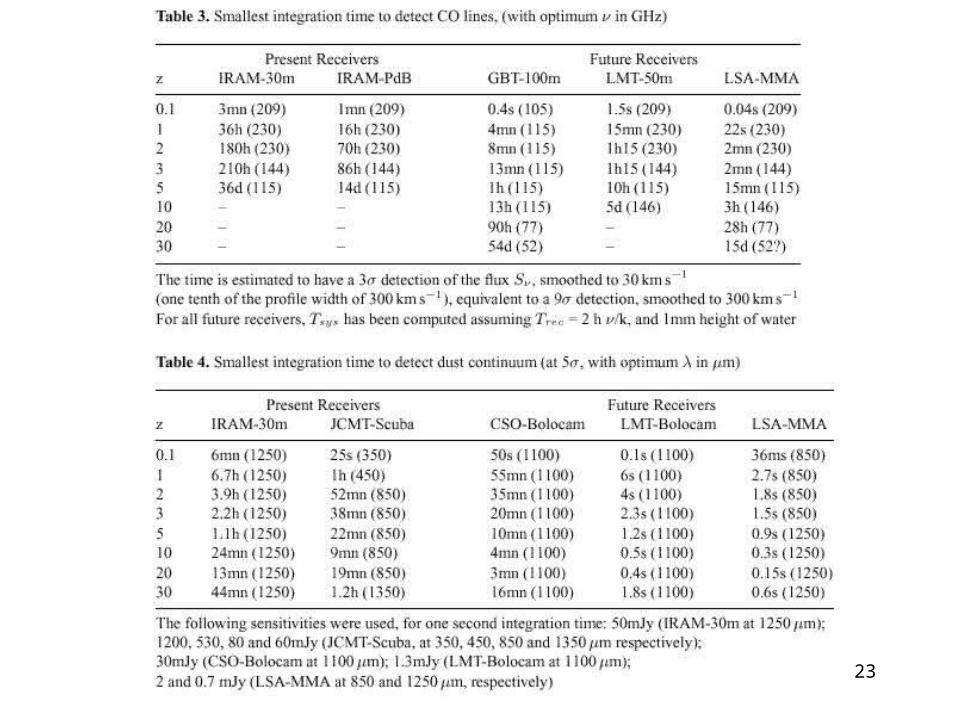
23
24
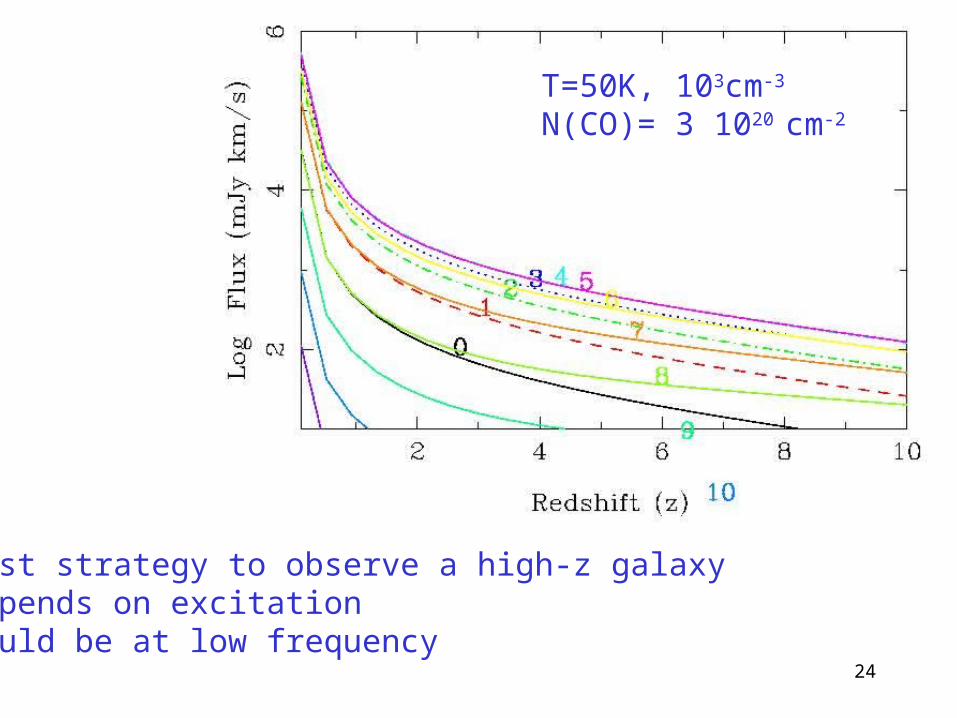
Best strategy to observe a high-z galaxyDepends on excitationCould be at low frequency
T=50K, 103cm-3
N(CO)= 3 1020 cm-2
25
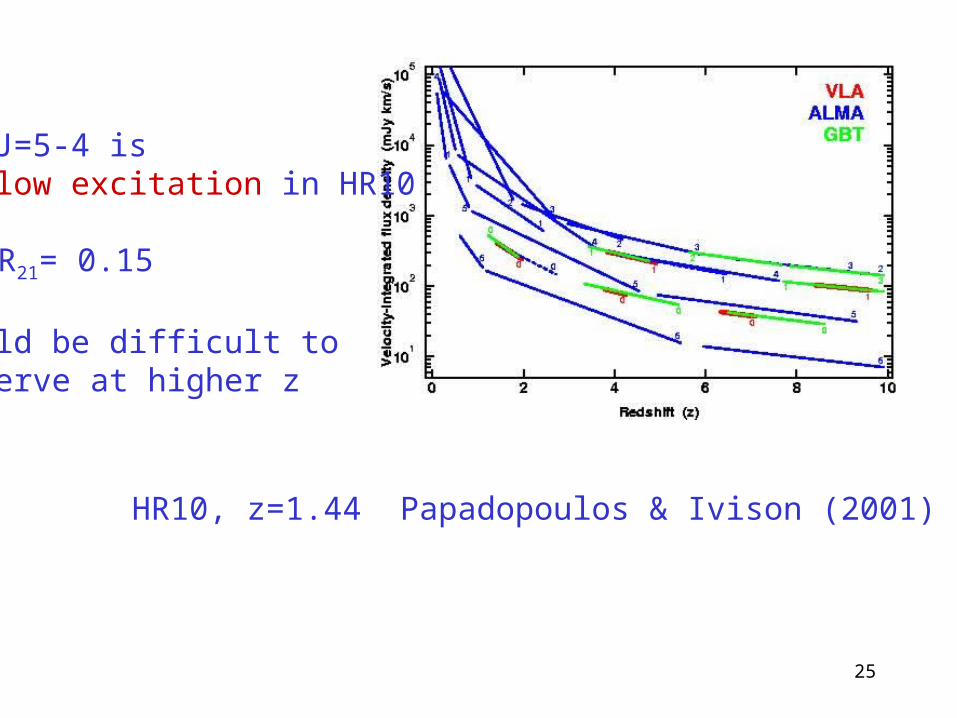
HR10, z=1.44 Papadopoulos & Ivison (2001)
CO J=5-4 isof low excitation in HR10
R54/R21= 0.15
Would be difficult to observe at higher z
26
Prediction of source counts•Hierarchical theory of galaxy formationEinstein-de Sitter model Ω = 1 (Ho = 75km/s/Mpc, qo=0.5)or Ω =0.3 Λ=0.7
•Number of mergers (z) from Press-Schechterassuming self-similarity for P(halo merging)
dN/dM ~ M-2 (M/M*)γ/2 exp[ -(M/M*) γ]
•Merger rate is the sum of the evolution (derivative) of thisfunction + term maximum at equal mass merger (Blain & Longair 93)
=> number of mergers at each epochbut efficiency of star formation must also vary considerably with redshiftwith a peak at z=2

27
Integration over z should equal COBE backgroundTo fit source counts: life-time of merger much shorter at high z
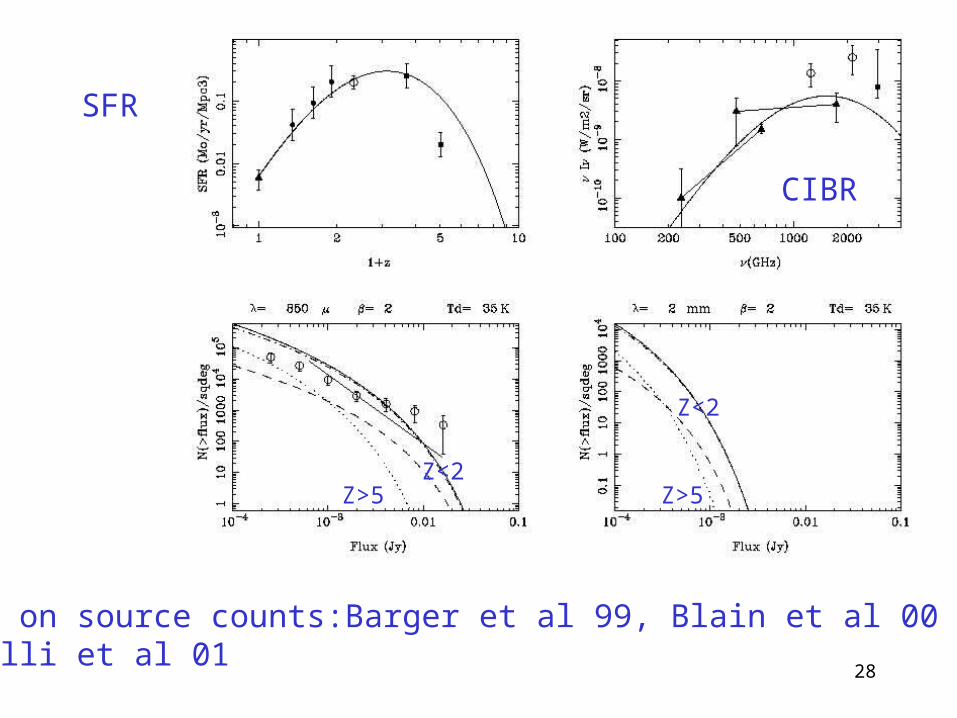
Once the counts are fit to the submm observations, the model indicateswhat must be the contribution of the various redshifts to the counts
Star formation begins before z=6The bulk of the contribution is 2 < z < 5
Results depend on the shape of the SF efficiency
==> Observations of redshift distribution should therefore bring a lot ofinsight in the physics of protogalaxies
28
SFR
CIBR
Z>5
Z<2
Z>5Z<2
Data on source counts:Barger et al 99, Blain et al 00Carilli et al 01
29
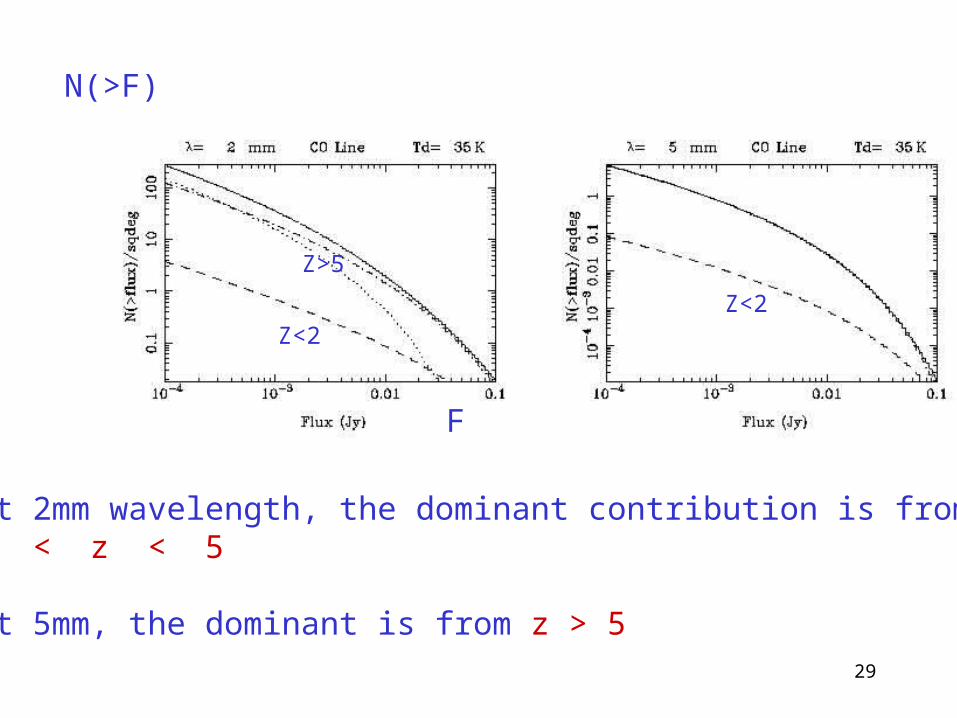
Z<2Z<2
Z>5
N(>F)
F
At 2mm wavelength, the dominant contribution is from2 < z < 5
At 5mm, the dominant is from z > 5
30
Conclusions
•CO lines will be observed at high z easily with the next generationof the mm instruments
•Much more information than the continuum, in giving the massof H2 in the galaxy, the efficiency of star formation as afunction of redshift, the kinematics
•More unbiased information than in the optical, where theline width does not reflect the total mass (outflows, extinction..)
•The fraction of gas mass should increase with redshiftas well as the fraction of starburstand their efficiency (dynamical time shorter)