Molecularly Imprinted Solid Phase Extraction of Taxanes ... · performed on a small-scale as...
70
Molecularly Imprinted Solid Phase Extraction of Taxanes from Plant Cell Culture A Major Qualifying Project Submitted to the faculty of WORCESTER POLYTECHNIC INSTITUTE In partial fulfillment of the Requirements for the Degree of Bachelor of Science Date: April 27, 2017 Submitted by: Clydeblaise Niba Matthew Portugal Benjamin Small Shawn Wile Submitted to: Professor Susan Roberts, Project Advisor This report represents the work of one or more WPI undergraduate students submitted to the faculty as evidence of completion of a degree requirement. WPI routinely publishes these reports on its website without editorial or peer review.
Transcript of Molecularly Imprinted Solid Phase Extraction of Taxanes ... · performed on a small-scale as...
i
Molecularly Imprinted Solid Phase Extraction of Taxanes from
Plant Cell Culture
A Major Qualifying Project
Submitted to the faculty of
WORCESTER POLYTECHNIC INSTITUTE
In partial fulfillment of the Requirements for the
Degree of Bachelor of Science
Date: April 27, 2017
Submitted by:
Clydeblaise Niba
Matthew Portugal
Benjamin Small
Shawn Wile
Submitted to: Professor Susan Roberts, Project Advisor
This report represents the work of one or more WPI undergraduate students submitted to the
faculty as evidence of completion of a degree requirement. WPI routinely publishes these reports
on its website without editorial or peer review.

i
Abstract There are many drugs approved by the Food and Drug Administration that help to combat
various forms of cancer. One such drug is paclitaxel, also known as Taxol®, which is a chemical
that is in a class of compounds known as taxanes. Formed in suspension cultures with other
taxanes, purifying paclitaxel is a difficult procedure because most taxanes have a chemically
similar structure. A process called molecular imprinting has the potential to alleviate this
problem. This technique involves creating artificial receptors that have the capacity to selectively
and specifically bind to target molecules. Molecularly imprinted polymers, or MIPs, are
engineered for many different compounds, including drugs such as paclitaxel. The goals of this
project were to determine the optimum conditions for producing paclitaxel-specific MIPs and
test their overall effectiveness in separating paclitaxel from a mixture of other taxanes. So far,
successful demonstrations of forming MIPs have been found in many sources of literature. One
of which includes the small-scale formation of MIPs as performed by Lanza and Sellergren,
where the molar ratio of template:functional monomer:cross-linker was found to be 1:4:20 for
favorable conditions. From the various trials that were performed in this study, we report that the
method of bulk polymerization using a ratio of 2:4:20 with paclitaxel as template, methacrylic
acid as functional monomer, ethylene glycol dimethacrylate as cross-linker, and chloroform as
solvent to make the MIP for paclitaxel had the best rebinding capacity, with 70 percent of the
paclitaxel in solution binding to the MIP. While the binding capacity was high, it was not highly
specific as the control polymers rebounded 57 percent of the paclitaxel in the same concentration
of solution. What was determined from these results is that a larger sample pool of successful
trials and polymerization methods, as well as variations in functional monomer, cross-linker, and
solvent could be used to yield more favorable results in the future.

ii
Acknowledgements
Our team would like to thank:
● Susan Roberts, our advisor, for continuous support and feedback throughout the project.
● Gregory Andrews, for his advice and guidance in the lab, and for analyzing our test
samples in the UPLC unit.
● Michelle McKee, Katie Bumila, and Elizabeth Cummings for offering assistance in the
lab when necessary.

iii
Table of Contents
Abstract i
Acknowledgements ii
Table of Contents iii
List of Figures v
List of Tables vi
List of Experimental Chemicals vii
Chapter 1: Introduction 1
Chapter 2: Background 3
2.1 History of Paclitaxel 3
2.1.1 Use of Paclitaxel Against Cancer 4
2.1.2 Paclitaxel Production Methods 5
2.1.2.1 Semi-Synthetic Paclitaxel 5
2.1.2.2 Plant Cell Fermentation 8
2.2 Molecularly Imprinted Polymer Theory 9
2.3 Ultra Performance Liquid Chromatography 11
Chapter 3: Methodology 14
3.1 Molecularly Imprinted Polymer Synthesis 15
3.1.1 Bulk Polymerization Procedure 15
3.1.2 Precipitation Polymerization Procedure 15
3.2 Standard Curves and UPLC Analysis 16
3.3 Template Extraction 16
3.4 Template Rebinding 16
Chapter 4: Results and Discussion 18
4.1 Experimental Results 21
4.2 Analysis of Variance 24
Chapter 5: Conclusions and Recommendations 26
5.1 Experimental Shortcomings 26
5.2 Recommendations for Future Work 28
5.2.1 Molar Ratio Recommendations 29

iv
5.2.2 Functional Monomer Recommendations 31
5.2.3 Cross-Linker Recommendations 32
5.2.4 Porogenic Solvent Recommendations 35
5.2.5 Polymerization Method Recommendations 37
5.3 Conclusion 39
References 40
Appendix A: General Procedure Example 43
Appendix A.1: Bulk MIP Synthesis, from Tsermentseli et al. (2013) 43
Appendix A.2: Precipitation MIP Synthesis, based on miniemulsion from Ishkuh et al. (2014)
44
Appendix A.3: Template Removal Procedure 46
Appendix A.4: Template Rebinding Procedure 48
Appendix B: Rebinding Data Example 49
Appendix C: ANOVA Results 50
Appendix C.1: Solvent Variations for MIPS 50
Appendix C.2: Solvent Variations for Control Polymers 51
Appendix C.3: Cross-linker Variations for MIPs 52
Appendix C.4: Cross-linker Variations for Control Polymers 53
Appendix C.5: Molar Ratio Variations for MIPs 54
Appendix C.6: Molar Ratio Variations for Control Polymers 55
Appendix C.7: Solvent Volume/Template Mass Variations for MIPs 56
Appendix C.8: Solvent Volume/Template Mass Variations for Control Polymers 57
Appendix C.9: ANOVA Results Summary 58
Appendix D: Experimentally Varied Components 59
Appendix E: Potential MIP Testing Summary 60
Appendix F: Ishkuh et al. (2014) Miniemulsion MIP Synthesis for Paclitaxel 61
Appendix G: Javanbakht et al. (2010) Precipitation MIP Synthesis for Dipyridamole 62

v
List of Figures
Figure 1: Chemical structure of paclitaxel (Dunn, Wells, & Williams, 2010) .............................. 3
Figure 2: Bark of the Pacific yew tree (“Taxus brevifolia,” n.d.) .................................................. 3
Figure 3: Chemical structure of 10-deacetylbaccatin III (Dunn et al., 2010) ................................ 5
Figure 4: Comparison of paclitaxel with 10-DAB (Dunn et al., 2010) ......................................... 6
Figure 5: Acetylation of 10-DAB (Dunn et al., 2010) ................................................................... 6
Figure 6: Production of the paclitaxel side chain (Dunn et al., 2010) ........................................... 7
Figure 7: Formation of paclitaxel from 10-DAB and side chain (Dunn et al., 2010).................... 7
Figure 8: Plant cell fermentation process (Dunn et al., 2010) ....................................................... 8
Figure 9: An illustration on the preparation of MIP (Cheong et al., 2013) ................................... 9
Figure 10: List of common polymerization methods (Yan & Row, 2006) .................................. 11
Figure 11: UPLC Device ............................................................................................................. 12
Figure 12: Concentration peak of paclitaxel with characteristic paclitaxel shape ....................... 13
Figure 13: Standard curve for paclitaxel concentration generated by the UPLC ........................ 13
Figure 14: Paclitaxel in toluene ................................................................................................... 22
Figure 15: Paclitaxel and toluene chemical sites ......................................................................... 23
Figure 16: MIP and control polymer contents, with only one control polymer forming ............ 24
Figure 17: Template:Functional Monomer Ratio of 1:1 with ENRO and MAA (Liu et al. 2014)
....................................................................................................................................................... 30
Figure 18: Template:Functional Monomer Ratio of 1:7 with ENRO and MAA (Liu et al. 2014)
....................................................................................................................................................... 30
Figure 19: MAA hydrogen bonding with paclitaxel (Ishkuh et al., 2014) .................................. 31
Figure 20: Binding energy of cross-linkers with AZT (Muhammad et al., 2012) ....................... 33
Figure 21: Hydrogen bonding sites on paclitaxel ........................................................................ 34
Figure 22: EGDMA and TRIM compared to DVB (Cheong et al., 2013) .................................. 34
Figure 23: Effect of THF volume on adsorption of quercetin (Song et al., 2009) ...................... 36
Figure 24: Hydrogen bonding sites of paclitaxel and DIP, highlighted in orange ...................... 39
vi
List of Tables
Table 1: MIP Results Summary ................................................................................................... 19
Table 2: MIP Rebinding ANOVA Results .................................................................................. 25
Table 3: Control Polymer Rebinding ANOVA Results ............................................................... 25
Table 4: List of effective MIPs .................................................................................................... 26
Table 5: Percentage of paclitaxel (PTX) rebinding by polymers and difference binding between
MIPs & control polymers (NIP) with chloroform as solvent (Ishkuh et al., 2014) ...................... 27
Table 6: Rebinding capacities of ENRO specific MIPs with different template:functional
monomer ratios (Liu et al. 2014) .................................................................................................. 30
Table 7: List of Functional Monomers ........................................................................................ 32
Table 8: Cross-linkers vs. Imprinting Factor for AZT specific MIPs .......................................... 33
Table 9: List of Cross-linkers....................................................................................................... 34
Table 10: Polarity of each solvent vs. Imprinting Factor ............................................................. 35
Table 11: Dielectric constants of tested solvents (Dielectric Constant, n.d.) .............................. 36
Table 12: Dielectric constants of potential solvents for paclitaxel-specific MIPs (Dielectric
Constant, n.d.) ............................................................................................................................... 37
Table 13: Recovery percentage of DIP from MIPs formed by precipitation polymerization
(Javanbakht et al., 2010) ............................................................................................................... 38
vii
List of Experimental Chemicals
Templates:
● Paclitaxel (Taxol®)
Functional Monomers:
● Methacrylic Acid (MAA)
Cross-linkers:
● Ethylene Glycol Dimethacrylate (EGDMA)
● Trimethylolpropane Trimethacrylate (TRIM)
Solvents:
● Dichloromethane (DCM)
● Toluene
● Chloroform
Initiator:
Azo-N,N’-bisisobutyronitrile (AIBN)
1
Chapter 1: Introduction
There are several drugs approved by the Food and Drug Administration (FDA) that help
fight against cancer. In 2016 alone, the FDA approved various new drug treatments to treat
different types of cancer, including Tecentriq (bladder cancer), Xalkori (lung cancer), and
Opdivo (Hodgkin Lymphoma) (“New Cancer Drug Approvals From 2016” 2016). One of the
most notable FDA-approved drugs is paclitaxel, known commercially as Taxol®, which is used
in the treatment process of breast, lung, ovarian, and other types of solid tumor cancer (Taxol,
n.d.). Isolated from the bark of the Pacific yew tree (Taxus brevifolia) in 1964, paclitaxel is one
of over 400 taxanes, which are a class of diterpenoid compounds that possess the taxadiene core
(Team, E.W., n.d.). Paclitaxel is formed in Taxus suspension cultures that also produce a wide
range of other taxanes. Due to the structural similarities paclitaxel has with other taxanes,
downstream processing and purifying paclitaxel becomes difficult.
A process called molecular imprinting could potentially be utilized to address this issue.
Molecular imprinting is a technique to produce artificial receptors that are designed to
specifically and selectively bind to a given molecule (Vasapollo et al., 2011). Molecular
imprinting proves to be less expensive and better for the environment. In addition, the
technological process of molecular imprinting provides a way to prepare new polymer materials
containing recognition sites for target molecules that can be employed in a variety of
applications, such as separation, sensors, catalysis, organic synthesis, enantiomeric separation
and drug delivery systems (Wulff, 1995). Molecularly imprinted polymers (MIPs) can be
engineered for a variety of molecules, including as drugs such as paclitaxel.
MIPs are created by the reaction of a functional monomer and cross-linking monomer in
the presence of a template molecule. The functional monomer and cross-linking monomer form
the MIP around the template, which can then be washed away leaving imprinted cavities that
specifically bind to the template. Numerous approaches have been used to obtain MIPs with a
controlled size and shape distribution, such as bulk polymerization, precipitation polymerization,
suspension polymerization, swelling polymerization and emulsion polymerization (Ye, Weiss, &
Mosbach, 2000).
The goals of this project were to produce paclitaxel-specific MIPs and test their
effectiveness in separating paclitaxel from a mixture of taxanes. Due to time constraints, only the
first objective (producing paclitaxel-specific MIPs) was investigated.
I. Screen Conditions for MIP formation: Some of the important factors we varied when
forming our MIPs were the molar ratios between the template molecule, functional
monomer, and cross-linker, the types of cross-linkers, the type and volume of solvents the
MIPs were formed in, and the method of polymerization. Other factors such as heating
temperature, type of functional monomer, and polymerization initiators could have also
been varied, but time constraints prevented us from doing so. By comparing the rebinding
capacity of the MIPs to non-imprinted control polymers, which are formed in the same
manner as the MIPs with the absence of the template molecule, the overall effectiveness

2
of the MIP can be determined. For this project, screening of all conditions were
performed on a small-scale as demonstrated in the MIPs formed by Lanza and Sellergren
(1999).
II. Separation of Taxane Mixture: With more time, we would have tested the most effective
MIPs on larger scale in a mixture of taxanes. This would have tested the selectivity of the
MIPs for paclitaxel against molecules with a similar structure. The most ideal MIPs
would have a strong affinity for paclitaxel and a weak affinity for other taxanes. This is a
rich area for future work.
3
Chapter 2: Background
This section covers information necessary for understanding the material presented in this
report as well as how it applies to the broader research project at hand. As mentioned previously
in the introduction, the goal of this project is to produce a paclitaxel-specific molecularly
imprinted polymer (MIP) that will be effective in separating paclitaxel from a mixture of
taxanes. The importance of paclitaxel as well as the theory behind the construction and
effectiveness of MIPs will be explained in this section.
2.1 History of Paclitaxel
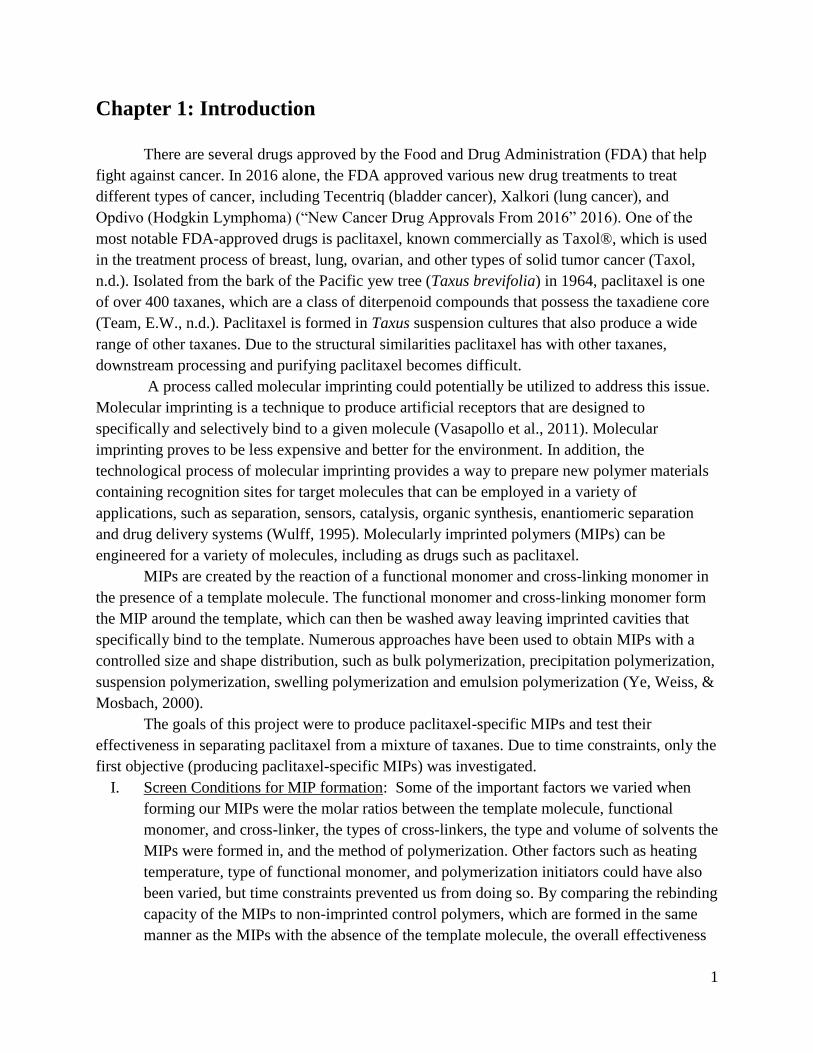
Figure 1: Chemical structure of paclitaxel (Dunn, Wells, & Williams, 2010)
According to the Nationals Cancer Institute, paclitaxel (seen in Figure 1) is the most well-
known natural-source cancer drug in the United States. The drug was discovered in bark and other
samples collected from the Pacific yew tree by a USDA botanist named Arthur Barclay in the state
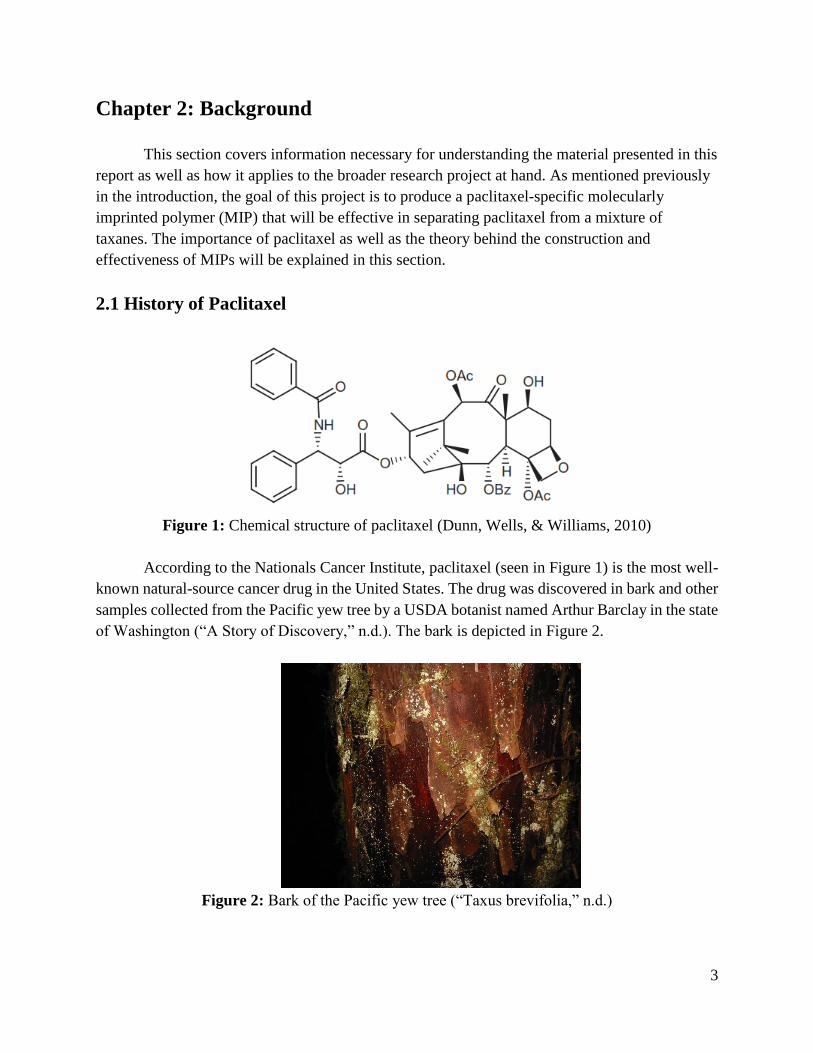
of Washington (“A Story of Discovery,” n.d.). The bark is depicted in Figure 2.
Figure 2: Bark of the Pacific yew tree (“Taxus brevifolia,” n.d.)

4
From these samples, an extract of the bark showed cytotoxicity against a KB (oral
epidermoid carcinoma) cell culture, which is a cell line from a human cancer (“Discovery of
Camptothecin and Taxol,” 2003). This work was performed by Dr. Monroe Wall and Dr.
Mansukh Wall of the Research Triangle Institute (RTI), both of whom worked together to
discover the structural formula and came up with the name for paclitaxel as well as its
commercial name, Taxol®. Dr. Wall derived this name from the scientific name of the Pacific
yew tree (Taxus brevifolia) and the fact that paclitaxel has hydroxyl groups in its structure,
making it an alcohol (“Discovery of Camptothecin and Taxol,” 2003).
In 1992, after years of research and testing, the United States Food and Drug
Administration approved paclitaxel for treating ovarian cancer. Two years later in 1994,
paclitaxel was approved for treating breast cancer treatment (“Success Story: Taxol,” n.d.).
Paclitaxel has since been used against several other forms of cancer (“Taxol,” n.d.). With such a
wide variety of use against cancer, paclitaxel has become the best-selling cancer drug ever
produced, with annual sales peaking in 2000 with $1.6 billion in sales (“Success Story: Taxol,”
n.d.).
2.1.1 Use of Paclitaxel Against Cancer
Paclitaxel is a chemotherapy medication. It interferes with the growth of cancer cells and
slows their growth and spread in the body (Cunha, 2016). Currently, paclitaxel is used to fight
the following types of cancer (“Taxol,” n.d.):
● Breast cancer
● Ovarian cancer
● Lung cancer
● Bladder cancer
● Prostate cancer
● Melanoma cancer
● Esophageal cancer
● Other solid tumor cancers
Paclitaxel is delivered to the body via injection or infusion into the vein. It belongs to a
class of chemotherapy drugs broadly called plant alkaloids. Plant alkaloids are cell-cycle
specific, meaning they attack cells during cell division. Paclitaxel specifically acts as an
antimicrotubule agent by stabilizing a cell’s microtubules, which is a part of the cell responsible
for dividing and replicating itself. By stabilizing the microtubules of cancerous cells, cells cannot
divide normally and undergo programmed cell death (“Taxol,” n.d.).

5
2.1.2 Paclitaxel Production Methods
The amount of natural paclitaxel that can be acquired is very limited. The bark of the
Pacific yew tree consists of only 0.0004% paclitaxel, which is not concentrated enough to be a
sustainable source. Bark-stripping to obtain paclitaxel is fatal for yew trees and poses significant
environmental problems. Yew trees can take 200 years to mature, and they are also the main
habitat the endangered northern spotted owl. To address this issue, two methods of producing
paclitaxel, a semi-synthetic process and a plant cell fermentation process, have been actively
developed. These methods are described in detail in “Green Chemistry in the Pharmaceutical
Industry” by Peter Dunn, Andrew Wells, and Michael Williams.
2.1.2.1 Semi-Synthetic Paclitaxel
The semi-synthetic process was first developed by Pierre Potier and Andrew Greene.
Potier and Greene discovered that a compound known as 10-deacetylbaccatin III, or 10-DAB
(Figure 3), closely resembles the tetracyclic ring of paclitaxel and contained the proper
stereochemistry found in paclitaxel. Therefore, they hypothesized that 10-DAB can be used as an
initial start for the semi-synthesis of paclitaxel.
Figure 3: Chemical structure of 10-deacetylbaccatin III (Dunn et al., 2010)
The advantage of this approach was that 10-DAB could be found in leaves and twigs of
the European yew tree, a relative of the Pacific yew tree. The leaves and twigs were found to be
made up of 0.1% 10-DAB, a far greater concentration than the 0.0004% of paclitaxel in Pacific
yew tree bark. Additionally, harvesting the leaves and twigs of the European yew tree does not
harm the tree, making the source of 10-DAB far more sustainable than the source of natural
paclitaxel.
There are two main structural differences between 10-DAB and paclitaxel. The first main
difference is the hydroxyl group located on the 10-position carbon of 10-DAB instead of the
acetyl group found in paclitaxel (highlighted in blue in Figure 4). The other main difference is
the hydroxyl group on the 13-position carbon on 10-DAB instead of the complex side chain
found in paclitaxel (highlighted in orange in Figure 4).

6
Figure 4: Comparison of paclitaxel (left) with 10-DAB (right) (Dunn et al., 2010)
Acetylation of the hydroxyl group on the 10-position carbon turned out to be the most
complicated part of the procedure due to the presence of three hydroxyl groups with different
reactivities. Dealing with this required protection steps for the 7-position and 13-position
carbons, low temperatures, and hazardous reagents and solvents. This process is detailed in
Figure 5.
Figure 5: Acetylation of 10-DAB (Dunn et al., 2010)
The other main challenge was producing and attaching the side chain to form paclitaxel.
Potier and Greene were able to successfully carry out the synthesis at low yields, but scientists at
Bristol-Myers Squibb (BMS) were able to produce the side chain with the process detailed in
Figure 6 and attach the side chain to the 10-DAB with the process detailed in Figure 7.

7
Figure 6: Production of the paclitaxel side chain (Dunn et al., 2010)
Figure 7: Formation of paclitaxel from 10-DAB and side chain (Dunn et al., 2010)

8
The main issues with this process is that, while renewable, there are still environmental
problems. The semi-synthesis procedure requires the use of some hazardous solvents, toxic
reagents, waste streams, and high-energy steps. Despite these issues, the semi-synthesis
production of paclitaxel became economically viable in 1993.
2.1.2.2 Plant Cell Fermentation
To address the issues with the semi-synthesis of paclitaxel, BMS scientists using Phyton
Biotech GmbH technology developed a plant cell fermentation (PCF) process using culture cells
from Chinese yew tree needles. With this process, Phyton became and still is the largest
commercial application of plant cell fermentation.
At Phyton, the PCF process starts by growing approximately 1 g of cells on a solid agar
medium plate to form cell calli. These calli are then transferred to a liquid growth medium.
These calli are grown and maintained over time by replacing the growth medium weekly. At a
certain point, the cells in the calli are fed with a special production medium to produce paclitaxel
and other specialized metabolites. The cell broth is subsequently extracted to recover crude
paclitaxel and is then purified by chromatography and crystallization. Figure 8 lists the specific
steps of PCF.
Figure 8: Plant cell fermentation process (Dunn et al., 2010)

9
The advantages of PCF is are as follows:
○ Solid waste is negligible.
○ No chemical reactions occur, so there is no need for reagents.
○ There is only one drying step.
The steps of PCF being addressed by our project are the whole broth extraction,
chromatographic purification, and crystallization of paclitaxel. Currently, these steps require the
use of several solvents and chemicals, including isobutyl acetate (IBA), isopropanol (IPA),
sodium hydroxide, dichloromethane (DCM), dimethylformamide (DMF), formamide, and a
mixture of acetonitrile (ACN) and water. A direct extraction using MIPs could potentially reduce
the amount of steps or solvents used in the purification steps.
2.2 Molecularly Imprinted Polymer Theory
Figure 9 describes visually how MIPs are made. The process begins with a reaction
mixture made up of a template, a functional monomer, a cross-linking monomer, and a
polymerization initiator. This reaction forms a complex between the template and the functional
monomer, which is then surrounded by the cross-linking monomer. The cross-linking monomer
polymerizes around the complex, yielding a three dimensional polymer network (the MIP) where
the template molecules are trapped after the polymerization is complete. By thoroughly washing
the MIP with appropriate solvents, the template molecule can be extracted from the MIP, leaving
specific binding sites, or cavities, complementary to the template in size, shape, and molecular
interactions (Cheong, Yang, & Ali, 2013).
Figure 9: An illustration on the preparation of MIP (Cheong et al., 2013)
10
There are several types of polymerization methods used to synthesize MIPs. Some
common polymerization methods include bulk polymerization, precipitation polymerization, and
emulsion polymerization. The most used and simple polymerization method is bulk
polymerization, which uses a porogenic solvent to create a block of polymer (Mayes & Mosbach,
1996). The advantages of this method include its simplicity, which makes it possible to be
performed in any laboratory, and that no particular skills and difficult instruments are required
(Pardeshi & Singh, 2016). However, its disadvantages include tedious procedures of grinding
and sieving the polymers, which produces irregular particle shapes and can destroy the imprinted
sites of the polymers (Pardeshi & Singh).
Another method of polymerization is known as precipitation polymerization. A
precipitation polymerization is essentially a heterogeneous polymerization process that is
initially a homogenous solution that is in the continuous phase. At first, the initiator and
monomer are completely miscible in each other, but once initiator is added the polymer becomes
insoluble and finally precipitates out of reaction. After precipitation occurs, the polymerization is
commenced by the absorption of both the initiator and the monomer by the polymer particles
(Pearce, 1992). Advantages of this method of polymerization include the lack of need for
stabilizers and the production of suitable polymer beads in high yield, but disadvantages include
a potential for this method to not suit the template molecule, as literature exists describing the
obtainment of agglomerates instead of independent beads (Tamayo, Turiel, & Martín-Esteban
2007).
One final method of polymerization is called emulsion polymerization. This method
makes it possible to predetermine the polymer particle and involves the formation of spherical
particles. It is difficult to perform because the use of surfactants and stabilizers are hard to
separate from the resulting MIPs that are made. Emulsion polymerization is a certain kind of
radical polymerization that begins with the emulsion of monomer and surfactant in water. The
most common type of emulsion polymerization is an oil-in-water emulsion. During this kind of
emulsion, the monomer is oil and droplets of oil are emulsified with the surfactant in water that
is in a continuous phase. The actual polymerization step takes place in particles that rapidly form
within the first five minutes of the process. The particles are roughly 100 nm and are made up of
a variety of individual polymer chains. The surfactant used for this method is soap and the
particles are stopped from forming solids when the surfactant surrounds them (Whitby & Katz,
1933). This method helps predetermine the size and shape of the MIPs formed, but the complex
nature of the polymerization makes it less convenient than bulk or precipitation polymerization
(Pradeshi & Singh, 2006).
There are several other polymerization methods used to form MIPs. Figure 10 shows the
most popular polymerization methods with advantages and disadvantages of each method (Yan
& Row, 2006).

11
Figure 10: List of common polymerization methods (Yan & Row, 2006)
2.3 Ultra Performance Liquid Chromatography
In Greek, Chromo means color, and graphic means writing. This color writing, or
chromatography, is a useful analytical technique that chemists utilize. Chromatography is used to
identify biological materials in the liquid or gas phase. A simple way of understanding what
chromatography is by using the example of ink on wet paper. The ink is a liquid which dissolves
in the water and moves across the surface of the paper. In a lab chromatography separates a
mixture of chemicals in the gas or liquid phase by allowing them to move past another substance
which is either a liquid or solid.
For chromatography to work we must have a mixture in one state, either gas or liquid,
move over the surface of something else in another state, the liquid or solid that stays stationary.
The mixture that is moving is known as the mobile phase and the other substance is known as the
stationary phase. When the mobile phase is moving across the stationary phase, its different
components are separated out on the stationary phase. This then allows us to analyze those
different components individually.
This laboratory utilized an Ultra Performance Liquid Chromatography device (UPLC). A
UPLC is an improvement on previous chromatography equipment in its chromatographic
resolution, speed, and sensitivity whose packing materials have smaller particle size than 1.7-1.8
µm. Figure 11 shows the UPLC used for our experiments.

12
Figure 11: UPLC Device
Our UPLC is connected to a computer running the columns software, and it can be used
to test many different samples with its autosampler. The user creates all of the samples they
would like to test with a set of standards placed at the beginning and end of the set of samples.
The UPLC then uses a needle to take the first sample and inject it into the column. The sample
then begins to form a band of colors that can be read. The sample takes about 5 minutes in total
to flow through the columns packing material. The different bands move separately at different
speeds through the column. This occurs because the bands are being attracted to the mobile
phase and stationary phase. The faster the band exits the column, the more attracted to the mobile
phase it is versus the stationary phase. The slowest moving compound is the most retained
compound in a sample.
The detector in the column helps to create the chromatogram on the computer, which is
how the sample is identified. Different peaks can be seen on the computer, which represent each
of the different components in the sample. The peaks each have a characteristic shape, which is
how the components the peak represents can be identified. The concentration peak of paclitaxel
and characteristic shape of paclitaxel on the UPLC can be seen in Figure 12.

13
Figure 12: Concentration peak of paclitaxel (chromatograph on left) with characteristic
paclitaxel shape (chromatograph on right)
The area of the peaks produced by the UPLC can then be used to determine the
concentrations in the samples. By comparing the area of the standards peaks to the area of the
samples peaks, the specific concentration of the paclitaxel in a sample can be determined. An
example standard curve can be seen in Figure 13.
Figure 13: Standard curve for paclitaxel concentration generated by the UPLC

14
Chapter 3: Methodology
As mentioned previously, one of the main goals of this project was to determine the
optimum conditions to form a paclitaxel-specific MIP. To accomplish this goal we completed the
following objectives:
1. Synthesized MIPs with a variety of solvents, solvent volume:paclitaxel mass ratio, cross-
linkers, template mole:functional monomer mole:cross-linker mole ratios, and
polymerization methods. Control polymers were synthesized in the same manner as the
MIPs with the absence of paclitaxel.
2. Removed the paclitaxel from the MIPs by sonicating them in acidified methanol. The
UPLC was used to measure the concentration of paclitaxel in solution to determine if it
had been removed from the MIPs.
3. Rebounded paclitaxel to the MIPs and control polymers to determine rebinding capacity
and selectivity of the MIPs. The UPLC was used to measure the concentration of
paclitaxel in solution to determine if it had bound to the MIPs and control polymers.
The common conditions that we varied for each MIP synthesis are listed as follows:
● Template
○ Paclitaxel, only template used
● Functional Monomer
○ Methacrylic Acid (MAA), only functional monomer used
● Cross-linker
○ Ethylene Glycol Dimethacrylate (EGDMA)
○ Trimethylolpropane Trimethacrylate (TRIM)
● Porogenic Solvent
○ Dichloromethane (DCM)
○ Toluene
○ Chloroform
● Molar Ratio of Template:Functional Monomer:Cross-linker
○ 1:4:20
○ 0.25:3:8
○ 2:4:20
○ 1:4:16
● Ratio of Solvent Volume:Template Mass
○ 25 μL/mg
○ 40 μL/mg
○ 50 μL/mg
● Initiator
○ Azo-N,N’-bisisobutyronitrile (AIBN), only initiator used

15
3.1 Molecularly Imprinted Polymer Synthesis
The two types of polymerization that were performed in our experiments to synthesize
MIPs were bulk polymerization and precipitation polymerization. These procedures are detailed
in the following sections.
3.1.1 Bulk Polymerization Procedure
The bulk polymerization procedure was based off the procedure by Tsermentseli,
Manesiotis, Assimopoulou, and Papageorgiou (2013), which formed MIPs targeting the drug
shikonin. A typical procedure was as follows: 20 mg of paclitaxel (template) were dissolved in
800 μL of chloroform (porogenic solvent) in an Eppendorf tube. This solution was split into two
UPLC vials, each containing 400 μL of the initial solution (each solution now contains 10 mg, or
11.7 μmol, of paclitaxel). 1.99 μL, or 23.4 μmol, of MAA (functional monomer) and 22.1 μL, or
117.1 μmol, of EGDMA (cross-linker) were then added to each solution. Finally, the last
chemical that was added to each vial was 2 μL of the initiator, AIBN, to allow the reaction to
proceed and form the polymers. The initiator does not perform in the presence of oxygen, so the
vials were capped and purged with nitrogen gas for 10 minutes to remove the oxygen. The
solutions were then added to a heating block at 70 oC for 24 hours. Corresponding control
polymers were prepared in the same manner without the presence of the template molecule,
paclitaxel.
3.1.2 Precipitation Polymerization Procedure
The polymerization procedure was based off the miniemulsion experiments by Ishuh et
al. (2014), which formed MIPs specific to paclitaxel, our target drug. A typical procedure was as
follows: 22.1 μL, or 117.1 μmol, of EGDMA (cross-linker), 1.99 μL, or 23.4 μmol, of MAA
(functional monomer), and 10 mg, or 11.7 μmol, of paclitaxel (template) were added to
Eppendorf tubes, which were then sonicated for 18 minutes. After sonication, 400 μL of
chloroform (porogenic solvent) and 0.5 μL of AIBN (initiator) were added to the Eppendorf
tubes, which were then continuously stirred for 3 hours. After 3 hours, the contents of the
Eppendorf tubes were transferred to UPLC vials and purged with nitrogen gas for 5 minutes. The
solutions were then added to a heating block at 70 oC for 16 hours. Corresponding control
polymers were prepared in the same manner without the presence of the template molecule,
paclitaxel.

16
3.2 Standard Curves and UPLC Analysis
To interpret the values of the peaks given by the UPLC for the template extraction and
template rebinding steps, a set of known standards were then prepared. Seven standards were
prepared to contained between 0-30 mg/L of paclitaxel in water/acetonitrile (H2O/ACN) solution
(70:30, v:v). Based on the paclitaxel peak measurements of the standards, we were able to
determine the paclitaxel concentration of the samples we were analyzing. This process was set to
run overnight with results available for analysis the following day.
3.3 Template Extraction
If the polymers successfully formed, then both the MIP and control vials were safely
cracked open using a hammer in a paper towel and added to Eppendorf tubes. The polymers
formed by bulk polymerization, except for those using chloroform as the solvent, were also
grinded in a mortar and pestle to increase the surface area of the particles. The polymers made in
chloroform stuck to the walls of the mortar, so grinding was abandoned for these polymers. Once
the polymers were transferred to the Eppendorf tubes, they were sonicated in 1 mL of
methanol/acetic acid solution (90:10, v:v), or acidified methanol, for 20 minutes to remove the
paclitaxel (template). This step was repeated between 5-8 times, depending on if the UPLC
readings determined that the paclitaxel was removed from the polymers. At first, readings were
taken after every acidified methanol wash to determine how much paclitaxel was removed after
each sonication. However, to save time only the final wash sample was analyzed by the UPLC in
future experiments. These samples were analyzed by diluting the liquid solution around the
MIPs and control polymers in water/acetonitrile (H2O/ACN) solution (70:30, v:v) to prevent the
UPLC unit from becoming oversaturated. If the UPLC did not read any paclitaxel peaks, it was
assumed that all of the paclitaxel in the MIPs was removed by the acidified methanol.
3.4 Template Rebinding
After the chromatographic analysis of the samples, if it was shown that all the paclitaxel
had been washed away, then the rebinding procedure was attempted to evaluate how well
paclitaxel rebounded to the MIPs and control polymers. To test this, 1 mL of a 10 mg/L solution
of paclitaxel and porogenic solvent was prepared around each MIP and control polymer. This
concentration was chosen because the PCF process by Phyton Biotech GmbH produces
paclitaxel at 10 mg/L. The solutions in the tubes were sonicated for 20 minutes, and then 500 μL
of the initial 1 mL of the solutions were transferred to fresh Eppendorf tubes. The tubes were
then added to an evaporative centrifuge to remove the liquid and leave behind any paclitaxel that
was left in solution. Following evaporation, 500 μL of water/acetonitrile (H2O/ACN) solution
(70:30, v:v) were added to each Eppendorf tube and sonicated for 6 minutes. The contents of the

17
Eppendorf tubes were then added to UPLC vials so that the concentration of paclitaxel could be
monitored using the UPLC to see if the template bound to the polymer. Readings of less than 10
mg/L of paclitaxel in solution would imply that the missing paclitaxel successfully rebounded to
the MIPs and control polymers. Ideally, more paclitaxel would rebind to the MIPs than control
polymers, which would indicate a higher paclitaxel-specificity for the MIPs than control
polymers.

18
Chapter 4: Results and Discussion
This section covers the observations and results of the experiments. The experimental
results are summarized in Table 1. Table 1 lists the conditions of the MIP formation including:
● Amount of template used
● Amount and type of functional monomer used
● Amount and type of cross-linker used
● Amount and type of solvent used
● Molar ratio between template, functional monomer, and cross-linker
● Method of polymerization
Table 1 also lists the steps taken after the polymer formation (if applicable) and the results of
those steps, including:
● If the polymers were grinded
● How often the polymers were washed in 90/10 methanol/acetic acid
● If the paclitaxel was successfully removed from the polymer
● The amount of paclitaxel successfully rebounded to the MIPs and controls

19
Table 1: MIP Results Summary
Date of Procedure
Template Functional Monomer
Cross-Linker
Solvent Molar Ratios
Method of Polymerization
Polymers Formed?
Polymer Grinding?
Amount of Washes in 90/10 MeOH/AcOH
Taxol Removed?
Taxol Rebounded?
Percent Rebounded in MIP
Amount Rebounded in CTL
1 10/28/2016 20 mg Taxol
7.95 μL MAA
88.3 μL EDMA
500 μL DCM
1:4:20 Bulk Yes No 1 No n/a n/a n/a
2 11/15/2016 5 mg Taxol
1.99 μL MAA
22.1 μL EDMA
125 μL DCM
1:4:20 Bulk No n/a
n/a
n/a
n/a
n/a
n/a
3 11/15/2016 5 mg Taxol
1.99 μL MAA
22.1 μL EDMA
125 μL Toluene
1:4:20 Bulk No n/a
n/a
n/a
n/a
n/a
n/a
4 11/17/2016 10 mg Taxol
3.97 μL MAA
44.2 μL EDMA
250 μL DCM
1:4:20 Bulk Yes No
1
No
n/a
n/a
n/a
5 11/17/2016 10 mg Taxol
3.97 μL MAA
44.2 μLEDMA
250 μL Toluene
1:4:20 Bulk Yes No
1
No
n/a
n/a
n/a
6 12/1/2016 5 mg Taxol
1.99 μL MAA
22.1 μL EDMA
125 μL DCM
1:4:20 Bulk Yes Yes 1 No n/a
n/a
n/a
7 12/1/2016 5 mg Taxol
1.99 μL MAA
22.1 μL EDMA
250 μL DCM
1:4:20 Bulk Yes Yes 1 No n/a
n/a
n/a
8 12/1/2016 5 mg Taxol
5.96 μL MAA
59.8 μL TRIM
125 μL DCM
0.25:3:8 Bulk Yes Yes 1 No n/a
n/a
n/a
9 12/1/2016 5 mg Taxol
1.99 μL MAA
22.1 μL EDMA
125 μL Toluene
1:4:20 Bulk Yes Yes 1 No n/a
n/a
n/a
10 12/1/2016 5 mg Taxol
1.99 μL MAA
22.1 μL EDMA
250 μL Toluene
1:4:20 Bulk Yes Yes 1 No n/a
n/a
n/a
11 12/5/2016 5 mg Taxol
1.99 μL MAA
22.1 μL EDMA
125 μL DCM
1:4:20 Bulk Yes Yes 5 Yes Yes 27% ± 3% 28% ± 2%
12 12/5/2016 5 mg Taxol
1.99 μL MAA
22.1 μL EDMA
250 μL DCM
1:4:20 Bulk Yes Yes 5 Yes Yes 37% ± 20% 41% ± 6%
13 12/5/2016 5 mg Taxol
5.96 μL MAA
59.8 μL TRIM
125 μL DCM
0.25:3:8 Bulk Yes Yes 5 Yes Yes 31% ± 9% 23% ± 2%
14 12/5/2016 5 mg Taxol
1.99 μL MAA
22.1 μL EDMA
125 μL Toluene
1:4:20 Bulk Yes Yes 5 Yes Yes 20% ± 13% 27% ± 6%

20
Date of Procedure
Template Functional Monomer
Cross-Linker
Solvent Molar Ratios
Method of Polymerization
Polymers Formed?
Polymer Grinding?
Amount of Washes in 90/10 MeOH/AcOH
Taxol Removed?
Taxol Rebounded?
Amount Rebounded MIP
Amount Rebounded CTL
15 12/5/2016 5 mg Taxol
1.99 μL MAA
22.1 μL EDMA
250 μL Toluene
1:4:20 Bulk Yes Yes 5 Yes Yes 23% ± 2% 25% ± 2%
16 1/23/2017 5 mg Taxol
1.99 μL MAA
22.1 μL EDMA
200 μL Chloroform
1:4:20 Bulk Yes No 5 Yes No
n/a
n/a
17 1/23/2017 10 mg Taxol
1.99 μL MAA
22.1 μL EDMA
400 μL Chloroform
2:4:20 Bulk Yes No 8 Yes Yes 70% ± 1% 57% ± 3%
18 1/23/2017 5 mg Taxol
1.99 μL MAA
17.7 μL EDMA
200 μL Chloroform
1:4:16 Precipitation Yes No 5 Yes No n/a
n/a
19 1/23/2017 5 mg Taxol
5.96 μL MAA
60.3 μL TRIM
200 μL Chloroform
0.25:3:8 Precipitation Yes No 8 Yes No n/a
n/a
20 1/31/2017 5 mg Taxol
1.99 μL MAA
22.1 μL EDMA
200 μL Chloroform
1:4:20 Bulk Yes No 5 Yes No n/a
n/a
21 1/31/2017 5 mg Taxol
1.99 μL MAA
22.1 μL EDMA
400 μL Chloroform
1:4:20 Bulk Yes No 5 Yes No n/a
n/a
22 1/31/2017 5 mg Taxol
1.99 μL MAA
17.7 μL EDMA
400 μL Chloroform
1:4:16 Precipitation Yes No 5 Yes No n/a
n/a
23 1/31/2017 5 mg Taxol
1.99 μL MAA
60.3 μL TRIM
400 μL Chloroform
0.25:3:8 Precipitation No
n/a
n/a
n/a
n/a
n/a
n/a
24 2/21/2017 10 mg Taxol
1.99 μL MAA
22.1 μL EDMA
400 μL Chloroform
2:4:20 Bulk Yes No 7 Yes ? ? ?
25 2/21/2017 10 mg Taxol
1.99 μL MAA
37.7 μL TRIM
400 μL Chloroform
2:4:20 Bulk Yes No 7 Yes ? ? ?
26 2/21/2017 10 mg Taxol
1.99 μL MAA
22.1 μL EDMA
400 μL Chloroform
2:4:20 Precipitation No n/a
n/a
n/a
n/a
n/a
n/a
27 2/21/2017 10 mg Taxol
1.99 μL MAA
37.7 μL TRIM
400 μL Chloroform
2:4:20 Precipitation No n/a
n/a
n/a
n/a
n/a
n/a

21
4.1 Experimental Results
From the results summarized in Table 1, the following observations can be made:
1. The functioning MIPs formed in chloroform were able to rebind to paclitaxel well,
but were not highly paclitaxel specific.
The MIPs made in row 17 of Table 1 using a molar ratio of 2:4:20 between paclitaxel,
MAA, and EGDMA were the most effective functioning MIPs at rebinding to paclitaxel,
rebinding 70% ± 1% of paclitaxel in a 10 mg/L solution. No other functioning MIPs were able to
rebind more than 37% ± 20% of paclitaxel in a 10 mg/L solution.
However, the control polymers for these conditions rebounded 57% ± 3% of paclitaxel in
the same concentration of solution. This 13% ± 4% difference between the MIPs and control
polymers is higher than those of the other MIPs and control polymers, but greater differences
have been observed, such as those in the miniemulsion experiments by Ishkuh, Javanbakht,
Esfandyari-Manesh, Dinarvand, and Atyabi (2014). In those experiments, differences between
15.7% and 38.4% were observed. In addition, those experiments resulted in rebinding for control
polymers between 2.2 and 11.8%, far less than the 57% ± 3% observed in our experiments.
The main advantage of our most successful MIP is the high rebinding capacity of 70% ±
1%. The rebinding capacities observed in Ishkuh et al. (2014) were only between 18.4% and
48.4%. However, with the low difference in rebinding percentage between the MIPs and control
polymers, this advantage is less meaningful.
2. The functioning MIPs formed in dichloromethane and toluene neither rebounded to
paclitaxel well nor were paclitaxel specific.
The MIPs and control polymers described from rows 11 to 15 in Table 1, were able to
successfully rebind to paclitaxel, but were not able to do so as well as the successful one from
row 17. The MIP in these rows with the highest rebinding capacity was made with the conditions
in row 12. This resulted in a rebinding capacity of 37% ± 20%, far below the 70% ± 1% in row
17.
These MIPs were also far less selective than the MIPs in row 17. The control polymers in
rows 11, 12, 14, and 15 actually rebounded a higher percentage of paclitaxel than the MIPs. For
example, in row 12, the control polymers rebounded 41% ± 6% of the paclitaxel in solution, a
higher percentage than the 37% ± 20% that the MIPs rebounded to. The most selective MIP in
these rows was row 13, which used TRIM as the cross-linker and template:monomer:cross-linker
ratio of 0.25:3:8. The difference in selectivity between the MIPs and control polymers of 8% ±
11%. However, because of the potential error involved in this calculation even this MIP could
still be less selective to paclitaxel than the control polymers.
22
3. Increasing amount of dichloromethane solvent increased average rebinding capacity
for paclitaxel, but did not increase paclitaxel selectivity.
The main difference between rows 11 and 12 was the amount of dichloromethane used as
solvent in the MIP formulation. Row 11 used 125 μL of dichloromethane while row 12 used 250
μL of dichloromethane. All other conditions between the two rows were kept constant. In row
11, these conditions resulted in a rebinding capacity of 27% ± 3% in the MIPs and 28% ± 2% in
the control polymers. In row 12 with the extra solvent, these numbers jumped to 37% ± 20% in
the MIPs and 41% ± 6% in the control polymers. These numbers indicate that while increasing
the amount of dichloromethane increased the rebinding capacity, the selectivity for paclitaxel did
not improve as well.
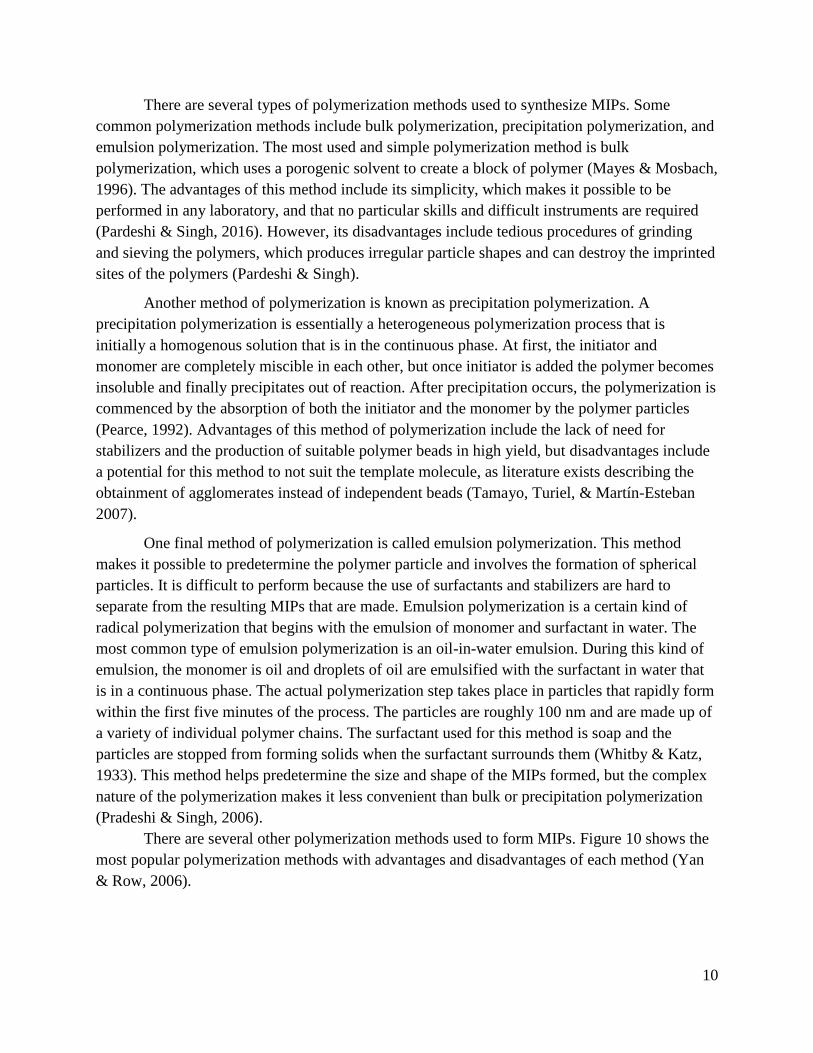
4. Paclitaxel does not completely dissolve in toluene.
The MIPs and control polymers formed in rows 14 and 15 were set up in the same manner as
those in rows 11 and 12, with the exception of toluene used as solvent rather than
dichloromethane. Row 14 used 125 μL of toluene while row 15 used 250 μL of toluene, with all
other conditions kept constant.
It was discovered during the experiment that paclitaxel does not dissolve well in toluene.
Figure 14 illustrates this observation.
Figure 14: Paclitaxel (white particles) in toluene
We hypothesized that this occured because of the polarity of paclitaxel and the non-
polarity of toluene, since polar molecules tend to dissolve better in polar solvents than non-polar
23
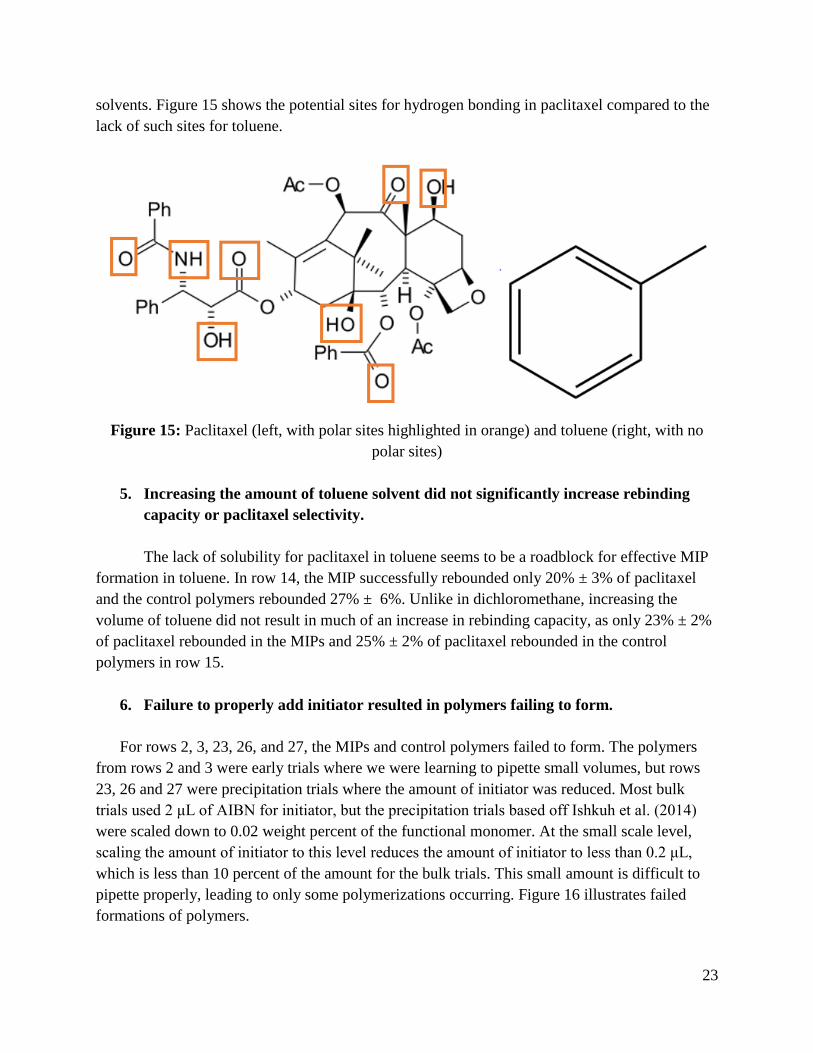
solvents. Figure 15 shows the potential sites for hydrogen bonding in paclitaxel compared to the
lack of such sites for toluene.
Figure 15: Paclitaxel (left, with polar sites highlighted in orange) and toluene (right, with no
polar sites)
5. Increasing the amount of toluene solvent did not significantly increase rebinding
capacity or paclitaxel selectivity.
The lack of solubility for paclitaxel in toluene seems to be a roadblock for effective MIP
formation in toluene. In row 14, the MIP successfully rebounded only 20% ± 3% of paclitaxel
and the control polymers rebounded 27% ± 6%. Unlike in dichloromethane, increasing the
volume of toluene did not result in much of an increase in rebinding capacity, as only 23% ± 2%
of paclitaxel rebounded in the MIPs and 25% ± 2% of paclitaxel rebounded in the control
polymers in row 15.
6. Failure to properly add initiator resulted in polymers failing to form.
For rows 2, 3, 23, 26, and 27, the MIPs and control polymers failed to form. The polymers
from rows 2 and 3 were early trials where we were learning to pipette small volumes, but rows
23, 26 and 27 were precipitation trials where the amount of initiator was reduced. Most bulk
trials used 2 μL of AIBN for initiator, but the precipitation trials based off Ishkuh et al. (2014)
were scaled down to 0.02 weight percent of the functional monomer. At the small scale level,
scaling the amount of initiator to this level reduces the amount of initiator to less than 0.2 μL,
which is less than 10 percent of the amount for the bulk trials. This small amount is difficult to
pipette properly, leading to only some polymerizations occurring. Figure 16 illustrates failed
formations of polymers.

24
Figure 16: MIP (two left vials) and control polymer (two right vials) contents, with only one
control polymer forming
7. The precipitation procedure was ineffective at producing functioning MIPs.
No successful MIPs were formed from the precipitation reaction procedure based on Ishkuh
et al. (2014). Some failure for the precipitation procedure can be blamed on the low amount of
initiator, but another reason for the lack of success could be that the initial procedure by Ishkuh
et al. (2014) utilizes miniemulsion polymerization, not precipitation polymerization. This
procedure required the use of a surfactant and a hydrophobic agent, while our procedure was
simply modified to not require either surfactant or hydrophobic agent. This approach has turned
out to be ineffectual as it is and will need to be modified for it to work.
4.2 Analysis of Variance
To determine which varied components had the biggest impact on rebinding results for
our MIPs and control polymers, our group performed an Analysis of Variance, or ANOVA. An
ANOVA is a set of statistical methods that allows us to estimate the change caused by each
varied component of our MIPs (Analysis of Variance, n.d.).
For our ANOVA, we tested the changes in rebinding capacity for the MIPs and control
polymers caused by the following components: the type of solvent, the amount of solvent in
relation to the template, the type of cross-linker, and the molar ratio between the template,
functional monomer, and cross-linker. The results of the ANOVA for the MIPs and control
polymers are shown by Table 2 and Table 3. According to the ANOVA, F values that are greater
than the F-crit values indicate that the component had a significant impact on the rebinding
capacity of the MIPs or control polymers, while F values that are lesser than the F-crit values
indicate that the component did not have a significant impact on the rebinding capacity of the
MIPs or control polymers. P-values with a value less than 0.05 indicate that there is a strong
confidence in the results, while P-values with a value greater than 0.05 indicate that there is not a
strong confidence in the results.

25
Table 2: MIP Rebinding ANOVA Results
MIP Formation
Condition
F P-Value F-crit
Solvent 10.12 0.00498 4.26
Solvent Volume/mg
Template
8.37 0.00883 4.26
Cross-Linker 0.07 0.797 4.96
Template:Functional
Monomer:Cross-Linker
Molar Ratio
8.32 0.00899 4.26
Table 3: Control Polymer Rebinding ANOVA Results
CTL Formation
Condition
F P-Value F crit
Solvent 5.99 0.0257 4.46
Solvent Volume/mg
Template
7.31 0.0156 4.46
Cross-Linker 1.50 0.251 5.12
Template:Functional
Monomer:Cross-
Linker Molar Ratio
6.73 0.0193 4.46
According to the ANOVA in Table 2, varying solvent had the greatest impact on the
rebinding capacity of the MIPs, while varying cross-linker had the least impact on the rebinding
capacity of the MIPs. For the solvents, an F value of 10.12 was calculated in comparison to an F-
crit value of 4.26. In addition, the P-value is only 0.00498, which is less than 0.05, which
indicates a high confidence in these results. For the cross-linkers, an F value of 0.07 was
calculated in comparison to an F-crit value of 4.96, indicating a negligible impact on the
rebinding capacity of the MIPs. However, the P-value of 0.797 is greater than 0.05, which
indicates a low confidence in the accuracy of these results.
For the control polymers, similar trends were observed in the ANOVA in Table 3. The
cross-linker was shown to be the only varied component to have a lower F value than F-crit
value, but with a P-value greater than 0.05. Unlike the MIPs however, the ratio between solvent
volume and mass of template had the greatest impact on the effectiveness of the control
polymers, with the highest F value calculated to be 7.31.
26
Chapter 5: Conclusions and Recommendations
Over the course of the project, several conditions for the construction of a paclitaxel-
specific MIP were investigated. In this section, the shortcomings for our experiments, a summary
of what was studied, and ideas for future study will be discussed.
5.1 Experimental Shortcomings
While a few functioning MIPs were created, there are two main shortcomings that can be
observed from our experiments that are stated as follows:
1. The sample size for the working MIPs is small with non-definitive results.
There were 27 MIP groups created for this project. Out of them, only six groups showed any
rebinding capacity for the MIPs and control polymers. The working polymers are listed in Table
4.
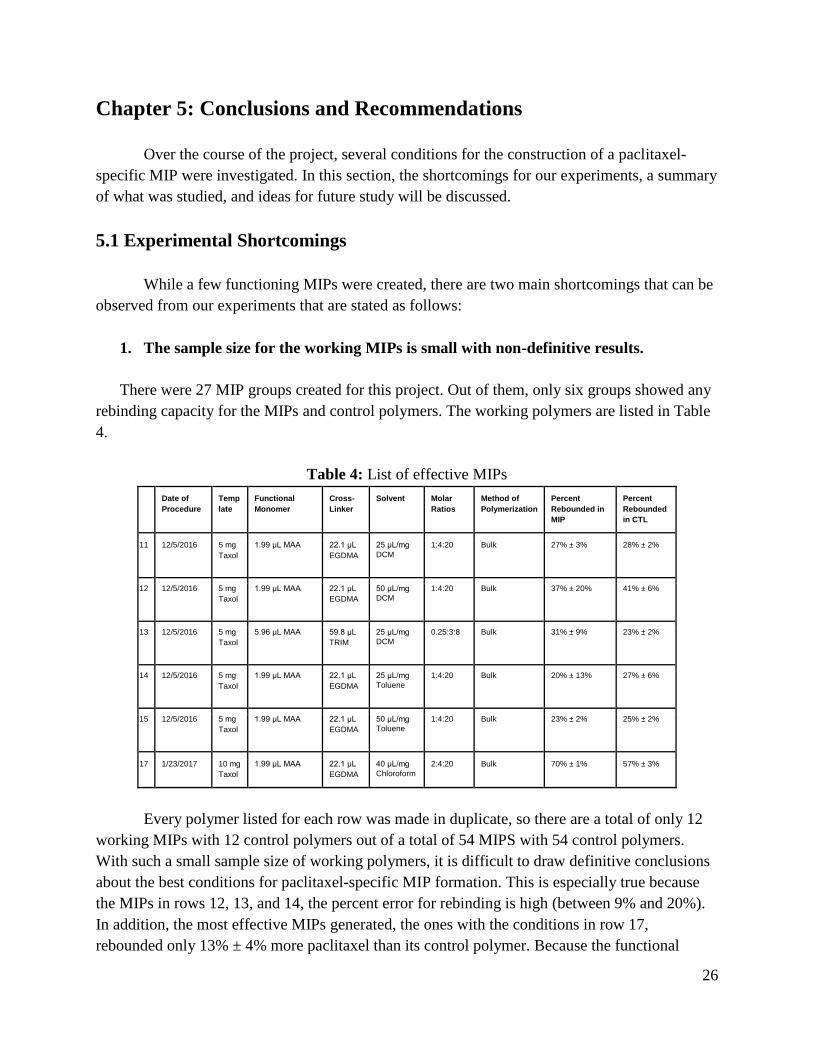
Table 4: List of effective MIPs
Date of
Procedure
Temp
late
Functional
Monomer
Cross-
Linker
Solvent Molar
Ratios
Method of
Polymerization
Percent
Rebounded in
MIP
Percent
Rebounded
in CTL
11 12/5/2016 5 mg
Taxol
1.99 μL MAA 22.1 μL
EGDMA
25 μL/mg
DCM
1:4:20 Bulk 27% ± 3% 28% ± 2%
12 12/5/2016 5 mg
Taxol
1.99 μL MAA 22.1 μL
EGDMA
50 μL/mg
DCM
1:4:20 Bulk 37% ± 20% 41% ± 6%
13 12/5/2016 5 mg
Taxol
5.96 μL MAA 59.8 μL
TRIM
25 μL/mg
DCM
0.25:3:8 Bulk 31% ± 9% 23% ± 2%
14 12/5/2016 5 mg
Taxol
1.99 μL MAA 22.1 μL
EGDMA
25 μL/mg
Toluene
1:4:20 Bulk 20% ± 13% 27% ± 6%
15 12/5/2016 5 mg
Taxol
1.99 μL MAA 22.1 μL
EGDMA
50 μL/mg
Toluene
1:4:20 Bulk 23% ± 2% 25% ± 2%
17 1/23/2017 10 mg
Taxol
1.99 μL MAA 22.1 μL
EGDMA
40 μL/mg
Chloroform
2:4:20 Bulk 70% ± 1% 57% ± 3%
Every polymer listed for each row was made in duplicate, so there are a total of only 12
working MIPs with 12 control polymers out of a total of 54 MIPS with 54 control polymers.
With such a small sample size of working polymers, it is difficult to draw definitive conclusions
about the best conditions for paclitaxel-specific MIP formation. This is especially true because
the MIPs in rows 12, 13, and 14, the percent error for rebinding is high (between 9% and 20%).
In addition, the most effective MIPs generated, the ones with the conditions in row 17,
rebounded only 13% ± 4% more paclitaxel than its control polymer. Because the functional

27
monomers, cross-linkers, type and amount of solvent, molar ratios, and type of polymerization
can all be varied in a myriad of ways, there are likely untested combinations that would result in
more effective MIPs.
2. High paclitaxel-selectivity was not achieved, but there is potential for selectivity to
improve.
The biggest drawback for our polymers, outside of the lack of a large sample size, was the
lack of selectivity demonstrated by the MIPs and control polymers. As can be seen in Table 4,
most MIPs that rebounded to paclitaxel at all rebounded less than 40% of 10 mg/L of paclitaxel
in solution, and for rows 11, 12, 14, and 15 the control polymers actually rebounded a higher
percentage of paclitaxel than the MIPs. Only the MIP conditions in row 17 resulted in a high
rebinding capacity of 70% ± 1%, but with a high rebinding capacity in the control polymer of
57% ± 3% , the difference between the MIP and control polymer is only 13% ± 4%. As
discussed previously, the paclitaxel imprinted polymers from Ishkuh et al. resulted in lower
rebinding capacities but a higher rebinding difference between the MIPs and control polymers.
Table 5 highlights these differences.
Table 5: Percentage of paclitaxel (PTX) rebinding by polymers and difference binding between
MIPs & control polymers (NIP) with chloroform as solvent (Ishkuh et al., 2014)
Polymer PTX
(mmol)
MAA
(mmol)
MMA
(mmol)
EGDMA
(mmol)
TRIM
(mmol)
PTX
rebinding
MIP (%)
PTX
rebinding
NIP (%)
Difference binding
between MIP & NIP
MIP1 1 4 – 16 – 18.5 2.2 16.3
MIP2 0.25 3 – – 8 48.4 10 38.4
MIP3 0.25 3 – – 4 35.2 11.8 23.4
MIP4 0.25 3 – – 1 18.4 2.7 15.7
MIP5 0.25 3 6 – 1 23.6 5.6 18
MIP6 0.25 3 6 – 2 25.9 5 20.9
The lowest rebinding difference between the MIP and control polymer in the experiments
by Ishkuh et al. (2014) is 15.7% for MIP 4, which is greater than the 13% ± 4% observed for our
most effective polymer in row 17. Since these experiments show that differences of up to 38.4%
for a paclitaxel-specific MIP are possible, this shows there is still plenty of room for
improvement for the selectivity of our MIPs.

28
5.2 Recommendations for Future Work
Because of the limited timespan for our project, we were limited to how we could vary
the conditions for forming the MIPs and control polymers. The variables that we tested, with the
reason that we tested them, are listed as follows:
1. Molar ratios
a. 1:4:20, tested 16 times
i. Common “Golden Ratio” for the template:functional monomer:cross-
linker (McClusky et al., 2007)
ii. Example: Lanza and Sellergren (1999) paper for testing small scale MIP
synthesis with terbuthylazine as template
b. 2:4:20, tested 5 times
i. Produced most effective MIP in our experiments
c. 0.25:3:8, tested 4 times
i. Most effective ratio in Ishkuh et al. (2014) using paclitaxel, MAA, and
TRIM
d. 1:4:16, tested 2 times
i. Ratio used in Ishkuh et al. (2014) using paclitaxel, MAA, and EGDMA
2. Effects of functional monomer
a. Only MAA used
i. One of the most commonly used functional monomers
ii. Effective in paper by Ishkuh et al. (2014) with paclitaxel as template
3. Effects of cross-linker
a. EGDMA, tested 21 times
i. One of the most commonly used cross-linkers (Vasapollo et al., 2011)
b. TRIM, tested 6 times
i. One of the most commonly used cross-linkers (Vasapollo et al., 2011)
ii. Effective in paper by Ishkuh et al. (2014) with paclitaxel as template
4. Porogenic solvent
a. Dichloromethane, tested 9 times
i. One of the most commonly used cross-linkers (Vasapollo et al., 2011)
b. Toluene, tested 6 times
i. One of the most commonly used cross-linkers (Vasapollo et al., 2011)
c. Chloroform, tested 12 times
a. One of the most commonly used cross-linkers (Vasapollo et
al., 2011)
b. Effective in paper by Ishkuh et al. (2014) with paclitaxel as
template
29
Because only one reasonably effective MIP was produced under these conditions, more
MIP formation conditions should be tested to address the lack of sample size and effectiveness
for our MIPs. Recommendations for different conditions are given in the following sections.
5.2.1 Molar Ratio Recommendations
The ratio between template:functional monomer:cross-linker has been proven to have a
significant impact on MIP effectiveness. A molar ratio of 1:4:20 is a generally accepted starting
point to begin experimentation, but this ratio does not always produce the most effective MIPs.
For example, the experiments by Ishkuh et al. (2014) showed the most effective MIP for
miniemulsion with paclitaxel as template had a molar ratio of 0.25:3:8, not 1:4:20.
The Ishkuh et al. (2014) experiments also demonstrated that decreasing the amount of
cross-linker in relation to the template gradually resulted in less effective MIPs (see Table 5 in
Chapter 5.1, MIPs 2, 3, and 4). In general, this trend follows the literature, which suggests an
excess of cross-linking monomers in relation to the template and functional monomer is more
favorable to a lack of cross-linking monomers. Papers by Liu, Dai, Li, Tang, and Jin (2014) and
Song, Wang, and Shu (2009) support this claim. The experiments in Liu et al. (2014) used a
template:cross-linker ratio of 1:35 that produced effective MIPs for the antibiotic drug
enrofloxacin (ENRO), while the experiments used in Song et al. (2009) used a template:cross-
linker ratio of 1:46.25 that produced effective MIPs for the flavonol quercetin. This may not
always be the case, as a paper by Tom, Schneck, and Walter (2012) found that increasing the
template:cross-linker ratio from 1:20 to 1:40 actually decreased the effectiveness of MIPs made
for the antimicrobial medication sulfadimethoxine (SDM). However, this was acknowledged in
the paper as unusual and not typical for MIPs.
The relation between the ratio of template:functional monomer is much less defined than
the relation between the relation between template:cross-linker. A ratio between
template:functional monomer of 1:4 is a typical starting point, but the most effective ratios
usually depend on the nature of the template and functional monomer. For example, the
experiments by Liu et al. (2014) found that a template:functional monomer ratio of 1:7 would be
the most effective with ENRO as template and MAA as the functional monomer. Liu et al.
(2014) theoretically predicted this ratio using geometry optimization, the bonding situation, and
the binding energies involved between ENRO and MAA and then experimentally demonstrated
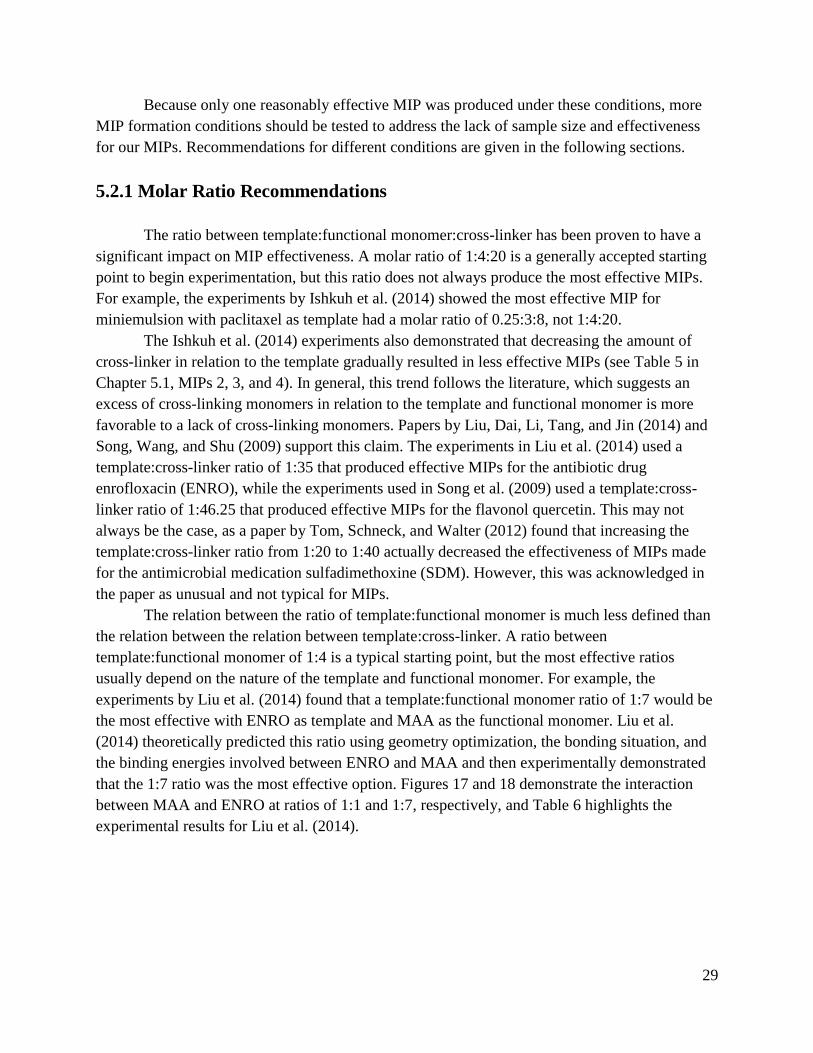
that the 1:7 ratio was the most effective option. Figures 17 and 18 demonstrate the interaction
between MAA and ENRO at ratios of 1:1 and 1:7, respectively, and Table 6 highlights the
experimental results for Liu et al. (2014).
30
Figure 17: Template:Functional Monomer Ratio of 1:1 with ENRO and MAA (highlighted in
orange) (Liu et al. 2014)
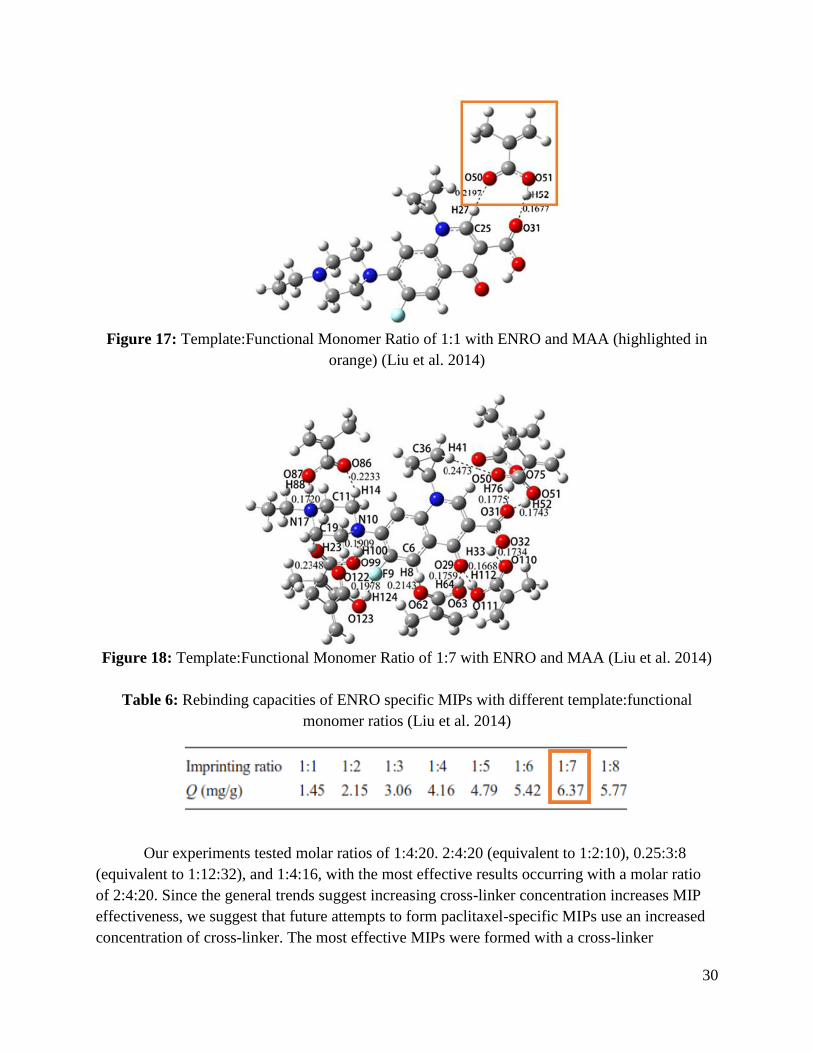
Figure 18: Template:Functional Monomer Ratio of 1:7 with ENRO and MAA (Liu et al. 2014)
Table 6: Rebinding capacities of ENRO specific MIPs with different template:functional
monomer ratios (Liu et al. 2014)
Our experiments tested molar ratios of 1:4:20. 2:4:20 (equivalent to 1:2:10), 0.25:3:8
(equivalent to 1:12:32), and 1:4:16, with the most effective results occurring with a molar ratio
of 2:4:20. Since the general trends suggest increasing cross-linker concentration increases MIP
effectiveness, we suggest that future attempts to form paclitaxel-specific MIPs use an increased
concentration of cross-linker. The most effective MIPs were formed with a cross-linker

31
concentration ten times greater than the template concentration, while MIPs formed in papers by
Liu et al. (2014), Song et al. (2009), and Tom et al. (2012) made effective MIPs using cross-
linker concentrations 35, 46.25, and 40 times the concentrations of the templates.
The ratio between template:functional monomer does not follow the same trends as the
template:cross-linker ratio, making it more difficult to predict a ratio that would increase MIP
effectiveness. Increasing functional monomer concentration to excess does not necessarily
increase MIP effectiveness, as evidenced by the results reported by Liu et al. (2014) in Table 6,
so optimizing a ratio is difficult. Since a template:functional monomer ratio of 1:2 produced an
effective MIP with the other tested ratios relatively inconclusive, we recommend testing
template:functional monomer ratios of 1:4 again, 1:6, and 1:15. These were the ratios tested by
Tom et al. (2012), and depending on the results more specific ratios could be tested to optimize
the template:functional monomer ratio provided the MIPs work effectively.
5.2.2 Functional Monomer Recommendations
The interaction between the template and functional monomer is important to consider
when forming an MIP. It is generally assumed that the stronger or more stable the complex is
between the template and functional monomer before polymerization occurs the more selective
the MIP will be (Karim et al. 2005). This is why MAA is commonly used, and why we used it
for our experiments, as the functional monomer for MIP formation; its ability to act as a
hydrogen bond proton donor and hydrogen bond proton acceptor allow it strongly interact with
compounds such as paclitaxel. Figure 19 demonstrates how MAA can interact with paclitaxel to
form a stable complex.
Figure 19: MAA hydrogen bonding with paclitaxel (Ishkuh et al., 2014)
However, Fu, Yang, Zhou, Lin, and Yang (2015) investigated the interaction strength
between the flavone luteolin and the functional monomers 1-allyl-piperazine (1-ALPP), 4-
vinylpyridine (4-VP), and acrylic acid (AA), and found that interaction strength does not
necessarily correlate to more selective MIPs. While 1-ALPP has the strongest interaction with
luteolin and AA has the weakest interaction, Fu et al. (2015) found that with luteolin as the

32
template, EGDMA as the cross-linker, and tetrahydrofuran (THF) as the porogenic solvent, MIPs
with 4-VP as the functional monomer were the most selective, with 1-ALPP MIPs being the next
most selective and AA MIPs as the least selective. These results suggest that the functional
monomer interaction with the cross-linker and solvent is important to consider as well as the
functional monomer interaction with the template.
Since the choice of functional monomer for paclitaxel-specific MIPs can depend on how
it interacts with cross-linker and solvent as well as the template, we recommend continuing to
utilize MAA as the monomer while using a cross-linker and solvent that has weak interactions
with MAA. If adjustments to the functional monomer must be made, additional functional
monomers are listed in Table 7.
Table 7: List of Functional Monomers
Acrylic Acid (AA)
P-vinylbenzoic acid
Itaconic acid
Acrylamide (AM)
2-(Trifluoromethyl)Acrylic Acid (TFMAA)
2-Hydroxyethyl Methacrylate (HEMA)
4-Vinylpyridine (4-VP)
1-Allyl-piperazine (1-ALPP)
5.2.3 Cross-Linker Recommendations
The interaction of the cross-linker with the other components of MIPs is far less studied
than the roles of the template, functional monomer, and porogenic solvent, but nevertheless is
plays an important role in the effectiveness and selectivity of MIPs. The group from Ishkuh et al.
(2014) was able to produce working MIPs using TRIM as cross-linker, while our experiments
produced successful MIPs using EGDMA as cross-linker.
However, research by Muhammad, Nur, Piletska, Yimit, and Piletsky (2012) suggests
that the cross-linker should be chosen based on the strength of its interaction with the template.
This research demonstrated a correlation between the binding energy of the cross-linkers
EGDMA, TRIM, and divinylbenzene (DVB) with zidovudine (AZT), a drug used to treat
HIV/AIDS, and the effectiveness of the MIPs produced using those cross-linkers. The DVB,
which had the lowest binding energy with AZT, was found to be the most effective cross-linker
for AZT-specific MIPs, while EGDMA, which had the highest binding energy with AZT, was
found to be the least effective for AZT-specific MIPs. Figure 20 demonstrates the difference in
33
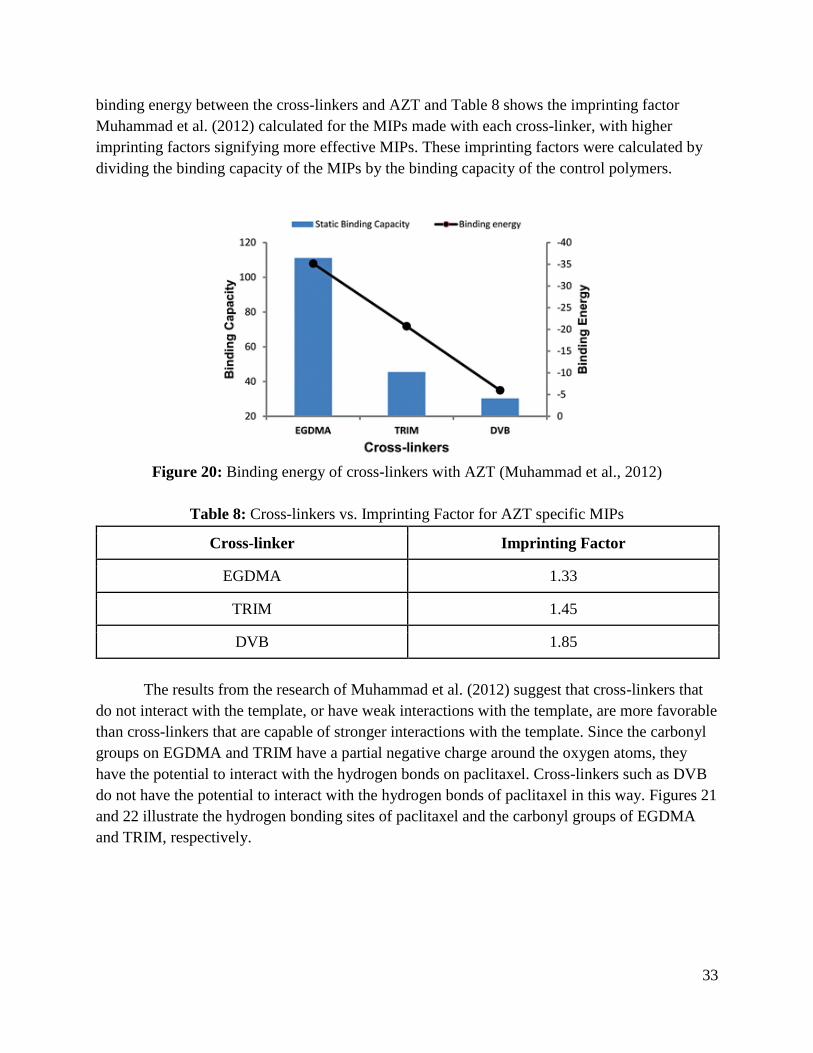
binding energy between the cross-linkers and AZT and Table 8 shows the imprinting factor
Muhammad et al. (2012) calculated for the MIPs made with each cross-linker, with higher
imprinting factors signifying more effective MIPs. These imprinting factors were calculated by
dividing the binding capacity of the MIPs by the binding capacity of the control polymers.
Figure 20: Binding energy of cross-linkers with AZT (Muhammad et al., 2012)
Table 8: Cross-linkers vs. Imprinting Factor for AZT specific MIPs
Cross-linker Imprinting Factor
EGDMA 1.33
TRIM 1.45
DVB 1.85
The results from the research of Muhammad et al. (2012) suggest that cross-linkers that
do not interact with the template, or have weak interactions with the template, are more favorable
than cross-linkers that are capable of stronger interactions with the template. Since the carbonyl
groups on EGDMA and TRIM have a partial negative charge around the oxygen atoms, they
have the potential to interact with the hydrogen bonds on paclitaxel. Cross-linkers such as DVB
do not have the potential to interact with the hydrogen bonds of paclitaxel in this way. Figures 21
and 22 illustrate the hydrogen bonding sites of paclitaxel and the carbonyl groups of EGDMA
and TRIM, respectively.

34
Figure 21: Hydrogen bonding sites on paclitaxel (highlighted in orange)
Figure 22: EGDMA (left) and TRIM (center) compared to DVB (right), with carbonyl groups in
EGDMA and TRIM highlighted in orange (Cheong et al., 2013)
Because of these observations, we recommend future attempts to make paclitaxel-specific
MIPs utilize cross-linkers such as DVB that would not interact with the hydrogen bonds of
paclitaxel. 1,3-Diisopropenylbenzene (DIP) would also fit this description, since it does not
contain any nitrogen or oxygen groups that would interact with hydrogen bonds. Other potential
cross-linkers are listed in Table 9.
Table 9: List of Cross-linkers
Divinylbenzene (DVB)
1,3-Diisopropenylbenzene (DIP)
Tetramethylene Dimethacrylate (TDMA)
Pentaerythritol Triacrylate (PETRA)
Pentaerythritol Tetraacrylate (PETEA)
N,N’-Methylenediacrylamide
N,N’-1,4-Phenylenediacrylamide

35
5.2.4 Porogenic Solvent Recommendations
Selecting the proper porogenic solvent is an important factor for making effective MIPs
because different solvents can interact differently with the template, functional monomer, and
cross-linker. These interactions can impact the formation of the MIPs and their ability to function
properly (Song et al., 2009).
Our experiments, and the experiments by Ishkuh et al. (2014), produced working MIPs
using chloroform as the porogenic solvent, while our experiments using DCM and toluene
produced much less effective MIPs. Experiments by Song et al. (2009), however, suggest that
important aspects to consider for the solvent are its polarity and the amount of solvent used in
relation to the template, functional monomer, and cross-linker. Song et al. (2009) researched the
effects of using 1,4-dioxane, tetrahydrofuran (THF), acetone, and acetonitrile as solvent to
produce MIPs specific to the flavonol quercetin, a polar molecule. The research found that THF,
which has a medium polarity, was the best solvent for producing quercetin-specific MIPs. Table
10 shows the dielectric constant for each of these solvents, with higher constants representing
higher polarity, in comparison to the imprinting factor for the MIPs produced by each solvent.
Table 10: Polarity of each solvent vs. Imprinting Factor
Porogenic Solvents from
Song et al. 2009
Dielectric Constant (ε) Imprinting Factor
1,4-Dioxane 2.25 1.05
THF 7.58 1.20
Acetone 20.7 1.07
Acetonitrile 37.5 1.03
Song et al. (2009) hypothesized that this trend occurred because the relatively high
polarity for acetone and acetonitrile resulted in the template and the functional monomer
interacting with the solvent more than with each other. This would lead to fewer quercetin-
specific imprinting sites for the MIPs, which would decrease the specificity of the MIPs.
Meanwhile, Song et al. (2009) hypothesized that the relatively low polarity for 1,4-dioxane lead
to the MIPs falling precipitating out of solution quickly because polar molecules are less soluble
in non-polar solvents. This was demonstrated in our experiments by the lack of solubility of
paclitaxel in toluene and the poor performance of the MIPs formed using toluene. Song et al.
(2009) hypothesized that because THF has a medium polarity in comparison to the other solvents
mentioned, the template and functional monomers were able to act more properly for MIP
formation.
The other trend that was realized by Song et al. (2009) was that when several volumes of
solvent with the same amount of template, functional monomer, and cross-linker, an optimum

36
volume of solvent can be determined for the most effective MIPs. Figure 23 shows the effect that
the volume of THF has on the MIPs’ ability to adsorb quercetin according to Song et al. (2009).
The results show an optimum volume of 5 mL of THF when using 0.13 g of quercetin as
template, 0.2 g of acrylamide as functional monomer, and 3.5 mL of EGDMA as cross-linker.
Song et al. hypothesized that solvent volumes below 5 mL resulted in the MIPs precipitating too
early for proper imprinted sites to form. It was also hypothesized that volumes above 5 mL
diluted the solution too much and caused imprinted sites to have more defects.
Figure 23: Effect of THF volume on adsorption of quercetin (Song et al., 2009)
The main trends from Song et al. (2009) suggest that solvents have an optimum polarity
for forming MIPs, depending on the template, and that there is an optimum solvent volume that
can be experimentally determined. Table 11 shows the dielectric constants of the solvents used in
our experiments.
Table 11: Dielectric constants of tested solvents (Dielectric Constant, n.d.)
Porogenic Solvents from our trials Dielectric Constant (ε)
Toluene 2.38
Chloroform 4.81
DCM 8.93
Chloroform, a solvent with a polarity that falls in between those of toluene and DCM,
was the solvent that produced our most effective paclitaxel-specific MIPs. The working MIPs

37
formed by both toluene and DCM were not nearly as effective as the working ones formed in
chloroform. This suggests that solvents with dielectric constants that lie around or between those
of toluene, at 2.38, and DCM, at 8.93, could potentially be the most effective at forming
paclitaxel-specific MIPs. Table 12 shows a few commonly used potential solvents that fall close
to this range that we recommend testing.
Table 12: Dielectric constants of potential solvents for paclitaxel-specific MIPs (Dielectric
Constant, n.d.)
Tetrahydrofuran (THF) 7.58
1,4-Dioxane 2.25
1,2-Dichloroethane 10.36
Song et al. 2009 found 5 mL of THF as solvent was the optimum volume for 130 mg of
the template quercetin in solution. Based on the molecular weights of quercetin and paclitaxel,
130 mg of quercetin is the molar equivalent to 370 mg of paclitaxel. Since our experiments used
only between 5 mg and 20 mg of paclitaxel as template due to working on the small scale, the
optimum amount of solvent should be much lower than 5 mL. Proportionally, 5 mL of solvent
per 370 mg of paclitaxel would be equivalent to 0.068 mL of solvent per 5 mg of paclitaxel and
0.27 mL of solvent per 20 mg of paclitaxel. Therefore, we recommend forming MIPs using a
range between 0.068 mL and 0.27 mL (68 to 270 μL) of solvent to see if an optimum amount can
be determined to form the best paclitaxel-specific MIPs.
5.2.5 Polymerization Method Recommendations
For our experiments, we tested two different types of polymerization: bulk
polymerization and precipitation polymerization. We focused these polymerization methods due
to their relative simplicity, and received some positive results in the MIPs formed from bulk
polymerization. Unfortunately, all of the MIPs formed from precipitation polymerization did not
produce any results. However, precipitation polymerization has produced favorable results in
other experiments, as evidenced by Javanbakht, Mohammadi, Esfandyari-Manesh, and Abdouss
(2010). In the experiments by Javanbakht et al. (2010), precipitation polymerization resulted in
successful MIPs for the drug dipyridamole (DIP). Up to 79% ± 3.1% of DIP in solution rebound
to the MIPs, compared to only 34% ± 2.5% for the control polymers, demonstrating both high
rebinding capacity and selectivity for the template molecule. The full results of the experiments
by Javanbakht et al. (2010) can be seen in Table 13.

38
Table 13: Recovery percentage of DIP from MIPs formed by precipitation polymerization
(Javanbakht et al., 2010)
Since all of our favorable results came from bulk polymerization, we suggest that our
method for bulk polymerization continue to be tested as it currently is. Since no results came
from our precipitation polymerization method, it will need to be adjusted to produce working
MIPs.
Our method for precipitation polymerization was based on the miniemulsion method used
by Ishkuh et al. (2014) that used paclitaxel as template. Their miniemulsion polymerization was
similar to precipitation polymerization except that it required the use of sodium dodecyl sulfate
(SDS) as a surfactant and hexadecane (HD) as a hydrophobic agent. Our precipitation procedure
was simply adjusted to not include SDS or HD as a surfactant or hydrophobic agent. Since this
proved unsuccessful, we recommend basing the precipitation procedure on the one used by
Javanbakht et al. (2010), which successfully produced effective and selective MIPs. This
procedure used many of the same materials used in our experiments, including MAA as the
functional monomer, EGDMA as the cross-linker, and chloroform as the porogenic solvent. The
main difference is the use of dipyridamole as the template rather than paclitaxel. While DIP is
not completely analogous with paclitaxel, they do share a few similar hydrogen bonding sites.
These sites are highlighted by Figure 24.

39
Figure 24: Hydrogen bonding sites of paclitaxel (left) and DIP (right), highlighted in orange
5.3 Conclusion
There were two initial goals for this project. The first goal was to find the conditions that
would produce the most effective paclitaxel-specific MIPs. The second goal was to construct the
most effective MIPs on a larger scale and test the binding capacities of the MIPs in a mixture of
taxanes. While the second goal was not achieved, we were able to produce paclitaxel-specific
MIPs, with the most effective MIP rebinding 70% ± 1% of a 10 mg/L solution of paclitaxel.
Since the best difference of paclitaxel adsorbed between the MIP and control polymer is only
13% ± 4%, the effectiveness of the MIPs has room to improve based on the experimental results
of Ishkuh et al. (2014). With thorough research we proposed guidelines for using different molar
ratios, functional monomers, cross-linkers, solvents, and polymerization methods that we believe
could improve the effectiveness of paclitaxel-specific MIPs. Therefore, we recommend testing
the proposed guidelines to determine if they improve the effectiveness of the MIPs. Provided
improvement occurs, we then suggest attempting to accomplish the second goal of our project:
testing the effectiveness of the MIPs in a mixture of taxanes.
40
References
Analysis of Variance (ANOVA). (n.d.). Retrieved April 14, 2017, from
http://www.statsdirect.com/help/analysis_of_variance/anova.htm
Cheong, W. J., Yang, S. H., & Ali, F. (2013). Molecular imprinted polymers for separation
science: a review of reviews. Journal of separation science, 36(3), 609-628.
Cunha, J. P. (Ed.). (2016, October 12). Common Side Effects of Paclitaxel Tablets (paclitaxel)
Drug Center. Retrieved April 13, 2017, from http://www.rxlist.com/taxol-side-effects-
drug-center.htm
Dielectric Constant. (n.d.). Retrieved April 12, 2017, from
http://macro.lsu.edu/howto/solvents/Dielectric%20Constant%20.htm
Discovery of Camptothecin and Taxol – National Historic Chemical Landmark. (2003, April 23).
Retrieved April 13, 2017, from
https://www.acs.org/content/acs/en/education/whatischemistry/landmarks/camptothecinta
xol.html
Dunn, P. J., Wells, A. S., & Williams, M. T. (2010). Green chemistry in the pharmaceutical
industry. Weinheim: Wiley-VCH.
Fu, X., Yang, Q., Zhou, Q., Lin, Q., & Wang, C. (2015). Template-Monomer Interaction in
Molecular Imprinting: Is the Strongest the Best? Open Journal of Organic Polymer
Materials,05(02), 58-68. Doi:10.4236/ojopm.2015.52007
Ishkuh, F. A., Javanbakht, M., Esfandyari-Manesh, M., Dinarvand, R., & Atyabi, F. (2014).
Synthesis and characterization of paclitaxel-imprinted nanoparticles for recognition and
controlled release of an anticancer drug. Journal of Materials Science,49(18), 6343-6352.
Doi:10.1007/s10853-014-8360-7
Javanbakht, M., Mohammadi, S., Esfandyari-Manesh, M., & Abdouss, M. (2010). Molecularly
imprinted polymer microspheres with nanopore cavities prepared by precipitation
polymerization as new carriers for the sustained release of dipyridamole. Journal of
Applied Polymer Science,119(3), 1586-1593. Doi:10.1002/app.32798
Karim, K., Breton, F., Rouillon, R., Piletska, E., Guerreiro, A., Chianella, I., & Piletsky, S.
(2005). How to find effective functional monomers for effective molecularly imprinted
41
polymers? Advanced Drug Delivery Reviews,57(12), 1795-1808.
Doi:10.1016/j.addr.2005.07.013
Lanza, F., & Sellergren, B. (1999). Method for Synthesis and Screening of Large Groups of
Molecularly Imprinted Polymers. Analytical Chemistry, 71(11), 2092-2096.
Liu, J., Dai, Z., Li, B., Tang, S., & Jin, R. (2014). Utilization of theoretical studies of the
imprinting ratio to guide experimental research into the molecular imprinted polymers
formed using enrofloxacin and methacrylic acid. Journal of Molecular Modeling,20(10).
Doi:10.1007/s00894-014-2456-5
Mayes, A. G., & Mosbach, K. (1996). Molecularly Imprinted Polymer Beads: Suspension
Polymerization Using a Liquid Perfluorocarbon as the Dispersing Phase. Analytical
Chemistry,68(21), 3769-3774. Doi:10.1021/ac960363a
Muhammad, T., Nur, Z., Piletska, E. V., Yimit, O., & Piletsky, S. A. (2012). Rational design of
molecularly imprinted polymer: the choice of cross-linker. The Analyst,137(11), 2623.
Doi:10.1039/c2an35228a
New Cancer Drug Approvals From 2016. (2016, December 26). Retrieved April 13, 2017, from
https://www.cancer.org/latest-news/new-cancer-drug-approvals-from-2016.html
Pearce, E. M. (1992). Principles of polymerization (third edition), by George Odian, Wiley-
Interscience, New York, 1991, 768 pp. price: $59.95. Journal of Polymer Science Part A:
Polymer Chemistry,30(7), 1508-1508. Doi:10.1002/pola.1992.080300734
Pardeshi, S., & Singh, S. K. (2016). Precipitation polymerization: a versatile tool for preparing
molecularly imprinted polymer beads for chromatography applications. RSC Adv.,6(28),
23525-23536. Doi:10.1039/c6ra02784a
Song, X., Wang, J., & Zhu, J. (2009). Effect of porogenic solvent on selective performance of
molecularly imprinted polymer for quercetin. Materials Research, 12(3), 299-304.
Doi:10.1590/s1516-14392009000300009
A Story of Discovery: Natural Compound Helps Treat Breast and Ovarian Cancers. (n.d.).
Retrieved April 13, 2017, from https://www.cancer.gov/research/progress/discovery/taxol
Success Story: Taxol. (n.d.). Retrieved April 13, 2017, from
https://dtp.cancer.gov/timeline/flash/success_stories/S2_taxol.htm
Tamayo, F., Turiel, E., & Martín-Esteban, A. (2007). Molecularly imprinted polymers for solid-

42
phase extraction and solid-phase microextraction: Recent developments and future trends.
Journal of Chromatography A,1152(1-2), 32-40. Doi:10.1016/j.chroma.2006.08.095
Taxol. (n.d.). Retrieved April 13, 2017, from http://chemocare.com/chemotherapy/drug-
info/Taxol.aspx
Team, E. W. (n.d.). ChEBI. Retrieved April 13, 2017, from
http://www.ebi.ac.uk/chebi/searchId.do?chebiId=45863
Tom, L. A., Schneck, N. A., & Walter, C. (2012). Improving the imprinting effect by optimizing
template:monomer:cross-linker ratios in a molecularly imprinted polymer for
sulfadimethoxine. Journal of Chromatography B,909, 61-64.
Doi:10.1016/j.jchromb.2012.10.020
Tsermentseli, S. K., Manesiotis, P., Assimopoulou, A. N., & Papageorgiou, V. P. (2013).
Molecularly imprinted polymers for the isolation of bioactive naphthoquinones from plant
extracts. Journal of Chromatography A,1315, 15-20. Doi:10.1016/j.chroma.2013.09.044
Vasapollo, G., Sole, R. D., Mergola, L., Lazzoi, M. R., Scardino, A., Scorrano, S., & Mele, G.
(2011). Molecularly Imprinted Polymers: Present and Future Prospective. International
Journal of Molecular Sciences, 12(12), 5908-5945. Doi:10.3390/ijms12095908
Whitby, G. S., & Katz, M. (1933). Synthetic Rubber. Industrial & Engineering
Chemistry,25(11), 1204-1211. Doi:10.1021/ie50287a006
Wulff, G. (1995). Molecular Imprinting in Cross-Linked Materials with the Aid of Molecular
Templates— A Way towards Artificial Antibodies. Angewandte Chemie International
Edition in English,34(17), 1812-1832. Doi:10.1002/anie.199518121
Yan, H., & Row, K. H. (2006). Characteristic and Synthetic Approach of Molecularly Imprinted
Polymer. International Journal of Molecular Sciences,7(5), 155-178.
Doi:10.3390/i7050155
Ye, L., Weiss, R., & Mosbach, K. (2000). Synthesis and Characterization of Molecularly
Imprinted Microspheres. Macromolecules,33(22), 8239-8245. Doi:10.1021/ma000825t

43
Appendix A: General Procedure Example
Appendix A.1: Bulk MIP Synthesis, from Tsermentseli et al. (2013)
1 2 3 4
1 1-1
Chloroform: 400
μL with Taxol
1.99 μL MAA
22.09 μL EDMA
2 μL AIBN
1-2
Chloroform: 400
μL with Taxol
1.99 μL MAA
22.09 μL EDMA
2 μL AIBN
1-3
Chloroform: 400
μL
1.99 μL MAA
22.09 μL EDMA
2 μL AIBN
1-4
Chloroform: 400
μL
1.99 μL MAA
22.09 μL EDMA
2 μL AIBN
2 2-1
Chloroform: 400
μL with Taxol
1.99 μL MAA
37.71 μL TRIM
2 μL AIBN
2-2
Chloroform: 400
μL with Taxol
1.99 μL MAA
37.71 μL TRIM
2 μL AIBN
2-3
Chloroform: 400
μL
1.99 μL MAA
37.71 μL TRIM
2 μL AIBN
2-4
Chloroform: 400
μL
1.99 μL MAA
37.71 μL TRIM
2 μL AIBN
1. Measure 40 mg Taxol in an Eppendorf tube (20 mg in two tubes if tubes aren’t big
enough)
2. Label UPLC vials like in chart
3. Pipette 1600 μL of chloroform to Eppendorf tube (800 μL if using two tubes)
4. Vortex Taxol/chloroform mixture in Eppendorf tube
5. Add Taxol/chloroform mixture to MIP vials: 1-1, 1-2, 2-1, 2-2
a. 400 μL in each vial
6. Add pure chloroform to Control Vials: 1-3, 1-4, 2-3, 2-4
a. 400 μL in each vial
7. Pipette monomer to MIP and Control vials
a. Row 1, 1.99 μL of MAA
b. Row 2, 1.99 μL of MAA
8. Pipette cross-linker to MIP and Control vials
a. Row 1, 22.09 μL of EDMA
b. Row 2, 37.71 μL of TRIM
9. Make initiator
a. 10 mg AIBN/100 μL chloroform
10. Add initiator to each
a. 2 μL AIBN/chloroform initiator in every vial
11. Crimp vials
12. Make nitrogen balloons
13. Add balloons and needles to vials for 10 minutes
14. Leave vials in heating block at 70 C for 24 hours

44
Appendix A.2: Precipitation MIP Synthesis, based on miniemulsion from
Ishkuh et al. (2014)
1 2 3 4
4 4-1
Chloroform: 400
μL with Taxol
1.99 μL MAA
22.09 μL
EDMA
0.5 μL AIBN
4-2
Chloroform: 400
μL with Taxol
1.99 μL MAA
22.09 μL EDMA
0.5 μL AIBN
4-3
Chloroform: 400
μL
1.99 μL MAA
22.09 μL EDMA
0.5 μL AIBN
4-4
Chloroform: 400
μL
1.99 μL MAA
22.09 μL EDMA
0.5 μL AIBN
5 5-1
Chloroform: 400
μL with Taxol
1.99 μL MAA
37.71 μL TRIM
0.5 μL AIBN
5-2
Chloroform: 400
μL with Taxol
1.99 μL MAA
37.71 μL TRIM
0.5 μL AIBN
5-3
Chloroform: 400
μL
1.99 μL MAA
37.71 μL TRIM
0.5 μL AIBN
5-4
Chloroform: 400
μL
1.99 μL MAA
37.71 μL TRIM
0.5 μL AIBN
1. Label 8 Eppendorf tubes
2. Set Eppendorf tubes into 2 rows of 4
3. Add cross-linker to each Eppendorf tube
a. 22.09 μL of EDMA to Row 4
b. 37.71 μL of TRIM to Row 5
4. Add functional monomer to each Eppendorf tube
a. 1.99 μL of MAA to Row 4
b. 1.99 μL of MAA to Row 5
5. Measure ~10.0 mg of PTX on 4 plastic dishes and to the 4 MIP Eppendorf tubes, not in
the 4 NIP Eppendorf tubes
6. Vortex Eppendorf tubes to ensure mixing
7. Sonicate Eppendorf tubes for 18 minutes
8. While sonication is occurring, make initiator
a. 10 mg AIBN in 100 μL of chloroform
9. Add 400 μL of chloroform to each Eppendorf tube after sonication
10. Add AIBN/chloroform mixture to each Eppendorf tube
a. 0.5μL to Row 4 (0.5 μL)
b. 0.5 μL to Row 5 (0.5μL)
11. Vortex Eppendorf tubes to ensure mixing
12. Tape tubes to the shakers for 3 hours
13. Label UPLC vials
14. Carefully transfer Eppendorf tube contents to appropriately labeled UPLC vials by
pipetting
45
15. Make nitrogen balloons
16. Purge UPLC vials with nitrogen for 5 minutes
17. Heat at 70 °C for 16 hours

46
Appendix A.3: Template Removal Procedure
1. Turn off heating block
2. Let block cool and then remove vials, keeping them in order
3. Photograph each row for future reference
Preparing Sonicator
4. Clean out inside of the sonicators if necessary
5. Collect ice from ice storage in green ice bucket
6. Fill sonicator approximately halfway with ice
7. Add water until ice begins to float
Preparing Polymers for Initial Solvent Wash
8. Remove MIP and Control polymer blocks from vials by breaking the vials with a hammer
on paper towel (don’t cut yourselves)
9. Add polymers and 1 mL of chloroform to Eppendorf tubes, marked as follows: (Identities
marked in book)
a. Date 1-1
b. Date 1-2
c. Date 1-3
d. Date 1-4
e. Date 2-1
f. Date 2-2
g. Date 2-3
h. Date 2-4
10. Add marked Eppendorf tubes to sonicators for 20 minutes
11. Centrifuge when done
Chromatographic Evaluation for Initial Solvent Wash
12. Remove 10 μL of MIP/solvent and Control/solvent solutions with pipette and add to 990
μL 70/30 H2O/CAN in UPLC vials. Mark vials like the following
a. Date Sol Wash, 1-1
b. Date Sol Wash, 1-2
c. Date Sol Wash, 1-3
d. Date Sol Wash, 1-4
e. Date Sol Wash, 2-1
f. Date Sol Wash, 2-2
g. Date Sol Wash, 2-3
h. Date Sol Wash, 2-4
47
Preparing Polymers for First Methanol Wash
13. Remove solvents from Eppendorf tubes without removing polymers, by carefully
pouring/pipetting into waste beaker in fume hood
14. Add 1 mL 90/10 MeOH/AcOH to the Eppendorf tubes with polymers
15. Add marked Eppendorf tubes to sonicators for 20 minutes
16. Centrifuge when done
Preparing Polymers for Second Methanol Wash
17. Remove MeOH/AcOH from Eppendorf tubes without removing polymers, by carefully
pouring/pipetting into waste beaker in fume hood
18. Add 1 mL 90/10 MeOH/AcOH to the Eppendorf tubes with polymers
19. Add marked Eppendorf tubes to sonicators for 20 minutes
20. Repeat steps 17-19 as necessary
Chromatographic Evaluation for Final Methanol Wash
21. Remove 10 μL of MIP/MeOH/AcOH and Control/MeOH/AcOH solutions with pipette
and add to 990 μL 70/30 H2O/CAN in UPLC vials. Mark vials like the following:
a. Date MeOH Wash, 1-1
b. Date MeOH Wash, 1-2
c. Date MeOH Wash, 1-3
d. Date MeOH Wash, 1-4
e. Date MeOH Wash, 2-1
f. Date MeOH Wash, 2-2
g. Date MeOH Wash, 2-3
h. Date MeOH Wash, 2-4
48
Appendix A.4: Template Rebinding Procedure
1. Add 1 mL of chloroform to the MIPs and controls in Eppendorf tubes
2. Create a 1 mg/mL sample of Taxol and MeOH
a. Weigh out 1 mg of Taxol in an Eppendorf tube
b. Add 1 mL of MeOH to the Eppendorf tube
3. Add 10 μL of Taxol/MeOH solution to each MIP and control in Eppendorf tubes
4. Sonicate mixtures for 20 minutes
5. Remove 500 μL of each MIP and control solution and add to fresh Eppendorf tubes
6. Place tubes in evaporative centrifuge for 30 minutes
7. Add 500 μL of 70/30 H2O/CAN to each Eppendorf tube and sonicate for 6 minutes
8. Transfer entirety of the contents of each Eppendorf tube to UPLC vials and run them on
UPLC

49
Appendix B: Rebinding Data Example
y = 39474x - 8227.4R² = 0.998
0
200000
400000
600000
800000
1000000
1200000
0 5 10 15 20 25 30
Pea
k A
rea
Paclitaxel Concentration (mg/L)
Paclitaxel Concentration Calibration
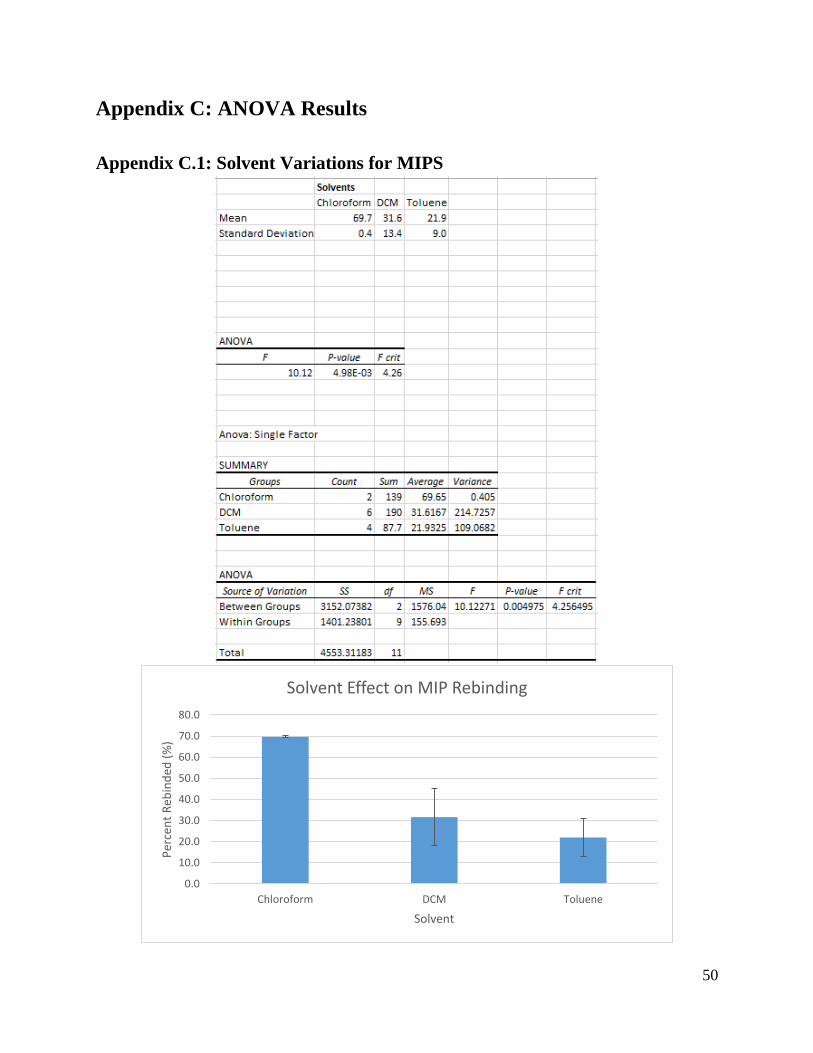
50
Appendix C: ANOVA Results
Appendix C.1: Solvent Variations for MIPS
0.0
10.0
20.0
30.0
40.0
50.0
60.0
70.0
80.0
Chloroform DCM Toluene
Per
cen
t R
ebin
ded
(%
)
Solvent
Solvent Effect on MIP Rebinding

51
Appendix C.2: Solvent Variations for Control Polymers
0.0
10.0
20.0
30.0
40.0
50.0
60.0
Chloroform DCM Toluene
Per
cen
t R
ebin
ded
(%
)
Solvent
Solvent Effect on CTL Rebinding

52
Appendix C.3: Cross-linker Variations for MIPs
0.0
10.0
20.0
30.0
40.0
50.0
60.0
EGDMA TRIM
Per
cen
t R
ebin
ded
(%
)
Cross-linker
Cross-linker Effect on MIP Rebinding

53
Appendix C.4: Cross-linker Variations for Control Polymers
0.0
5.0
10.0
15.0
20.0
25.0
30.0
35.0
40.0
45.0
50.0
EGDMA TRIM
Per
cen
t R
ebin
ded
(%
)
Cross-Linker
Cross-linker Effect on CTL Rebinding

54
Appendix C.5: Molar Ratio Variations for MIPs
0.0
10.0
20.0
30.0
40.0
50.0
60.0
70.0
80.0
1;04;20 0.25;3;8 2;04;20
Per
cen
t R
ebin
ded
(%
)
Molar Ratio
Molar Ratio Effect on MIP Rebinding
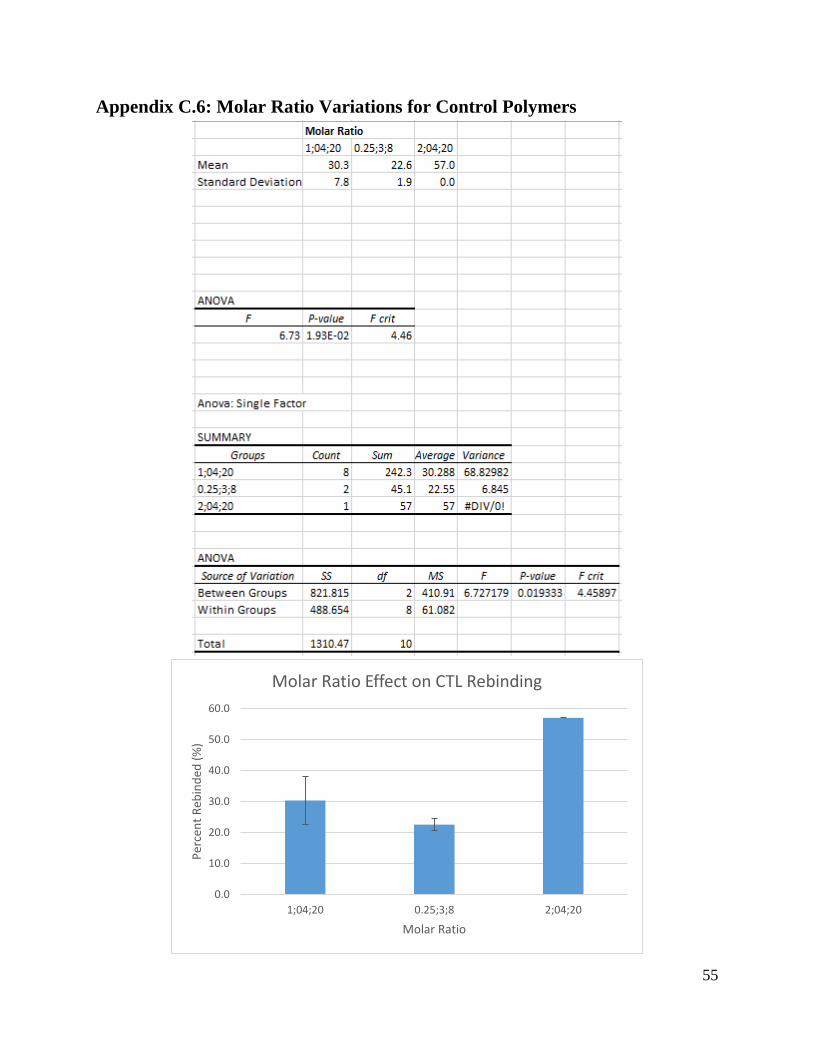
55
Appendix C.6: Molar Ratio Variations for Control Polymers
0.0
10.0
20.0
30.0
40.0
50.0
60.0
1;04;20 0.25;3;8 2;04;20
Per
cen
t R
ebin
ded
(%
)
Molar Ratio
Molar Ratio Effect on CTL Rebinding
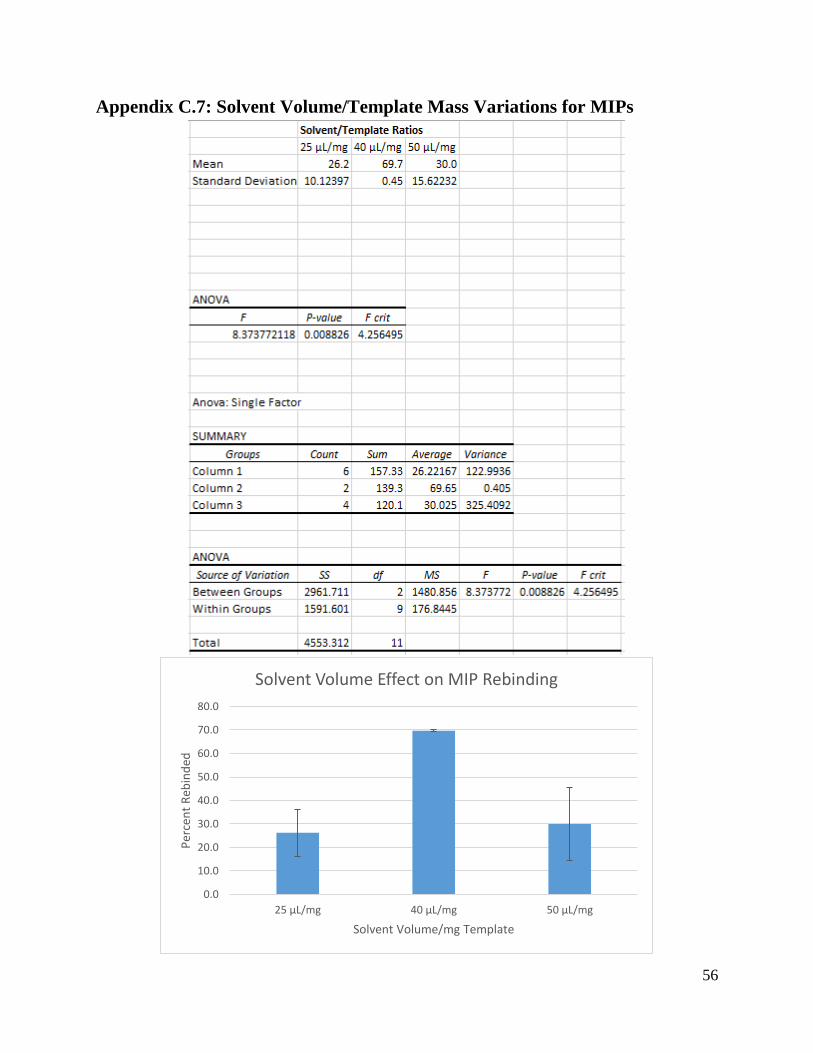
56
Appendix C.7: Solvent Volume/Template Mass Variations for MIPs
0.0
10.0
20.0
30.0
40.0
50.0
60.0
70.0
80.0
25 μL/mg 40 μL/mg 50 μL/mg
Per
cen
t R
ebin
ded
Solvent Volume/mg Template
Solvent Volume Effect on MIP Rebinding
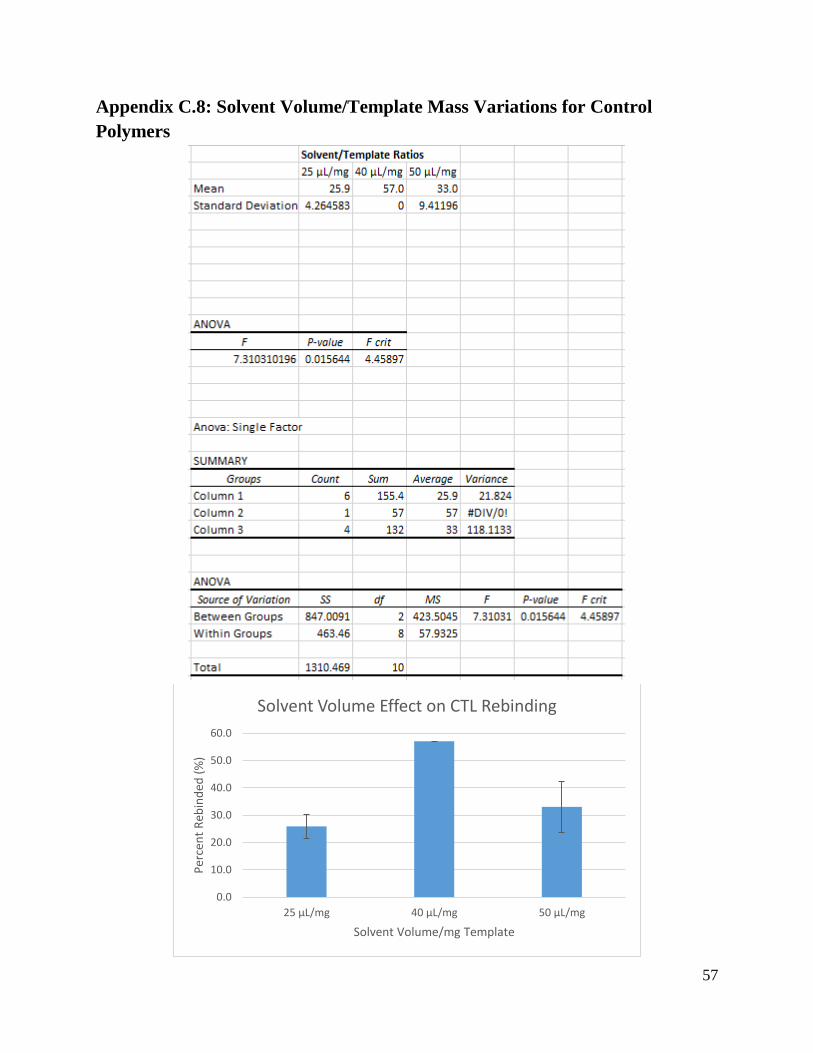
57
Appendix C.8: Solvent Volume/Template Mass Variations for Control
Polymers
0.0
10.0
20.0
30.0
40.0
50.0
60.0
25 μL/mg 40 μL/mg 50 μL/mg
Per
cen
t R
ebin
ded
(%
)
Solvent Volume/mg Template
Solvent Volume Effect on CTL Rebinding

58
Appendix C.9: ANOVA Results Summary

59
Appendix D: Experimentally Varied Components
Molar Ratios Functional Monomers Cross-Linkers Porogenic Solvents
1:4:20 (16 Times) MAA (27 times) EGDMA (21 times) DCM (9 times)
2:4:20 (5 times)
TRIM (6 times) Toluene (6 times)
0.25:3:8 (4 times)
Chloroform (12 times)
1:4:16 (2 times)
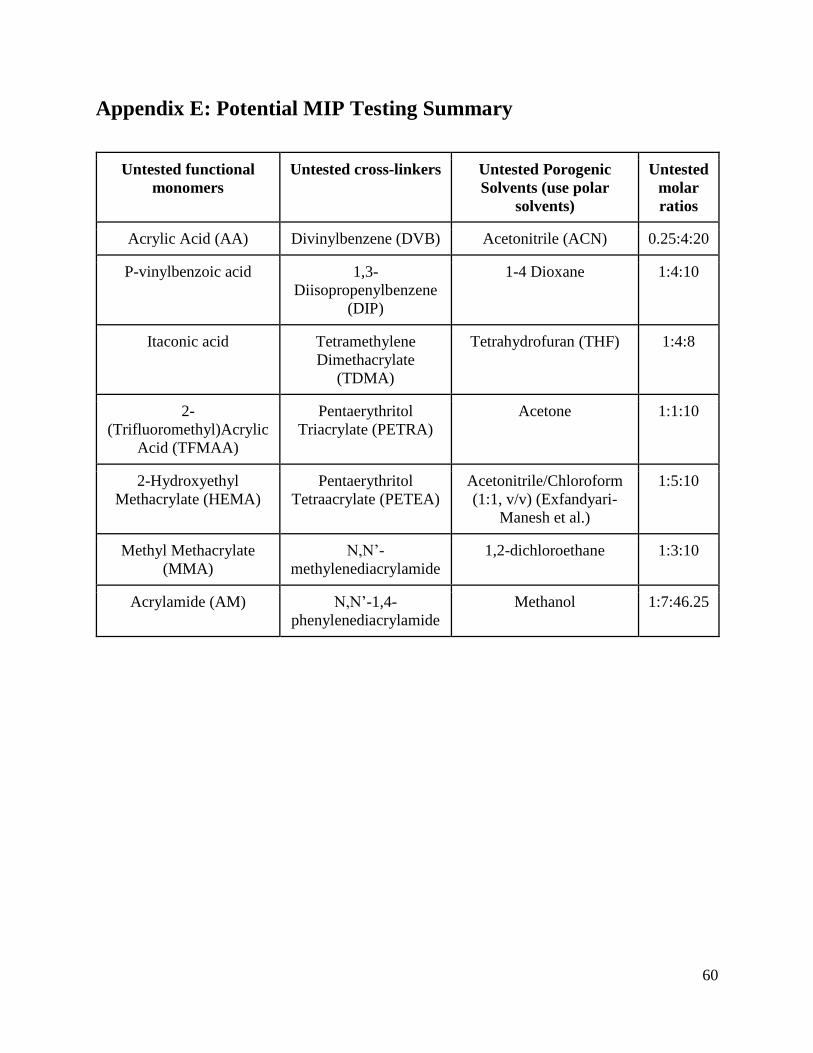
60
Appendix E: Potential MIP Testing Summary
Untested functional
monomers
Untested cross-linkers Untested Porogenic
Solvents (use polar
solvents)
Untested
molar
ratios
Acrylic Acid (AA) Divinylbenzene (DVB) Acetonitrile (ACN) 0.25:4:20
P-vinylbenzoic acid 1,3-
Diisopropenylbenzene
(DIP)
1-4 Dioxane 1:4:10
Itaconic acid Tetramethylene
Dimethacrylate
(TDMA)
Tetrahydrofuran (THF) 1:4:8
2-
(Trifluoromethyl)Acrylic
Acid (TFMAA)
Pentaerythritol
Triacrylate (PETRA)
Acetone 1:1:10
2-Hydroxyethyl
Methacrylate (HEMA)
Pentaerythritol
Tetraacrylate (PETEA)
Acetonitrile/Chloroform
(1:1, v/v) (Exfandyari-
Manesh et al.)
1:5:10
Methyl Methacrylate
(MMA)
N,N’-
methylenediacrylamide
1,2-dichloroethane 1:3:10
Acrylamide (AM) N,N’-1,4-
phenylenediacrylamide
Methanol 1:7:46.25

61
Appendix F: Ishkuh et al. (2014) Miniemulsion MIP Synthesis for
Paclitaxel
1. Mix the functional monomer (MAA or MMA), cross-linker (EGDMA or TRIM), and
hexadecane together (hexadecane removed for our precipitation procedure)
2. Add the template molecule (paclitaxel) to the mixture (do not add to control polymers)
3. Sonicate the mixture for 18 minutes
4. Add solvent (chloroform) to the mixture
5. Add AIBN (0.02 wt% of the total amount of functional monomer and cross-linker) as
initiator
6. Stir the solution for 3 hours
7. Slowly pour the contents into water containing sodium dodecyl sulfate (1 wt%) using a
high-speed homogenizer at 24000 rpm for 5 minutes (this step was skipped for our
precipitation procedure)
8. Purge the contents with nitrogen gas for 5 minutes
9. Heat the contents at 70 oC for 16 hours
10. Separate the formed MIPs and control polymers from reaction medium by centrifugation
for 30 minutes at 17000 rpm
11. Freeze-dry the MIPs and control polymers at -40 oC for 48 hours (replaced this step with
air-drying for 2 hours for our precipitation procedure for time purposes)
12. Remove the template molecule via batch-mode solvent extraction with methanol
containing 10 % acetic acid (v/v) five times, until no template can be detected

62
Appendix G: Javanbakht et al. (2010) Precipitation MIP Synthesis
for Dipyridamole
1. Mix dipyridamole (template, could replace with paclitaxel) and MAA (functional
monomer) in chloroform (solvent) (do not add template to the control polymers)
2. Place the solution in room temperature for 5 hours
3. Add EGDMA (cross-linker) and AIBN (initiator) to the mixture
4. Sonicate the mixture for 5 minutes
5. Purge the mixture with nitrogen gas for 3 minutes in sealed containers
6. Heat the mixture at 60 oC for 22 hours
7. Filter the polymers using a Whatman filter and wash with acetone and methanol
8. Remove the template by washing the polymers with methanol/acetic acid solution (9:1,
v/v) five times, each for 1.5 hours, and then four times in pure water for 1.5 hours