Molecular systematics of Salmonidae: combined nuclear data yields
22
Molecular systematics of Salmonidae: combined nuclear data yields a robust phylogeny Bernard J. Crespi * and Michael J. Fulton Behavioural Ecology Research Group, Department of Biosciences, Simon Fraser University, 8888 University Drive, Burnaby, BC, Canada V5A 1S6 Received 12 May 2003; revised 15 August 2003 Abstract The phylogeny of salmonid fishes has been the focus of intensive study for many years, but some of the most important rela- tionships within this group remain unclear. We used 269 Genbank sequences of mitochondrial DNA (from 16 genes) and nuclear DNA (from nine genes) to infer phylogenies for 30 species of salmonids. We used maximum parsimony and maximum likelihood to analyze each gene separately, the mtDNA data combined, the nuclear data combined, and all of the data together. The phylogeny with the best overall resolution and support from bootstrapping and Bayesian analyses was inferred from the combined nuclear DNA data set, for which the different genes reinforced and complemented one another to a considerable degree. Addition of the mitochondrial DNA degraded the phylogenetic signal, apparently as a result of saturation, hybridization, selection, or some combination of these processes. By the nuclear-DNA phylogeny: (1) (Hucho hucho, Brachymystax lenok) form the sister group to (Salmo, Salvelinus, Oncorhynchus, H. perryi); (2) Salmo is the sister-group to (Oncorhynchus, Salvelinus); (3) Salvelinus is the sister- group to Oncorhynchus; and (4) Oncorhynchus masou forms a monophyletic group with O. mykiss and O. clarki, with these three taxa constituting the sister-group to the five other Oncorhynchus species. Species-level relationships within Oncorhynchus and Salvelinus were well supported by bootstrap levels and Bayesian analyses. These findings have important implications for under- standing the evolution of behavior, ecology and life-history in Salmonidae. Ó 2003 Published by Elsevier Inc. Keywords: Salmonidae; Phylogeny; Total evidence; Anadromy 1. Introduction The family Salmonidae comprises three subfamilies, Coregoninae (whitefish and ciscoes), Thymallinae (grayling), and Salmoninae (char, trout, and salmon). The most speciose of these, Salmoninae, includes five genera distributed throughout the Northern Hemi- sphere, Brachymystax (lenok), Hucho (huchen and tai- men), Oncorhynchus (Pacific trout and salmon), Salmo (Atlantic salmon and brown trout), and Salvelinus (char) (Hart, 1973; Hendry and Stearns, 2003; Scott and Crossman, 1973). Salmonid fishes have long been of great interest due to the commercial and recreational value of some species, and they are becoming increas- ingly important as model systems for addressing a wide range of evolutionary and ecological questions (Elliot, 1994; Groot and Margolis, 1991; Hendry and Stearns, 2003). Inference of a robust phylogeny for this group is important for comparative analyses of salmonid adap- tations (e.g., Crespi and Teo, 2002; Fleming, 1998), comparative genomics (e.g., Woram et al., 2003), studies involving inference of ancestral states (e.g., McDowall, 1997; McLennan, 1994; Stearley, 1992), and evaluation of conservation priorities (Crandall et al., 2000). Despite the importance of salmonids to humans, and to terrestrial and marine ecosystems, their evolutionary history has remained a matter of considerable dispute for many years (e.g., Domanico et al., 1997; McKay et al., 1996; McPhail, 1997; Norden, 1961; Oakley and Phillips, 1999; Phillips and Oakley, 1997; Phillips and Pleyte, 1991; Regan, 1914; Utter et al., 1973; Utter and Allendorf, 1994). Previous species-level and genus-level phylogenetic research on salmonid fishes have provided insights into some relationships, but numerous ques- tions remain, most notably the among-genus diver- * Corresponding author. Fax: +604-291-3496. E-mail address: [email protected] (B.J. Crespi). 1055-7903/$ - see front matter Ó 2003 Published by Elsevier Inc. doi:10.1016/j.ympev.2003.08.012 Molecular Phylogenetics and Evolution xxx (2003) xxx–xxx MOLECULAR PHYLOGENETICS AND EVOLUTION www.elsevier.com/locate/ympev ARTICLE IN PRESS
Transcript of Molecular systematics of Salmonidae: combined nuclear data yields

MOLECULARPHYLOGENETICSAND
ARTICLE IN PRESS
Molecular Phylogenetics and Evolution xxx (2003) xxx–xxx
EVOLUTION
www.elsevier.com/locate/ympev
Molecular systematics of Salmonidae: combined nuclear data yieldsa robust phylogeny
Bernard J. Crespi* and Michael J. Fulton
Behavioural Ecology Research Group, Department of Biosciences, Simon Fraser University, 8888 University Drive, Burnaby, BC, Canada V5A 1S6
Received 12 May 2003; revised 15 August 2003
Abstract
The phylogeny of salmonid fishes has been the focus of intensive study for many years, but some of the most important rela-
tionships within this group remain unclear. We used 269 Genbank sequences of mitochondrial DNA (from 16 genes) and nuclear
DNA (from nine genes) to infer phylogenies for 30 species of salmonids. We used maximum parsimony and maximum likelihood to
analyze each gene separately, the mtDNA data combined, the nuclear data combined, and all of the data together. The phylogeny
with the best overall resolution and support from bootstrapping and Bayesian analyses was inferred from the combined nuclear
DNA data set, for which the different genes reinforced and complemented one another to a considerable degree. Addition of the
mitochondrial DNA degraded the phylogenetic signal, apparently as a result of saturation, hybridization, selection, or some
combination of these processes. By the nuclear-DNA phylogeny: (1) (Hucho hucho, Brachymystax lenok) form the sister group to
(Salmo, Salvelinus, Oncorhynchus, H. perryi); (2) Salmo is the sister-group to (Oncorhynchus, Salvelinus); (3) Salvelinus is the sister-
group to Oncorhynchus; and (4) Oncorhynchus masou forms a monophyletic group with O. mykiss and O. clarki, with these three
taxa constituting the sister-group to the five other Oncorhynchus species. Species-level relationships within Oncorhynchus and
Salvelinus were well supported by bootstrap levels and Bayesian analyses. These findings have important implications for under-
standing the evolution of behavior, ecology and life-history in Salmonidae.
� 2003 Published by Elsevier Inc.
Keywords: Salmonidae; Phylogeny; Total evidence; Anadromy
1. Introduction
The family Salmonidae comprises three subfamilies,
Coregoninae (whitefish and ciscoes), Thymallinae
(grayling), and Salmoninae (char, trout, and salmon).
The most speciose of these, Salmoninae, includes five
genera distributed throughout the Northern Hemi-
sphere, Brachymystax (lenok), Hucho (huchen and tai-men), Oncorhynchus (Pacific trout and salmon), Salmo
(Atlantic salmon and brown trout), and Salvelinus
(char) (Hart, 1973; Hendry and Stearns, 2003; Scott and
Crossman, 1973). Salmonid fishes have long been of
great interest due to the commercial and recreational
value of some species, and they are becoming increas-
ingly important as model systems for addressing a wide
range of evolutionary and ecological questions (Elliot,
* Corresponding author. Fax: +604-291-3496.
E-mail address: [email protected] (B.J. Crespi).
1055-7903/$ - see front matter � 2003 Published by Elsevier Inc.
doi:10.1016/j.ympev.2003.08.012
1994; Groot and Margolis, 1991; Hendry and Stearns,
2003). Inference of a robust phylogeny for this group is
important for comparative analyses of salmonid adap-
tations (e.g., Crespi and Teo, 2002; Fleming, 1998),
comparative genomics (e.g., Woram et al., 2003), studies
involving inference of ancestral states (e.g., McDowall,
1997; McLennan, 1994; Stearley, 1992), and evaluation
of conservation priorities (Crandall et al., 2000).Despite the importance of salmonids to humans, and
to terrestrial and marine ecosystems, their evolutionary
history has remained a matter of considerable dispute
for many years (e.g., Domanico et al., 1997; McKay et
al., 1996; McPhail, 1997; Norden, 1961; Oakley and
Phillips, 1999; Phillips and Oakley, 1997; Phillips and
Pleyte, 1991; Regan, 1914; Utter et al., 1973; Utter and
Allendorf, 1994). Previous species-level and genus-levelphylogenetic research on salmonid fishes have provided
insights into some relationships, but numerous ques-
tions remain, most notably the among-genus diver-

2 B.J. Crespi, M.J. Fulton / Molecular Phylogenetics and Evolution xxx (2003) xxx–xxx
ARTICLE IN PRESS
gences, and species-level relationships within On-
corhynchus and Salvelinus.
The lack of a comprehensive, well-resolved and well-
supported phylogeny for Salmonidae can be largely at-
tributed to previous studies using relatively small subsets
of extant salmonid diversity, and only one or at most
several genes or other character sets (e.g., morphology
or karyology). To overcome these limitations, we have
assembled and analyzed all available DNA-sequencedata for the species in this family. The main goals of our
study are twofold: (1) to use these data to infer the best
tree for the family as a whole, and for particular lin-
eages; and (2) to assess what additional data (i.e., se-
quence from which genes) are needed to achieve a
species-level tree for the entire group.
2. Methods
2.1. Data set
We compiled all of the available sequence data for
salmonid fishes and one outgroup (Plecoglossus altivelis)
(Salmoniformes: Osmeridae), which comprised 269 se-
quences of mitochondrial DNA (from 16 genes) andnuclear DNA (from 9 genes) for 31 species (Table 1).
The bulk of these data were from Genbank, with several
additional sequences graciously provided to us by T.
Oakley and R. Phillips. Some species for which very
little data were available (e.g., only one or several genes)
were not included. However, some species with sub-
stantial amounts of missing data were included, as in-
clusion of such taxa has been shown to increasephylogenetic accuracy and is not expected to produce
misleading results (Wiens and Reeder, 1995; Wiens,
1998a). Complete mitochondrial DNAs were available
for C. lavaretus, O. mykiss, O. tshawytscha, P. altivelis,
S. salar, Sv. alpinus, and Sv. fontinalis. The MHC genes
used were chosen randomly, one for each species, from
the larger sample of alleles in Genbank.
The sequences were aligned gene by gene usingClustal X (Thompson et al., 1997) and by eye, and
regions with ambiguous alignments (e.g., parts of the
DLOOP) were excluded. The full data set had 27,593
base pairs, and it is available as a NEXUS file from
BC.
2.2. Phylogenetic analyses
We used maximum parsimony and maximum like-
lihood in PAUP (Swofford, 2002) and Bayesian anal-
ysis in MrBayes (http://brahms.biology.rochester.edu/
software.html) (Alfaro et al., 2003; Hall, 2001; Huel-
senbeck et al., 2001; Rannala and Yang, 1996; Yang
and Rannala, 1997) for our analyses. We analyzed each
gene separately (for genes with at least 13 taxa repre-
sented, and for vitellogenin and MHC), the full mito-chondrial data set, the full nuclear-gene data set, and
all of the data combined. For most of the analyses of
mitochondrial data, P. altivelis was used as the out-
group. However, because data from this species were
not available for nuclear genes, C. lavaretus, B. lenok,
or H. perryi were also used as outgroups, depending on
which was available and closest to the ingroup based
on previous studies. MrMODELTEST (http://www.ebc.uu.se/systzoo/staff/nylander.html) was used to
choose the most appropriate models of molecular
evolution for the likelihood analyses of each separate
gene, and for the combined data sets (Posada and
Crandall, 1998, 2001; Sullivan and Swofford, 2001). To
assess the robustness of the inferred trees, we used
bootstrapping with 500 replicates under maximum
parsimony and bootstrapping with 200 replicates formaximum likelihood. Maximum likelihood bootstrap-
ping was not computationally feasible for the com-
bined data sets. For the Bayesian analyses, we used at
least 5000 trees after stabilization of the likelihoods to
compute the a posteriori probabilities, which can be
interpreted as the probabilities that particular clades
are correct. These probabilities tend to be less conser-
vative than maximum-likelihood bootstrap values(Alfaro et al., 2003; Douady et al., 2003). Although
they tend to identify more correct monophyletic groups
than do parsimony or likelihood bootstrapping in
simulations, Bayesian support values may also over-
estimate the degree of clade support, especially for
lineages descending from short internodes (Alfaro et
al., 2003; Douady et al., 2003).
We have taken a �conditional combination� ap-proach (Bull et al., 1993; De Queiroz et al., 1995;
Huelsenbeck et al., 1996) to analyze data derived from
multiple genes and loci. This approach involves an
assessment of congruence, using various means, prior
to a decision to combine data sets or analyze them
separately. We follow this approach for two reasons.
First, some genes or loci may produce inconguent and
incorrect results, due to such processes as samplingerror, hybridization, natural selection, rate variation
among lineages, variation in base composition, or a
high degree of saturation (Sanderson and Schaffer,
2002; Slowinksi and Page, 1999). Second, given only
minor effects from such processes in a combined data
set, a total evidence analysis should yield the best re-
sults, because different genes should provide resolution
and support in different regions of the tree (Bull et al.,1993; Huelsenbeck et al., 1996).
Our analysis of congruence was constrained by the
variable sets of taxa for which data were available for
each gene, which precluded direct comparisons of genes
on a pairwise basis with ML tests (e.g., Huelsenbeck and
Bull, 1996) or other methods (see Barker and Lutzoni,
2002). As a result, we evaluated the degree of congru-

Table 1
Genbank sequences used in the analyses
DLOOP 12S 16S ND1 ND2 CO1
B. lenok AF125519 AF125513 AF125513
C. artedi AF246932 AF246933
C. autumnalis AJ250996
C. clupeaformis AF239253
C. kiyi U95191
C. lavaretus AB034824 AB034824 AB034824 AB034824 AB034824 AB034824
H. hucho
H. perryi
O. clarki AF254863 AF296347 AF254865
O. gorbuscha AF296345
O. keta AB039901 AF113119 AF296344
O. kisutch AF318037 AF296342
O. masou AF429780 AF113117 AF125510
O. mykiss L29771 L29771 L29771 L29771 L29771 L29771
O. nerka U59926 AF296343
O. rhodurus
O. tshawytscha AF392054 AF392054 AF392054 AF392054 AF392054 AF392054
P. altivelis AB047553 AB047553 AB047553 AB047553 AB047553 AB047553
P. coulteri AY008713
P. williamsoni AY008696
S. orhidana
S. salar AF133701 AF133701 AF133701 AF133701 AF133701 AF133701
S. trutta U62286 AF117718 M64917
Sv. alpinus AF154851 AF154851 AF154851 AF154851 AF154851 AF154851
Sv. confluentus AF126004
Sv. fontinalis AF154850 AF154850 AF154850 AF154850 AF154850 AF154850
Sv. leucomaenis AF297988 AF060445
Sv. malma AF298043
Sv. namaycush AF297989
T. arcticus AF329990 AF076906 AF076908
T. thymallus AF329989 AF036381 AF036381
CO2 Atp8 Atp6 CO3 ND3 ND4L
B. lenok
C. artedi AF246934
C. autumnalis
C. clupeaformis AJ133367
C. kiyi
C. lavaretus AB034824 AB034824 AB034824 AB034824 AB034824 AB034824
H. hucho
H. perryi
O. clarki AF294830 AF312575
O. gorbuscha AF294831 AF055090
O. keta D84147 D84147 AF055089 D84147
O. kisutch AF294829 AF055092
O. masou D63336 D63336 U28364 D63336
O. mykiss L29771 L29771 L29771 L29771 L29771 L29771
O. nerka AF294832 AF055091
O. rhodurus U28363
O. tshawytscha AF392054 AF392054 AF392054 AF392054 AF392054 AF392054
P. altivelis AB047553 AB047553 AB047553 AB047553 AB047553 AB047553
P. coulteri
P. williamsoni AJ133369
S. orhidana
S. salar AF133701 AF133701 AF133701 AF133701 AF133701 AF133701
S. trutta X76247 U61181
Sv. alpinus AF154851 AF154851 AF154851 AF154851 AF154851 AF154851
Sv. confluentus
Sv. fontinalis AF154850 AF154850 AF154850 AF154850 AF154850 AF154850
Sv. leucomaenis
Sv. malma
Sv. namaycush U61182
B.J. Crespi, M.J. Fulton / Molecular Phylogenetics and Evolution xxx (2003) xxx–xxx 3
ARTICLE IN PRESS

Table 1 (continued)
CO2 Atp8 Atp6 CO3 ND3 ND4L
T. arcticus
T. thymallus
ND4 ND5 ND6 Cyt b GH1c GH2c
B. lenok AF125052 AF125213 AF005919 AF005917
C. artedi
C. autumnalis AJ251592
C. clupeaformis
C. kiyi
C. lavaretus AB034824 AB034824 AB034824 AB034824 AB001865
H. hucho AF172397 AF005907
H. perryi D58396 AF005920 AF005908
O. clarki AY032633 AY032633 AY032633 AF005924 AF005913
O. gorbuscha U66039 U66039 AF165077 AF005926 AF075572
O. keta AF125051 AF165078 AF005927 L04688
O. kisutch AF165079 AF005925 U04931
O. masou AF125050 D58403
O. mykiss L29771 L29771 L29771 L29771 AF005923 J03797
O. nerka AJ314568 U14551 U14535
O. rhodurus
O. tshawytscha AF392054 AF392054 AF392054 AF392054 Oakley AF005914
P. altivelis AB047553 AB047553 AB047553 AB047553
P. coulteri AY008700
P. williamsoni AY008701
S. orhidana AF202033 AF005915
S. salar AF133701 AF133701 AF133701 AF133701 Oakley M21573
S. trutta X77526 AF005912
Sv. alpinus AF154851 AF154851 AF154851 AF154851 AF005921 AF005909
Sv. confluentus AF005911
Sv. fontinalis AF154850 AF154850 AF154850 AF154850
Sv. leucomaenis D58397
Sv. malma
Sv. namaycush AF005922 AF005910
T. arcticus AF319544 Oakley
T. thymallus AF270858 AF270689
GH2d ITS1 ITS2 18s GH1d VIT MHC
B. lenok AF243426
C. artedi
C. autumnalis
C. clupeaformis
C. kiyi
C. lavaretus AB001865 AF454745
H. hucho
H. perryi M94900 AF174612
O. clarki
O. gorbuscha AF170535 AF170539 U34717
O. keta L04688 Oakley AF170538 U34703
O. kisutch Oakley AF170540 AF030250 AF454747 U34692
O. masou AF170536 AF170542 AF243427 U34697
O. mykiss J03797 AF170533 AF170543 AF243428 AJ011689 U34715
O. nerka U14535 Oakley AF170537 U14551 U34711
O. rhodurus
O. tshawytscha AF170534 AF170541 AF454748 U34719
P. altivelis
P. coulteri AY008709
P. williamsoni AY008695
S. orhidana AF201313
S. salar M21573 AF201312 AJ427629 Phillips X70166
S. trutta AF072862 X98839 Phillips AF454750
Sv. alpinus AF059899 AF174609 AF469620 Phillips AF454751
Sv. confluentus M94902 AF174613 Phillips
Sv. fontinalis M94903 AF174611 Phillips AF454752
4 B.J. Crespi, M.J. Fulton / Molecular Phylogenetics and Evolution xxx (2003) xxx–xxx
ARTICLE IN PRESS

Table 1 (continued)
CO2 Atp8 Atp6 CO3 ND3 ND4L
Sv. leucomaenis M94904 AF174607 Phillips
Sv. malma M94905 AF174608 Phillips
Sv. namaycush M94906 AF174610 Phillips
T. arcticus
T. thymallus AF454753
Fig. 1. Bootstrap majority-rule phylogenies inferred from individual-gene DNA data sets. MP¼maximum parsimony, ML¼maximum likelihood,
BAY¼Bayesian analysis. GH¼ growth hormone, ITS¼ internal transcribed spacer, VIT¼ vitellogenin, MHC¼major histocompatibility complex.
ML bootstraps were not computationally feasible for the DLOOP data set.
B.J. Crespi, M.J. Fulton / Molecular Phylogenetics and Evolution xxx (2003) xxx–xxx 5
ARTICLE IN PRESS

Fig. 1. (continued)
6 B.J. Crespi, M.J. Fulton / Molecular Phylogenetics and Evolution xxx (2003) xxx–xxx
ARTICLE IN PRESS
ence between the results from analyses of separate genesvia inspection of bootstrap or a posteriori probability
values, to determine how many different genes and loci
supported a given monophyletic group and to what
extent, and to identify any strongly supported nodes
that differed among genes (De Queiroz et al., 1995).
Given potential incongruence in one or more parts of
a phylogeny, we agree with Wiens (1998b) that com-
bining data may still represent the best strategy for in-ferring the most-accurate tree, subject to the caveat that
the gene or genes involved in possible incongruenceshould be considered questionable and may require re-
moval from a combined analysis. In addition to ana-
lyzing each gene separately, we also compared the
degrees of resolution and support obtained from anal-
yses of the combined mitochondrial data set, the com-
bined nuclear data set, the combined nuclear data set
without the MHC data (since salmonid MHC is known
to be under strong balancing selection, Miller andWithler, 1996), all of the data except MHC, and all of

Fig. 1. continued)
B.J. Crespi, M.J. Fulton / Molecular Phylogenetics and Evolution xxx (2003) xxx–xxx 7
ARTICLE IN PRESS
the data combined. Cunningham (1997) has shown that
congruence and phylogenetic accuracy tend to be posi-
tively correlated, such that strongly supported com-
bined-data trees are likely to reflect congruence among
trees from the individual data sets. Finally, alternative a
priori hypotheses for the placement of particular species
and sets of species were also evaluated using the SH test(Shimodaira and Hasegawa, 1999) and the Templeton
test (Templeton, 1983), implemented in PAUP* as de-
scribed below.
3. Results
3.1. Phylogenetic analyses of individual and combined
data
Bootstrap majority-rule consensus trees from analy-
ses using maximum parsimony and maximum likeli-hood, and a posteriori clade support values from
Bayesian analysis, are shown in Fig. 1 for each of the
individual genes, and Fig. 2 shows maximum-parsimony
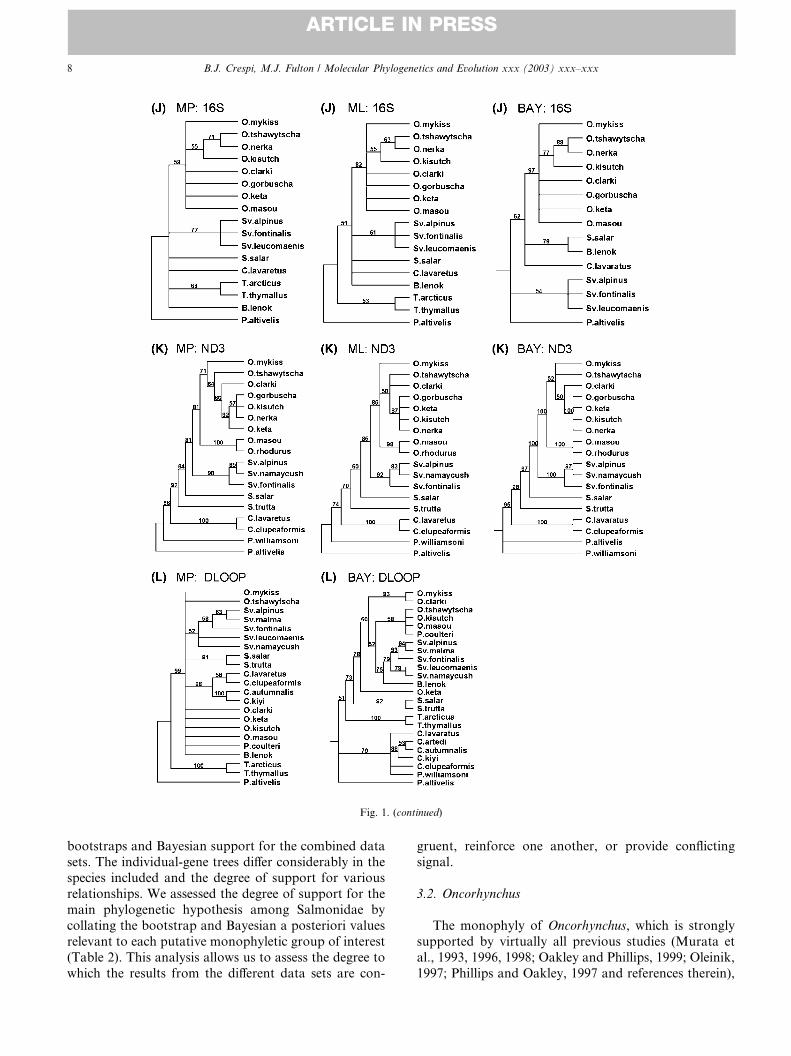
Fig. 1. (continued)
8 B.J. Crespi, M.J. Fulton / Molecular Phylogenetics and Evolution xxx (2003) xxx–xxx
ARTICLE IN PRESS
bootstraps and Bayesian support for the combined data
sets. The individual-gene trees differ considerably in thespecies included and the degree of support for various
relationships. We assessed the degree of support for the
main phylogenetic hypothesis among Salmonidae by
collating the bootstrap and Bayesian a posteriori values
relevant to each putative monophyletic group of interest
(Table 2). This analysis allows us to assess the degree to
which the results from the different data sets are con-
gruent, reinforce one another, or provide conflicting
signal.
3.2. Oncorhynchus
The monophyly of Oncorhynchus, which is strongly
supported by virtually all previous studies (Murata et
al., 1993, 1996, 1998; Oakley and Phillips, 1999; Oleinik,
1997; Phillips and Oakley, 1997 and references therein),

Fig. 2. Bootstrap majority-rule and Bayesian phylogenies for the combined data sets: (A) all mtDNA, (B) all nuclear DNA excluding MHC, (C) all
nuclear DNA, (D) all nuclear DNA and mtDNA excluding MHC, (E) all data.
B.J. Crespi, M.J. Fulton / Molecular Phylogenetics and Evolution xxx (2003) xxx–xxx 9
ARTICLE IN PRESS
was also supported in our analyses by all of the indi-
vidual genes and by the combined data sets (Table 2).
However, the strength of support varied considerably
across data sets, with the nuclear genes tending to pro-
vide higher bootstrap and Bayesian a posteriori values
than the mitochondrial genes, and the combined
mtDNA data set (Fig. 2A) returning the weakest sup-
port.The monophyly of Oncorhynchus excluding O. clarki,
O. masou, and O. mykiss was strongly supported here by
GH1C and by the combined nuclear DNA. By contrast,
this group was not supported by analyses of ITS1, CO3,
ND3, and GH2C, the other genes that provided any
degree of bootstrap majority-rule resolution for this
clade. However, the monophyly of this group was not
strongly contradicted by these analyses, as the relevant
bootstrap values were low. The reduced support for
this clade, compared to the genus as a whole, is due
primarily to the presence of O. mykiss, O. clarki or
O. masou among the other Oncorhynchus in some of the
trees.The clades (O. nerka, O. gorbuscha, O. keta) and
(O. gorbuscha, O. keta) have been inferred in most
previous studies of Oncorhynchus (Domanico and Phil-
lips, 1995; Kitano et al., 1997; McKay et al., 1996;
Murata et al., 1993, 1996, 1998; Oakley and Phillips,

Table 2
Bootstrap values from maximum likelihood (200 replicates, in plain text) or Bayesian analyses (majority-rule of at least 5000 trees, in italics), and
maximum parsimony (500 replicates, in parentheses) analyses, for relevant clades in Figs. 1 and 2
All Oncorhynchus (Pacific salmon and Pacific trout)
(O. tshawytscha, O. kisutch, O. nerka, O. gorbuscha, O. keta, O. mykiss, O. clarki, O. masou)
GH1C 100 100 (100)
ITS1 100 100 (100)
ITS2 100 100 (100)
GH2C 96 100 (93)
CYTB 70 93 (98)
CO3 71 84 (96)
ND3 86 52 (81)
16S 82 97 (59)
MHC (62)
All mt DNA 76 (61)
All nuclear DNA (excl. MHC) 100 (100)
All nuclear DNA 100 (99)
All nuclear DNA (excl. MHC) + mtDNA 100 (100)
All nuclear + mt DNA 100 (100)
Pacific salmon excluding O. masou
(O. tshawytscha, O. kisutch, O. nerka, O. gorbuscha, O. keta)
GH1C 98 100 (98)
ITS2 55
GH2C Not monophyletic 54 93 (66)
CO3 Not monophyletic 60 99
ITS1 Not monophyletic 73 95 (56)
CYTB Not monophyletic 79
ND3 Not monophyletic 100
All nuclear DNA (excl. MHC) 100 (94)
All nuclear DNA 100 (92)
All nuclear DNA (excl. MHC) + mtDNA Not monophyletic (includes O. masou, 99)
(O. nerka, O. gorbuscha, O. keta)
GH1C 100 100 (100)
GH2C 98 100 (93)
MHC 69 99 (74)
ITS2 62 86 (75)
CYTB 72
ITS1 65 84 includes O. kisutch
ND3 87 100 (92) includes O. kisutch
CO3 Not monophyletic 60 99 (monophyletic, 56)
16S Not monophyletic O. nerka with O. tshawytscha, O. kisutch 55,63 77,88 (55,71)
All mt DNA 92 (85)
All nuclear DNA (excl. MHC) 100 (100)
All nuclear DNA 100 (100)
All nuclear DNA (excl. MHC) + mtDNA 100 (100)
All nuclear + mt DNA 100 (100)
(O. gorbuscha, O. keta)
CYTB 94 98 (99)
ITS2 69 91
GH1C 58 95 (69)
GH2C 54 53
MHC 52 86
ITS1 50 (51)
ND3 (Not monophyletic O. gorbuscha with O. nerka, O. kisutch: 57)
CO3 Not monophyletic 60 99 (monophyletic, 66)
All mt DNA 97 (94)
All nuclear DNA (excl. MHC) 100 (92)
All nuclear DNA 100 (90)
All nuclear DNA (excl. MHC) + mtDNA 100 (100)
All nuclear + mt DNA 100 (100)
(O. tshawytscha, O. kisutch)
MHC 100 100 (99)
VIT 99 100 (99)
10 B.J. Crespi, M.J. Fulton / Molecular Phylogenetics and Evolution xxx (2003) xxx–xxx
ARTICLE IN PRESS

Table 2 (continued)
ITS2 90 100 (88)
CYTB 91 99 (95)
GH1C 62 85 (73)
CO3 Not monophyletic 60 99
16S Not monophyletic, includes O. nerka: 55,63 77,88 (55,71)
ITS1 Not monophyletic 73 95 (56)
GH2C Not monophyletic 78 100 (76)
ND3 Not monophyletic 87 100 (92)
All mt DNA Not monophyletic 88 (75)
All nuclear DNA (excl. MHC) 100 (72)
All nuclear DNA 100 (99)
All nuclear DNA (excl. MHC) + mtDNA Not monophyletic 100 (90)
All nuclear + mt DNA 100 (59)
Pacific trout and O. masou
(O. mykiss, O. masou)
ITS2 76 80 (90)
CO3 78
ITS1 54 76 (56, includes O. tshawytscha)
ND3 Not monophyletic 52
MHC Not monophyletic 81 95 (62)
DLOOP Not monophyletic 83
CYTB Not monophyletic 98
All mt DNA Not monophyletic 98 (90) (O. mykiss with O. clarki)
All nuclear DNA Not monophyletic 100 (O. mykiss with O. clarki)
All nuclear DNA (excl. MHC) + mtDNA Not monophyletic 100 (100) (O. mykiss with O. clarki)
All nuclear + mtDNA Not monophyletic 100 (100) (O. mykiss with O. clarki)
(O. mykiss, O. clarki)
GH1C 100 100 (100)
CYTB 84 98 (95)
GH2C 84 100 (87)
DLOOP 83
ND3 Not monophyletic 50 50
CO3 Not monophyletic 60 99
All mt DNA 98 (90)
All nuclear DNA (excl. MHC) + mtDNA 100 (100)
All nuclear DNA 100
All nuclear + mt DNA 100 (100)
(O. mykiss, O. clarki, O. masou)
ND3 O. masou as sister-taxon to all other Oncorhynchus; Not monophyletic 52
CO3 Not monophyletic 60 99
ML, MP: O. masou basal but unresolved in Oncorhynchus
CYTB ML, MP: O. masou basal but unresolved in Oncorhynchus
Not monophyletic 79
ND3 Not monophyletic 50; O. masou basal in Oncorhynchus; (MP: O. masou sister to
other Oncorhynchus, 71)
All nuclear DNA (excl. MHC) 100 (95)
All nuclear DNA 100 (79)
All nuclear DNA (excl. MHC) + mtDNA Not monophyletic 99 (71), O. masou with O. tshawytscha
All nuclear + mt DNA 96, Not monophyletic (51), O. masou basal in Pacific salmon
Salvelinus
(Sv. alpinus, Sv. malma, Sv. confluentus, Sv. leucomaenis, Sv. fontinalis, Sv. namaycush)
GH1C 100 100 (100)
ITS1 100 100 (100)
ITS2 100 100 (100)
GH2C 92 100 (94)
GH2D 57 69 (55)
All nuclear DNA (excl. MHC) 100 (100)
All nuclear DNA 100 (100)
All nuclear DNA (excl. MHC) + mtDNA 100 (100)
All nuclear + mt DNA 100 (100)
B.J. Crespi, M.J. Fulton / Molecular Phylogenetics and Evolution xxx (2003) xxx–xxx 11
ARTICLE IN PRESS

Table 2 (continued)
(Sv. alpinus, Sv. malma, Sv. confluentus, Sv. leucomaenis)
ITS2 91 99 (97)
ITS1 59 84 (54)
GH1C Not monophyletic 50 (monophyletic: 52)
GH2D Not monophyletic 68 79 (62)
GH2C Not monophyletic 76 100 (82)
All mtDNA Not monophyletic 87 (75)
All nuclear DNA (excl. MHC) 99 (75)
All nuclear DNA 100 (73)
All nuclear DNA (excl. MHC) + mtDNA 99
All nuclear + mt DNA Not monophyletic 51 (50)
(Sv. alpinus, Sv. malma)
ITS1 96 100 (99)
GH2C 87 100 (94)
GH2D 88 92 (79)
DLOOP (63)
GH1C 52
ITS2 Not monophyletic 96 100 (96)
All mt DNA 87 (52)
All nuclear DNA (excl. MHC) 100 (100)
All nuclear DNA 100 (100)
All nuclear DNA (excl. MHC) + mtDNA 100 (100)
All nuclear + mt DNA 100 (100)
(Sv. confluentus, Sv. leucomaenis)
ITS1 98 100 (96)
GH1C 58 97 (71)
GH2C 60 82 (55)
ITS2 Not monophyletic 96 100 (97)
GH2D Not monophyletic 68 79 (62)
All mt DNA Not monophyletic 87 (75)
All nuclear DNA (excl. MHC) 100 (72)
All nuclear DNA 100 (73)
All nuclear DNA (excl. MHC) + mtDNA 100 (74)
All nuclear + mt DNA 100 (73)
(Sv. fontinalis, Sv. namaycush)
ITS2 100 100 (100)
GH1C 66 86 (52)
ITS1 (52)
GH2D Not monophyletic 68 79 (62)
GH2C Not monophyletic 76 100 (82)
ND3 Not monophyletic 83 (89)
All mtDNA Not monophyletic 87
All nuclear DNA (excl. MHC) 100 (98)
All nuclear DNA 100 (99)
All nuclear DNA (excl. MHC) + mtDNA 100 (75)
All nuclear + mt DNA 100 (77)
Sister-group to Oncorhynchus
(Oncorhynchus, Salvelinus)
GH1C 100 100 (100)
VIT 81 100 (92)
ND3 85 100 (81)
DLOOP 78 (includes P. coulteri, B. lenok, Oncorhynchus paraphyletic)
CO3 51 54 (67)
CYTB 58 (53) (Salvelinus lineage includes Hucho and B. lenok)
All nuclear DNA (excl. MHC) 100 (94)
All nuclear DNA 100 (93)
All nuclear DNA (excl. MHC) + mtDNA 64, Salvelinus includes Hucho and B. lenok (61)
All nuclear + mt DNA 91 (57)
(Oncorhynchus, Salmo)
ITS1 96 100 (96)
Results from genes for which relationships remain unresolved in the 50% majority-rule consensus trees are not shown. For clades that are not
monophyletic, the highest bootstrap or a posteriori Bayesian value supporting the lack of monophyly is listed. Genes are listed from top to bottom in
order of the degree to which they tend to support (top) or contradict (bottom) the presence of the monophyletic group shown.
12 B.J. Crespi, M.J. Fulton / Molecular Phylogenetics and Evolution xxx (2003) xxx–xxx
ARTICLE IN PRESS
B.J. Crespi, M.J. Fulton / Molecular Phylogenetics and Evolution xxx (2003) xxx–xxx 13
ARTICLE IN PRESS
1999; Oohara et al., 1997, 1999; Osinov, 1999; Phillipsand Oakley, 1997; Shedlock et al., 1992 and references
therein) and have yet to be strongly contradicted. In our
analyses, we found support for (O. nerka, O. gorbuscha,
O. keta) from the nuclear genes GH1C, GH2C, MHC,
and ITS2, as well as from each of the combined data
sets. The results that were incongruent with (O. nerka,
O. gorbuscha, O. keta) tended to involve relatively low
bootstrap and Bayesian values, excepting those fromND3 and GH2D. The group (O. gorbuscha, O. keta) was
accorded bootstrap and Bayesian support from CYTB,
ITS2, GH1C, GH2C, ITS1, and MHC though most of
these support values were rather low. However, the
contradictory results from ND3 and CO3 were weak,
and the combined data sets provided very strong sup-
port for this clade.
The sister-taxon status of O. tshawytscha with O.
kisutch is supported by considerable previous phyloge-
netic work, and has yet to be contradicted strongly (Du
et al., 1993; Kitano et al., 1997; McKay et al., 1996;
Murata et al., 1993, 1996, 1998; Oakley and Phillips,
1999; Oohara et al., 1997, 1999; Osinov, 1999; Phillips
and Oakley, 1997 and references therein). This clade was
supported in our analyses by MHC, VIT, ITS2, CYTB,
GH1C, the combined nuclear data sets, and the com-plete data set. By contrast, analyses of CO3, 16S, ITS1,
GH2C, ND3, the mtDNA data, and the complete data
set without MHC, yielded results contradictory to the
presence of this clade. However, the bootstrap and
Bayesian values for these genes tended to be relatively
low compared to the clade support values from the
genes that supported it. Moreover, the phylogenetic
positions of these two species were inconsistent acrossCO3, 16S, ITS1, GH2C, and ND3 (Fig. 1), such that
there was no evidence for one or more specific alterna-
tive placements. Considered together, these results are
consistent with the sister-taxon status of O. tshawytscha
Table 3
Results from Templeton and SH tests that in each case compare the best (unco
tree vs. best tree showing O. masou not with O. mykiss and O. clarki, (b
Oncorhynchus, (c) best unconstrained tree vs. best tree where O. kisutch and
Constraint
(a) Not (O.
O. mykiss, O
Data set
Nuclear data without MHC MP 1703 vs. 170
P ¼ 0:058
ML 22712.21 vs
P ¼ 0:030
All nuclear data MP 1911 vs. 191
P > 0:40
ML 25687.05 vs
P ¼ 0:087
For Templeton tests (MP), tree lengths are shown, and for SH tests (M
excluded due to apparent long-branch attraction into Oncorhynchus in the
constraint tree ‘‘Not (Oncorhynchus, Salvelinus)’’.
and O. kisutch, although support for this grouping is notentirely unambiguous.
The phylogenetic placement of O. masou, in relation
to the other Oncorhynchus, has not received strong
support from previous analyses (e.g., Kitano et al., 1997;
McKay et al., 1996; Murata et al., 1996; Oleinik, 2000;
Oohara et al., 1997, 1999). To elucidate the relationships
of O. mykiss, O. clarki and O. masou among themselves
and to the other Oncorhynchus, we jointly evaluated thedegrees of support for the clades (O. mykiss, O. clarki),
(O. mykiss, O. masou), and (O. mykiss, O. clarki, O.
masou) (Table 2). The sister-taxon relationship of O.
mykiss with O. clarki was clearly upheld by the analyses
of GH1C, CYTB, GH2C, the mtDNA data, and the full
combined data set, and it was relatively weakly incon-
gruent with results from ND3 and CO3. In addition, a
relationship of O. mykiss with O. masou was inferredfrom ITS2 and (marginally) from ITS1. Considering
all three species together, we note that by most single-
gene analyses, O. masou appears relatively basal in
Oncorhynchus but its position is unresolved, as are the
positions of O. mykiss, O. clarki, or both in the analyses
of CO3, 16S, and ND3. A basal but weakly resolved
position for O. masou is also apparent in analyses of the
combined mtDNA data (Fig. 2A), the full data set withMHC excluded (Fig. 2D), and the the full data set
(Fig. 2E) using maximum parsimony.
The clearest results for the position of O. masou come
from analyses of the nuclear DNA data set, with or
without MHC (Fig. 2B and C). These analyses provided
strong bootstrap support, Bayesian support, or both for
the monophyly of (O. mykiss, O. clarki, O. masou). The
Bayesian analyses also strongly supported sister-taxonstatus of O. mykiss and O. clarki. These results indicate
that the various individual genes provide no support
or weak to moderate support for the clade (O. masou,
(O. mykiss, O. clarki)), and that no evidence strongly
nstrained) tree to an alternative, constraint tree: (a) best unconstrained
) best unconstrained tree vs. best tree with Salmo as sister-group to
O. tshawytscha are not sister-taxa
masou,
. clarki)
(b) (Salmo,
Oncorhynchus)
(c) Not (O. kisutch,
O. tshawytscha)
9 1703 vs. 1718 1700 vs. 1702
P ¼ 0:022 P > 0:40
. 22729.14 22712.21 vs. 22733.51 22712.21 vs. 22718.89
P ¼ 0:046 P > 0:10
4 1911 vs. 1926 1908 vs. 1919
P ¼ 0:022 P ¼ 0:012
. 25696.96 25687.05 vs. 25708.15 25687.05 vs. 25717.39
P ¼ 0:050 P ¼ 0:018
L), likelihoods are shown. For the MP analysis of (c), H. hucho was
constraint tree. Qualitatively similar results were obtained using the

14 B.J. Crespi, M.J. Fulton / Molecular Phylogenetics and Evolution xxx (2003) xxx–xxx
ARTICLE IN PRESS
contradicts these relationships. However, taken to-gether, the nuclear ones reinforce and complement one
another sufficiently to provide strong evidence that O.
masou belongs with the Pacific trout.
3.3. Salvelinus
The monophyly of Salvelinus was supported by all of
the genes for which data on this genus was available,though support from GH2D, and from the combined
mitochondrial DNA data set, was relatively weak (Table
2). Some of the relationships within Salvelinus were
reasonably clear, but for others different genes yielded
incongruent results. Thus, the monophyly of (Sv. alpi-
nus, Sv. malma, Sv. confluentus, Sv. leucomaenis) was
supported strongly by ITS2, moderately supported by
the complete nuclear DNA data set, and weakly sup-ported by ITS1 and GH1C. However, the differing re-
sults from analyses of GH2D and GH2C, the combined
mtDNA data set, and the full data set, preclude unam-
biguous interpretation of this result. Similarly, the
groups (Sv. alpinus, Sv. malma), (Sv. confluentus, Sv.
leucomaenis), and (Sv. fontinalis, Sv. namaycush) were
each upheld, often with high bootstrap and Bayesian
support values, for one or more genes, but analyses ofone or more other genes yielded notably incongruent
results. For each of these cases, the combined data sets,
especially the nuclear data, lent strong or moderate
support to the group, but this support tended to stem
from only one or two genes that may or may not be
indicating the correct phylogeny.
The simplest interpretation of these heterogeneous
results is that one or more of the genes does not reflectthe species tree for Salvelinus. In particular, the data
from ITS2 disrupts the monophyly of both (Sv. alpinus,
Sv. malma) and (Sv. confluentus, Sv. leucomaenis), be-
cause it strongly groups Sv. confluentus with Sv. alpinus
and Sv. malma, and the data from GH2C, GH2D, and
ND3 prevents (Sv. alpinus, Sv. malma, Sv. confluentus,
Sv. leucomaenis) and (Sv. fontinalis, Sv. namaycush)
from each being monophyletic, because they positionSv. namaycush strongly with Sv. alpinus and Sv. malma.
As discussed below, these findings are consistent with
the hypothesis that extensive hybridization has obfus-
cated relationships among species of Salvelinus as in-
ferred from DNA-sequence data.
3.4. Relationship of Oncorhynchus to Salvelinus and
Salmo
A sister-taxon relationship between Oncorhynchus
and Salvelinus is strongly supported by GH1C, VIT,
ND3, and the combined nuclear data sets, and weakly
supported by CO3 and CYTB (Table 2). By contrast,
the ITS1 data groups Oncorhynchus and Salmo
with such a high degree of confidence that is it clearly
incongruent with the results from these other data sets.This analysis of ITS1 appears problematic, however,
because our analyses of other genes have shown that
H. perryi may not be an appropriate outgroup for an
analysis of intergeneric relationships between On-
corhynchus, Salmo, and Salvelinus. CYTB groups
H. perryi with Salvelinus with 57% bootstrap confidence
in the parsimony analysis, and GH1C and the complete
nuclear DNA data set group H. perryi with Salmo, with90–92% and 66% confidence respectively. Thus, given
that H. perryi may belong in the ingroup, the analysis of
ITS1 cannot be used to address relationships between
Oncorhynchus, Salmo, and Salvelinus. The fish species
that are closest to this set of taxa, but definitely not in
the ingroup, are Cichlidae, which are highly divergent
in ITS1 (i.e., on the order of 50% or more divergent in
nucleotide sequence). Use of Neochromis nigricans
(Genbank U67338) as an outgroup, aligned to the taxa
in the ITS1 data set using Clustal X, yielded a phylogeny
with Oncorhynchus and Salmo as sister-taxa but with
only 58% bootstrap support from maximum parsimony
analysis (500 replicates).
3.5. Statistical tests of alternative hypotheses
We used SH tests and Templeton tests to evaluate
alternative hypotheses for three important questions in
salmonid phylogenetics: (1) the phylogenetic position of
O. masou, (2) the sister-group to Oncorhynchus, and (3)
the monophyly of (O. tshawytscha, O. kisutch) (Table 3).
These tests used the two combined nuclear-gene data
sets, which, as described below, provide what we believe
is the best estimate of salmonid phylogeny.The monophyly of (O. masou, O. mykiss, O. clarki)
was statistically supported by the SH test of the nuclear
data without MHC, and support was marginally non-
significant (0:05 < P < 0:10) for the Templeton test of
this data set and the SH test of the full nuclear data set
(Table 3). These results are consistent with erosion of
bootstrap and Bayesian support for (O. masou, O. my-
kiss, O. clarki) with the addition of the MHC data(Fig. 2).
A sister-taxon relationship between Oncorhynchus
and Salmo was statistically rejected at the 0.05 level by
all four of the analyses (Table 3). These results concur
with the strong bootstrap and Bayesian values for
(Oncorhynchus, Salvelinus) shown in Fig. 2, and they
show that the apparently incongruent results from ITS1
do not substantially disrupt the monophyly of these twogenera.
The relationship (O. tshawytscha, O. kisutch) was
statistically supported by both the SH test and the
Templeton test using the full nuclear data set (Table 3).
By contrast, the SH test on the data set excluding MHC
gave a result that was non-significant (P ¼ 0:14), and the
Templeton test result provided no support for the

B.J. Crespi, M.J. Fulton / Molecular Phylogenetics and Evolution xxx (2003) xxx–xxx 15
ARTICLE IN PRESS
monophyly of this pair of species. Overall, these findingsare consistent with the moderate (72%) maximum-par-
simony bootstrap support for (O. tshawytscha, O. kis-
utch) in the nuclear data set excluding MHC (Fig. 2D),
the strong Bayesian support for this group in this data
set, and the 100% bootstrap and Bayesian support for
this group from the combined nuclear data set (Fig. 2C).
4. Discussion
This is the first study of salmonid phylogenetics that
uses virtually all of the DNA sequence data currently
available. Our analyses of the data from each gene
separately, followed by combined analyses of the mi-
tochondrial data, the nuclear data, and the full com-
bined data set, showed that the mitochondrial datayielded levels of resolution and support that were
substantially lower than the nuclear data, and that the
nuclear data showed higher levels of resolution and
support than did the nuclear and mitochondrial data
combined (Fig. 2). These findings indicate that al-
though some of the individual mitochondrial genes
provide good evidence for some salmonid relationships
(Table 2), the mitochondrial data taken together re-duced the strength of the phylogenetic signal. The high
noise to signal ratio of the mitochondrial data is
probably due to saturation, effects of hybridization,
selection (Bernatchez et al., 1995; Wilson and Bernat-
chez, 1998) or some combination of these processes,
and it was not alleviated by removal of third-codon
positions for protein-coding genes (results not shown).
Such a lack of clear, strong signal in mitochondrialdata has probably been responsible for much of the
ongoing uncertainty regarding the molecular phyloge-
netics of Salmonidae.
In the combined nuclear DNA data sets, the different
genes reinforced and complemented one another to a
considerable degree, yielding generally well-resolved and
well-supported trees (Fig. 2B and C). These trees agree
with the results of most previous studies, but also help toresolve some long-standing uncertainties regarding the
placement of O. masou, the phylogeny of the Pacific
salmon, relationships within Salvelinus, and the sister-
taxon to Oncorhynchus.
4.1. Oncorhynchus masou
By our combined nuclear phylogenies, Oncorhynchus
masou forms a monophyletic group with O. mykiss and
O. clarki, and these three taxa comprise the sister-group
to the five other Oncorhynchus species. This result ap-
pears to provide a striking case of data from different
genes complementing and reinforcing one another.
Thus, none of the genes analyzed separately provides
information on the monophyly of this group of three
species, but GH1C, GH2C, ITS1, ITS2, and CYTB eachsupported the monophyly of (O. mykiss, O. clarki) or
(O. mykiss, O. masou). Taken together, the nuclear
DNA indicated good support for this clade from max-
imum-parsimony bootstraps (95% without the MHC
data, and 79% with MHC) and Bayesian support values
(100% for other data sets). Moreover, the Bayesian
analysis of the full nuclear data set also provided 100%
support for (O. mykiss, O. clarki), which is consistentwith numerous previous studies (e.g., Kitano et al.,
1997; McKay et al., 1996; Oakley and Phillips, 1999;
Oleinik, 1997; Oohara et al., 1997, 1999; Phillips and
R�aab, 2001). Results of the SH and Templeton tests
(Table 3) are also consistent with the group (O. masou,
O. mykiss, O. clarki), although only the SH test on the
data set excluding the questionable MHC data achieved
statistical significance.Previous studies have generally considered O. masou
to be basal within the Pacific salmon or within On-
corhynchus as a whole (Kitano et al., 1997; McKay et al.,
1996; Murata et al., 1996; Oohara et al., 1997, 1999; see
also Oleinik, 2000). Our findings provide the first firm
evidence for its phylogenetic position within the clade of
Pacific trout. This inference is consistent with diverse
additional forms of evidence from allozymes, morphol-ogy, behavior, biogeography, and life history (Table 4),
and it should motivate more-detailed evaluation of the
evolution of phenotypic traits within this lineage.
4.2. Pacific salmon
Our analyses provide a fully resolved and well-sup-
ported multi-gene phylogeny for Oncorhynchus exclud-ing O. masou, O. mykiss, and O. clarki. The
relationships among O. tshawytscha, O. kisutch, O.
nerka, O. gorbuscha, and O. keta shown in Fig. 2B and C
have been believed for some time from a variety of
morphological, genetic, and other data (Domanico and
Phillips, 1995; Domanico et al., 1997; Kitano et al.,
1997; McKay et al., 1996; Murata et al., 1993, 1996,
1998; Oakley and Phillips, 1999; Oleinik, 1997; Ooharaet al., 1997, 1999; Osinov, 1999; Phillips and Oakley,
1997; Phillips and Pleyte, 1991; Shed�ko et al., 1996;
Shedlock et al., 1992; Smith and Stearley, 1989; Taka-
saki et al., 1994; Thomas and Beckenbach, 1989; Tho-
mas et al., 1986; Utter et al., 1973; Utter and Allendorf,
1994). However, previous analyses have lacked unam-
biguous or strong support for at least one of the nodes,
usually many more.We suspect that the prior lack of conclusive results
for the phylogeny of Pacific salmon has been due to a
combination of saturation of mitochondrial DNA (e.g.,
McKay et al., 1996), such that it provides little evi-
dence for more-basal nodes, possible selection on
mtDNA (e.g., Bernatchez et al., 1995; Wilson and
Bernatchez, 1998), and potential hybridization of O.

Table 4
Evidence from previous studies that (O. masou, O. mykiss, O. clarki) represents a monophyletic group
Evidence References
(1) Chromosome number of O. masou (2n ¼ 66) is most similar to that of O. mykiss
(58–64) and O. clarki (64–68)
Phillips and R�aab (2001)
(2) O. masou similar to O. mykiss in muscle proteins and to O. mykiss and
O. clarki in allozymes
Tsuyuki and Roberts (1966), Utter et al. (1973)
(3) O. masou is �most troutlike� of Oncorhynchus in morphology and behavior Neave (1958), Yoshiyasu (1973),
Stearley (1992)
(4) Some O. masou males and females are iteroparous Tanaka (1965), Tsuyuki and Roberts (1966),
Kato (1991), Healey et al. (2001)
(5) Male O. masou interbreed best with female O. mykiss, compared to crosses
with other salmonids (i.e., low levels of post-zygotic isolation in laboratory studies)
Chevassus (1979)
(6) O. mykiss, O. clarki, and O. masou have similar life histories, with freshwater
residence times 1–2+ years, freshwater populations common
Rounesfell (1958), Willson (1997)
(7) O. masou feed and mature during freshwater spawning migration, like
O. mykiss and O. clarki but unlike other Pacific salmon
Miller and Brannon (1981),
Groot and Margolis (1991)
(8) Distribution of O. masou is precisely parapatric to that of O. mykiss,
with line of demarkation near Amur River, Sea of Othotsk
Lee et al. (1980), Kato (1991)
16 B.J. Crespi, M.J. Fulton / Molecular Phylogenetics and Evolution xxx (2003) xxx–xxx
ARTICLE IN PRESS
tshawytscha or O. kisutch with one or more of the
other three species. Indeed, O. tshawytscha and O.
kisutch show a curious tendency to group with O. keta,
O. gorbuscha, and O. nerka in analyses of the GH2C,16S, and ND3 data sets. Given that the fertility of
some of the crosses between (O. tshawytscha or O.
kisutch) and (O. keta, O. gorbuscha, or O. nerka) is
currently high (Chevassus, 1979), it should have been
even higher in the past, and hybridization events could
have led to the moderate degree of discordance be-
tween gene trees observed here (see also Rosenfield et
al., 2000). Regardless of such apparent incongruities,the clade (O. tshawytscha, O. kisutch) is strongly sup-
ported (99–100% bootstrap or Bayesian support values)
by all of the analyses of the full nuclear data set, by the
Bayesian analysis of the nuclear data set with MHC
excluded, and by the SH and Templeton tests for the
full nuclear data set.
Table 5
Summary of evidence from previous studies for a sister-taxon relationship
corhynchus)
Evidence
(1) Vitellogenin gene organization groups Oncorhynchus and Salvelinus to
(2) Microsatellite gene structure groups Oncorhynchus and Salvelinus toge
(3) The number of chromosome arms in the karyotype is the same (100) i
Salvelinus, O. masou, and the Pacific salmon; inferred to have changed to
branch leading to (O. mykiss, O. clarki).
(4) Some Salvelinus, O. mykiss, O. clarki, and O. masou have similar life hist
freshwater residence times 1–2+ years, freshwater populations common
(5) Some morphological traits that link Salmo and Oncorhynchus are relat
size and breeding competition, and thus may be convergent
(6) Oncorynchus and Salvelinus have diversified mainly in the Pacific and
respectively, whereas Salmo is in the Palearctic and Atlantic
(7) Oncorhynchus and Salvelinus both diversified over the same general tim
(roughly 6–15 mya), from fossil and molecular-clock evidence
(8) Independent evolution of highly developed anadromy inOncorhynchus
in different ocean basins is not unexpected on ecological grounds
4.3. Salvelinus
Our combined nuclear DNA data sets provide a well-
resolved and generally well-supported phylogeny forwithin the genus Salvelinus. This phylogeny is generally
concordant with the results of most previous molecular-
genetic studies (reviewed in Phillips and Oakley, 1997;
Westrich et al., 2002), and also helps in diagnosing some
incongruent findings from single-gene studies. A close
relationship between Sv. alpinus and Sv. malma is well
supported by morphology (Behnke, 1984; Cavender,
1980), karyotypes (Cavender, 1984; Phillips et al., 1989),allozymes (Crane et al., 1994), and all studies using
DNA sequence. Sv. confluentus and Sv. leucomaenis are
also usually grouped together by morphology and allo-
zymes (Table 6). However, Sv. confluentus groups
strongly with Sv. alpinus and Sv. malma by analyses of
mtDNA restriction sites, ND3, ITS2, and satellite DNA
between Oncorhynchus and Salvelinus (rather than Salmo and On-
References
gether Buisine et al. (2002)
ther Angers and Bernatchez (1997)
n basal
104 in
Phillips and R�aab (2001)
ories, with Kato (1991), Groot and Margolis (1991),
Stearley (1992), Willson (1997)
ed to large Stearley and Smith (1993) (as reinterpreted here)
Nearctic Angers and Bernatchez (1997)
e period Cavender and Miller (1972), Cavender (1980),
Smith et al. (1982), Shedlock et al. (1992),
McKay et al. (1996), Oohara et al. (1997)
and Salmo Northcote (1978), Stearley (1992),
Hansen and Quinn (1998)

Table 6
Evidence from sources other than DNA sequence for relationships among species of Salvelinus, compared to total evidence nuclear-DNA tree in-
ferred here
Evidence and reference Phylogeny
Morphology (Behnke, 1984) fontinalis, namaycush, ((confluentus, leucomaenis), (alpinus, malma))
Morphology (Stearley, 1992) ((leucomaenis, fontinalis, (confluentus, namaycush)), (alpinus, malma)
Morphology and karyology (Cavender and Kimura, 1989) (fontinalis, namaycush), ((confluentus, leucomaenis), (alpinus, malma))
Satellite DNA (Hartley and Davidson, 1994) leucomaenis, (fontinalis, (namaycush, (alpinus, malma, confluentus)))
Allozymes (Crane et al., 1994) fontinalis, (namaycush, ((confluentus, leucomaenis), (alpinus, malma)))
Karyology (Phillips et al., 1989, 2002) fontinalis, namaycush, ((confluentus, leucomaenis), (alpinus, malma))
This study (Fig. 2B and C) (fontinalis, namaycush), ((confluentus, leucomaenis), (alpinus, malma))
Our nuclear DNA trees were compatible with the results of Phillips et al. (1989, 2002), and identical to the results of Cavender and Kimura (1989).
B.J. Crespi, M.J. Fulton / Molecular Phylogenetics and Evolution xxx (2003) xxx–xxx 17
ARTICLE IN PRESS
(Grewe et al., 1990; Hartley and Davidson, 1994; Phil-
lips et al., 1994, 1995), but it groups with Sv. leucomaenis
by analysis of ITS1 and allozymes (Crane et al., 1994;
Phillips et al., 1994). Sv. fontinalis, Sv. namaycush, andSv. leucomaenis have the same chromosome number,
which appears to be primitive within the genus (Phillips
et al., 1994); in Sv. fontinalis and Sv. namaycush this
karyotype comprises 104 chromosome arms, while Sv.
leucomaenis and Sv. confluentus have 100 arms and Sv.
malma and Sv. alpina have 98. Sv. fontinalis and Sv.
namaycush are basal to the other four species in most
previous DNA studies (and allozymes: Crane et al.,1994), though they form strongly supported sister taxa
only by the ITS1 analysis of Pleyte et al. (1992). Taken
together, DNA-sequence studies of relationships within
Salvelinus have yielded strikingly incongruent results,
especially with regard to the positions of Sv. confluentus,
Sv. fontinalis, and Sv. namaycush.
The discordance among phylogenetic studies of
Salvelinus appears to be the result of hybridization(Phillips et al., 1994, 1995; Westrich et al., 2002). The
main evidence for this hypothesis comes from the many
examples of ancient and current hybridization between
Salvelinus species. Ancient introgression of mtDNA has
been demonstrated for Sv. alpinus and Sv. fontinalis
(Bernatchez et al., 1995; Gl�eemet et al., 1998), and for Sv.
alpinus and Sv. namaycush (Wilson and Bernatchez,
1998), and ongoing hybridization and introgressionhave been reported for Sv. alpinus and Sv. namaycush
(Wilson and Hebert, 1993), Sv. malma and Sv. conflu-
entus (Baxter et al., 1997), and Sv. confluentus and Sv.
fontinalis (Kanda et al., 2002; Redenbach and Taylor,
2002; Spruell et al., 2001). Moreover, most laboratory
crosses between Sv. alpinus, Sv. malma, Sv. fontinalis,
and Sv. namaycush and other Salvelinus result in fertile
offspring (Chevassus, 1979). The extent of hybridizationin Salvelinus appears to be higher than within On-
corhynchus (e.g., Allendorf and Leary, 1988; Campton
and Utter, 1985; Chevassus, 1979; Dangel et al., 1973;
Smith, 1992; Taylor, 2003), though it may be compa-
rable to levels in the coregonids (Ferguson et al., 1978).
Introgression of mtDNA in Salvelinus may also in some
cases be driven by selection (Bernatchez et al., 1995;
Wilson and Bernatchez, 1998), which would tend to
amplify its effects.
Substantial levels of hybridization throughout the
evolutionary history of a group make phylogenetic in-ference problematic (Arnold, 1992). Indeed, given ex-
tensive ongoing hybridization, even the geographic
location of Salvelinus samples used for DNA sequencing
could substantially affect the inferences. Our combined
nuclear data phylogenies, especially those inferred from
Bayesian analyses, provide very good resolution and
support overall. However, support for the grouping of
(Sv. alpinus, Sv. malma, Sv. confluentus, Sv. leucomaenis)appears to derive predominantly from a single gene
(ITS2). Similar considerations apply to the support for
(Sv. confluentus, Sv. leucomaenis), mainly from ITS1, and
(Sv. fontinalis, Sv. namaycush), with support mainly from
ITS2. Indeed, when the ITS1 and ITS2 data are excluded,
the only group within Salvelinus that is accorded maxi-
mum-parsimony bootstrap support over 70% is (Sv. al-
pinus, Sv. malma) (93%). We believe that the best strategyin such cases is the gathering ofDNA-sequence data from
as many independently evolving nuclear DNA loci as
possible, as well as liberal use of other types of character,
such as genome structure, karyotypes and allozymes.
Taken together, previous phylogenetic inferences from
the use of morphology, allozymes and karyological
characters (Table 6) are consistent with our phylogeny,
although levels of support for the topologies from suchsources of data are difficult to ascertain. Given this con-
cordance among diverse data types, we believe that our
DNA phylogeny of Salvelinus (Fig. 2B and C) is very
likely to be correct. However, additional data from nu-
clear genes are needed to rigorously test this hypothesis.
4.4. Sister-group to Oncorhynchus
The sister-group to Oncorhynchus has long been be-
lieved to be Salmo (e.g., Murata et al., 1996; Phillips and
Oakley, 1997; Phillips and Pleyte, 1991; Stearley and
Smith, 1993), although analysis of data from the GH1C
gene by Oakley and Phillips (1999) provided evidence
that Salmo and Oncorhynchus are not sister taxa.
Our analyses concur with this result of Oakley and

18 B.J. Crespi, M.J. Fulton / Molecular Phylogenetics and Evolution xxx (2003) xxx–xxx
ARTICLE IN PRESS
Phillips, and show that a sister-taxon relationship be-tween Oncorhynchus and Salvelinus is well supported by
data from three genes (GH1C, VIT, and ND3), by the
combined data sets that exclude mitochondrial DNA,
and by SH and Templeton tests using these combined
data sets. Evidence for a sister-taxon relationship be-
tween Oncorhynchus and Salvelinus also comes from
data on gene organization, karyology, life history,
morphology, biogeography, and ecology (Table 5). Theprimary molecular-genetic evidence against (Oncorhyn-
chus, Salvelinus) is the results from analysis of ITS1,
which show strong bootstrap support for a sister-taxon
relationship betweenOncorhynchus and Salmo (Fig. 1D).
However, we note that this analysis is compromised by
use of an outgroup (H. perryi) that may belong among
the ingroup taxa; when the closest available fish species
outside of these genera is used (a cichlid), support for(Oncorhynchus, Salmo) is substantially reduced. Con-
sidered together, our analyses, and data from previous
studies, constitute strong evidence for a sister-taxon re-
lationship between Oncorhynchus and Salvelinus. These
results should compel further evaluation of the data
from morphology (e.g., position of the vomerine teeth)
that has been used to support a sister-taxon relationship
between Oncorhynchus and Salmo.
4.5. Implications for the evolution of salmonid fishes
Our results present a number of interesting implica-
tions for understanding the evolution of salmonid life
history, behavior, and diversification. First, the finding
that Salvelinus forms the sister-group to Oncorhynchus
indicates that anadromy, in the form of long ocean mi-grations followed by a return to the natal stream, migra-
tion tightly linked to reproduction, and semelparity or a
very low degree of iteroparity, has evolved at least twice,
once in Salmo and once in Oncorhynchus (Oakley and
Phillips, 1999; Stearley, 1992). This parallel evolution of
life history also involves large body size for age in both
sexes, due to extensive feeding at sea, and strong male–
male competition, probably a result of high breedingdensities (Crespi and Teo, 2002; Stearley, 1992). Such
parallel changes in behavior and life history are ultimately
a consequence of the parallel ecological opportunities
favoring anadromy in the northPacific andnorthAtlantic
oceans (Dodson, 1997; Gross et al., 1988; Hansen and
Quinn, 1998; McDowall, 1988; Northcote, 1978).
Second, the sister-taxa Oncorhynchus and Salvelinus
have apparently diversified in parallel on a large scale:each genus has given rise to exclusively freshwater spe-
cies (reproductively isolated kokanee forms of O. nerka,
Sv. namaycush), forms with interior (freshwater) and
sea-run populations (e.g., in O. mykiss and Sv. malma),
and exclusively Asian species (O. masou, Sv. leucomae-
nis) (Rounesfell, 1958; Stearley, 1992; Willson, 1997).
These similarities are consistent with the parallel radia-
tion of the two genera from a common ancestor, subjectto relatively similar selective pressures, opportunities for
dispersal, and vicariant events.
Third, given that O.masou groups with O. mykiss and
O. clarki rather than with the other so-called Pacific
salmon, semelparity has apparently evolved twice in
Oncorhynchus, once in the lineage leading to O. masou,
and once in the lineage leading to (O. tshawytscha, O.
kisutch, O. nerka, O. gorbuscha, O. keta). Alternatively,O. masou may be less strictly semelparous than is cur-
rently believed, as females of some populations of
landlocked O. masou exhibit a small degree of itero-
parity (Healey et al., 2001), and one of the main forms
of evidence in the literature for semelparity in O. masou
appears to have been its presumed phylogenetic position
among the Pacific salmon (Kato, 1991).
4.6. Congruence, total evidence, and clade support
Our analyses raise a number of issues regarding the
use of multiple data sets and criteria for evaluating
congruence. First, our results provide good examples of
both the strengths and limitations of a conditional
combining approach to phylogenetic congruence.
Overall, the data sets from the nuclear genes comple-mented and reinforced one another to yield a robust
tree, which is what one hopes that combining of data
will achieve (Bull et al., 1993; Cunningham, 1997). By
contrast, the results from mtDNA genes tended to
contradict the results from nuclear genes, and in the
combined data sets the inclusion of mtDNA reduced the
degree of resolution and bootstrap or Bayesian support.
But because the individual data sets overlapped onlypartially in the taxa that they included, it was not pos-
sible to apply statistically based congruence tests (e.g.,
Huelsenbeck and Bull, 1996) to our data sets, which
could more-objectively justify the exclusion of mtDNA
or other data sets such as MHC.
Second, the use of bootstrap or Bayesian a posteriori
support values to evaluate congruence is subject to im-
portant caveats. Majority-rule bootstrap trees may differfrom best or strict consensus trees, or the bootstrap
profiles (sets of bootstrapped trees) from analyses of
different genes may exhibit little or no overlap (Page,
1996; Sanderson, 1989). Moreover, low bootstraps
across a clade can be due to only one or few �rogue�species whose position is especially uncertain due to
long-branch attraction, a paucity of data, or other
processes (Page, 1996; Sanderson and Schaffer, 2002).For our separate and combined data sets, the bootstrap
majority-rule consensus trees were almost always the
same as the best or strict consensus trees, subject to the
lack of resolution shown in many of the bootstrap trees;
these findings suggest that rogue species are not unduly
influencing our results. Such limitations do not apply to
Bayesian a posteriori probability values, which appear

B.J. Crespi, M.J. Fulton / Molecular Phylogenetics and Evolution xxx (2003) xxx–xxx 19
ARTICLE IN PRESS
to provide a more accurate metric of support for the truetree due to their lack of bias and higher sensitivity to
phylogenetic signal (Alfaro et al., 2003). However, such
Bayesian probability values are less conservative than
bootstraps, and given the vagaries of such factors as
sampling error and imprecise model specification,
Bayesian probability values may in some cases imply
strong support for relationships that are accorded only
weak support by bootstraps (Alfaro et al., 2003; Douadyet al., 2003) or by other metrics such as tree length. In
our view, these considerations imply that high Bayesian
clade support values should be interpreted cautiously,
and that they should be accorded high confidence only
in conjunction with high likelihood or parsimony
bootstraps, or results from SH or Templeton tests.
Third, our analyses of the combined nuclear data sets
show that in some cases, adding data from an additionalgene can substantially increase maximum-parsimony
bootstrap support for some nodes while notably de-
creasing support for others. Thus, the exclusion of the
MHC data from our combined nuclear data set yields a
tree with very strong maximum-parsimony bootstrap
support for (O. mykiss, O. masou, O. clarki, 95% max-
imum-parsimony bootstrap) but only moderate support
for (O. tshawytscha, O. kisutch, 72%), while its inclusiongives the reverse: weaker support for the former clade
(79%), but very high support for the latter (99%). Be-
cause MHC is known to be under strong selection in
salmonids (Miller and Withler, 1996), we hesitate to
include it without reservations, even if when analyzed
separately these data provide a tree that does not appear
to be unequivocally incongruent with others.
In contrast to these parsimony results, the Bayesian aposteriori probabilities for (O. mykiss, O. masou, O.
clarki) and for (O. tshawytscha, O. kisutch) remained
high (100%) whether or not the MHC data was included
(Fig. 2). These results appear to reflect the higher sen-
sitivity of Bayesian analysis (vs. maximum parsimony
bootstraps) to phylogenetic signal, its increased accu-
racy in recovering monophyletic groups, and the high
susceptibility of maximum parsimony analysis to long-branch attraction, which can erode bootstrap support
for the affected clades (Alfaro et al., 2003). Overall, we
find it difficult to argue against the monophyly of both
(O. mykiss, O. masou, O. clarki) and (O. tshawytscha, O.
kisutch), as there is considerable support for each clade
and no notably conflicting results.
4.7. Optimizing future studies
One of the most important results of this study is its
role in mapping the best route for future molecular-phy-
logenetic studies of salmonids, with the ultimate goal of a
robust tree for all species and subspecies in the family. In
our study, the most-informative genes were GH1C,
GH2C, VIT, CYTB, ITS1, ITS2, and MHC. Of these
genes, evidence for incongruence was observed with theresults from ITS1, ITS2, and MHC. Since the apparent
cause of the incongruence can be surmised in each case
(i.e., hybridization and selection respectively), we believe
that the data from these genes should be treated with
reservations in combined analyses.Despite such cautions,
in each of these cases the apparent incongruence involved
the placement of only a few species, the data from the
other genes appeared to supercede the problematic effects,and the inclusion of the data from these genes thus in-
creased the robustness of the combined nuclear data tree
overall. These results imply that the sequencing of someor
all of the genes GH1C, GH2C, VIT, ITS1, ITS2, and
possiblyCYTBandMHC, for an enlarged set of salmonid
species, is likely to provide the best estimate for the phy-
logeny of Salmonidae, until additional nuclear markers
are developed. Indeed, a combined data set that includesonly these genes provides almost as well-resolved and
supported a phylogeny as the full nuclear data set.
When data from the same large suite of taxa are
available for a collection of genes, statistically based
methods for the analysis of congruence can also be ap-
plied, to better assess the extent to which different data
partitions agree on one true species tree. Such a data set
should also allow robust inference of the nature andtiming of major events in salmonid diversification, using
data from fossils (Behnke, 1992; Cavender, 1980; Cav-
ender and Miller, 1972; McPhail, 1997; Smith and
Stearley, 1989; Stearley and Smith, 1993), paleoclima-
tology (Pearcy, 1992), geology (Montgomery, 2000),
paleobiogeography (McPhail, 1997;Minckley et al., 1986;
Neave, 1958), and the biogeography and ecology of the
Esociformes, a freshwater group that has recently beenshown to be the sister taxon to salmonids (Ishiguro et al.,
2003). In conjunction with recent methods for use of
DNA sequence to infer divergence times (Arbogast et al.,
2002; Sanderson, 2002), such data will provide a com-
prehensive, interdisciplinary picture of the adaptive ra-
diation of Salmonidae.
Acknowledgments
We are grateful to Robert Behnke, Ian Fleming,
Andrew Hendry, Todd Oakley, Ruth Phillips, Jerry
Smith, Eric Taylor, John Taylor, Kyle Young, and
two anonymous reviewers for helpful comments and
discussion, and the Natural Sciences and Engineering
Research Council of Canada for financial support.
References
Alfaro, M.E., Zoller, S., Lutzoni, F., 2003. Bayes or bootstrap? A
simulation study comparing the performance of Bayesian Markov

20 B.J. Crespi, M.J. Fulton / Molecular Phylogenetics and Evolution xxx (2003) xxx–xxx
ARTICLE IN PRESS
chain Monte Carlo sampling and bootstrapping in assessing
phylogenetic confidence. Mol. Biol. Evol. 20, 255–266.
Allendorf, F.W., Leary, R.F., 1988. Conservation and distribution of
genetic variation in a polytypic species, the cutthroat trout. Cons.
Biol. 2, 170–184.
Angers, B., Bernatchez, L., 1997. Complex evolution of a salmonid
microsatellite locus and its consequences in inferring allelic
divergence from size information. Mol. Biol. Evol. 14, 230–238.
Arbogast, B.S., Edwards, S.V., Wakeley, J., Beerli, P., Slowinski, J.B.,
2002. Estimating divergence times from molecular data on phylo-
genetic and population genetic timescales. Ann. Rev. Ecol. Syst. 33,
707–740.
Arnold, M.L., 1992. Natural hybridization as an evolutionary process.
Ann. Rev. Ecol. Syst. 23, 237–261.
Barker, F.K., Lutzoni, F.M., 2002. The utility of the incongruence
length difference test. Syst. Biol. 51, 625–637.
Baxter, J.S., Taylor, E.B., Devlin, R.H., Hagen, J., McPhail, J.D.,
1997. Evidence for natural hybridization between dolly varden
(Salvelinus malma) and bull trout (Salvelinus confluentus) in a
northcentral British Columbia watershed. Can. J. Fish. Aquat. Sci.
54, 421–429.
Behnke, R.J., 1984. Organizing the diversity of the Arctic char
complex. In: Johnson, L., Burns, B.L. (Eds.), Biology of the Arctic
Charr. Proceedings of the International Symposium on Arctic
Charr. University of Manitoba Press, Winnipeg, pp. 3–21.
Behnke, R.J., 1992. Native trout of Western North America. Am. Fish.
Soc. Monograph 6, 1–275.
Bernatchez, L., Glemet, H., Wilson, C.C., Danzmann, R.G., 1995.
Introgression and fixation of Arctic char (Salvelinus alpinus)
mitochondrial genome in an allopatric population of brook trout
(Salvelinus fontinalis). Can. J. Fish. Aquat. Sci. 52, 179–185.
Bull, J.J., Huelsenbeck, J.P., Cunningham, C.C., Swofford, D.P.,
Waddell, P.J., 1993. Partitioning and combining data in phyloge-
netic analysis. Syst. Biol. 42, 384–397.
Buisine, N., Trichet, V., Wolff, J., 2002. Complex evolution of
vitellogenin genes in salmonid fishes. Mol. Genet. Genomics 268,
535–542.
Campton, D.E., Utter, F.M., 1985. Natural hybridization between
steelhead trout (Salmo gairdneri) and coastal cutthroat trout
(Salmo clarki clarki) in two Puget Sound streams. Can. J. Fish.
Aquat. Sci. 42, 110–119.
Cavender, T.M., 1980. Systematics of Salvelinus from the North Pacific
basin. In: Balon, E.K. (Ed.), Charrs: Salmonid Fishes of the Genus
Salvelinus. The Hague, Junk, pp. S295–S322.
Cavender, T.M., 1984. Cytotaxonomy of North American Salvelinus.
In: Johnson, L., Burns, B. (Eds.), Biology of the Arctic Char.
Proceedings of the International Symposium on Arctic Char,
Winnipeg, Manitoba. Manitoba Press, Winnipeg, pp. 431–445.
Cavender, T.M., Kimura, S., 1989. Cytotaxonomy and interrelation-
ships of Pacific basin Salvelinus. Physiol. Ecol. Jpn. Special 1, 49–
68.
Cavender, T.M., Miller, R.R., 1972. Smilidonichthys rastrosus, a new
Pliocene salmonid fish. Museum of Natural History, University of
Oregon, Bulletin 18.
Chevassus, B., 1979. Hybridization in salmonids: results and perspec-
tives. Aquaculture 17, 113–128.
Crandall, K.A., Bininda-Emonds, O.R.P., Mace, G.M., Wayne, R.K.,
2000. Considering evolutionary processes in conservation biology.
Trends Ecol. Evol. 15, 290–295.
Crane, P.A., Seeb, L.W., Seeb, J.E., 1994. Genetic relationships among
Salvelinus species inferred from allozyme data. Can. J. Fish. Aquat.
Sci. 51, 182–197.
Crespi, B.J., Teo, R., 2002. Comparative phylogenetic analysis of the
evolution of semelparity and life history in salmonid fishes.
Evolution 56, 1008–1020.
Cunningham, C.W., 1997. Is congruence between data partitions a
reliable predictor of phylogenetic accuracy? Empirically testing an
iterative procedure for choosing among phylogenetic methods.
Syst. Biol. 46, 464–478.
Dangel, J.R., Macy, P.T., Withler, F.C. 1973. Annotated bibliography
of interspecific hybridization of fishes of the subfamily Salmoninae.
NOAA,Nat.Mar. Fish. Ser. Tech. memorandumNMFSNWFC-1,
48 pp.
De Queiroz, A., Donoghue, M.J., Junhyong, K., 1995. Separate versus
combined analysis of phylogenetic evidence. Ann. Rev. Ecol. Syst.
26, 657–682.
Dodson, J.J., 1997. Fish migration: an evolutionary perspective. In:
Godin, J.-G.J. (Ed.), Behavioural Ecology of Teleost Fishes.
Oxford University Press, Oxford, UK, pp. 10–36.
Domanico, M.J., Phillips, R.B., 1995. Phylogenetic analysis of Pacific
salmon (genus Oncorhynchus) based on mitochondrial DNA
sequence data. Mol. Phylogenet. Evol. 4, 366–371.
Domanico, M.J., Phillips, R.B., Oakley, T.H., 1997. Phylogenetic
analysis of Pacific Salmon (genus Oncorhynchus) using nuclear and
mitochondrial DNA sequences. Can. J. Fish. Aquat. Sci. 54, 1865–
1872.
Douady, C.J., Delsuc, F., Boucher, Y., Doolittle, W.F., Douzery,
E.J.P., 2003. Comparison of Bayesian and maximum likelihood
bootstrap measures of phylogenetic reliability. Mol. Biol. Evol. 20,
248–254.
Du, S.J., Devlin, R.H., Hew, C.L., 1993. Genomic structure of growth
hormone genes in chinook salmon (Oncorhynchus tshawytscha):
presence of two functional genes, GH-I and GH-II, and a male-
specific pseudogene, GH-U. DNA Cell Biol. 12, 739–751.
Elliott, J.M., 1994. Quantitative Ecology and the Brown Trout. Oxford
University Press, Oxford, UK.
Ferguson, A., Himberg, K.-J.M., Svardson, G., 1978. Systematics of
the Irish pollan (Coregonus pollan Thompson): an electrophoretic
comparison with other holarctic Coregoninae. J. Fish Biol. 12,
221–233.
Fleming, I.A., 1998. Pattern and variability in the breeding system of
Atlantic salmon (Salmo salar), with comparisons to other salmo-
nids. Can. J. Fish. Aquat. Sci. 55 (Suppl. 1), 59–76.
Gl�eemet, H., Blier, P., Bernatchez, L., 1998. Geographical extent of
Arctic char (Salvelinus alpinus) introgression in brook char
populations (S. fontinalis) from eastern Quebec, Canada. Mol.
Ecol. 7, 1655–1662.
Grewe, P.M., Billington, N., Hebert, D.N., 1990. Phylogenetic
relationships among members of Salvelinus inferred from mito-
chondrial DNA divergence. Can. J. Fish. Aquat. Sci. 47, 984–
991.
Groot, C., Margolis, L., 1991. Pacific Salmon Life Histories. Univer-
sity of British Columbia Press, Vancouver, BC.
Gross, M.R., Coleman, R.M., McDowall, R.M., 1988. Aquatic
productivity and the evolution of diadromous fish migration.
Science 239, 1291–1293.
Hall, B.G., 2001. Phylogenetic Trees Made Easy. Sinaeur, Sunderland,
MA.
Hansen, L.P., Quinn, T.P., 1998. The marine phase of the Atlantic
salmon (Salmo salar) life cycle, with comparisons to Pacific salmon.
Can. J. Fish. Aquat. Sci. 55 (Suppl. 1), 104–118.
Hart, J.L., 1973. Pacific Fishes of Canada. Fisheries Research Board of
Canada, Ottawa.
Hartley, S.E., Davidson, W.S., 1994. Distribution of satellite DNA
sequences isolated from Arctic char, Salvelinus alpinus, in the genus
Salvelinus. Can. J. Fish. Aquat. Sci. 51 (Suppl. 1), 277–283.
Healey, M., Kline, P., Tsai, C.F., 2001. Saving the endangered
Formosa landlocked salmon. Fisheries 26, 6–14.
Hendry, A.P., Stearns, S.C., 2003. Evolution Illuminated: Salmon and
their Relatives. Oxford University Press, Oxford, UK.
Huelsenbeck, J.P., Bull, J.J., 1996. A likelihood ratio test to detect
conflicting phylogenetic signal. Syst. Biol. 45, 92–98.
Huelsenbeck, J.P., Bull, J.J., Cunningham, C.W., 1996. Combining
data in phylogenetic analysis. Trends Ecol. Evol. 11, 152–158.

B.J. Crespi, M.J. Fulton / Molecular Phylogenetics and Evolution xxx (2003) xxx–xxx 21
ARTICLE IN PRESS
Huelsenbeck, J.P., Ronquist, F., Nielsen, R., Bollback, J.P., 2001.
Bayesian inference of phylogeny and its impact on evolutionary
biology. Science 294, 2310–2314.
Ishiguro, N.B., Miya, M., Nishida, M., 2003. Basal euteleostean
relationships: a mitogenomic perspective on the phylogenetic
reality of the ‘‘Proacanthopterygii’’. Molec. Phylogenet. Evol. 27,
476–488.
Kanda, N., Leary, R.F., Allendorf, F.W., 2002. Evidence of intro-
gressive hybridization between bull trout and brook trout. Trans.
Am. Fish. Soc. 131, 772–782.
Kato, F., 1991. Life histories of Masu and Amago Salmon (Oncorhyn-
chus masou and Oncorhynchus rhodurus). In: Groot, C., Margolis,
L. (Eds.), Pacific Salmon Life Histories. UBC Press, Vancouver,
BC, pp. 447–520.
Kitano, T., Matsuoka, N., Saitou, N., 1997. Phylogenetic relationship
of the genus Oncorhynchus species inferred from nuclear and
mitochondrial markers. Genes Genet. Syst. 72, 25–34.
Lee, D.S., Gilbert, C.R., Hocutt, C.H., Jenkins, R.E., McAllister,
D.E., Stauffer Jr., J.R., 1980. Atlas of North American Freshwater
Fishes. North Carolina State Museum of Natural History.
McDowall, R.M., 1988. Diadromy in Fishes: Migrations Between
Freshwater and Marine Environments. Timber Press, Portland,
OR.
McDowall, R.M., 1997. The evolution of diadromy in fishes (revisited)
and its place in phylogenetic analysis. Rev. Fish. Biol. Fish. 7, 443–
462.
McKay, S.J., Devlin, R.H., Smith, M.J., 1996. Phylogeny of Pacific
salmon and trout based on growth hormone type-2 and mitochon-
drial NADH dehydrogenase subunit 3 DNA sequences. Can. J.
Fish. Aquat. Sci. 53, 1165–1176.
McLennan, D.A., 1994. A phylogenetic approach to the study of fish
behavior. Rev. Fish. Biol. Fish. 4, 430–460.
McPhail, J.D., 1997. The origin and speciation of Oncorhynchus
revisited. In: Stouder, D.J., Bisson, P.A., Naiman, R.J. (Eds.),
Pacific Salmon and their Ecosystems: Status and Future Options.
Chapman and Hall, New York, pp. 29–38.
Miller, K.M., Withler, R.E., 1996. Sequence analysis of a polymorphic
Mhc class II gene in Pacific salmon. Immunogenetics 43, 337–351.
Miller, R.J., Brannon, E.L., 1981. The origin and development of life
history patterns in Pacific salmonids. In: Brannon, E.L., Salo, E.O.
(Eds.), Salmon and Trout Migratory Behavior Symposium. Uni-
versity of Washington Press, Seattle, WA, pp. 296–309.
Minckley, W.L., Hendrickson, D.A., Bond, C.E., 1986. Geography of
western North American freshwater fishes: description and rela-
tionships to intracontinental tectonism. In: Hocutt, C.H., Wiley,
E.O. (Eds.), Zoogeography of North American Freshwater Fishes.
Wiley, New York, pp. 519–614.
Montgomery, D.R., 2000. Coevolution of the Pacific salmon and
Pacific Rim topography. Geology 28, 1107–1110.
Murata, S., Takasaki, N., Okazaki, T., Kobayashi, T., Numachi, K.,
Chang, K., Okada, N., 1998. Molecular evidence from short
interspersed elements (SINEs) that Oncorhynchus masou (cherry
salmon) is monophyletic. Can. J. Fish. Aquat. Sci. 55, 1864–1870.
Murata, S., Takasaki, N., Saitoh, M., Okada, N., 1993. Determination
of the phylogenetic relationships among Pacific Salmonids by using
short interspersed elements (SINEs) as temporal landmarks of
evolution. Proc. Natl. Acad. Sci. USA 90, 6995–6999.
Murata, S., Takasaki, N., Saitoh, M., Tachida, H., Okada, N., 1996.
Details of retropositional genome dynamics that provide a ratio-
nale for a genetic division: the distinct branching of all the Pacific
salmon and trout (Oncorhynchus) from the Atlantic salmon and
trout (Salmo). Genetics 142, 915–926.
Neave, F., 1958. The origin and speciation of Oncorhynchus. Trans. R.
Soc. Canada 52, 25–39.
Norden, C.R., 1961. Comparative osteology of representative salmo-
nid fishes, with particular reference to the grayling (Thymallus
arcticus) and its phylogeny. J. Fish. Res. Bd. Canada 18, 679–791.
Northcote, T.G., 1978. Migratory strategies and production in
freshwater fishes. In: Gerking, S.D. (Ed.), Ecology of Freshwater
Fish Production. Blackwell Scientific Publishers, Oxford, UK, pp.
326–359.
Oakley, T.H., Phillips, R.B., 1999. Phylogeny of Salmonine fishes
based on growth hormone introns: Atlantic (Salmo) and Pacific
(Oncorhynchus) Salmon are not sister taxa. Mol. Phylogenet. Evol.
11, 381–393.
Oleinik, A.G., 1997. Molecular phylogeny of salmonids: results of an
analysis of nuclear and mitochondrial DNA. Genetika 33, 173–177.
Oleinik, A.G., 2000. On the rates of evolution of the mitochondrial
and nuclear genomes in Salmonid fishes. Biologiya Morya (Vlad-
ivostok) 26, 410–416.
Oohara, I., Sawano, K., Okazaki, T., 1997. Mitochondrial DNA
sequence analysis of the masu salmon––phylogeny in the genus
Oncorhynchus. Mol. Phylogenet. Evol. 7, 71–78.
Oohara, I., Sawano, K., Okazaki, T., Kobayashi, T., 1999. Reexami-
nation of the molecular phylogeny of the masu salmon of the genus
Oncorhynchus. In: S�eeret, B., Sire, J.-Y. (Eds.), Proc. 5th Indo-Pacific
Fish Conference, Noum�eea, New Caledonia, pp. 417–426.
Osinov, A.G., 1999. Salmonid fish of the genera Salmo, Parasalmo,
and Oncorhynchus: genetic divergence, phylogeny and classifica-
tion. J. Ichthyol. 39, 571–587.
Page, R.D.M., 1996. On consensus, confidence, and �total evidence�.Cladistics 12, 83–92.
Pearcy, W.G., 1992. Ocean ecology of north Pacific salmonids.
University of Washington Press, Seattle, WA.
Phillips, R.B., Manley, S.A., Daniels, T.J., 1994. Systematics of the
salmonid genus Salvelinus inferred from ribosomal DNA se-
quences. Can. J. Fish. Aquat. Sci. 51, 198–204.
Phillips, R.B., Makoto, M.P., Reed, K.M., 2002. Characterization of
charr chromosomes using fluorescence in situ hybridization.
Environ. Biol. Fishes 64, 223–228.
Phillips, R.B.,Oakley, T.H., 1997. Phylogenetic relationships among the
Salmoninae based on their nuclear andmitochondrial sequences. In:
Kocher, T.D., Sepien, C.A. (Eds.), Molecular Systematics of Fishes.
Academic Press, San Diego, CA, pp. 145–162.
Phillips, R.B., Pleyte, K.A., 1991. Nuclear DNA and salmonid
phylogenetics. J. Fish Biol. 39, 259–275.
Phillips, R.B., Pleyte, K.A., Ihssen, P.E., 1989. Patterns of chromo-
somal nucleolar organizer region (NOR) variation in fishes of the
genus Salvelinus. Copeia 1989, 47–53.
Phillips, R.B., R�aab, P., 2001. Chromosome evolution in the Salmon-
idae (Pisces): an update. Biol. Rev. 76, 1–25.
Phillips, R.B., Sajdak, S.L., Domanico, M.J., 1995. Relationships
among charrs based on DNA sequences. Nordic J. Freshwater Res.
71, 378–391.
Pleyte, K.A, Duncan, S.D., Phillips, R.B., 1992. Evolutionary
relationships of the salmonid fish genus Salvelinus inferred from
DNA sequences of the first internal transcribed spacer (ITS 1) of
ribosomal DNA. Mol. Phylogenet. Evol. 1, 223–230.
Posada, D., Crandall, K.A., 1998. Modeltest: testing the model of
DNA substitution. Bioinformatics 14, 817–818.
Posada, D., Crandall, K.A., 2001. Selecting the best-fit model of
nucleotide substitution. Syst. Biol. 50, 580–601.
Rannala, B., Yang, Z., 1996. Probability distribution of molecular
evolutionary trees: a new method of phylogenetic inference. J. Mol.
Evol. 43, 304–311.
Redenbach, Z., Taylor, E.B., 2002. Evidence for historical introgres-
sion along a contact zone between two species of char (Pisces:
Salmonidae) in northwestern North America. Evolution 56, 1021–
1035.
Regan, C.T., 1914. The systematic arrangement of the fishes of the
family Salmonidae. Ann. Mag. Nat. History 13, 405–408.
Rosenfield, J.A., Todd, T., Greil, R., 2000. Asymmetric hybridization
and introgression between pink salmon and chinook salmon in the
Laurentian Great Lakes. Trans. Am. Fish. Soc. 129, 670–679.

22 B.J. Crespi, M.J. Fulton / Molecular Phylogenetics and Evolution xxx (2003) xxx–xxx
ARTICLE IN PRESS
Rounesfell, G.A., 1958. Anadromy in North American Salmonidae.
US Fish Wildlife Ser. Bull. 58, 171–185.
Sanderson, M.J., 1989. Confidence limits on phylogenies: the boot-
strap revisited. Cladistics 5, 113–129.
Sanderson, M.J., 2002. Estimating absolute rates of molecular
evolution and divergence times: a penalized likelihood approach.
Mol. Biol. Evol. 19, 101–109.
Sanderson, M.J., Schaffer, H.B., 2002. Troubleshooting molecular
phylogenetic analyses. Ann. Rev. Ecol. Syst. 33, 49–72.
Scott, W.B., Crossman, E.J., 1973. Freshwater Fishes of Canada. Bull.
184, Fisheries Research Board of Canada, Ottawa.
Shed�ko, S.V., Ginatulina, L.K., Parpura, I.Z., Ermolenko, A.V.,
1996. Evolutionary and taxonomic relationships among Far-
Eastern salmonid fishes inferred from mitochondrial DNA diver-
gence. J. Fish Biol. 49, 815–829.
Shedlock, A.M., Parker, J.D., Crispin, D.A., Pietsch, T.W., Burmer,
G.C., 1992. Evolution of the salmonid mitochondrial control
region. Mol. Phylogenet. Evol. 1, 179–192.
Shimodaira, H., Hasegawa, M., 1999. Multiple comparisons of log-
likelihoods with applications to phylogenetic inference. Mol. Biol.
Evol. 16, 1114–1116.
Slowinski, J., Page, R.D.M., 1999. How should species phylogenies be
inferred from sequence data? Syst. Biol. 48, 814–825.
Smith, G.R., 1992. Introgression in fishes: significance for paleontol-
ogy, cladistics, and evolutionary rates. Syst. Biol. 41, 41–57.
Smith, G.R., Swirydczuk, K., Kimmul, P.G., Wilkinson, B.H., 1982.
Fish biostratigraphy of late Miocene to Pleistocene sediments of
the western Snake River plain, Idaho. Cenozoic Geol. Idaho, Idaho
Bureau Mine Geol. Bull. 26, 519–541.
Smith, G.R., Stearley, R.F., 1989. The classification and scientific
names of rainbow and cutthroat trouts. Fisheries 14, 4–10.
Spruell, P., Bartron, M.L., Kanda, N., Allendorf, F.W., 2001.
Detection of hybrids between bull trout (Salvelinus confluentus)
and brook trout (Salvelinus fontinalis) using PCR primers comple-
mentary to interspersed nuclear elements. Copeia 2001, 1093–1099.
Stearley, R.F., 1992. Historical ecology of Salmoninae, with special
reference to Oncorhynchus. In: Mayden, R.L. (Ed.), Systematics,
Historical Ecology, and North American Freshwater Fishes.
Stanford University Press, Stanford, CA, pp. 622–658.
Stearley, R.F., Smith, G.R., 1993. Phylogeny of the Pacific trouts and
salmons (Oncorhynchus) and genera of the family Salmonidae.
Trans. Am. Fish. Soc. 122, 1–33.
Sullivan, J., Swofford, D.L., 2001. Should we use model-based
methods for phylogenetic inference when we know that assump-
tions about among-site rate variation and nucleotide substitution
pattern are violated? Syst. Biol. 50, 723–729.
Swofford, D.L., 2002. PAUP: Phylogenetic Analysis Using Parsimony,
version 4.0b10. Illinois Natural History Survey. Champaign, IL.
Tanaka, S., 1965. A review of the biological information on masu
salmon (Oncorhynchus masou). In: Salmon of the North Pacific
Ocean. Part IX. Coho, chinook and masu salmon in offshore
waters. Int. North Pacific Fish. Comm. Bull. 16, 75–135.
Takasaki, N., Murata, S., Saitoh, M., Kobayashi, T., Park, L., Okada,
N., 1994. Species-specific amplification of tRNA-derived short
interspersed repetitive elements (SINEs) by retroposition: a process
of parasitization of entire genomes during the evolution of
salmonids. Proc. Natl. Acad. Sci. USA 91, 10153–10157.
Taylor, E.B., 2003. Evolution in mixed company: evolutionary
inferences from studies of natural hybridization in Salmonidae.
In: Hendry, A., Stearns, S. (Eds.), Evolution Illuminated: Salmon
and their Relatives. Oxford University Press, Oxford, UK.
Templeton, A.R., 1983. Phylogenetic inference from restriction endo-
nuclease cleavage site maps with particular reference to the
evolution of humans and apes. Evolution 37, 221–244.
Thomas, W.K., Beckenbach, A.T., 1989. Variation in salmonid
mitochondrial DNA: evolutionary constraints and mechanisms of
substitution. J. Mol. Evol. 29, 233–245.
Thomas, W.K., Withler, R.E., Beckenbach, A.T., 1986. Mitochondrial
DNA analysis of Pacific salmonid evolution. Can. J. Zool. 64,
1058–1064.
Thompson, J.D., Gibson, T.J., Plewniak, F., Jeanmougin, F., Higgins,
D.G., 1997. The Clustal X windows interface: flexible strategies for
multiple sequence alignment aided by quality analysis tools. Nucl.
Acids Res. 25, 4876–4882.
Tsuyuki, H., Roberts, E., 1966. Inter-species relationships within the
genus Oncorhynchus based on biochemical systematics. J. Fish.
Res. Bd. Canada 23, 101–107.
Utter, F.M., Allendorf, F.W., Hodgins, H.O., 1973. Genetic variability
and relationships in Pacific Salmon and related trout based on
protein variations. Syst. Zool. 22, 257–270.
Utter, F.M., Allendorf, F.W., 1994. Phylogenetic relationships among
species of Oncorhynchus: a consensus view. Conserv. Biol. 8, 864–
867.
Westrich, K.M., Konkol, N.R., Matsuoka, M.P., Phillips, R.B., 2002.
Interspecific relationships among charrs based on phylogenetic
analysis of nuclear growth hormone intron sequences. Environ.
Biol. Fishes 64, 217–222.
Wiens, J.J., 1998a. Does adding characters with missing data increase
or decrease phylogenetic accuracy? Syst. Biol. 47, 625–640.
Wiens, J.J., 1998b. Combining data sets with different phylogenetic
histories. Syst. Biol. 47, 568–581.
Wiens, J.J., Reeder, T.W., 1995. Combining data sets with different
numbers of taxa for phylogenetic analysis. Syst. Biol. 44, 548–
558.
Willson, M.F., 1997. Variation in salmonid life histories: patterns and
perspectives. Res. Pap. PNW-RP-498, US Department of Agricul-
ture, Forest Service, Pacific Northwest Research Station, Portland,
OR.
Wilson, C.C., Bernatchez, L., 1998. The ghost of hybrids past: fixation
of Arctic charr (Salvelinus alpinus) mitochondrial DNA in an
introgressed population of lake trout (S. namaycush). Mol. Ecol. 7,
127–132.
Wilson, C.C., Hebert, P.D.N., 1993. Natural hybridization be-
tween Arctic charr (Salvelinus alpinus) and lake trout (S.
namaycush) in the Canadian Arctic. Can. J. Fish. Aquat. Sci.
50, 2652–2658.
Woram, R.A., Gharbi, K., Sakamoto, T., Hoyheim, B., Holm, L.E.,
Naish, K., McGowan, C., Ferguson, M.M., Phillips, R.B., Stein, J.,
Guyomard, R., Cairney, M., Taggart, J.B., Powell, R., Davidson,
W., Danzmann, R.G., 2003. Comparative genome analysis of the
primary sex-determining locus in salmonid fishes. Genome. Res.
13, 272–280.
Yang, Z., Rannala, B., 1997. Bayesian phylogenetic inference using
DNA sequences: a Markov Chain Monte Carlo method. Mol. Biol.
Evol. 14, 717–724.
Yoshiyasu, K., 1973. Starch-gel electrophoresis of hemoglobins of
freshwater salmonid fishes in southwest Japan––II. Genus On-
corhynchus (salmon) Bull. Jpn. Soc. Sci. Fish. 39, 97–114.