Molecular systematics of flyingfishes (Teleostei: Exocoetidae

MOLECULAR SYSTEMATICS OF PEROMYSCUS AND ALLIES
BASED ON NUCLEAR AND MITOCHONDRIAL DNA SEQUENCES
by
BRIAN RICHARD AMMAN, B.S., M.S.
A DISSERTATION
IN
ZOOLOGY
Submitted to the Graduate Faculty of Texas Tech University in
Partial Fulfillment of the Requirements for
the Degree of
DOCTOR OF PHILOSOPHY
Approved
Robert D. Bradley Chairperson of the Committee
Robert J. Baker
Richard E. Strauss
Clyde Jones
David J. Schmidly
Accepted
John Borrelli
Dean of the Graduate School
May, 2005

ii
ACKNOWLEDGMENTS
Funding for this study was provided by NIH (DHHS A141435-01 to Robert D.
Bradley). Tissue loans were made available by R. J. Baker and the Natural Science
Research Laboratory, Museum Texas Tech University, C. William Kilpatrick and the
University of Vermont, and Duke S. Rogers and Brigham Young University. I would
like to thank the members of my committee, Drs. Robert J. Baker, Clyde Jones, David J.
Schmidly, and Richard E. Strauss for their guidance during this project and through all
aspects of my graduate experience. I would especially like to thank major advisor Dr.
Robert D. Bradley for his patience and guidance through my graduate career and
throughout this and other projects. Also, I would like to thank Dr. Bradley for his
friendship and willingness to accept a novice into his lab and show him the ropes.
I would also like to thank my colleagues and friends Brooke D. Baxter, Dr. Darin
S. Carroll, Nevin D. Durish, John D. Hanson, Francisca Mendez-Harclerode, Michelle L.
Haynie, Dr. Steven R. Hoofer, Lisa K. Longhofer, L. Rex McAliley, Serena A. Reeder,
and John R. Suchecki for their extremely valuable input and assistance, and especially for
their friendship and camaraderie during the hard times.
I would like to acknowledge my parents, Jane E. Garnett, L. Richard Amman, and
Ona M. Amman, for their support and encouragement throughout my graduate career. I
would like to extend my most heartfelt gratitude and love to my wife Colleen for her
unwavering support and encouragement these many years and to my boys, Brendan and
Liam, for giving me the inspiration to press on when I wanted to stop.

iii
TABLE OF CONTENTS
ACKNOWLEDGMENTS ii
ABSTRACT iv
LIST OF FIGURES v
CHAPTER
I. INTRODUCTION 1
II. MOLECULAR SYSTEMATICS OF PEROMYSCUS AND ALLIES BASED ON NUCLEAR AND MITOCHONDRIAL DNA SEQUENCES 5
III. SUMMARY 41
APPENDIX: SPECIMEN LOCALITIES 45

iv
ABSTRACT
Nucleotide sequences from the 2nd intron of the class 1 alcohol dehydrogenase
nuclear gene (Adh1-I2) were used to examine the boundaries of the genus Peromyscus
(sensu stricto), especially concerning the taxonomic affinities of Habromys,
Megadontomys, Osgoodomys, Podomys, and Neotomodon with regard to Peromyscus.
Relationships of the Peromyscus species groups also were tested. Adh1-I2 sequences
were analyzed using parsimony, maximum likelihood, and Bayesian methods and all
produced similar unresolved phylogenies regarding relationships between species groups.
Habromys, Megadontomys, Osgoodomys, Podomys, and Neotomodon were included in
clades containing members of the genus Peromyscus, however, support was lacking for
their exact placement. Genetic divergence values between the genus Peromyscus and the
5 genera in question ranged from 2.64% (Osgoodomys versus Peromyscus) to 4.61%
(Podomys versus Peromyscus). In addition, Adh1-I2 sequences were concatenated with
mitochondrial cytochrome b sequences and Bayesian methods were used to test the
boundaries of the genus. Support was strong for all species groups except the truei
group; however, an unresolved phylogeny was produced with respect to the relationships
of the species groups. Neotomodon, Habromys, and Osgoodomys were supported as
being included in the genus Peromyscus as traditionally defined, whereas Megadontomys
was placed in an unresolved clade with members of the genus Peromyscus and its
phylogenetic position with regard to Peromyscus (sensu stricto) remains uncertain.

v
LIST OF FIGURES
3.1 Strict consensus tree representing 132 equally parsimonious trees obtained from a parsimony analysis of unweighted DNA sequence characters from
Adh1-I2.
3.2 Adh1-I2 phylogeny generated using maximum likelihood with the HKY+G model of evolution.
3.3 Adh1-I2 phylogeny generated using Bayesian methods and the GTR+I+G model of evolution.
3.4 Adh1-I2---Cytb phylogeny generated using Bayesian methods and the GTR+I+G model of evolution.

1
CHAPTER I
INTRODUCTION
Peromyscus is a widely studied rodent genus and has been examined using
morphological, karyological, biochemical, and nucleotide sequence data. The genus has
undergone 3 major revisions beginning with Osgood (1909), followed by Hooper (1968)
and Carleton (1989). One of the most interesting controversies of these revisions
involves the phylogenetic and taxonomic status of the 5 subgenera (Osgoodomys,
Megadontomys, Isthmomys, Habromys, and Podomys) recognized by Osgood (1909) and
Hooper and Musser (1964) and later elevated to generic status by Carleton (1980; 1989)
based on morphological evidence.
Despite numerous studies involving various taxa of Peromyscus (Baker et al.
1983; Bradley and Schmidly 1987; Carleton 1979; Rennert and Kilpatrick 1986; Rogers
1983; Tiemann-Boege et al. 2000; Zimmerman et al. 1975), there has not been a
comprehensive phylogenetic study of the genus since Carleton (1980) and there has not
yet been an evaluation of the relationships among species groups. R. D. Bradley (pers
com) has developed an overview of the genus Peromyscus based on the mitochondrial
cytochrome b (Cytb) gene that would provide a maternally grounded phylogeny, but a
phylogenetic assessment utilizing a nuclear marker capable of detecting species level
differences is needed. One potential marker is the 2nd intron of the nuclear alcohol
dehydrogenase gene (Adh1-I2). Alcohol dehydrogenases, in mammalian systems, are
dimeric zinc-metalloenzymes that function to catalyze the oxidization of alcohols to

2
aldehydes or ketones (Cheung et al. 1999). Alcohol dehydrogenase has been shown to be
a highly polymorphic allozyme in rodents and capable of detecting species level
differences (Bradley et al. 1998). Amman et al. (In prep) has shown that intron 2 of the
class 1 alcohol dehydrogenase (Adh1-I2) is capable of detecting species level differences
in rodents.
This dissertation involves a phylogenetic treatment of the genus Peromyscus, as
defined by Carleton (1989), using nucleotide sequence data from the Adh1-I2 nuclear
marker. The primary objective of this study was to examine the classification of the
genus Peromyscus and allies by Carleton (1989) using nucleotide sequences from Adh1-
I2. A secondary goal was to use Adh1-I2 to examine the phylogenetic relationships of the
species groups within the genus Peromyscus.
The 2nd chapter of this dissertation represents the following manuscript being
prepared for publication and is formatted according to the specifications set forth by the
Journal of Mammalogy:
Amman, B. R. and R. D. Bradley. Molecular Systematics of
Peromyscus and Allies Based on Nuclear and Mitochondrial DNA
Sequences. In prep.
This chapter includes phylogenies produced by the analyses of the Adh1-I2 nuclear
marker via parsimony, maximum likelihood, and Bayesian methods. Also, Adh1-I2 and
mitochondrial Cytb nucleotide sequences were concatenated and analyzed using Bayesian
methods.

3
LITERATURE CITED
Baker R. J., L. W. Robbins, F. B. Stangl, Jr., and E. C. Birney. 1983. Chromosomal evidence for a major subdivision in Peromyscus leucopus. Journal of Mammalogy 64:356--359.
Bradley, R. D., and D. J. Schmidly. 1987. The glans penes and bacula in Latin American taxa of the Peromyscus boylii group. Journal of Mammalogy 68:595-- 616.
Bradley, R. D., R. M. Adkins, R. L. Honeycutt, and J. H. McDonald. 1998. Nucleotide polymorphism at the alcohol dehydrogenase locus of pocket gophers, genus Geomys. Molecular Biology and Evolution 15:709--717.
Carleton, M. D. 1979. Taxonomic status and relationships of Peromyscus boylii from El Salvador. Journal of Mammalogy 60:280--296.
Carleton, M. D. 1980. Phylogenetic relationships in neotomine-peromyscine rodents (Muroidea) and a reappraisal of the dichotomy within New World Cricetinae. Miscellaneous Publications, Museum of Zoology, University of Michigan 157:1-- 146.
Carleton, M. D. 1989. Systematics and evolution. Pp. 7-141 in Advances in the study of Peromyscus (Rodentia) (G. L. Kirkland, Jr. and J. N. Layne, eds.). Texas Tech University Press, Lubbock, 366 pp.
Cheung, B., R. S. Holmes, S. Esteal, and I. R. Beacham. 1999. Evolution of class I alcohol dehydrogenase genes in catarrhine primates: gene conversion, substitution rates, and gene regulation. Molecular Biology and Evolution 16:23--36.
Hooper, E. T. 1968. Classification. Pp. 27-74 in Biology of Peromyscus (Rodentia) (J. A. King, ed.). Special Publication, The American Society of Mammalogists 2:1-- 593.

4
Hooper, E. T., and G. G. Musser. 1964. The glans penis in Neotropical cricetines (Family Muridae) with comments on classification of muroid rodents. Miscellaneous Publications, Museum of Zoology, University of Michigan 123:1-- 57.
Osgood, W. H. 1909. Revisions of the mice of the American genus Peromyscus. North American Fauna 28:1--285.
Rennert, P. D., and C. W. Kilpatrick. 1986. Biochemical systematics of populations of Peromyscus boylii I. Populations from east-central Mexico with low autosomal arm numbers. Journal of Mammalogy 67:481--488.
Rogers, D. S. 1983. Phylogenetic affinities of Peromyscus (Megadontomys) thomasi: Evidence from differentially stained chromosomes. Journal of Mammalogy 64:617--623.
Tiemann-Boege, I., C. W. Kilpatrick, D. J. Schmidly, and R. D. Bradley. 2000. Molecular phylogenetics of the Peromyscus boylii species group (Rodentia: Muridae) based on mitochondrial cytochrome b sequences. Molecular Phylogenetics and Evolution 16:366--378.
Zimmerman, E. G., C. W. Kilpatrick, and B. J. Hart. 1975. Biochemical genetics of the boylii and truei groups of the genus Peromyscus. Comparative Biochemical Physiology B: 52:541--545.
5
CHAPTER II
MOLECULAR SYSTEMATICS OF PEROMYSCUS AND ALLIES BASED ON NUCLEAR AND
MITOCHONDRIAL DNA SEQUENCES
The genus Peromyscus (Rodentia: Muridae), described by Gloger (1841), is 1 of
the most extensively studied groups of rodents. To date, several thousand papers have
been published concerning various aspects of Peromyscus natural history, ecology,
taxonomy, classification, and systematics. Consequently, Peromyscus has been referred
to as the Drosophila of North American Mammalogy (Wilson and Reeder 1993). The
genus has undergone 3 major revisions beginning with Osgood (1909), followed by
Hooper (1968) and Carleton (1989). One of the most interesting controversies of these
revisions involves the phylogenetic and taxonomic status of the 5 subgenera
(Osgoodomys, Megadontomys, Isthmomys, Habromys, and Podomys) recognized by
Osgood (1909) and Hooper and Musser (1964) and later elevated to generic status by
Carleton (1980; 1989) based on morphological evidence.
Osgoodomys was designated as a subgenus in recognition of its divergence from
Peromyscus largely based on phallic morphology (Hooper and Musser 1964a). Later
studies by Linzey and Layne (1969) and Carleton (1980) indicated a strong divergence of
Osgoodomys from Peromyscus. Karyological data presented by Rogers et al. (1984) and
Stangl and Baker (1984) did not resolve the status of Osgoodomys, but supported an early
origin as alluded to by Hooper (1968). The biochemical studies of Fuller et al. (1984)

6
and Schmidly et al. (1985) did not support the treatment of Osgoodomys as a distant
genus.
Megadontomys was 1st diagnosed by Merriam (1898) as a subgenus of
Peromyscus containing the species thomasi and nelsoni, the latter subsequently was
subsumed under thomasi as a subspecies (Musser 1964). Osgood (1909) retained
Megadontomys as a subgenus of Peromyscus; however, ensuing morphological (Carleton
1980; Hooper 1958; Hooper and Musser 1964a; Linzey and Layne 1969) and
biochemical (Werbitsky and Kilpatrick 1987) studies supported a distinction between
Megadontomys and Peromyscus. The divergence of Megadontomys relative to other
forms of Peromyscus was proposed to have occurred early in the origin of this genus
(Carleton 1980) and that it shared a common ancestry with Isthmomys; however, this
view was not supported by karyological evidence (Rogers 1983; Rogers et al. 1984;
Stangl and Baker 1984).
Although Bangs (1902) and Osgood (1909) allocated Megadontomys flavidus to
the subgenus Megadontomys, Hooper and Musser (1964a) suggested a dichotomy existed
in Megadontomys and proposed that M. flavidus, along with Peromyscus pirrensis, be
placed into a new subgenus (Isthmomys) to reflect differences in phallic morphology.
Carleton (1980) recommended that Isthmomys be elevated to generic rank and proposed a
relationship with Megadontomys based on a suite of morphological differences.
Habromys originally was placed in the mexicanus group by Osgood (1909), but
was elevated to subgeneric rank by Hooper and Musser (1964a) based on phallic
morphology. Later, morphological studies of Linzey and Layne (1974) and Carleton
(1980) corroborated the distinction of Habromys from Peromyscus. Karyological data

7
from Rogers et al. (1984) placed H. lepturus in an unresolved clade with many other
species of Peromyscus as well as Podomys and Neotomodon. Stangl and Baker (1984)
aligned H. lepturus with P. truei and attributed the relationship to a probable convergent
event, and suggested Habromys shared an early ancestor with Podomys and Neotomodon,
a view shared by Carleton (1980).
Osgood (1909) included Podomys as a subgenus of Peromyscus based on the
reduction in size and number of the plantar tubercles. Examinations of the male
reproductive tract also served to distinguish Podomys from Peromyscus (Carleton 1980;
Hooper 1958; Hooper and Musser 1964a; Linzey and Layne 1969). Carleton (1980)
reported consistent affinities between Podomys, Habromys, and Neotomodon based on
phallic morphology and accessory reproductive glands, although Osgoodomys and
Onychomys were sometimes included depending on the type of analysis and included
taxa. Karyotypic studies have been ambivalent concerning the hypothesized relationship
of Podomys to Habromys and Neotomodon (Carleton 1989). Yates et al. (1979) included
Podomys in an unresolved tetrachotomy with 3 members of the maniculatus group, P.
gossypinus, and Neotomodon. Robbins and Baker (1981) and Rogers (1983) also aligned
Podomys with Neotomodon and other species of Peromyscus. Biochemical studies also
alluded to the distinctness of Podomys (Avis et al. 1974) and its association with
Neotomodon (Patton et al. 1981).
Despite Carleton’s (1980) recognition as a separate genus, proposals have been
made to include Neotomodon (Stangl and Baker 1984; Yates et al. 1979) and possibly
Onychomys (Stangl and Baker 1984) in the genus Peromyscus, based on karyological
evidence. Bradley et al. (2004a) investigated the phylogenetic relationships of

8
neotomine/peromyscine rodents using mitochondrial cytochrome b (Cytb) sequence data
and found that Neotomodon was placed inside of the genus Peromyscus, whereas
Onychomys was not included.
In the most current classification, Carleton (1989) divided Peromyscus (sensu
stricto) into 2 subgenera, Haplomylomys and Peromyscus. Haplomylomys contains at
least 10 species divided into 2 species groups. Recently, Riddle et al. (2000) included the
addition of P. fraterculus to Haplomylomys based on mitochondrial DNA (mtDNA)
sequence data. Carleton (1989) placed 43 of his 53 recognized species within the
subgenus Peromyscus and further subdivided these into 11 species groups. Recent
studies added P. sagax (Bradley et al. 1996), P. schmidlyi (Bradley et al. 2004b), P. keeni
(Hogan et al. 1993), and P. beatae, P. levipes (Schmidly et al. 1988).
Despite numerous studies involving various taxa of Peromyscus, there has not
been a comprehensive phylogenetic study of the genus. Not since Carleton (1980) has
there been a treatment of the genus as a whole, and there has not yet been an evaluation
of the relationships between species groups. R. D. Bradley (pers com) has developed an
overview of the genus Peromyscus based on the mitochondrial Cytb gene providing a
maternally grounded phylogeny and, in effect, producing a need for a study utilizing a
nuclear marker to provide an alternative perspective.
Specifically, a nuclear marker is needed that evolves at a rate close to that of Cytb
and is capable of elucidating species level differences. One such marker is the 2nd intron
of the alcohol dehydrogenase gene. Alcohol dehydrogenases, in mammalian systems, are
dimeric zinc-metalloenzymes that function to catalyze the oxidization of alcohols to
aldehydes or ketones (Cheung et al. 1999). Alcohol dehydrogenase has been shown to be

9
a highly polymorphic allozyme in rodents and capable of detecting species level
differences (Bradley et al. 1998). Amman et al. (In prep) has shown that intron 2 of the
class 1 alcohol dehydrogenase (Adh1-I2) is capable of detecting species level differences
in rodents. The recommended nomenclature of vertebrate alcohol dehydrogenases
(Duester et al. 1999) will be used in this study and follows the use of Adh-1 (Enzyme
Commission No. 1.1.1.1) for mice.
The primary objective of this study was to examine the classification of the genus
Peromyscus and allies by Carleton (1989) using a nuclear molecular marker.
Specifically, Adh1-I2 was used to test the boundaries of the genus Peromyscus (i.e.,
should Habromys, Megadontomys, Osgoodomys, Podomys, and Neotomodon be
included?). Second, Adh1-I2 was used to examine the phylogenetic relationships of the
species groups within the genus Peromyscus. Third, use a combined nuclear and
mitochondrial data set to examine the genus and the species groups.
MATERIALS AND METHODS
Samples.---Tissues from individuals representing the genera Peromyscus,
Habromys (H. lepturus), Megadontomys (M. thomasi), Osgoodomys (O. banderanus),
Podomys (P. floridanus), and Neotomodon (N. alstoni) were obtained from naturally
occurring populations or museum loans. At least 2 representatives of each of the species
groups within the subgenus Peromyscus were examined except the crinitus (1 sample),
furvus (no sample), and hooperi (no sample) groups. One sample each from the
californicus and eremicus groups was used to represent the subgenus Haplomylomys and
at least 1 sample from Habromys, Megadontomys, Osgoodomys, Podomys, and

10
Neotomodon was examined. An attempt was made to obtain mitochondrial and nuclear
data from a single individual. When this was not possible, sequences from samples of the
same species and from close geographic proximity were used. If attainment of samples
from close geographic proximity was not possible, another representative from the same
genus was included (See Appendix for Specimens Examined.).
DNA Isolation and PCR.---DNA was isolated from liver samples (0.1g) using 2
methods. Mitochondrial DNA was extracted and purified using a Wizard Miniprep kit
(Promega, Madison, Wisconsin). Total genomic DNA was extracted from liver using
DNeasy tissue kits (Qiagen, Valencia, California) following the method of Smith and
Patton (1999).
The complete intron 2 of the Adh1 gene (598 bp) was amplified following the
methods of Amman et al. (In prep). Specifically, PCR parameters were: 25–30 cycles
94°C (1min) denaturation, ramped from 52°C to 46°C to 52°C at 0.5°C per second
annealing, 1°C per second to 73°C (1 min 30 sec) extension, and 1-cycle of 73°C (2 min)
extention. The primers utilized in PCR reactions were 2340-I, 2340-II, and Exon II F,
(Amman et al. In prep).
The complete cytochrome-b gene (1,143 bp) was amplified with the following
polymerase chain reaction (PCR) parameters modified from Saiki et al. (1988): 30 cycles
at 95°C (1 min) denaturation, 50°C (1 min) annealing, 72°C (2 min) extension, and a
final cycle of 72°C (7 min) extention. Primers utilized in PCR reactions (MVZ05 and
H15915) were those used by Smith and Patton (1993) and Irwin et al. (1991),
respectively.

11
Sequencing.---PCR products were purified using the QIAquick PCR purification
kit (Qiagen, Valencia, California) and PCR amplicons were sequenced using ABI Prism
Big Dye Terminator v3.1 ready reaction mix (PE Applied Biosystems, Foster City,
California). Sequencher 3.0 software (Gene Codes, Ann Arbor, Michigan) was used to
align and proof nucleotide sequences. Nucleotide sequences were analyzed on an ABI
3100 Avant automated sequencer (PE Applied Biosystems, Foster City, California)
Adh1-I2 amplicons were sequenced using the PCR primers in conjunction with 2
internal primers, Adh 350F and Adh 350R (Amman et al. In prep). Cytb amplicons were
sequenced using the following 6 cycle-sequencing primers: CWE-1 and 400F (Edwards
et al. 2001), 700L and WDRAT400R (Peppers and Bradley 2000), and PERO3' and 752R
(Tiemann-Boege et al. 2000). All DNA sequences were deposited in GenBank.
Data Analysis.---Nucleotide sequence data were analyzed using the software
package PAUP* (Swofford 2002). All nucleotide positions were treated as unordered,
discrete characters with 4 possible states, A, C, G, and T, for Cyt b, and 5 possible states:
A, C, G, T, and gaps (-) for Adh. Alignment of the Adh1-I2 sequences produced
hypothesized gaps that represent insertion or deletion events. Gaps were inserted based
on primary homology assessment. Graur and Li (2000) made a distinction between 2
types of gaps, terminal and internal, and recommend that terminal gaps (incomplete
sequence) should not be included in the analysis when alignment is with a complete
homologous gene or intron sequence; therefore incomplete Adh1-I2 sequences were
excluded from these analyses. For all analyses, Hodomys alleni, Reithrodontomys
fulvescens, and Baiomys taylori were used as outgroup taxa.

12
Parsimony analyses were performed on the Adh1-I2 data using equally-weighted
characters to avoid subjectivity inherent with a priori differential weighting. The
heuristic search and tree bisection-reconnection options were used to estimate the most
parsimonious tree(s). All phylogenetically uninformative characters were excluded from
these analyses. Robustness of topologies was evaluated using bootstrap (Felsenstein
1985) and Bremer (1994) support indices (Autodecay ver.3.03, Eriksson 1997).
The maximum likelihood analysis was conducted using the HKY+G model of
nucleotide substitution identified by MODELTEST (Posada and Crandall 1998) as the
most consistent model for the data. This model generated significantly better likelihood
scores than all other models and included the following parameters: base frequencies (A
= 0.3286, C = 0.1906, G = 0.1718, T = 0.3089) and gamma distribution (Γ = 1.1324).
A Bayesian analysis (Huelsenbeck and Ronquist 2001) was conducted to estimate
an independent phylogeny for comparison to that estimated by likelihood methodologies
and to generate values (posterior probability) for nodal support. Values ≥ 95% were
viewed as supportive following Alfaro et al. (2003), Douady et al. (2003), and
Hulsenbeck et al. (2002). The GTR+I+G model of evolution was employed with an
invariant gamma distribution, un-partitioned data, 4 Markov-chains, 2 million
generations, and sample frequency every 100th generation. The number of invariable
sites and gamma distribution were estimated from the data. After a visual inspection of
likelihood scores, the 1st 100 trees were discarded and the model was rerun using the
remaining stable likelihood values. A consensus tree (50% majority rule) was
constructed from the remaining trees.

13
The Kimura 2-parameter model of evolution (Kimura 1980) was used to estimate
genetic distances. This model of evolution was chosen in order to allow comparisons
between Adh1-I2 and values generated for Peromyscus using the Cytb data set. Mean
sequence divergences were used to examine levels of genetic divergence following
criteria outlined by Bradley and Baker (2001) and to assess levels of genetic differences
between Adh1-I2 and Cytb.
Adh1-I2 and Cytb sequence data were combined into a single analysis. An
incongruence length difference (ILD) test was not performed in light of recent studies
proclaiming the test was not a good predictor of data set compatibility (Yoder et al. 2001;
Dowton and Austin 2002). Huelsenbeck et al. (1996) also states that errors in the
statistical tests may incorrectly detect heterogeneity when conflicts among the data sets
actually do not occur. Complete sequences for both Adh1-I2 and the Cytb genes were
used in all but 2 samples (P. mexicanus missing 24 bases starting at 994 and P. nudipes
missing terminal 416 bp for Cytb). The overall data set was trimmed to include a single
representative of each taxon for both the Adh1-I2 and the Cytb sequences. A
mitochondrial Cytb nucleotide sequence for Podomys TK92502 was not available.
Hodomys alleni, R. fulvescens, and B. taylori were used as the outgroup taxa. This
resulted in a combined analysis of 28 taxa (1,740 bp). MODELTEST (Posada and
Crandall 1998) identified the GTR+I+G model of evolution as the most appropriate for
this data set and included the following parameters: base frequencies (A = 0.3148, C =
0.2979, G = 0.1459, T = 0.2414), rates of substitution (A-C = 1.5961, A-G = 4.2621, A-T
= 1.7426, C-G = 0.4237, C-T = 14.2589, G-T = 1.0), proportion of invariable sites (I =
0.2784) and gamma distribution (Γ = 0.4260). A Bayesian analysis was performed with a

14
site-specific gamma distribution with the following options: 4 Markov-chains, 2 million
generations, and sample frequency every 100th generation. After a visual inspection of
likelihood scores, the 100 trees were discarded and the model was rerun using the
remaining stable likelihood values. The Cytb data were partitioned according to codon
and the Adh1-I2 data were not partitioned. A consensus tree (50% majority rule) was
constructed from the remaining trees.
RESULTS
Adh1-I2.---A parsimony analysis was performed using a heuristic search based on
76 equally weighted informative characters. This analysis produced 132 equally most-
parsimonious trees with a tree length of 141, consistency index (CI) of 0.6312, and a
retention index (RI) of 0.8045. Bootstrap analysis (20,000 iterations with the rapid
option) provided moderate to good support for the species groups. A consensus of the
132 trees (Fig. 2.1) failed to resolve the relationships among species groups within the
genus; however, taxa forming species groups were well resolved. One moderately
supported (bootstrap/Bremer = 81/4) major clade was present containing all of the
ingroup taxa. Several subclades within the major clade also were present, representing
the species groups. One exception to this was the formation of a subclade containing
both the boylii and aztecus species groups.
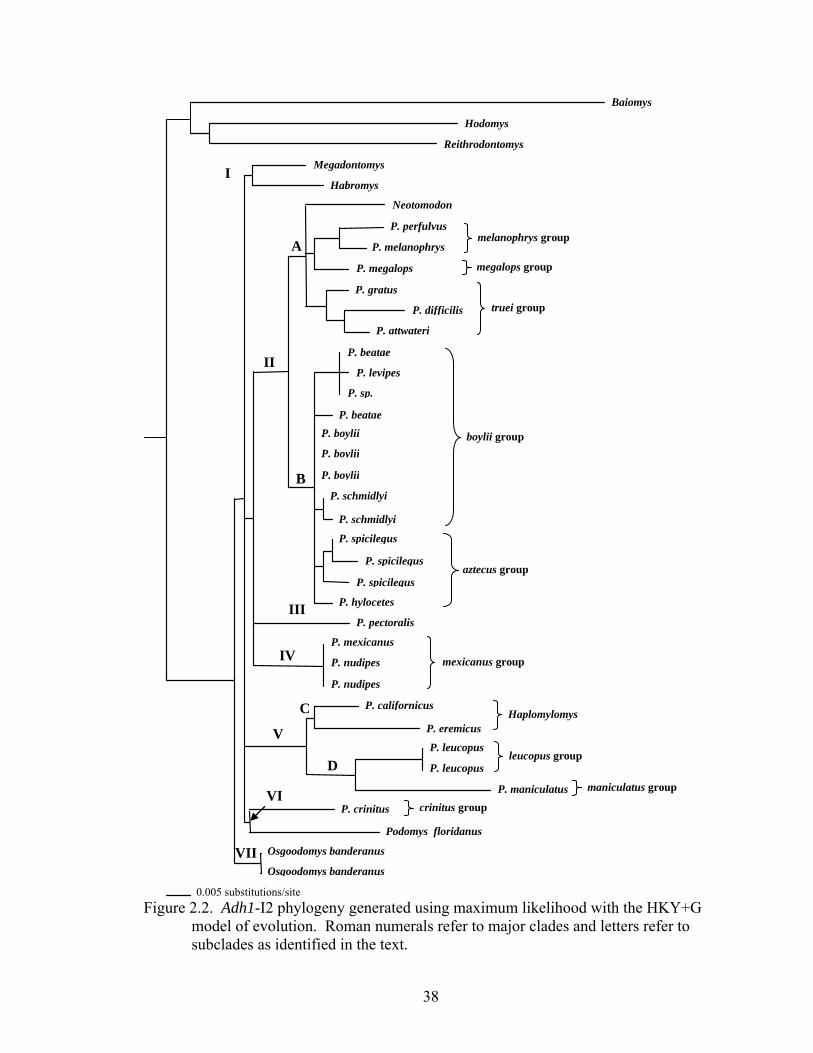
The maximum likelihood analysis produced a topology (Fig. 2.2) with 7 major
clades (I--VII) and 4 subclades (A--D). Clades I--VI were unresolved with clade VII
being basal. Clade I contained Megadontomys and Habromys. Clade II was divided into
2 subclades (A and B). Subclade A contained Neotomodon, members of the melanophrys
species group (P. perfulvus and P. melanophrys), the megalops group (P. megalops), and
15
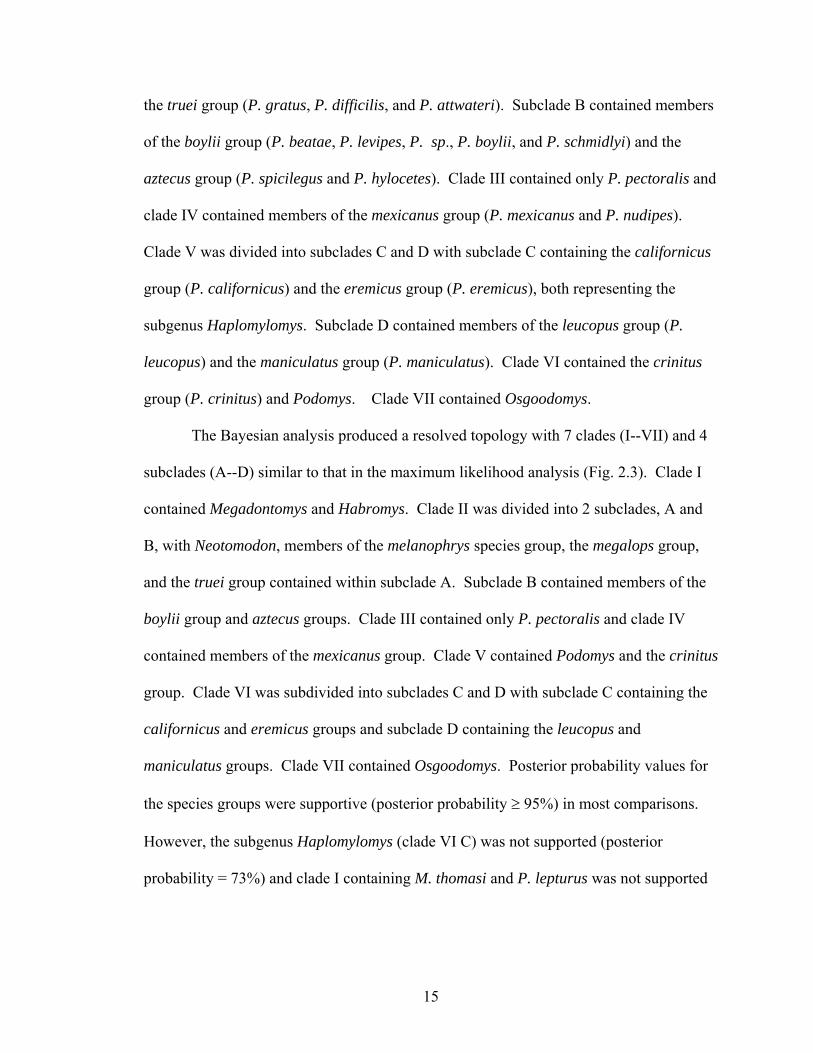
the truei group (P. gratus, P. difficilis, and P. attwateri). Subclade B contained members
of the boylii group (P. beatae, P. levipes, P. sp., P. boylii, and P. schmidlyi) and the
aztecus group (P. spicilegus and P. hylocetes). Clade III contained only P. pectoralis and
clade IV contained members of the mexicanus group (P. mexicanus and P. nudipes).
Clade V was divided into subclades C and D with subclade C containing the californicus
group (P. californicus) and the eremicus group (P. eremicus), both representing the
subgenus Haplomylomys. Subclade D contained members of the leucopus group (P.
leucopus) and the maniculatus group (P. maniculatus). Clade VI contained the crinitus
group (P. crinitus) and Podomys. Clade VII contained Osgoodomys.
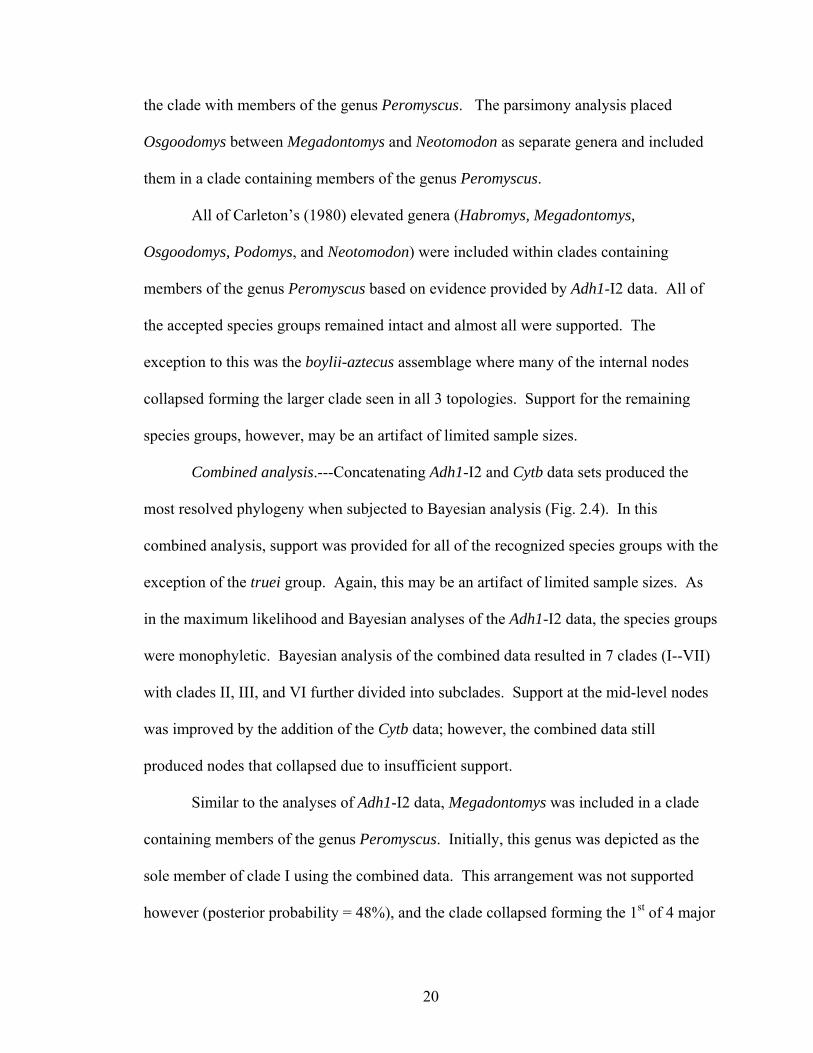
The Bayesian analysis produced a resolved topology with 7 clades (I--VII) and 4
subclades (A--D) similar to that in the maximum likelihood analysis (Fig. 2.3). Clade I
contained Megadontomys and Habromys. Clade II was divided into 2 subclades, A and
B, with Neotomodon, members of the melanophrys species group, the megalops group,
and the truei group contained within subclade A. Subclade B contained members of the
boylii group and aztecus groups. Clade III contained only P. pectoralis and clade IV
contained members of the mexicanus group. Clade V contained Podomys and the crinitus
group. Clade VI was subdivided into subclades C and D with subclade C containing the
californicus and eremicus groups and subclade D containing the leucopus and
maniculatus groups. Clade VII contained Osgoodomys. Posterior probability values for
the species groups were supportive (posterior probability ≥ 95%) in most comparisons.
However, the subgenus Haplomylomys (clade VI C) was not supported (posterior
probability = 73%) and clade I containing M. thomasi and P. lepturus was not supported

16
(posterior probability = 25%). In addition, relationships among species groups and most
of the deeper nodes were not supported.
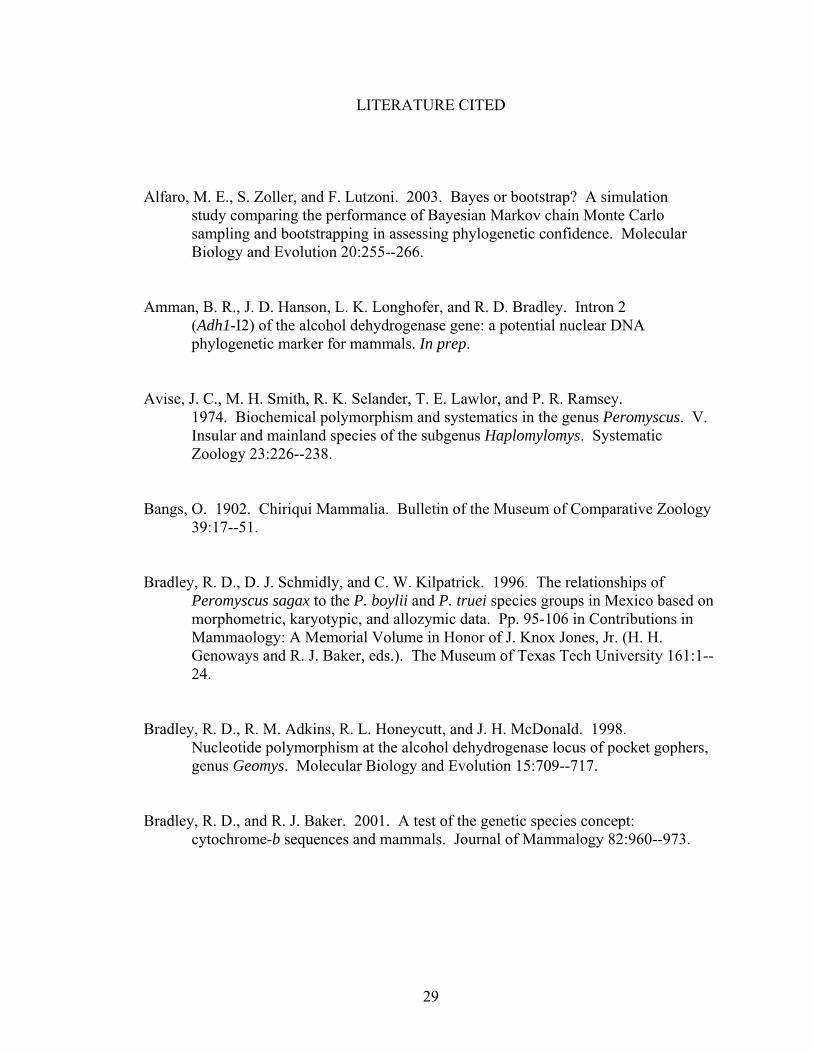
Combined Data Adh1-I2 and Cytb.---A Bayesian analysis performed on the
combined data (Adh1-I2 and Cytb) produced a topology (Fig. 2.4) with 7 major clades.
Clade I contained Megadontomys. Clade II contained 2 subclades (A and B). Subclade
A contained Neotomodon, the melanophrys group, the megalops group, and the
mexicanus group. Subclade B contained the truei group. Clade III is divided into 2
subclades (C and D) with subclade C containing members of the boylii group and
subclade D consisting of the aztecus group. Clade IV contained P. pectoralis and clade
V contained Habromys. Clade VI also was subdivided into 2 subclades (E and F) with
subclade E containing Osgoodomys and subclade F containing the subgenus
Haplomylomys, the leucopus group, and the maniculatus group. Clade VII contained the
crinitus group and was placed as the basal taxon. Nodal support was provided (posterior
probabilities ≥ 95) for subclade A, C, D, E, and F. Support also was provided for major
clade III, although major clade II was not supported (posterior probability of 91%). The
remaining clades were not supported (posterior probabilities < 95%).
Genetic Distances.---Genetic distance differences obtained (Table 2.1) ranged
from 0.0% between 2 samples of P. boylii to 10.96% between B. taylori and the genus
Peromyscus (sensu stricto). Pairwise comparisons among the genus Peromyscus,
outgroups, and the 5 genera in question ranged from 2.64% (Osgoodomys versus
Peromyscus) to 10.96% (B. taylori versus Peromyscus). Comparisons among R.
fulvescens and the 5 genera of interest ranged from 6.11% (Osgoodomys) to 8.35%

17
(Podomys). Comparisons between the 5 genera ranged from 1.99% (Megadontomys
versus Osgoodomys) to 4.18% (Neotomodon versus Podomys).
DISCUSSION
Adh1-I2.---Parsimony, maximum likelihood, and Bayesian analyses all produced
similar topologies that lacked support for mid-level nodes. In the parsimony analysis, all
mid-level clades collapsed forming 1 large clade (bootstrap/Bremer = 81%/4) with
several smaller subclades. Bayesian and maximum likelihood analyses produced similar
topologies and contained many unsupported nodes resulting in an unresolved topology.
The unresolved topologies are the result of too few informative characters associated with
the Adh1-I2 marker. The 76 informative characters provided sparse material for the
estimation of the topologies based solely on Adh1-I2.
Habromys and Megadontomys (clade I) were placed as sister taxa in both
maximum likelihood and Bayesian analyses; however, support values (posterior
probability = 25%) refute this association. Habromys and Megadontomys were
unresolved in the parsimony analysis, but both were contained within a large polytomy
with members of the genus Peromyscus.
Both maximum likelihood and Bayesian analyses placed members of the
melanophrys, megalops, and truei species groups and Neotomodon with members of the
boylii and aztecus groups into a supported clade (clade II, posterior probability = 100%)
that was subdivided into 2 subclades (A and B). Maximum likelihood and Bayesian
analyses associated members of the melanophrys, megalops, and truei species groups and
Neotomodon (clade II A), although lack of support refutes this association (posterior
probability = 83%). Support for the relationship between the melanophrys and megalops

18
species groups was present (posterior probability = 96%) in the Bayesian analysis, as was
the support for the truei species group (posterior probability = 96%). The parsimony
analysis grouped the melanophrys, megalops, and truei species groups, but excluded
Neotomodon. The relationship between the melanophrys and megalops species groups
received little support with the parsimony analysis (bootstrap/Bremer = 60%/1), but
support for the truei group was moderately high (bootstrap/Bremer = 86%/2).
Both maximum likelihood and Bayesian analyses placed members of the boylii
and aztecus species groups into a single clade (subclade II B, posterior probability =
100%). The Bayesian analysis separated the 2 groups but support for the topology was
insufficient and the clades collapsed. One sample of P. boylii was placed in the aztecus
group in the Bayesian analysis tree as sister to P. hylocetes, but without any support
(posterior probability = 7%). This may be indicative of a close relationship between the
boylii and aztecus species groups. Parsimony analysis also grouped the boylii and
aztecus species groups into 1 supported subclade (bootstrap/Bremer = 90%/2).
Peromyscus pectoralis (clade III) was depicted basal to the assemblage containing
the melanophrys, megalops, truei, boylii, and aztecus species groups in both maximum
likelihood and the Bayesian analysis. However, support for this arrangement was lacking
(posterior probability = 36%). In both instances, P. pectoralis grouped closer to the
boylii and aztecus assemblage, but the lack of support does not allow for any meaningful
inferences concerning the placement of P. pectoralis. Parsimony analysis placed P.
pectoralis between the truei and boylii groups, again in a clade by itself, further
elucidating the uniqueness of this species.

19
Both maximum likelihood and the Bayesian analysis placed the mexicanus group
(clade IV) basal to P. pectoralis, whereas the parsimony analysis placed it basal to the
boylii-aztecus assemblage. Due to the lack of support in the Bayesian analysis (posterior
probability = 53%), this relationship does not hold. Support for the species group
however, is present (posterior probability = 100%) as it is in the parsimony analysis
(bootstrap/Bremer = 100%/8).
P. crinitus and Podomys were depicted as sister in the Bayesian analysis (clade V)
but this arrangement was unsupported (posterior probability = 14%) negating the inferred
sister relationship. The subgenus Haplomylomys (californicus and eremicus species
groups) and members of the leucopus and maniculatus groups form 2 subclades (C and
D, respectively) in clade VI. The sister alignment between Haplomylomys and the
leucopus-maniculatus clade was supported (posterior probability = 100%) indicating a
close relationship, but the clade containing Haplomylomys was not supported (posterior
probability = 73%) and collapsed forming a polytomy with the supported leucopus-
maniculatus clade (posterior probability = 100%). Maximum likelihood produced the
same scenario, but with the clades reversed so that clade V contained Haplomylomys and
the leucopus and maniculatus species groups and clade VI contained P. crinitus and
Podomys aligned as sister taxa. The parsimony analysis also placed Haplomylomys with
the leucopus and maniculatus species groups (bootstrap/Bremer = 85%/2).
Osgoodomys was placed basal to the genus Peromyscus (clade VII) in both the
Bayesian and maximum likelihood analyses. In both instances, Osgoodomys was
positioned outside the genus Peromyscus, however, support for this arrangement in the
Bayesian analysis is poor (posterior probability = 57%), thus including Osgoodomys in
20
the clade with members of the genus Peromyscus. The parsimony analysis placed
Osgoodomys between Megadontomys and Neotomodon as separate genera and included
them in a clade containing members of the genus Peromyscus.
All of Carleton’s (1980) elevated genera (Habromys, Megadontomys,
Osgoodomys, Podomys, and Neotomodon) were included within clades containing
members of the genus Peromyscus based on evidence provided by Adh1-I2 data. All of
the accepted species groups remained intact and almost all were supported. The
exception to this was the boylii-aztecus assemblage where many of the internal nodes
collapsed forming the larger clade seen in all 3 topologies. Support for the remaining
species groups, however, may be an artifact of limited sample sizes.
Combined analysis.---Concatenating Adh1-I2 and Cytb data sets produced the
most resolved phylogeny when subjected to Bayesian analysis (Fig. 2.4). In this
combined analysis, support was provided for all of the recognized species groups with the
exception of the truei group. Again, this may be an artifact of limited sample sizes. As
in the maximum likelihood and Bayesian analyses of the Adh1-I2 data, the species groups
were monophyletic. Bayesian analysis of the combined data resulted in 7 clades (I--VII)
with clades II, III, and VI further divided into subclades. Support at the mid-level nodes
was improved by the addition of the Cytb data; however, the combined data still
produced nodes that collapsed due to insufficient support.
Similar to the analyses of Adh1-I2 data, Megadontomys was included in a clade
containing members of the genus Peromyscus. Initially, this genus was depicted as the
sole member of clade I using the combined data. This arrangement was not supported
however (posterior probability = 48%), and the clade collapsed forming the 1st of 4 major

21
groups. Maximum likelihood and Bayesian analysis showed Megadontomys sister to
Habromys using only Adh1-I2 data, but that relationship was not supported either
(posterior probability = 25%). Therefore, the only conclusion that could be extrapolated
from the analysis of the combined data, as well as the Adh1-I2 data, was that
Megadontomys was included in an unresolved polytomy with members of the genus
Peromyscus. Megadontomys traditionally has been aligned with Isthmomys (Carleton
1980) but due to the lack of an Isthmomys sample, Carleton’s (1980) alignment of
Megadontomys and Isthmomys could not be tested using Adh1-I2. Including
Megadontomys in the genus Peromyscus does, however, agree with the findings of
Rogers et al. (1983) who included Megadontomys in a clade with Neotomodon, Podomys,
and some members of the subgenus Peromyscus. Rogers et al. (1984) later included
Megadontomys in the genus Peromyscus based on karyological data.
Neotomodon was grouped with members of the melanophrys, megalops, and
mexicanus groups (clade II A) with support (posterior probability = 97%) indicating a
close relationship. These results differed from those of Carleton (1980), who reported
Neotomodon consistently uniting with Habromys and Podomys. Stangl and Baker (1984)
however, placed Neotomodon with the truei group, which agrees somewhat with the
topology produced by the combined data and with the topology produced using only
Adh1-I2 data. Yates et al. (1979) and Stangl and Baker (1984) proposed the inclusion of
Neotomodon in the genus Peromyscus and Bradley et al. (2004a) included Neotomodon
in Peromyscus based on mitochondrial Cytb sequence data. Both the Adh1-I2 and the
combined data in this study support the inclusion of Neotomodon in the genus
Peromyscus.

22
The relationships among the species groups in clade II A were supported except
for the sister relationship of the megalops group to the melanophrys group (posterior
probability = 90%). The addition of the Cytb data depicted the mexicanus group as sister
to the melanophrys and megalops groups (posterior probability = 97%) whereas it was
placed sister to pectoralis using only Adh1-I2 data and not supported (posterior
probability = 35%). This arrangement is indicative of a close relationship between these
species groups. Stangl and Baker (1984) placed the melanophrys group with 6 species of
the mexicanus group using karyological data, but their arrangement also included P.
pectoralis.
The relationship of the members of clade II A and members of the truei species
group (clade II B) was not supported (posterior probability = 91%). The sister
relationship between P. difficilis and P. attwateri was supported (posterior probability =
100%), but not their relationship to P. gratus (posterior probability = 88%) differing from
the analyses using only Adh1-I2 data, where the truei group was supported (posterior
probability = 96%, bootstrap/Bremer = 86%/2). This was the only species group not
supported and is suggestive of a division within the truei species group. This division was
in agreement with Tiemann-Boege et al. (2000) in their recognition of a difficilis
assemblage and a truei assemblage within the truei species group. Durish et al. (2004)
also identified a subdivision between a gratus and truei assemblage and a difficilis,
attwateri, and nasutus assemblage, and suggested that the latter assemblage include P.
pectoralis.
Members of the boylii group (clade III C) were again placed with members of
the aztecus group (clade III D). The sister relationship between the boylii and the aztecus

23
groups remained constant throughout all analyses and was supported in the combined
analysis (posterior probability = 100%). This suggests a close relationship between these
2 groups and clade probability values for each group (posterior probability = 100%)
support Carleton’s (1989) recognition of the aztecus species group as distinct from the
boylii species group. Tiemann-Boege et al. (2000) reported an average sequence
divergence for Cytb between the boylii and aztecus groups of 11.1%, whereas the
sequence divergence between boylii and truei was 13.2% and aztecus and truei was
13.6%, also indicating a close relationship between boylii and aztecus. The relationships
within these groups also were supported with the exception of the placement of P.
schmidlyi sister to a clade containing P. beatae and P. levipes (posterior probability =
88%).
Similar to the analysis of just the Adh1-I2 marker, the analysis of the combined
data places P. pectoralis (clade IV) outside of Neotomodon, the melanophrys, megalops,
mexicanus, truei, boylii, and aztecus species groups. Even though it was not supported
(posterior probability = 84%), a pattern has emerged throughout this investigation
suggesting pectoralis may not be as closely associated with the truei group as once
thought (Durish et al. 2004; Tiemann-Boege et al. 2000) and may be distinct enough to
justify the designation of its own species group. Support for such a designation has not
been provided to date but further investigation of this problematic genus is certainly
warranted. Because the support for clade IV was lacking, it collapsed into clade V, and
with clades II and III, would form the 2nd major group.
Habromys (clade V) was placed basal to P. pectoralis and the rest of the 2nd major
group with support (posterior probability = 98%). Bayesian and maximum likelihood

24
analyses of only Adh1-I2 data grouped Habromys with Megadontomys with no support
(posterior probability = 25%). Analyses of the combined data clearly placed Habromys
well within the boundaries of the genus Peromyscus. Carleton (1980) grouped Habromys
with Neotomodon as well as Podomys, and in a study by Rogers et al. (1984), Habromys
was placed sister to Neotomodon.
The combined analysis grouped Osgoodomys (clade VI E) with the californicus,
eremicus, leucopus, and maniculatus groups (clade VI F) with support (posterior
probability = 98%). Similar to Habromys, Osgoodomys was placed within the genus
Peromyscus based on the analysis of the combined data. Maximum likelihood and
Bayesian analyses of the Adh1-I2 data placed Osgoodomys basal to the genus
Peromyscus, whereas parsimony analysis of Adh1-I2 placed Osgoodomys between
Megadontomys and Neotomodon in a clade containing members of the genus
Peromyscus. These results disagree with the morphological data supporting the
distinctness of Osgoodomys (Carleton 1980; Hooper 1958; Hooper and Musser 1964;
Linzey and Layne 1969). Karyological data (Rogers et al. 1984; Stangl and Baker 1984)
do not support or refute Carleton’s (1980) elevation of Osgoodomys to generic status,
however, Schmidly et al. (1985) found that Osgoodomys clustered with the mexicanus
group based on biochemical evidence.
Another consistency among all of the analyses was the sister relationship between
the leucopus and maniculatus groups and their association with the californicus and
eremicus groups. Similar to the Adh1-I2 data, the combined Bayesian analysis showed
support for this arrangement (posterior probability = 100%). In addition, the clades

25
representing the subgenus Haplomylomys (posterior probability = 97%) and the leucopus
and maniculatus groups (posterior probability = 100%) were supported.
The crinitus group (clade VII) was placed basal to the genus, but support for this
arrangement was lacking (posterior probability = 81%) and inferences could not be made.
The crinitus group consistently was associated with Haplomylomys and the leucopus and
maniculatus groups in all analyses. It also has been grouped with Podomys, but a
nucleotide sequence for Cytb was unavailable preventing a test of this relationship with
the combined data. Osgood (1909) initially favored the allocation of crinitus to the
subgenus Haplomylomys but subsequent morphological studies retained it within the
subgenus Peromyscus (Hooper 1958; Linzey and Layne 1969). Zimmerman et al. (1978)
and Schmidly et al. (1985) aligned crinitus with members of the maniculatus group using
allozyme data. Greenbaum and Baker (1978) reported crinitus possessing chromosomal
banding identical to that of the ancestral condition. The placement of the crinitus group
in the combined analysis is in agreement with previous treatments of this species group
but the poor nodal support does not allow for any substantial inferences to be made at this
time. Because of the lack of support for the node forming clades VI and VII it collapsed
and formed of the 3rd major group containing Osgoodomys, Haplomylomys and the
leucopus and maniculatus groups, and the 4th major group containing only P. crinitus.
Concatenating Adh1-I2 and Cytb sequences clearly provided the best resolution
and support concerning the placement of Neotomodon, Habromys, and Osgoodomys.
Neotomodon was grouped with the melanophrys, megalops, and mexicanus complex and
was supported as being contained within the genus Peromyscus using the combined data.
Parsimony, maximum likelihood, and Bayesian analyses of Adh1-I2 also supported the

26
inclusion of Neotomodon in the genus Peromyscus. Habromys was supported as being
contained within the genus based on the evidence provided by the combined data. At the
very least, it was contained in a clade with other members of Peromyscus. Osgoodomys
was also contained within the boundaries of the genus Peromyscus based on the
combined data. Bayesian analysis of Adh1-I2 showed Podomys contained within the
genus Peromyscus, but the lack of informative characters would not allow for inferences
to be made concerning the placement of Podomys.
All 4 genera (Megadontomys, Habromys, Neotomodon, and Osgoodomys) were
included in a clade containing members of the genus Peromyscus with support (posterior
probability = 100%), however, support for the exact placement of Megadontomys within
the genus waned and inferences concerning relationships between this genus and other
members of the genus Peromyscus could not be made with any degree of certainty.
Genetic Distances.---Mean genetic divergences obtained from pairwise
comparisons of Adh1-I2 sequence divergence (Table 3.1) values indicate that
Megadontomys, Habromys, Neotomodon, Podomys, and Osgoodomys are more closely
associated with Peromyscus than Reithrodontomys, believed to be the closest relative of
the genus Peromyscus (Carleton 1980). Average divergence values ranged from 2.64%
(Osgoodomys versus Peromyscus) to 4.61% (Podomys versus Peromyscus), whereas
Reithrodontomys versus Peromyscus was 7.85% divergent. Comparisons with Cytb also
indicate a closer relationship between the 5 genera and Peromyscus than
Reithrodontomys and Peromyscus. Values for Cytb ranged from 13.26% (Neotomodon
versus Peromyscus) to 14.96% (Osgoodomys versus Peromyscus) compared to 17.23%
between Reithrodontomys and Peromyscus. Comparisons of Adh1-I2 sequence

27
divergence values were made between Megadontomys, Habromys, Neotomodon,
Podomys, and Osgoodomys and selected species within the genus Peromyscus. The
average sequence divergence ranged from 1.61% (Osgoodomys versus P. boylii) to
7.10% (Podomys versus P. maniculatus). Comparable values for Cytb ranged from
13.02% (Megadontomys versus P. boylii) to 15.10% (Osgoodomys versus P.
maniculatus). Comparisons of average sequence divergences for Adh1-I2 between
Reithrodontomys, P. boylii, and P. maniculatus were 7.10% and 9.30%, respectively.
Similar comparisons for Cytb were 16.87% and 16.56%, respectively. Based on average
genetic distance values, Megadontomys, Habromys, Neotomodon, Podomys, and
Osgoodomys are clearly more similar to Peromyscus than Reithrodontomys is to
Peromyscus.
Taxonomic Conclusions.---Despite the morphological evidence presented by
Carleton (1980), retaining the generic status of Neotomodon, Habromys, and
Osgoodomys, would require the elevation of several more species or species groups to
generic status. For example, if Neotomodon were to retain its generic rank, evidence
provided by the combined data analysis would necessitate the distinction of the
melanophrys, megalops, mexicanus, and truei groups as separate genera. In addition, the
boylii and aztecus groups would also constitute a separate genus. This also is true for
Habromys. Because of its basal position in the clade containing Neotomodon, and the
melanophrys, megalops, mexicanus, truei, boylii, and aztecus groups, everything outside
of that arrangement would constitute a separate genus including the leucopus,
maniculatus, and crinitus groups. The retention of the generic rank of Osgoodomys
would necessitate the elevation to generic rank of members of Haplomylomys, the

28
leucopus, maniculatus, and crinitus groups. Megadontomys and Podomys were not
supported as being contained within the genus Peromyscus, however, the average
sequence divergence between these 2 genera and the genus Peromyscus suggest they are
more similar to species groups within Peromyscus. Therefore, based on the molecular
evidence presented here, it seems best to treat Megadontomys, Habromys, Neotomodon,
Podomys, and Osgoodomys as subgenera within the genus Peromyscus.
Although Adh1-I2 provided some indication of the nature of the relationships
between the 5 genera in question and the genus Peromyscus, there were too few
characters to provide resolution at the mid-level nodes, thus a clear representation of the
relationships between those individuals contained within the boundaries of the genus was
not obtained. The addition of the Cytb data bolstered the Adh1-I2 data and provided
support for the inclusion of Neotomodon, Habromys, and Osgoodomys in the genus
Peromyscus. However, the combined data were still unable to provide a fine scale
resolution and therefore, unable to provide definitive information concerning
relationships within the boundaries of the genus.
29
LITERATURE CITED
Alfaro, M. E., S. Zoller, and F. Lutzoni. 2003. Bayes or bootstrap? A simulation study comparing the performance of Bayesian Markov chain Monte Carlo
sampling and bootstrapping in assessing phylogenetic confidence. Molecular Biology and Evolution 20:255--266.
Amman, B. R., J. D. Hanson, L. K. Longhofer, and R. D. Bradley. Intron 2 (Adh1-I2) of the alcohol dehydrogenase gene: a potential nuclear DNA phylogenetic marker for mammals. In prep.
Avise, J. C., M. H. Smith, R. K. Selander, T. E. Lawlor, and P. R. Ramsey. 1974. Biochemical polymorphism and systematics in the genus Peromyscus. V. Insular and mainland species of the subgenus Haplomylomys. Systematic Zoology 23:226--238.
Bangs, O. 1902. Chiriqui Mammalia. Bulletin of the Museum of Comparative Zoology 39:17--51.
Bradley, R. D., D. J. Schmidly, and C. W. Kilpatrick. 1996. The relationships of Peromyscus sagax to the P. boylii and P. truei species groups in Mexico based on morphometric, karyotypic, and allozymic data. Pp. 95-106 in Contributions in Mammaology: A Memorial Volume in Honor of J. Knox Jones, Jr. (H. H. Genoways and R. J. Baker, eds.). The Museum of Texas Tech University 161:1-- 24.
Bradley, R. D., R. M. Adkins, R. L. Honeycutt, and J. H. McDonald. 1998. Nucleotide polymorphism at the alcohol dehydrogenase locus of pocket gophers, genus Geomys. Molecular Biology and Evolution 15:709--717.
Bradley, R. D., and R. J. Baker. 2001. A test of the genetic species concept: cytochrome-b sequences and mammals. Journal of Mammalogy 82:960--973.

30
Bradley, R. D., C. W. Edwards, D. S. Carroll, and C. W. Kilpatrick. 2004a. Phylogenetic relationships of Neotomine-Peromyscine rodents: based on DNA sequences from the mitochondrial cytochrome b gene. Journal of Mammalogy 85:389--395.
Bradley R. D., D. S. Carroll, M. L. Haynie, R. M. Martinez, M. J. Hamilton, and C. W. Kilpatrick. 2004b. A new species of Peromyscus from western Mexico. Journal of Mammalogy 85:1184--1193.
Bremer, K. 1994. Branch support and tree stability. Cladistics 10:295--304.
Carleton, M. D. 1980. Phylogenetic relationships in neotomine-peromyscine rodents (Muroidea) and a reappraisal of the dichotomy within New World Cricetinae. Miscellaneous Publications, Museum of Zoology, University of Michigan 157:1-- 146.
Carleton, M. D. 1989. Systematics and evolution. Pp. 7-141 in Advances in the study of Peromyscus (Rodentia) (G. L. Kirkland, Jr. and J. N. Layne, eds.). Texas Tech
University Press, Lubbock, 366 pp.
Cheung, B., R. S. Holmes, S. Esteal, and I. R. Beacham. 1999. Evolution of class I alcohol dehydrogenase genes in catarrhine primates: gene conversion, substitution rates, and gene regulation. Molecular Biology and Evolution 16:23--36.
Douady, C. J., F. Delsuc, Y. Boucher, W. F. Doolittle, and E. J. P. Douzery. 2003. Comparisons of Bayesian and maximum likelihood bootstrap measures of phylogenetic reliability. Molecular Biology and Evolution 20:248--254.
Dowton, M., and A. D. Austin. 2002. Increased congruence does not necessarily indicate increased phylogenetic accuracy – the behavior of the incongruence length difference test in mixed-model analyses. Systematic Biology 51:19--31.
Duester, G., J. Farres, M. R. Feldér, R. S. Holms, J. Höög, X. Parés, B. V. Plapp, S. Yin and H. Jörnvall. 1999. Recommended nomenclature for the vertebrate alcohol dehydrogenase gene family. Biochemical Pharmicology 58:389--395.
Durish, N. D., K. E. Halcomb, C. W. Kilpatrick, and R. D. Bradley. 2004.

31
Molecular systematics of the Peromyscus truei species group. Journal of Mammalogy 85: 1160--1169.
Edwards, C. W., C. F. Fulhorst, and R. D. Bradley. 2001. Molecular phylogenetics of the Neotoma albigula species group: further evidence of a paraphyletic assemblage. Journal of Mammalogy 82:267--279.
Edwards, C. W., and R. D. Bradley. 2001. Molecular phylogenetics of the Neotoma floridana species group. Journal of Mammalogy 82:791--798.
Eriksson, T. 1997. Autodecay, version 3.03, Botaniska Institution, Stockholm University, Stockholm.
Felsenstein, J. 1985. Confidence limits on phylogenies: an approach using the bootstrap. Evolution 39:783--791.
Fuller, F., M. R. Lee, and L. R. Maxson. 1984. Albumin evolution in Peromyscus and Sigmodon. Journal of Mammalogy 65:466--473.
Gloger, C. W. L. 1841. Gemeinnuetziges Hand-und Hilfsbuch der Naturgeschichte 1:95.
Graur, D., and W. Li. 2000. Fundamentals of molecular evolution. Sinauer Associates Inc., Massachusetts.
Greenbaum, I. F., and R. J. Baker. 1978. Determination of the primitive karyotype of Peromyscus. Journal of Mammalogy 59:820--854.
Hogan, K. M., M. C. Hedin, H. S. Koh, S. K. Davis, and I. F. Greenbaum. 1993. Systematic and taxonomic implications of karyotypic, electrophoretic, and mitochondrial-DNA variation in Peromyscus from the Pacific Northwest. Journal of Mammalogy 74:819--831.
Hooper, E. T. 1958. The male phallus in mice of the genus Peromyscus. Miscellaneous Publications, Museum of Zoology, University of Michigan 105:1--24.

32
Hooper, E. T. 1968. Classification. Pp. 27-74 in Biology of Peromyscus (Rodentia) (J. A. King, ed.). Special Publication, The American Society of Mammalogists 2:1-- 593.
Hooper, E. T., and G. G. Musser. 1964. The glans penis in Neotropical cricetines (Family Muridae) with comments on classification of muroid rodents. Miscellaneous Publications, Museum of Zoology, University of Michigan 123:1-- 57.
Huelsenbeck, J. P., J. J. Bull, and C. W. Cunningham. 1996. Combining data in phylogenetic analysis. Trends in Ecology and Evolution 11:152--158.
Huelsenbeck, J. P., and F. Ronquist. 2001. Mr. Bayes: Bayesian inference of phylogeny. Bioinformatics 17:754--755.
Huelsenbeck, J. P., B. Larget, R. E. Miller, and F. Ronquist. 2002. Potential applications and pitfalls of Bayesian inference of phylogeny. Systematic Biology 51:673--688.
Irwin, D. M., T. D. Kocher, and A. C. Wilson. 1991. Evolution of the cytochrome b gene in mammals. Journal of Molecular Evolution 2:37--55.
Kimura, M. 1980. A simple method for estimating evolutionary rate of base substitutions through comparative studies of nucleotide sequences. Journal of Molecular Evolution 16:111--120.
Linzey, A. V., and J. N. Layne. 1969. Comparative morphology of the male reproductive tract in the rodent genus Peromyscus (Muridae). American Museum Novitates 2355:1--47.
Linzey, A. V., and J. N. Layne. 1974. Comparative morphology of spermatozoa of the rodent genus Peromyscus (Muridae). American Museum Novitates 2532:1--20.
Merriam, C. H. 1898. Descriptions of twenty new species and a new subgenus of Peromyscus from Mexico and Guatamala. Proceedings of the Biological Society of Washington 12:115--125.

33
Musser, G. G. 1964. Notes on geographic distribution, habitat, and taxonomy of some Mexican mammals. Occasional Papers, Museum of Zoology, The University of Michigan 636:1--22.
Osgood, W. H. 1909. Revisions of the mice of the American genus Peromyscus. North American Fauna 28:1--285.
Patton, J. C., R. J. Baker, and J. C. Avise. 1981. Phenetic and cladistic analyses of biochemical evolution in peromyscine rodents. Pp. 288--308, in Mammalian population genetics (M. H. Smith and J. Joule eds.). University of Georgia Press, Athens, 380 pp.
Peppers, L. L., and R. D. Bradley. 2000. Cryptic speciation in Sigmodon hispidus: evidence from DNA sequences. Journal of Mammalogy 81:332--343.
Posada, D., and K. A. Crandall. 1998. Modeltest: testing the model of DNA substitution. Bioinformatics 14:817--818.
Riddle, B. R., D. J. Hafner, and L. F. Alexander. 2000. Phylogeography and systematics of the Peromyscus eremicus species group and the historical biogeography of North American warm regional deserts. Molecular Phylogenetics and Evolution. 17:145--160.
Robbins, L. W., and R. J. Baker. 1981. An assessment of the nature of rearrangements in eighteen species of Peromyscus (Rodentia: Cricetidae). Cytogenetics and Cell Genetics 31:194--202.
Rogers, D. S. 1983. Phylogenetic affinities of Peromyscus (Megadontomys) thomasi: Evidence from differentially stained chromosomes. Journal of Mammalogy 64:617--623.
Rogers, D. S., I. F. Greenbaum, S. J. Gunn, and M. D. Engstrom. 1984. Cytosystematic value of chromosomal inversion data in the genus Peromyscus. Journal of Mammalogy 65:457--465.

34
Saiki, R. K., D. H. Gelfand, S. Stoeffl, S. J. Scharf, R. Higuchi, G. T. Horn, K. B. Mullis, and H. A. Erlich. 1988. Primer-directed enzymatic amplification of DNA with a thermostable DNA polymerase. Science 239:487--491.
Schmidly, D. J., M. R. Lee, W. S. Modi, and E. G. Zimmerman. 1985. Systematics and notes on the biology of Peromyscus hooperi. Occasional Papers, Museum of Texas Tech University 97:1--40.
Schmidly, D. J., R. D. Bradley, and P. S. Cato. 1988. Morphometric differentiation and taxonomy of three chromosomally characterized groups of Peromyscus boylii from east-central Mexico. Journal of Mammalogy 70:603--608.
Smith, M. F., and J. L. Patton. 1993. The diversification of South American rodents: evidence from mitochondrial sequence data for the akodontine tribe. Biological Journal of the Linnean Society 50:149--177.
Stangl, F. B., and R. J. Baker. 1984. Evolutionary relationships in Peromyscus: Congruence in chromosomal, genic, and classical data sets. Journal of Mammalogy 65:643--654.
Swofford, D. L. 2002. PAUP*: Phylogenetic Analysis Using Parsimony (* and other methods), Version 4.0b10, Sinauer Associates, Sunderland, Massachusetts.
Tiemann-Boege, I., C. W. Kilpatrick, D. J. Schmidly, and R. D. Bradley. 2000. Molecular phylogenetics of the Peromyscus boylii species group (Rodentia: Muridae) based on mitochondrial cytochrome b sequences. Molecular Phylogenetics and Evolution 16:366--378.
Werbitsky, D., and C. W. Kilpatrick. 1987. Genetic variation and genetic differentiation among allopatric populations of Megadontomys. Journal of Mammalogy 68:305--312.
Wilson, D. E., and D. A. M. Reeder. 1993. Mammal species of the world. Smithsonian Institution Press, Washington D. C.
Yates, T. L., R. J. Baker, and R. K. Barnett. 1979. Phylogenetic analysis of karyological variation in three genera of peromyscine rodents. Systematic
35
Zoology 28:40--48.
Yoder, A. D., J. A. Irwin, and B. A. Payseur. 2001. Failure of the ILD to determine data compatibility for slow loris phylogeny. Systematic Biology 50:408--424.
Zimmerman, E. G., C. W. Kilpatrick, and B. J. Hart. 1978. The genetics of speciation in the rodent genus Peromyscus. Evolution 32:565--579.

36
Table 2.1. Average Kimura 2-parameter genetic distances for selected comparisons of taxa examined in this study. Genetic distances are based on sequences from the 2nd intron of the nuclear alcohol dehydrogenase (Adh1-I2) and mitochondrial cytochrome b (Cytb) genes. ------------------------------------------------------------------------------------------------------------ Taxon Adh1-I2 Cytb ------------------------------------------------------------------------------------------------------------ R. fulvescens versus Megadontomys 0.07165 0.16707 R. fulvescens versus Osgoodomys 0.06119 0.17209 R. fulvescens versus Neotomodon 0.08308 0.16406 R. fulvescens versus Podomys 0.08353 0.18386 R. fulvescens versus Habromys 0.07496 0.16707 Megadontomys versus Osgoodomys 0.01999 0.15152 Megadontomys versus Neotomodon 0.03843 0.14319 Megadontomys versus Podomys 0.03871 ---------- Megadontomys versus Habromys 0.0255 0.16002 Osgoodomys versus Neotomodon 0.03069 0.15386 Osgoodomys versus Podomys 0.03276 ---------- Osgoodomys versus Habromys 0.02158 0.14984 Neotomodon versus Podomys 0.04183 ---------- Neotomodon versus Habromys 0.03249 0.12877 Podomys versus Habromys 0.04025 ---------- B. taylori versus Peromyscus 0.10958 0.17197 H. alleni versus Peromyscus 0.08399 0.20712 R. fulvescens versus Peromyscus 0.07847 0.17232 Megadontomys versus Peromyscus 0.03341 0.13721 Neotomodon versus Peromyscus 0.03396 0.13264 Podomys versus Peromyscus 0.04606 ---------- Osgoodomys versus Peromyscus 0.02636 0.14956 Habromys versus Peromyscus 0.03687 0.13871 Megadontomys versus P. boylii 0.02362 0.13025 Megadontomys versus P. maniculatus 0.06146 0.13935 Osgoodomys versus P. boylii 0.01612 0.13948 Osgoodomys versus P. maniculatus 0.05714 0.15094 Neotomodon versus P. gratus 0.02330 0.12588 Neotomodon versus P. maniculatus 0.06277 0.14224 Podomys versus P. boylii 0.03839 ---------- Podomys versus P. maniculatus 0.07091 ---------- Habromys versus P. boylii 0.02341 0.13336 Habromys versus P. maniculatus 0.06097 0.14689 Reithrodontomys versus P. boylii 0.07102 0.16870 Reithrodontomys versus P. maniculatus 0.09290 0.16558

37
Figure 2.1. Strict consensus tree representing 132 equally parsimonious trees obtained from a parsimony analysis of unweighted DNA sequence characters from
Adh1-I2. Numbers above branches indicate bootstrap values and numbers below branches refer to Bremer support values.
Baiomys taylori
Hodomys alleni
Reithrodontomys fulvescens
Megadontomys thomasi
Osgoodomys banderanus
Osgoodomys banderanus
Neotomodon alstoni
P. californicus
P. eremicus
P. leucopus
P. leucopus
P. maniculatus
P. crinitus
Podomys floridanus
P. perfulvus
P. melanophrys
P. megalops
P. gratus
P. difficilis
P. attwateri
P. pectoralis
P. beatae
P. levipes
P. sp
P. beatae
P. boylii
P. boylii
P. boylii
P. schmidlyi
P. schmidlyi
P. spicilegus
P. spicilegus
P. spicilegus
P. hylocetes
P. mexicanus
P. nudipes
P. nudipes
Habromys lepturus
57
81
93
85
68
96100
60 94
86 86
90
87
63
6363
100mexicanus group
aztecus group
boylii group
truei group
megalops group
melanophrys group
crinitus group maniculatus group
leucopus group
Haplomylomys
8
11
12
2
4
22
1 3
2
1
2
38
Figure 2.2. Adh1-I2 phylogeny generated using maximum likelihood with the HKY+G model of evolution. Roman numerals refer to major clades and letters refer to subclades as identified in the text.
Baiomys
Hodomys
Reithrodontomys
Megadontomys
Habromys
Neotomodon
P. perfulvus
P. melanophrys
P. megalops
P. gratus
P. difficilis
P. attwateri
P. beatae
P. levipes
P. sp.
P. beatae P. boylii
P. boylii
P. boylii
P. schmidlyi
P. schmidlyi
P. spicilegus
P. spicilegus
P. spicilegus
P. hylocetes
P. pectoralis
P. mexicanus
P. nudipes
P. nudipes
P. californicus
P. eremicus
P. leucopus
P. leucopus
P. maniculatus
P. crinitus
Podomys floridanus
Osgoodomys banderanus
Osgoodomys banderanus
0.005 substitutions/site
I
II
III
IV
V
VI
VII
A
B
C
D
melanophrys group
truei group
boylii group
mexicanus group
megalops group
aztecus group
Haplomylomys
leucopus group
maniculatus group
crinitus group

39
Figure 2.3. Adh1-I2 phylogeny generated using Bayesian methods and the GTR+I+G model of evolution. Roman numerals indicate major clades and letters indicate subclades as discussed in the text. Clade probability values are shown above branches.
Baiomys taylori
Hodomys alleni
Reithrodontomys fulvescens
P. californicus
P. eremicus
P. leucopus
P. leucopus
Osgoodomys banderanus
Osgoodomys banderanus 5 changes
45
25
6
melanophrys group
megalops group
36
53
57
Megadontomys thomasi
Habromys lepturus
P. beatae
P. pectoralis
P. nudipes
Neotomodon alstoni
P. perfulvus
P. melanophrys
P. megalops
P. gratus
P. difficilis
P. attwateri
96
truei group 39
83
100
96
100
100 P. beatae P. sp
P. levipes
P. boylii
P. hylocetes
P. boylii
P. boylii
P. schmidlyi
P. schmidlyi
P. spicilegus
P. spicilegus
P. spicilegus
P. crinitus
Podomys floridanus
11
P. mexicanus
P. nudipes
100
100
100
100 100
73
14
100 34
7
9
96
93
97
8
1
3
10
100
boylii group
mexicanus group
crinitus group
Haplomylomys
P. maniculatus
leucopus group
maniculatus group
I
II
A
B
III
IV
V
VI C
D
VII
aztecus group

40
Figure 2.4. Adh1-I2---Cytb phylogeny generated using Bayesian methods and the GTR+I+G model of evolution. Roman numerals indicate major clades and letters indicate subclades as discussed in the text. Clade probability values are shown above branches.
Baiomys taylori
Hodomys alleni
Reithrodontomys fulvescens
Megadontomys thomasi
Neotomodon alstoni
P. perfulvus
P. melanophrys
P. megalops
P. mexicanus
P. nudipes
P. gratus
P. difficilis
P. attwateri
P. beatae
P. levipes
P. schmidlyi
P. boylii
P. boylii
P. spicilegus
P. hylocetes
P. pectoralis
Habromys lepturus
Osgoodomys banderanus
P. californicus
P. eremicus
P. leucopus
P. maniculatus
P. crinitus 50 changes
86
100
48
98
84
96
91
97
97
90
100
100
88
100
100 88
100
100 100
100
81
98
100
97
100
melanophrys group
megalops group
mexicanus group
truei group
boylii group
aztecus group
Haplomylomys
leucopus group
maniculatus group
crinitus group
I
II
A
B
E
D
C
F
III
IV
V
VI
VII
41
CHAPTER III
CONCLUSIONS
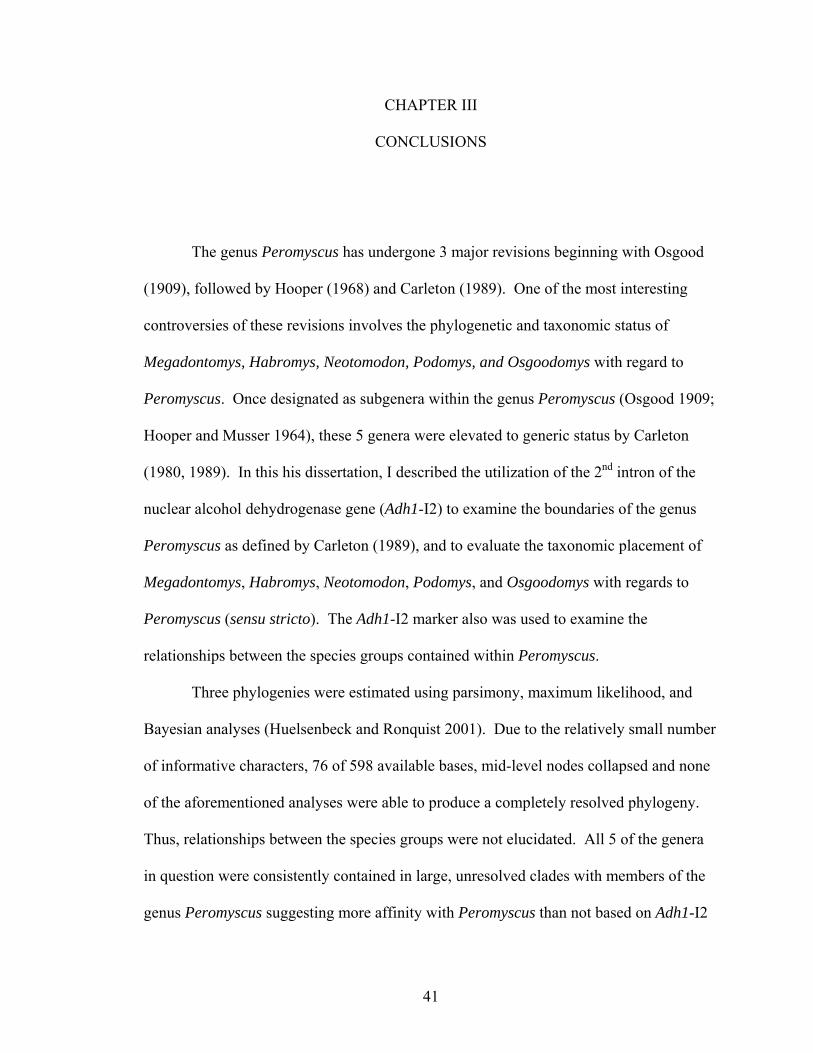
The genus Peromyscus has undergone 3 major revisions beginning with Osgood
(1909), followed by Hooper (1968) and Carleton (1989). One of the most interesting
controversies of these revisions involves the phylogenetic and taxonomic status of
Megadontomys, Habromys, Neotomodon, Podomys, and Osgoodomys with regard to
Peromyscus. Once designated as subgenera within the genus Peromyscus (Osgood 1909;
Hooper and Musser 1964), these 5 genera were elevated to generic status by Carleton
(1980, 1989). In this his dissertation, I described the utilization of the 2nd intron of the
nuclear alcohol dehydrogenase gene (Adh1-I2) to examine the boundaries of the genus
Peromyscus as defined by Carleton (1989), and to evaluate the taxonomic placement of
Megadontomys, Habromys, Neotomodon, Podomys, and Osgoodomys with regards to
Peromyscus (sensu stricto). The Adh1-I2 marker also was used to examine the
relationships between the species groups contained within Peromyscus.
Three phylogenies were estimated using parsimony, maximum likelihood, and
Bayesian analyses (Huelsenbeck and Ronquist 2001). Due to the relatively small number
of informative characters, 76 of 598 available bases, mid-level nodes collapsed and none
of the aforementioned analyses were able to produce a completely resolved phylogeny.
Thus, relationships between the species groups were not elucidated. All 5 of the genera
in question were consistently contained in large, unresolved clades with members of the
genus Peromyscus suggesting more affinity with Peromyscus than not based on Adh1-I2

42
sequence data. The lack of support associated with the Bayesian analysis, however,
would not allow for any specific inferences concerning the taxonomic placement of
Megadontomys, Habromys, Neotomodon, Podomys, and Osgoodomys based solely on the
analysis of Adh1-I2 sequence data.
Concatenating Adh1-I2 and mitochondrial cytochrome b (Cytb) sequence data
also was unable to provide fine-scale resolution; information concerning the relationships
of species groups within Peromyscus was not obtained. Combining the data did,
however, provide support for the inclusion of Habromys, Neotomodon, and Osgoodomys
in the genus Peromyscus when analyzed using Bayesian methods (Huelsenbeck and
Ronquist 2001). Again, Megadontomys was contained within an unresolved clade with
members of the genus Peromyscus but insufficient support would not allow any specific
inference concerning its taxonomic placement. A Cytb sequence was unavailable for
Podomys preventing the examination of its taxonomic placement with regard to
Peromyscus based on Adh1-I2--- Cytb sequence data.
As a result of this study, it has become clear that although Adh1-I2 provided some
indication of the nature of the relationships between the 5 genera in question and the
genus Peromyscus, there were too few characters to provide resolution at the mid-level
nodes. Therefore, a clear representation of the relationships between those individuals
contained within the boundaries of the genus was not obtained. For future studies,
inclusion of 1 or more additional Adh1 introns may add to the number of informative
characters and provide the necessary resolution required to make inferences concerning
relationships between species groups. Also, utilizing other nuclear markers with rates of

43
evolution approaching half of that found in Cytb may prove informative when combined
with Adh1-I2 and Cytb.
The addition of the Cytb data bolstered the Adh1-I2 data and provided support for
the inclusion of Neotomodon, Habromys, and Osgoodomys in the genus Peromyscus.
However, the combined data were still unable to provide a fine scale resolution and
therefore, unable to provide definitive information concerning relationships within the
boundaries of the genus. Again, the inclusion of additional Adh1 introns or other nuclear
markers may increase the resolution at the deeper nodes.

44
LITERATURE CITED
Carleton, M. D. 1980. Phylogenetic relationships in neotomine-peromyscine rodents (Muroidea) and a reappraisal of the dichotomy within New World Cricetinae. Miscellaneous Publications, Museum of Zoology, University of Michigan 157:1-- 146.
Carleton, M. D. 1989. Systematics and evolution. Pp. 7-141 in Advances in the study of Peromyscus (Rodentia) (G. L. Kirkland, Jr. and J. N. Layne, eds.). Texas Tech
University Press, Lubbock, 366 pp.
Hooper, E. T. 1968. Classification. Pp. 27-74 in Biology of Peromyscus (Rodentia) (J. A. King, ed.). Special Publication, The American Society of Mammalogists 2:1-- 593.
Hooper, E. T., and G. G. Musser. 1964. The glans penis in Neotropical cricetines (Family Muridae) with comments on classification of muroid rodents. Miscellaneous Publications, Museum of Zoology, University of Michigan 123:1-- 57.
Huelsenbeck, J. P., and F. Ronquist. 2001. Mr. Bayes: Bayesian inference of phylogeny. Bioinformatics 17:754--755.
Osgood, W. H. 1909. Revisions of the mice of the American genus Peromyscus. North American Fauna 28:1--285.

45
APPENDIX
LOCALITIES OF SPECIMENS EXAMINED; PEROMYSCUS ARE LISTED BY
SPECIES GROUP.
The following is a list of localities for samples examined in this study. Specimens
examined are listed by species group and type of sequence (Adh1-I2 or Cytb). Species
names are followed by locality. Museum or collector number (Duke S. Rogers—DSR,
Ira F. Greenbaum—GK, and Texas Tech University tissue number—TK) and the
GenBank accession number are provided in parentheses. Published sequences used in
this study do not include a locality and are followed by their citation.
Adh1-I2
Baiomys taylori.— MEXICO: Jalisco; 2 Km NW Mesconcitos, (TK 93084, AY994205).
Hodomys alleni.— (TK45042, AY817627) (Longhofer and Bradley In prep).
Reithrodontomys fulvescens.—USA:Oklahoma; MiCintosh Co, 4.9 km E Dustin,
(TK23469, AY994207). Megadontomys thomasi.— MEXICO: Guerrero; 6.4 km SSW
Filo de Caballo (TK93388, AY994208). Habromys lepturus.— MEXICO: Oaxaca; 2.25
km N Llano de Las Flores (TK93160, AY994239). Neotomadon alstoni.— MEXICO:
Michoacán; Ladera W Cerro del Burro (TK45302, AY994210). Podomys floridanus.—
USA: Florida; Columbia Co, O’leno State Park (TK92502, AY994214). Osgoodomys
banderanus.— MEXICO: Michoacán; Coalcoman, Tehuanepec, 17.5 km WSW
Coalcoman (Sample 1, TK 45952, AF 994209). MEXICO: Michoacán; Villa Victoria,
6.3 km SSW Villa Victoria (Sample 2 TK45964, AY994231). Peromyscus pectoralis.—
MEXICO: Jalisco; 30 km W Huejuquilla el Alto (TK48645, AY994221). melanophrys

46
group.— Peromyscus perfulvus, MEXICO: Michoacán; Tunel de Riego, 2 km E Cerro
Colorado (TK47926, AY994215); P. melanophrys, MEXICO: Durango; 2.2 km S, 2.5
km E Vicente Guerrero (TK448848, AY994216). megalops group.— Peromyscus
megalops, MEXICO: Guerrero; 6.4 km SSW Filo de Caballo (TK93375, AY994217).
truei group.— Peromyscus gratus, MEXICO: Michoacán; Aguililla, Zona Arqueologica
Tres Cerritos, 4 km E Cuitzeo (TK46354, AY994218); Peromyscus difficilis, MEXICO:
Tlaxcala; 2 km NE Tepetitla (TK93120, AY994219); Peromyscus attwateri, USA:
Oklahoma; McIntosh Co, 4.9 km E Dustin (TK23396, AY994220). boylii group.—
Peromyscus beatae, MEXICO: Veracruz; Xometla (Sample 1, GK3954, AY994222);
MEXICO: Chiapas; Yalentay (Sample 2, TK93279, AY994223); Peromyscus levipes,
MEXICO: Michoacán; Las Minas, 3km SW Tuxpan (TK47819, AY994224);
Peromyscus species, MEXICO: Michoacán; km 81 Carr Ario de Rosales-la Huacana
(TK47890, AY994230); Peromyscus boylii, USA: California: San Diego Co, Heise
County Park (Sample 1, TK90233, AY994225); USA: Utah; Washington Co, Bever Dam
Wash (Sample 2, TK24389, AY994226); MEXICO: Jalisco; 2 km NW Mesconcitos
(Sample 3, TK93089, AY994227); Peromyscus schmidlyi, MEXICO: Durango; 6.1 km
W Coyotes, Hacienda Coyotes, (Sample 1, TK72443, AY994228), MEXICO: Durango;
San Juan de Camarones (Sample 2, TK70812, AY994229). aztecus group.—
Peromyscus spicilegus, MEXICO: Michoacán; km 81 Carr Ario de Rosales-la Huacana
(Sample 1, TK47888, AY994232), MEXICO: Michoacán; Aguililla, 5 km E Dos Aguas
(Sample 2, TK45255, AY994234), MEXICO: Michoacán; Aguililla, Dos Aguas (Sample
3, TK45262, AY994233), Peromyscus hylocetes, MEXICO: Michoacán; Estacion
Microodnas, Cerro Burro (TK45309, AY994235). mexicanus group.— Peromyscus

47
mexicanus, MEXICO : Chiapas; 14.48 km N. Ocozocoaulta (TK93314, AY994236);
Peromyscus nudipes, NICARAGUA: Selva Negra; Cody Trail (Sample 1 TK113541,
AY994237); NICARAGUA, Los Mongos (Sample 2 TK93600, AY994238).
californicus group.— Peromyscus californicus, USA: California; Los Angeles Co,
Chatsworth Reservoir Park (TK93600, AY994211). eremicus group. — Peromyscus
eremicus, USA: California; Los Angeles Co, Kanan Dome Rd. (TK90458, AY994212).
leucopus group.— Peromyscus leucopus, USA: Texas; Presidio Co, Las Palomas WMA
(Sample 1 TK54008, AY994240); USA: Texas; La Salle Co, Chaparral Wildlife
Management Area (Sample 2 TK112167, AY994241). maniculatus group.—
Peromyscus maniculatus, USA: Arkansas; Mississippi Co, Dillahunty Pecan Orchard
(TK90458, AY994242). crinitus group.— Peromyscus crinitus, USA: Utah; Vintah Co,
Cottonwood Canyon (DSR6171, AY994213).
Cytb
Baiomys taylori.—(TK 93084, AF548471) (Amman and Bradley 2004). Hodomys
alleni.—(TK45042, AF186801) (Edwards and Bradley 2001). Reithrodontomys
fulvecens.—(TK23469, AF176257) (Bell et al. 2001). Megadontomys thomasi.—
MEXICO: Guerrero; 6.4 km SSW Filo de Caballo (TK93388, AY195795). Habromys
lepturus.— MEXICO: Oaxaca; 2.25 km N Llano de Las Flores (TK93160, DQ000482).
Neotomadon alstoni.— (TK45302, AY195796) (Bradley et al. 2004). Osgoodomys
banderanus. — MEXICO: Michoacán; Coalcoman, Tehuanepec, 17.5 km WSW
Coalcoman (Sample 1, TK 45952, DQ000473). Peromyscus pectoralis.— MEXICO:
Jalisco; 30 km W Huejuquilla el Alto (TK48644, DQ000476). melanophrys group.—

48
Peromyscus perfulvus, MEXICO: Michoacán; Tunel de Riego, 2 km E Cerro Colorado
(TK47926, DQ000474); Peromyscus melanophrys, MEXICO: Durango; 2.2 km S, 2.5
km E Vicente Guerrero (TK448848, AY322510). megalops group.— Peromyscus
megalops, MEXICO: Guerrero; 6.4 km SSW Filo de Caballo (TK93375, DQ000475).
truei group.— Peromyscus gratus, (TK46354, AY376421) (Durish et al. 2004);
Peromyscus difficilis, (TK93120, AY376416); (Durish et al. 2004); Peromyscus
attwateri, (TK23396, AF155384) (Durish et al. 2004). boylii group.— Peromyscus
beatae, MEXICO: Veracruz; Xometla (Sample 1, GK3954, AF131921); Peromyscus
levipes, MEXICO: Michoacán; Las Minas, 3km SW Tuxpan (TK47819, DQ000477);
Peromyscus boylii, USA: Utah; Washington Co, Bever Dam Wash (Sample 2, TK24389,
DQ000478); (Sample 3, TK93089, AY322504) (Bradley et al. 2004b); Peromyscus
schmidlyi, (Sample 1, TK72443, AY370610) (Bradley et al. 2004b). aztecus group.—
Peromyscus spicilegus, MEXICO: Michoacán; km 81 Carr Ario de Rosales-la Huacana
(Sample 1, TK47888, DQ000480); Peromyscus hylocetes, MEXICO: Michoacán;
Estacion Microodnas, Cerro Burro (TK45309, DQ000481); mexicanus group.—
Peromyscus mexicanus, (TK93314, AY376425) (Durish et al. 2004); Peromyscus
nudipes, (Sample 1 GenBank no. AY041200) (Rinehart,T.A., Grahn,R.A. and
Wichman,H.A. unpublished data). californicus group.—Peromyscus californicus, (TK
83632, AF155393) (Tiemann-Boege et al. 2000). eremicus group.—Peromyscus
eremicus, (TK91184, AY322503) (Durish et al. 2004). leucopus group.—Peromyscus
leucopus,USA: Texas; La Salle Co, Chaparral Wildlife Management Area (Sample 2
TK112168, DQ000483). maniculatus group.—Peromyscus maniculatus, USA AR:

49
Mississippi Co; Dillahunty Pecan Orchard (TK11695, DQ000484). crinitus group.—
Peromyscus crinitus, (DSR6171, AY376413) (Durish et al. 2004).