
Molecular Similarity & Molecular Descriptors for Drug...
47
Molecular Similarity & Molecular Descriptors for Drug Design N. Sukumar Center for Biotechnology & Interdisciplinary Studies (x.4235; [email protected]) January 26, 2006
-
Upload
truongtuyen -
Category
Documents
-
view
218 -
download
0
Transcript of Molecular Similarity & Molecular Descriptors for Drug...

Molecular Similarity & Molecular Descriptors
for Drug Design
N. SukumarCenter for Biotechnology & Interdisciplinary Studies
(x.4235; [email protected])January 26, 2006
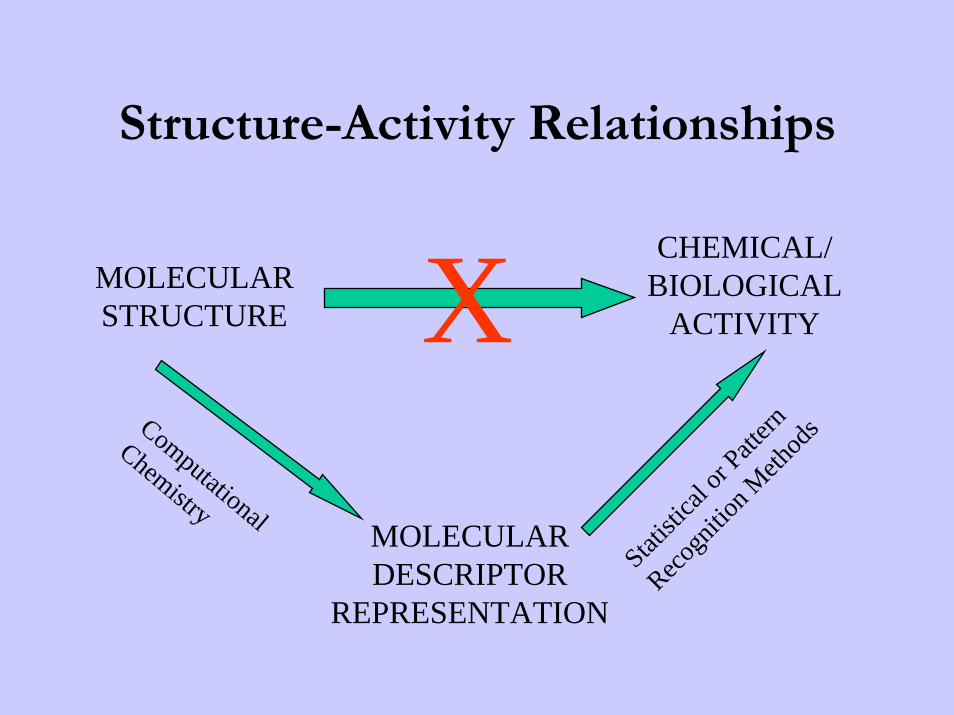
Structure-Activity Relationships
MOLECULARSTRUCTURE
CHEMICAL/BIOLOGICAL
ACTIVITY
MOLECULARDESCRIPTOR
REPRESENTATION
Statist
ical o
r Patt
ern
Recogn
ition M
ethod
s
XComputational
Chemistry
Quantitative Structure Activity Relationship (QSAR) &Quantitative Structure Property Relationship (QSPR)• The role of data mining in chemistry is to evaluate "hidden"
information in a set of chemical data.• A typical application is the retrieval of structures with defined
biological activity (for drug development) from a database.• Finding the adequate descriptor for the representation of
chemical structures is one of the basic problems in chemical data mining.
• Molecules are normally represented as 2-D formulas or 3-D molecular models.
• While the 3-D coordinates of atoms in a molecule are sufficient to describe the spatial arrangement of atoms, they lack two features: – they are not independent on the size of a molecule; – they do not describe additional properties.
http://www.terena.nl/conferences/archive/tnc2000/proceedings/10B/10b5.html

Molecular Similarity– “Similarity" can
have quite different meanings in chemical approaches.
– Molecular Similarity does not just mean similarity of structural features.
– Similarity in a chemical context must include additional properties.
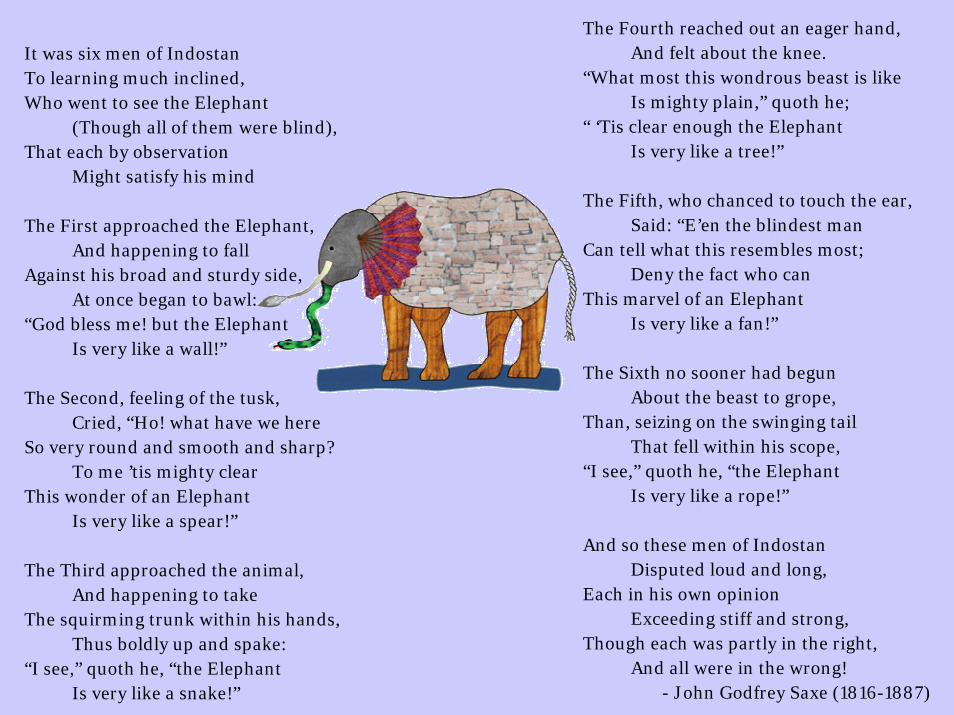
It was six men of IndostanTo learning much inclined, Who went to see the Elephant
(Though all of them were blind), That each by observation
Might satisfy his mind
The First approached the Elephant, And happening to fall
Against his broad and sturdy side, At once began to bawl:
“God bless me! but the Elephant Is very like a wall!”
The Second, feeling of the tusk, Cried, “Ho! what have we here
So very round and smooth and sharp? To me ’tis mighty clear
This wonder of an Elephant Is very like a spear!”
The Third approached the animal, And happening to take
The squirming trunk within his hands, Thus boldly up and spake:
“I see,” quoth he, “the Elephant Is very like a snake!”
The Fourth reached out an eager hand, And felt about the knee.
“What most this wondrous beast is like Is mighty plain,” quoth he;
“ ‘Tis clear enough the Elephant Is very like a tree!”
The Fifth, who chanced to touch the ear, Said: “E’en the blindest man
Can tell what this resembles most; Deny the fact who can
This marvel of an Elephant Is very like a fan!”
The Sixth no sooner had begun About the beast to grope,
Than, seizing on the swinging tail That fell within his scope,
“I see,” quoth he, “the Elephant Is very like a rope!”
And so these men of Indostan Disputed loud and long,
Each in his own opinion Exceeding stiff and strong,
Though each was partly in the right, And all were in the wrong!
- John Godfrey Saxe (1816-1887)

An example of Classification: An example of Classification: MacrocyclesMacrocycles –– musky odor or not?musky odor or not?
(C. Davidson and B. (C. Davidson and B. LavineLavine))
musknon-musk
• 139 compounds:103 musks36 non-musks.
• 264 molecular descriptors.

NitroaromaticNitroaromatic Musk Candidates Musk Candidates (C. Davidson and B. (C. Davidson and B. LavineLavine))
musk non-musk

GA/PCA Results with TAE descriptors GA/PCA Results with TAE descriptors
(C. Davidson and B. (C. Davidson and B. LavineLavine)) 7 selected features7 selected features

-6 -4 -2 0 2 4 6-3
-2
-1
0
1
2
311111
11
1
22
111
2
111
222
1111
111
2
111 11
2
1
2
1
22
1111
2
1
1
222
11
1
1
222
111
2222
1
1
2
11111111
2
11 11
2
111
222
1
22222
111
22
1
2
1
2
11
22
1
2222
1
2222222222
11
22222222
1
2 22
1
2
11
222222222
1
222222
1
22
1
2 22
1
22222222
1
22222
1
22
1
222
22
2
2
1
2
22
2
222
2
22
2
2
2 2
2
2
2 2222
2
2
2222
2
2222
2
222
2
22
222
2
2 2
2
2
2222
2 2
2
2
22
22
2
2
2
222
22
2 2
22
22
2
222
2
2
2
2
22
111
11 111 1111111 1
111
1
11111
1
1
1111
1
11111
111
1 111
1111
111
11111
11
PC
2
3D PC Plot Dim(30)
PC1
•1 Macro Non-Musk
•2 Macro Musk
•1 Nitro Non-Musk
•2 Nitro Musk
NitroaromaticsNitroaromatics and and MacrocyclesMacrocycles
Results with PEST DescriptorsResults with PEST Descriptors(C. Davidson and B.(C. Davidson and B. LavineLavine))
DGNAVGN, DGNH7, DGNW6, DGNW19, DGNW22, DGNB05, DGNB14, DGNB22, DGNB33, DKNAVGN, DKNH3, DKNW4, DKNW6, DKNB00,
DKNB24, DRNH4, DRNW3, DRNW5, DRNW15, DRNW28, GW16, GW21, GW28, KW11, KW27, FUKW21, PIPB14, PIPB30, BNPW27, BNPB44

ADMET Property Prediction: Challenges in Medicinal Chemistry
Multiple-parameter optimization of lead structures
• Other parameters: patent position, chemical synthesis• The greatest hurdle : ADMET properties.

Different barriers
DrugsDrugs
Mucus Gel Layer
Intestinal Epithelial Cells
Lamina Propria
Endothelium of Capillarics
A series of separate barriers (epithelial layer is the most dominant barrier)
Be absorbedBe absorbed

Motivation• Introduction of a new drug into the market is often the
culmination of a long and arduous process of laboratory experimentation, lead compound discovery, animal testing and pre-clinical and clinical trials.
• This process, from hit to lead to marketable drug, is typically as long as 10-15 years
• In silico drug discovery:– find a correlation between molecular structure and biological activity– now any number of compounds, including those not yet synthesized,
can be virtually screened on the computer to select structures with the desired properties.
• Virtual ADME/Toxicological screening can weed out compounds with adverse side effects, identifying the “losers”early on in the game.
• The most promising compounds can then be chosen for laboratory synthesis and pre-clinical testing– conserving resources cheaper medicines– accelerating the process of drug discovery.
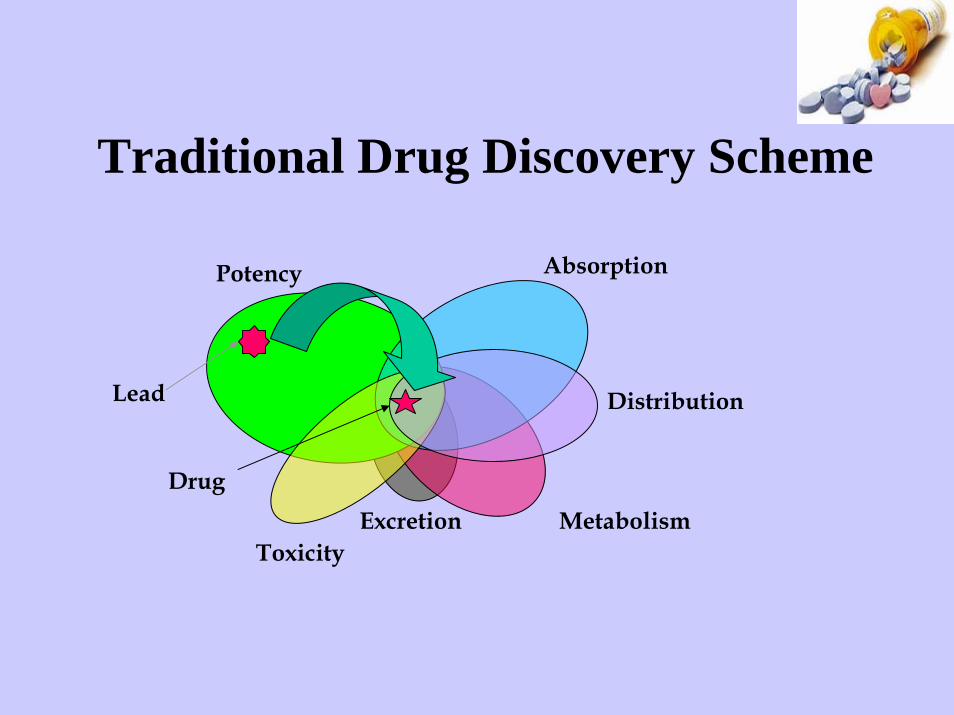
Traditional Drug Discovery Scheme
Potency Absorption
Distribution
MetabolismExcretionToxicity
Lead
Drug

In silico prediction of ADME properties
Potency Absorption
Distribution
MetabolismExcretionToxicity
Lead
Drug
Computational ADME-Tox modelsfor drug discovery
• Solubility• Absorption• Mutagenicity• Bioavailability• Metabolic stability• Blood-brain barrier permeability• Cardiac toxicity (hERG)• Plasma protein binding

The figure depicts a cartoon representation of the relationship between the continuum of chemical space (light blue) and the discrete areas of chemical space that are occupied by compounds with specific affinity for biological molecules. Examples of such molecules are those from major gene families (shown in brown, with specific gene families colour-coded as proteases (purple), lipophilic GPCRs (blue) and kinases (red)). The independent intersection of compounds with drug-like properties, that is those in a region of chemical space defined by the possession of absorption, distribution, metabolism and excretion properties consistent with orally administered drugs —ADME space — is shown in green.
stopher Lipinski & Andrew Hopkins, NATURE|VOL 432 | 16 DECEMBER 2004, pp.855-861
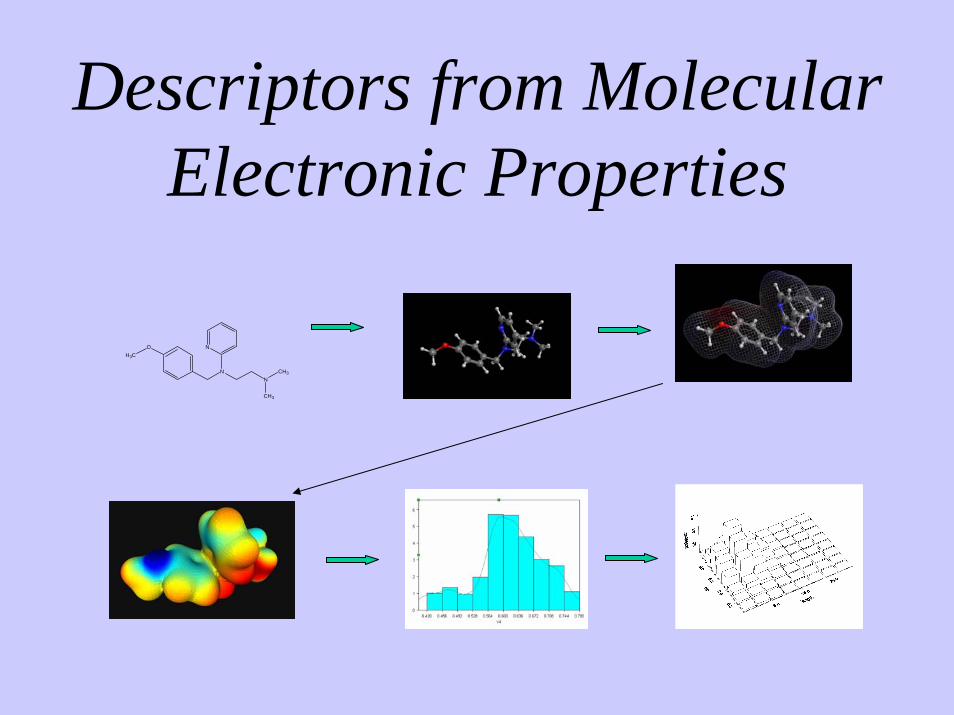
Descriptors from Molecular Electronic Properties
OH3C
NN
CH3
N
CH3
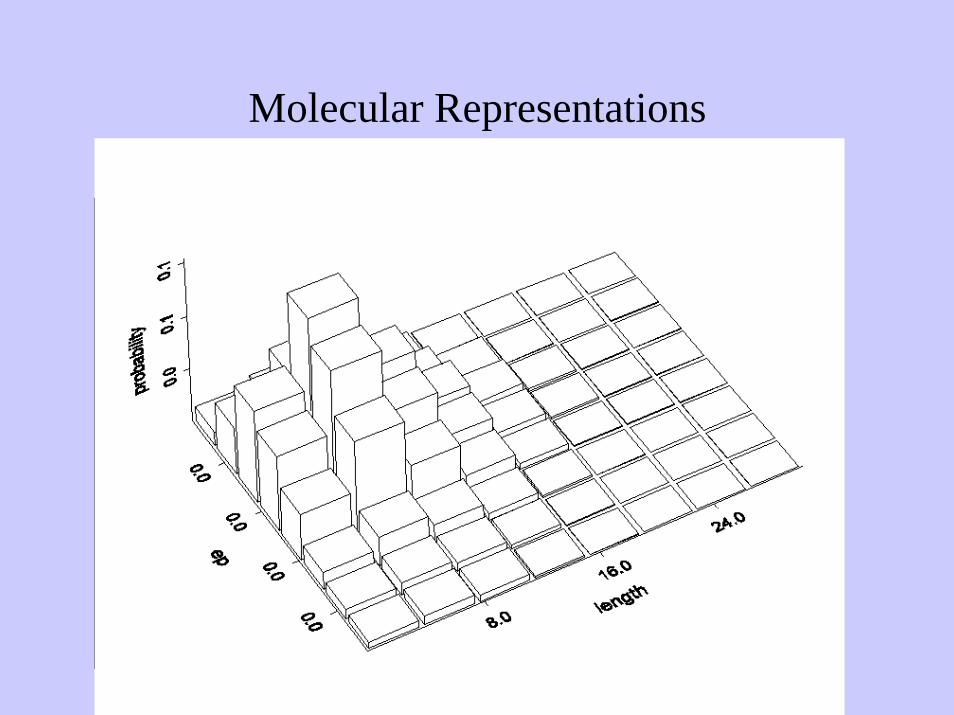
Molecular Representations
OH3C
NN
CH3
N
CH3

Linear Free Energy Relationships• Originally developed by Hammett, then by Taft • Intended to purely quantify the effect of
substituents and leaving groups on ester hydrolysis• Demonstrated the usefulness of parametric
procedures in describing an empirical property (equilibrium constant, rate constant) in terms of a parameter describing molecular structure.
• This relationship provides the thermodynamic basis for most implementations of QSAR by the relations:
http://www.netsci.org/Science/Compchem/feature08.html

Quantitative Structure-Activity Relationships (QSAR)
• QSAR was a natural extension of the LFER approach, with a biological activity correlated against a series of parameters that described the structure of a molecule.
• The most well known and most used descriptor in QSAR has been the LOG (Octanol/Water) partition coefficient (usually referred to as LOG P or LOG P[o/w]). LOG P has been very useful in correlating a wide range of activities due to its excellent modeling of the transport across the blood/brain barrier.
• Unfortunately, many regressions do not work well for LOG P, usually because other effects are important, such as steric and electronic effects.
• Therefore, many other descriptors have been used in QSAR in addition to LOG P to incorporate these additional effects.

• “2-D” Molecular Descriptors can be calculated from the connection table (with no dependence on conformation):– Physical Properties– Subdivided Surface Area Descriptors– Atom Counts and Bond Counts– Connectivity and Shape Indices– Adjacency and Distance Matrix Descriptors– Pharmacophore Feature Descriptors– Partial Charge Descriptors
• “3-D” Descriptors depend on molecular coordinates:– Potential Energy Descriptors– Surface Area, Volume and Shape Descriptors– Conformation Dependent Charge Descriptors
MOE Descriptors® Chemical Computing Group Inc.
• Sum of the atomic polarizabilities• Molecular mass density• Total charge of the molecule• Molecular refractivity • Molecular weight.• Log of the octanol/water partition
coefficient
•Number of aromatic atoms•Number of atoms•Number of heavy atoms•Number of hydrogen atoms •Number of boron atoms•Number of carbon atoms•Number of nitrogen atoms•Number of oxygen atoms•Number of fluorine atoms•Number of phosphorus atoms•Number of sulfur atoms•Number of chlorine atoms•Number of bromine atoms•Number of iodine atoms•Number of rotatable single bonds •Number of aromatic bonds •Number of bonds •Number of double bonds •Number of rotatable bonds •Fraction of rotatable bonds•Number of single bonds•Number of triple bonds•Number of chiral centers •Number of O and N atoms•Number of OH and NH groups •Number of rings
•Water accessible surface area of all atoms with positive partial charge •Water accessible surface area of all atoms with negative partial charge •Water accessible surface area of all hydrophobic atoms•Water accessible surface area of all polar atoms •Positive charge weighted surface area•Negative charge weighted surface area
•Water accessible surface area•Globularity•Principal moment of inertia•Radius of gyration•van der Waals surface area
•Angle bend potential energy•Electrostatic component of the potential energy•Out-of-plane potential energy•Solvation energy•Bond stretch potential energy•Local strain energy•Torsion potential energy
•Number of hydrogen bond acceptor atoms•Number of acidic atoms•Number of basic atoms•Number of hydrogen bond donor atoms•Number of hydrophobic atoms
•Total positive partial charge•Total negative partial charge•Total positive van der Waals surface area•Total negative van der Waals surface area•Fractional positive polar van der Waals surface area•Fractional negative polar van der Waals surface area

Some Topological Descriptors• Wiener number W is the total distance between all carbon
atoms (sum of the distances between each pair of carbon atoms in the molecule, in terms of carbon-carbon bonds).
• The smaller this number, the larger is the compactness of the molecule.
• Method of calculation: Multiply the number of carbon atoms on one side of any bond by those on the other side; W is the sum of these two values for all bonds.
• W can also be obtained by simply adding all the elements of the graph distance matrix above the main diagonal.
• Hosoya topological index Z is obtained by counting the k disjoint edges in a graph (for k = 0, 1, 2, 3, ...).
• Z counts all sets of non-adjacent bonds in a structure.

Wiener number W, Hosoya index Z and connectivity index χ
• Connectivity index(Milan Randic, A.T. Balaban)
χ = Σ (RiRj)-1/2
• χ is constructed from the row sums Ri and Rj of the adjacency matrix using the algorithm (RiRj)-1/2 for the contribution of each bond (i,j)
• χ is a bond additive quantity where terminal CC bonds are given greater weight than inner CC bonds.

Quantum chemical Electron Density Derived
descriptors– The wave function ψ given by solution of the Schrödinger
equation Hψ = Eψ contains all information about the molecule.– “All science is either physics or stamp collecting”
— Ernest Rutherford (Nobel Prize in Chemistry, 1908)– BUT: ψ(r1, r2, r3, …) is a function of the coordinates of
all the electrons (and nuclei) in the molecule!– “The fundamental laws necessary for the mathematical
treatment of a large part of physics and the whole of chemistry are thus completely known, and the difficulty lies only in the fact that application of these laws leads to equations that are too complex to be solved.” — Paul Dirac (1902 - 1984)
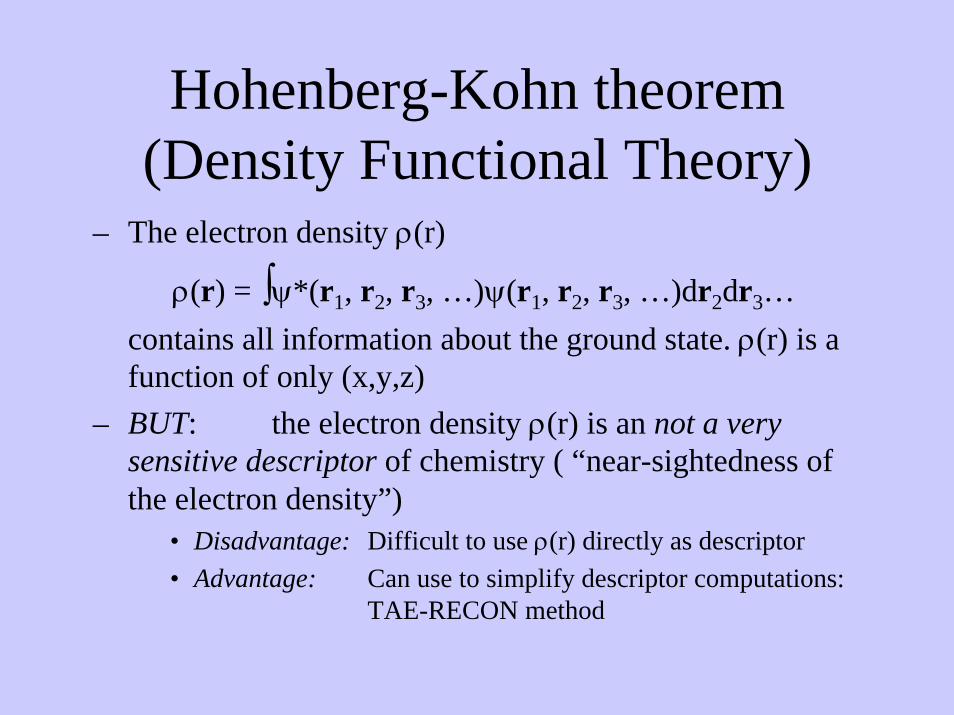
Hohenberg-Kohn theorem (Density Functional Theory)
– The electron density ρ(r)
ρ(r) = ∫ψ*(r1, r2, r3, …)ψ(r1, r2, r3, …)dr2dr3…contains all information about the ground state. ρ(r) is a function of only (x,y,z)
– BUT: the electron density ρ(r) is an not a very sensitive descriptor of chemistry ( “near-sightedness of the electron density”)
• Disadvantage: Difficult to use ρ(r) directly as descriptor• Advantage: Can use to simplify descriptor computations:
TAE-RECON method

Electron Density DerivedMolecular Surface Properties
– Electrostatic Potential
– Electronic Kinetic Energy Density
– Electron Density Gradients ∇ρ•N
– Laplacian of the Electron Density
– Local Average Ionization Potential
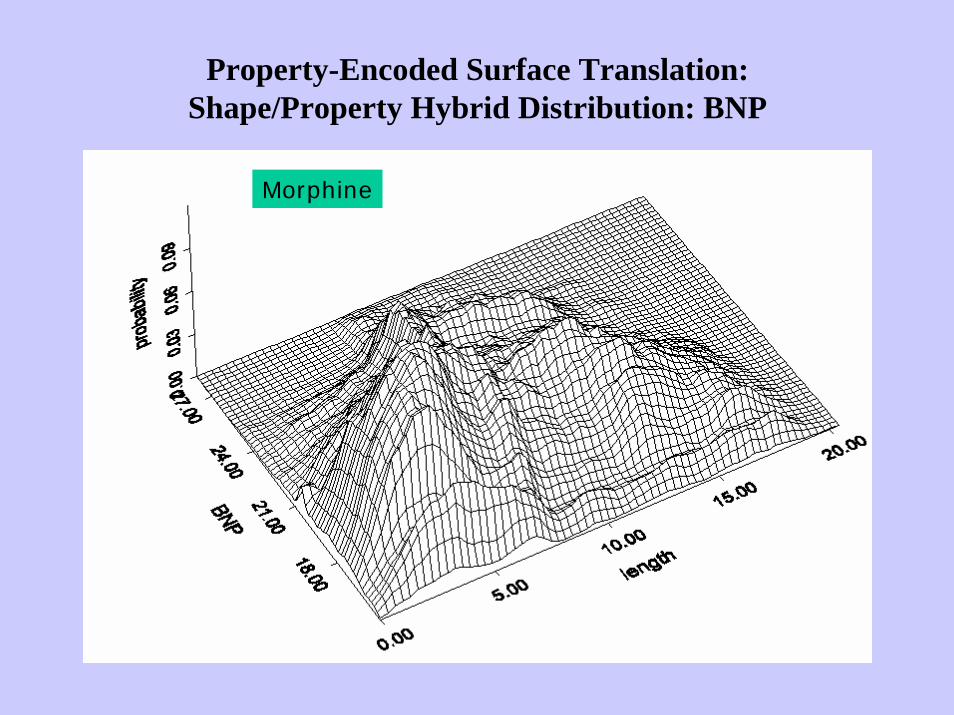
– Bare Nuclear Potential (BNP) first term of EP
– Fukui function F+(r) = ρHOMO(r)
EP ( r ) =Z α
r − Rαα∑ −
ρ (r' )dr 'r − r'∫
K ( r ) = −(ψ * ∇ 2ψ + ψ∇ 2ψ *)
G (r ) = −∇ ψ * .∇ ψ
L(r) = −∇ 2ρ(r) = K (r) − G(r)
PIP ( r ) =ρ i ( r ) ε i
ρ ( r )i∑
Reconstruction Method
Algorithm for rapid reconstruction of molecular charge densities and molecular electronic properties Based on topological quantum theory of Atoms In MoleculesEmploys a library of atomic charge density fragments corresponding to structurally distinct atom typesAssociated with each atomic charge density fragment in the library is a data file which contains atomic charge density-based descriptors encoding electronic and structural information relevant to the chemistry of intermolecular interactions.
http://www.drugmining.com/

Topological Theory ofAtoms in Molecules
Definition of an Atom in a Molecule:An atom is the union of an attractor and its basinEach atom contains one (and only one) nucleus, which is the attractor of its electron density distribution ρ(r)Every atom is bounded by an atomic surface of zero flux
Atoms defined in this way satisfy the virial theoremThey have properties that are approximately additive and transferable from one molecule to another.
0ˆ. =∇ nρ

Reconstruction Method
For each atom in the molecule, determine atom types and assign closest match from atom type library
Combine densities of atomic fragments
Compute predicted molecular properties
http://www.drugmining.com/

Surface Property Distribution Histogram (TAE) Descriptors
Surface histograms can represent property distributions with 80-85% accuracy when 10-20 histogram bins are used.
PIP (Local Ionization Potential)surface property for a member ofthe Lombardo blood-brain barrierdataset.

Molecular Surface Properties:Wavelet Coefficient Descriptors (WCD)
Wavelet Surface Property Reconstruction:
16 coefficients from S7 and D7 portions of the WCD vector represent surface property densities with >95% accuracy.
Wavelet Decomposition:– Creates a set of
coefficients that represent a waveform.
– Small coefficients may be omitted to compress data.
1024 raw wavelet coefficients capture PIP distribution on molecular surface.
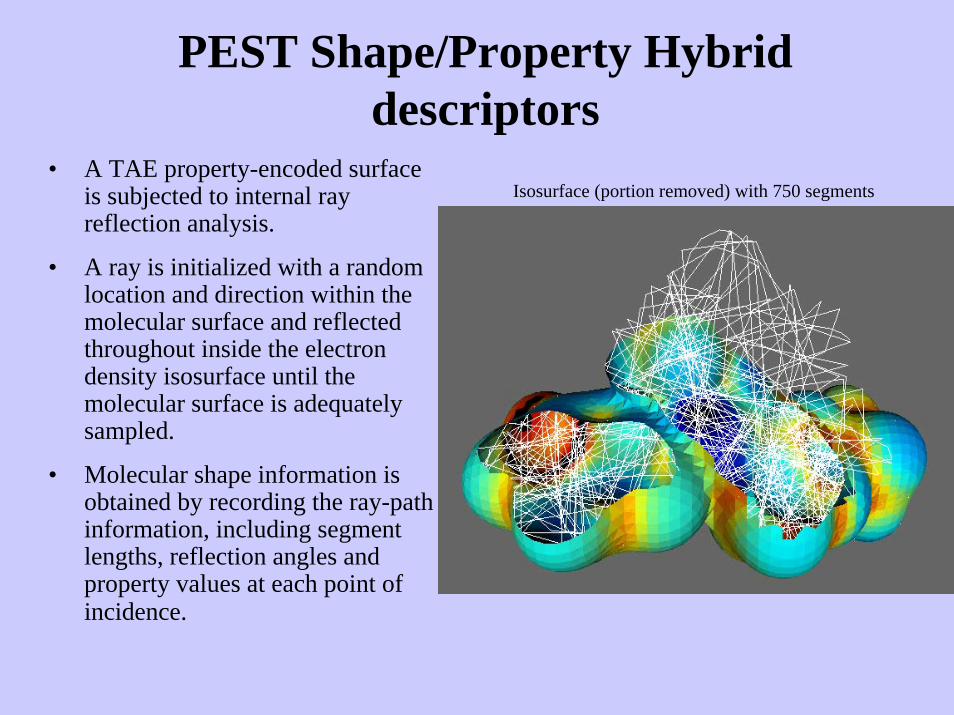
PEST Shape/Property Hybrid descriptors
• A TAE property-encoded surface is subjected to internal ray reflection analysis.
• A ray is initialized with a random location and direction within the molecular surface and reflected throughout inside the electron density isosurface until the molecular surface is adequately sampled.
• Molecular shape information is obtained by recording the ray-path information, including segment lengths, reflection angles and property values at each point of incidence.
Isosurface (portion removed) with 750 segments

PEST Hybrid Shape/Property Descriptors
• Surface properties and shape information are encoded into alignment-free descriptors
PIP vs Segment Length
• Segment length and point-of-incidence value form 2D-histogram• Each bin of 2D-histogram becomes a hybrid descriptor
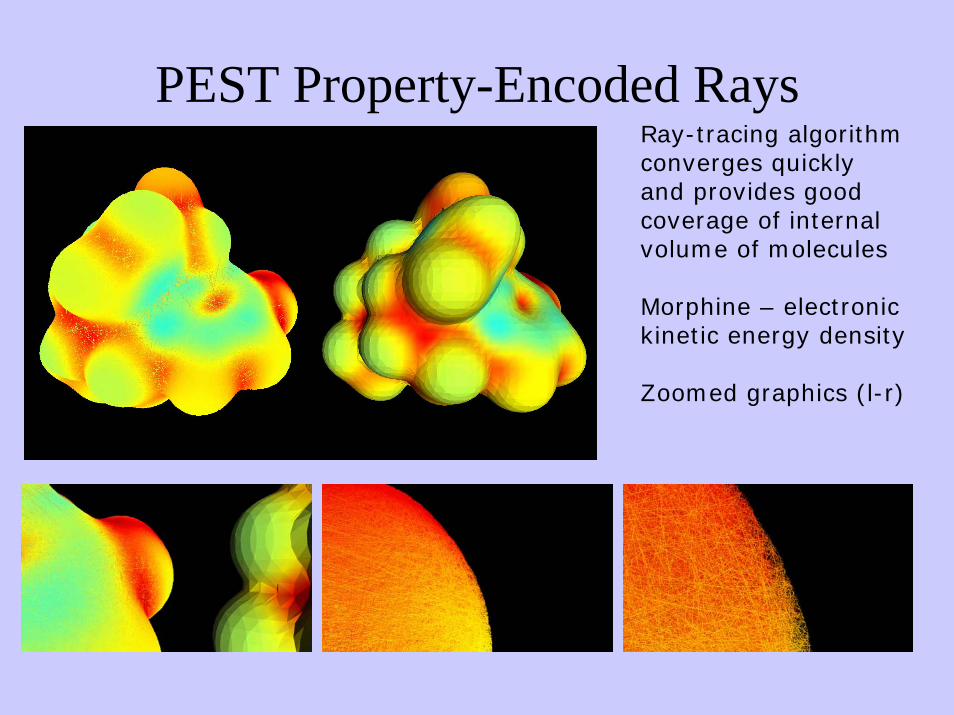
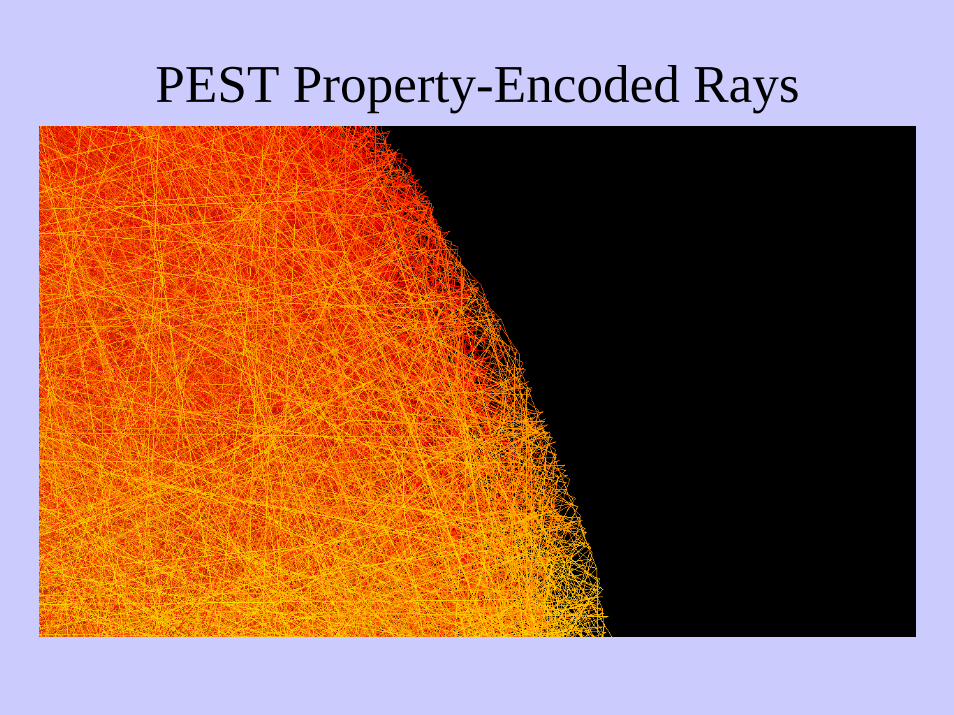
PEST Property-Encoded RaysRay-tracing algorithmconverges quicklyand provides good coverage of internalvolume of molecules
Morphine – electronickinetic energy density
Zoomed graphics (l-r)
PEST Property-Encoded Rays

Property-Encoded Surface Translation:Shape/Property Hybrid Distribution: EP
Morphine
Morphine
Property-Encoded Surface Translation:Shape/Property Hybrid Distribution: BNP

Tessellated Protein SurfaceTessellated Protein Surfaceusing using DelaunayDelaunay Tessellation for Surface DefinitionTessellation for Surface Definition

Sliced Surface For 1A42
5Å
6Å
4Å

Protein Pest (PPEST) Descriptors using MOE Surface as locus for TAE surface properties

Protein “PEST” Descriptorsfor Hydrophobic Interaction Chromatography
1BLF
(lac
tofe
rrin
)13
5L (l
ysoz
yme)
MLP2 surface 1BLF MLP2 1BLF EP
135L MLP2 135L EPMLP2 surface

Hierarchical Structure of Proteins
1. Primary— linear sequence
2. Secondary— local, repetitive spatial
arrangements3. Tertiary
— 3-D structure of native fold
4. Quaternary— non-covalent
oligomerization of subunits (single polypeptides) into protein complexes
REENVYMAKLAEQAERYEEMVEFMEKVSNSLGSEELTVEERNLLSVAYKNVIGARRASWRIISSIEQKEESRGNEEHVNSIREYRSKIENELSKICDGILKLLDAKLIPSAASGDSKVFYLKMKGDYHRYLAEFKTGAERKEAAESTLTAYKAAQDIATTELAPTHPIRLGLALNFSVFYYEILNSPDRACNLAKQAFDEAIAELDTLGEESYKDSTLIMQLLRDNLTLWTSDMQDDGADEIKE
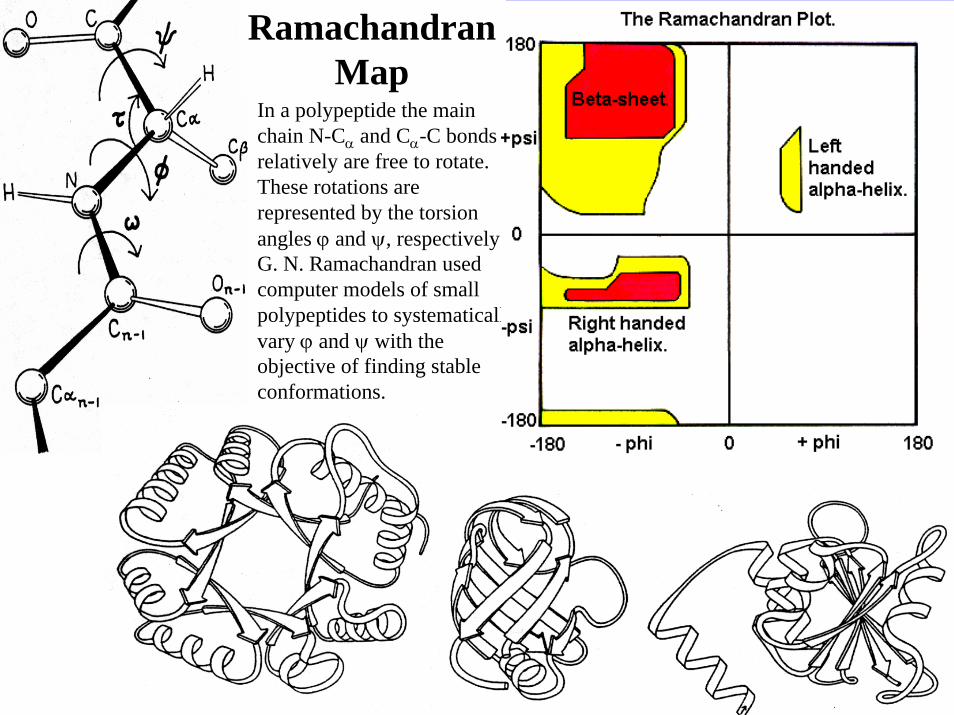
In a polypeptide the main chain N-Cα and Cα-C bonds relatively are free to rotate. These rotations are represented by the torsion angles ϕ and ψ, respectively.G. N. Ramachandran used computer models of small polypeptides to systematically vary ϕ and ψ with the objective of finding stable conformations.
RamachandranMap

Copyright ©2005 by the National Academy of Sciences
Sims, Gregory E. et al. (2005) Proc. Natl. Acad. Sci. USA 102, 618-621
Higher order Φ-Ψ maps and representative conformations

Protein fingerprint — Mihaly Mezei
FP0ij= sign {[r(Oi)-r(Ci)] . [r(Cj)-r(Ci)]}
FP1ij= sign {[r(Ni)-r(Ci)] . [r(Cj)-r(Ci)]}

QSAR assumptions
The properties of a chemical are implicit in its molecular structure
Molecular structure can be measured and represented with a set of numbers (descriptors or other numerical representation)
Compounds with similar structure exhibit similar properties; compounds with dissimilar structure exhibit dissimilar properties
— What about effects of the environment?All other factors should be held constant in assay;
Don’t compare apples to oranges.
— But which set of numbers?What descriptors to use?
Feature Selection.
— Similar in what way?

Machine Learning Methods
StatisticsStatistics? ?
“If your experiment needs statistics, you ought to have done a better experiment”
- Ernest Rutherford


![Toward a global maximization of the molecular similarity ... · Molecular Similarity Function: Superposition of Two Molecules PERE CONSTANS, LLUIS AMAT, RAMON CARBO´´]DORCA Institute](https://static.fdocuments.in/doc/165x107/5f08ed877e708231d42466ce/toward-a-global-maximization-of-the-molecular-similarity-molecular-similarity.jpg)