Molecular processes underlying the floral transition in ... · PDF fileMolecular processes...
14
Molecular processes underlying the floral transition in the soybean shoot apical meristem Chui E. Wong, Mohan B. Singh and Prem L. Bhalla * Plant Molecular Biology and Biotechnology laboratory, Australian Research Centre of Excellence for Integrative Legume Research, Faculty of Land and Food Resources, The University of Melbourne, Parkville, Vic. 3010, Australia Received 14 August 2008; revised 26 September 2008; accepted 9 October 2008; published online 27 November 2008. * For correspondence (fax +61 3 8344 5051; e-mail [email protected]). Summary The transition to flowering is characterized by a shift of the shoot apical meristem (SAM) from leaf production to the initiation of a floral meristem. The flowering process is of vital importance for agriculture, but the associated events or regulatory pathways in the SAM are not well understood, especially at a system level. To address this issue, we have used a GeneChip Ò containing 37 744 probe sets to generate a temporal profile of gene expression during the floral initiation process in the SAM of the crop legume, soybean (Glycine max). A total of 331 transcripts displayed significant changes in their expression profiles. The in silico and RT-PCR analysis on differentially regulated transcripts implies the intriguing involvement of sugar, auxin or abscisic acid (ABA) in events prior to the induction of floral homeotic transcripts. The novel involvement of ABA in the floral transition is further implicated by immunoassay, suggesting an increase in ABA levels in the SAM during this developmental transition. Furthermore, in situ localization, together with in silico data demonstrating a marked enhancement of abiotic stress-related transcripts, such as trehalose metabolism genes in SAMs, points to an overlap of abiotic stress and floral signalling pathways. Keywords: floral transition, soybean, shoot apical meristem, hormone, gene expression. Introduction The transition to flowering is a major event in a plant’s life that is marked by the switch of the shoot apical meristem (SAM) from leaf production to the initiation of floral organs. Such a developmental transition takes place only when environmental and endogenous factors are most favourable for reproductive success. One key environmental factor that regulates flowering is the change in day length (photoperiod), as flowering can be controlled by exposure to long days (LDs) or short days (SDs), depending on the plant species (for a review, see Corbesier and Coupland, 2006; Kobayashi and Weigel, 2007). The use of molecular genetic tools in the past decade has dramatically improved our understanding of the molecular aspects associated with the photoperiodic control of flower- ing time. Studies in the facultative long day (LD) model plant Arabidopsis thaliana have revealed that key elements of the LD pathway include light perception and clock components (Corbesier and Coupland, 2006; Imaizumi and Kay, 2006). The interaction of these two components ultimately leads to the circadian rhythm of CONSTANS (CO) expression, which in turn activates the expression of FLOWERING LOCUS T (FT): all of this takes place in the leaves. The FT protein has recently been proposed as the much sought-after long- distance signal that travels to the SAM to initiate flowering (Corbesier et al., 2007) by activating the floral meristem identity gene APETALA1 (AP1), together with a bZIP tran- scription factor (An et al., 2004; Abe et al., 2005). In addition to the LD pathway, other pathways, such as the vernalization or autonomous pathways, are also well characterized in Arabidopsis. Genes such as LEAFY (LFY), FT and SUPPRES- SOR OF CONSTANS1 (SOC1) have been identified to be at the junction that integrates inputs from different floral pathways, and conveys the resulting outcome to floral meristem identity genes at the SAM (Parcy, 2005). Whereas much of our current understanding of the different flowering pathways is derived from the mole- cular genetic approach focused mostly on Arabidopsis, Re-use of this article is permitted in accordance with the Creative Commons Deed, Attribution 2.5, which does not permit commercial exploitation. 832 ª 2008 The Authors Journal compilation ª 2008 Blackwell Publishing Ltd The Plant Journal (2009) 57, 832–845 doi: 10.1111/j.1365-313X.2008.03730.x
-
Upload
truongdien -
Category
Documents
-
view
220 -
download
3
Transcript of Molecular processes underlying the floral transition in ... · PDF fileMolecular processes...

Molecular processes underlying the floral transition in thesoybean shoot apical meristem
Chui E. Wong, Mohan B. Singh and Prem L. Bhalla*
Plant Molecular Biology and Biotechnology laboratory, Australian Research Centre of Excellence for Integrative Legume
Research, Faculty of Land and Food Resources, The University of Melbourne, Parkville, Vic. 3010, Australia
Received 14 August 2008; revised 26 September 2008; accepted 9 October 2008; published online 27 November 2008.*For correspondence (fax +61 3 8344 5051; e-mail [email protected]).
Summary
The transition to flowering is characterized by a shift of the shoot apical meristem (SAM) from leaf production
to the initiation of a floral meristem. The flowering process is of vital importance for agriculture, but the
associated events or regulatory pathways in the SAM are not well understood, especially at a system level. To
address this issue, we have used a GeneChip� containing 37 744 probe sets to generate a temporal profile of
gene expression during the floral initiation process in the SAM of the crop legume, soybean (Glycine max). A
total of 331 transcripts displayed significant changes in their expression profiles. The in silico and RT-PCR
analysis on differentially regulated transcripts implies the intriguing involvement of sugar, auxin or abscisic
acid (ABA) in events prior to the induction of floral homeotic transcripts. The novel involvement of ABA in the
floral transition is further implicated by immunoassay, suggesting an increase in ABA levels in the SAM during
this developmental transition. Furthermore, in situ localization, together with in silico data demonstrating a
marked enhancement of abiotic stress-related transcripts, such as trehalose metabolism genes in SAMs,
points to an overlap of abiotic stress and floral signalling pathways.
Keywords: floral transition, soybean, shoot apical meristem, hormone, gene expression.
Introduction
The transition to flowering is a major event in a plant’s life
that is marked by the switch of the shoot apical meristem
(SAM) from leaf production to the initiation of floral organs.
Such a developmental transition takes place only when
environmental and endogenous factors are most favourable
for reproductive success.
One key environmental factor that regulates flowering is
the change in day length (photoperiod), as flowering can be
controlled by exposure to long days (LDs) or short days
(SDs), depending on the plant species (for a review, see
Corbesier and Coupland, 2006; Kobayashi and Weigel, 2007).
The use of molecular genetic tools in the past decade has
dramatically improved our understanding of the molecular
aspects associated with the photoperiodic control of flower-
ing time. Studies in the facultative long day (LD) model plant
Arabidopsis thaliana have revealed that key elements of the
LD pathway include light perception and clock components
(Corbesier and Coupland, 2006; Imaizumi and Kay, 2006). The
interaction of these two components ultimately leads to the
circadian rhythm of CONSTANS (CO) expression, which in
turn activates the expression of FLOWERING LOCUS T (FT):
all of this takes place in the leaves. The FT protein has
recently been proposed as the much sought-after long-
distance signal that travels to the SAM to initiate flowering
(Corbesier et al., 2007) by activating the floral meristem
identity gene APETALA1 (AP1), together with a bZIP tran-
scription factor (An et al., 2004; Abe et al., 2005). In addition
to the LD pathway, other pathways, such as the vernalization
or autonomous pathways, are also well characterized in
Arabidopsis. Genes such as LEAFY (LFY), FT and SUPPRES-
SOR OF CONSTANS1 (SOC1) have been identified to be at
the junction that integrates inputs from different floral
pathways, and conveys the resulting outcome to floral
meristem identity genes at the SAM (Parcy, 2005).
Whereas much of our current understanding of the
different flowering pathways is derived from the mole-
cular genetic approach focused mostly on Arabidopsis,Re-use of this article is permitted in accordance with the Creative Commons
Deed, Attribution 2.5, which does not permit commercial exploitation.
832 ª 2008 The AuthorsJournal compilation ª 2008 Blackwell Publishing Ltd
The Plant Journal (2009) 57, 832–845 doi: 10.1111/j.1365-313X.2008.03730.x
physiologists were the first to investigate the control of
flowering using a variety of plant species (Kobayashi and
Weigel, 2007). For example, it was through the grafting
experiments performed on several photoperiodic species
that the hypothesis of flowering signal(s) transmitted from
the leaves to the SAM to initiate flowering was first
conceived.
Meanwhile, counterparts of the Arabidopsis flowering-
time genes and their targets have been found in a number of
other plant species. Although the functional conservation of
these orthologs has been demonstrated, there are some
intriguing variations on the Arabidopsis theme. For exam-
ple, the poplar FLOWERING LOCUS T2 (FT2) gene, a relative
of the Arabidopsis flowering-time gene FT, is not only a part
of the flower initiation pathway in poplar, but also plays an
additional role in regulating seasonal flower initiation that is
integrated with the poplar perennial growth habit (Hsu et al.,
2006). Mutant-based functional analyses in pea have shown
that the LFY ortholog, in addition to its role in floral initiation
as reported in Arabidopsis, also plays a part in leaf devel-
opment, a function not described in Arabidopsis (Hofer
et al., 1997). All of these examples demonstrate the ways in
which similar basic mechanisms might be adapted to
produce the great diversity of plant growth habit.
The flowering process is of vital importance for agricul-
ture and breeding because of its central role in determining
crop yield. However, the molecular control of flowering
remains very much unknown in the agriculturally and
economically important legume species soybean (Glycine
max). Soybean is one of the world’s most important crops,
being responsible for 55% of the worldwide oilseed produc-
tion. The translation of fundamental plant molecular biology
knowledge obtained using the model plant Arabidopsis to
corresponding processes in legume crop plants remains a
challenge, because legume plants display unique vegetative
and floral developmental complexities. Both soybean and
Arabidopsis are proposed to have diverged from a common
ancestor 92 million years ago (Zhu et al. 2003). Investiga-
tions on gene networks associated with the floral transition
in crop legumes such as soybean, and their comparison with
the existing knowledge in the model plant Arabidopsis, will
not only allow for the identification of evolutionarily con-
served processes controlling the floral transition, but will
also identify the processes that have undergone indepen-
dent variation and selection during �92 million years of
divergent speciation. Soybean in particular offers a quite
interesting case because of the availability of individual
genotypes that show variability in the photoperiod (and/or
temperature) stimulus requirements for the initiation of
flowering. Whether the basic flowering pathways revealed
from studies in Arabidopsis are conserved in soybean, how
the regulation is modified to adjust to the growth habit of a
vernalization-unresponsive SD species such as soybean
(Summerfield and Roberts, 1983), and what the key to the
different maturity groupings in soybean might be remain to
be determined.
The current understanding of floral pathways is incom-
plete, and, as pointed out by Corbesier and Coupland (2006),
there is a lack of biochemical components in the pathways.
By using other plant species, such as soybean, as model
systems to study the flowering process, novel components
or networks could be uncovered. Unlike Arabidopsis, soy-
bean floral meristems can revert to leaf production when
environmental growth conditions are switched from SDs to
LDs (Washburn and Thomas, 2000), and soybean also has a
flower development system in which more than one type of
organ is initiated at the same time (Tucker, 2003). Informa-
tion gained from the investigation of the molecular process
associated with the floral transition process in soybean
will provide a basis to explore these differences in plant
development.
We are interested in identifying the molecular events
taking place in the soybean terminal shoot apex that leads to
the conversion of the SAM into an inflorescence meristem,
and the initiation of the floral meristem as a result of an SD
photoperiod. Here, we have used a soybean GeneChip�
containing 37 744 G. max probe sets to study changes in
gene expression occurring in the SAM when it converts from
a vegetative meristem into an inflorescence meristem. To
this end, we isolated RNA from microdissected soybean
SAMs at various time points after plants were shifted from
non-flowering to flowering-inducing SD growth conditions.
We can thus expect to uncover genes that distinguish the
SAM before and after floral induction, and genes that are
responsible for the initiation of a floral meristem, as well as
any potential biochemical processes taking place in the SAM
that may account for this switch in the soybean develop-
mental program.
Results and discussion
Effect of SD treatment on soybean SAM
Soybean is a preferential SD plant, i.e. SD growth conditions
promote flowering, whereas LD photoperiods prolong veg-
etative growth (Thomas and Raper, 1983). The cultivar of
soybean used in this study is determinate, terminating
vegetative activity when the SAM becomes inflorescent. To
evoke the floral initiation process in the SAM, soybean
plants were grown from seeds under glasshouse conditions
(LD photoperiod) for 10 days before shifting to an SD growth
chamber (see Experimental procedures). Scanning electron
microscopy was then performed on microdissected shoot
apices to monitor the morphological changes happening at
the SAM in response to different lengths of SD treatment
(Figure 1).
On day 10 (0 SD), the SAM is in the vegetative stage
of development, with a dome-shaped vegetative apical
Floral transition in soybean 833
ª 2008 The AuthorsJournal compilation ª 2008 Blackwell Publishing Ltd, The Plant Journal, (2009), 57, 832–845

meristem initiating trifoliolate leaf primordia on its flanks
(Figure 1a). After experiencing 2 or 4 SDs the SAMs
remain quite similar in their morphology to that at 0 SD,
with SAMs at 4 SDs appearing rounder and fuller
(Figure 1b,c). Although it was clear that plants had shifted
to the reproductive phase of growth after 6 SDs, with the
appearance of the first bract of the terminal floral raceme
and a floral meristem (Figure 1e), plants of the same age
but grown continuously under glasshouse conditions
remain vegetative (Figure 1d). Another SEM taken of the
SAM after 10 SDs illustrates the continued development
of the floral primordium, with a progressively increased
number of organ whorls (Figure 1f). Therefore, under our
experimental conditions, when plants grown under glass-
house conditions (10-day-old plants) are shifted to an SD
growth chamber, the transformation of the SAM from its
vegetative stage to the reproductive stage of development
is evident morphologically after 6 SDs. We thus decided
to use this time point as the end point for our time course
experiment, as our primary interest is to map the initial
(a) (b)
(c)
(e)
(f)
(d)
SAM SAM
SAMSAM
FM
FM
FM
FM
IM
Br
S
L
Figure 1. The development of soybean apical
meristem.
(a, d) Shoot apical meristems of plants grown for
10 (a) or 17 (d) days under long-day conditions
with trifoliolate leaves (L) and subtending stip-
ules (S).
(b, c, e, f) Micrographs of 10-day-old meristems
after experiencing 2 (b; polar view), 4 (c), 6 (e) or
10 (f) short-day cycles, as outlined in the Exper-
imetal procedures. Abbreviations: Br, bract; FM,
floral meristem; IM, inflorescent meristem; SAM,
shoot apical meristem. Scale bars: 100 lm.
834 Chui E. Wong et al.
ª 2008 The AuthorsJournal compilation ª 2008 Blackwell Publishing Ltd, The Plant Journal, (2009), 57, 832–845

molecular events in the SAM leading to the floral
evocation process.
Identification of differentially expressed transcripts during
floral induction
We used the soybean GeneChip� system to monitor the
gene expression changes taking place in the SAM during the
switch from the vegetative to the reproductive phase of
development. RNA was isolated from microdissected soy-
bean SAMs from plants at 10-days old (0 SD), and after 1, 2, 4
or 6 SDs. Whereas only dome-shaped SAMs were dissected
for 0, 1, 2 and 4 SDs time points, the newly converted
inflorescence meristem and the adjacent floral meristem
were collected for the 6-SDs time point, in order to capture
transcripts that are essential in establishing the floral
meristem.
Raw intensity data from microarray hybridizations were
normalized using the Robust Multiarray Averaging method
implemented in AFFYLIMMAGUI (Wettenhall and Smyth,
2004). A methodology called Microarray Significant Profiles
(MASIGPRO) was then used to identify transcripts with
significantly different expression profiles in the time-course
experiment (Conesa et al., 2006; see Experimental proce-
dures. Unlike statistical methods that focus on pairwise
comparison, MASIGPRO does not evaluate differences
between time points, but instead considers the expression
profiles across the complete time course, and determines if
the corresponding profile for a particular transcript is
changing significantly, and hence is effective in capturing
the dynamic nature of time-course data (Conesa et al., 2006).
Using MASIGPRO implemented in R, a total of 331 tran-
scripts were detected to have significant changes (adjusted
P < 0.05) in their expression profiles throughout the time
course investigated (Table S1). The 331 transcripts were
subsequently clustered according to the pattern of their
temporal change in the expression profile into 10 clusters
using k-means clustering. The resulting clusters contained
transcripts that displayed overall trends of either increased
(Figure 2, clusters 2–8) or decreased (Figure 2, clusters 1, 9
and 10) gene expression over the time course of the study.
The former set contained a total of 237 transcripts, with
members in cluster 4 (Figure 2) displaying the highest -fold
changes in gene expression levels. We performed reverse
(a) (b) 10
9
8
7
6
5
4
3
2
1
0 10
9
8
7
6
5
4
3
2
1
0
9
8
7
6
5
4
3
2
1
0
9
10
11
12
8
7
6
5
4
3
2
1
0
9
10
8
7
6
5
4
3
2
1
0
9
10
8
7
6
5
4
3
2
1
0
9
10
8
7
6
5
4
3
2
1
0
9
8
7
6
5
4
3
2
1
0
9
8
7
6
5
4
3
2
1
0
Cluster 10 (4)
0SD 1SD 2SD 4SD 6SD
Cluster 9 (26)
Cluster 8 (51)
Cluster 7 (12)
Cluster 6 (78)
Cluster 5 (29)–3.0 0
1SD-0SD 2SD-1SD 4SD-2SD 6SD-4SD
Log2 ratio
3.0
Cluster 4 (9)
Cluster 3 (3)
Cluster 2 (56)
Cluster 1 (63)
Cluster 1 (63)
Cluster 2 (56)
Cluster 3 (3) Cluster 4 (9)
Cluster 5 (29)
Cluster 6 (78)
Cluster 7 (12)
Cluster 8 (51)
Cluster 9 (26)
Cluster 10 (4) 9
10
8
7
6
5
4
3
2
1
0
Figure 2. (a) Clustering analysis of 331 transcripts with significant expression
profile changes across the time points investigated. The transcripts were
classified based on the similarity of their expression profiles using the k-
means clustering technique implemented in CLUSTER 3.0. The x-axis indicates
the time points at which the shoot apical meristems (SAMs) were dissected
following 0, 1, 2, 4 and 6 short days (SDs), whereas the y-axis represents the
average values of the normalized and log2 transformed signal intensity values
of the transcripts in the cluster. The total number of transcripts in each cluster
is indicated in parentheses.
(b) Heat map representing the expression changes for transcripts with
differential expression profiles throughout the time points under study.
Floral transition in soybean 835
ª 2008 The AuthorsJournal compilation ª 2008 Blackwell Publishing Ltd, The Plant Journal, (2009), 57, 832–845

transcription (RT)-PCR analysis on 27 selected genes repre-
sentative of the 10 clusters to check the validity of the
microarray analysis (Figure 3). The soybean actin gene
(AFFX-GM_ACTIN_M_AT) has similar intensity values across
all data sets, and therefore was used as an internal control. In
all cases, the expression profiles obtained by RT-PCR were
generally in agreement with those provided by the micro-
array analysis.
Transcripts with an increasing trend of expression during
floral initiation
Induction of putative floral homeotic transcripts. Two thirds
of the sequences in cluster 4 are predicted to encode various
members of the MADS-box family of transcription factors
(Table S1). Among them are FRUITFUL (Gma.4041.1.S1_at),
AP1 (Gma.16141.1.A1_at) and SEPALLATA3 (SEP3;
GmaAffx.45324.1.S1_at), which were induced drastically
after 4 SDs (Figure 2). Similar genes in Arabidopsis are
established as floral meristem identity genes, and play
important roles in promoting either floral organ formation or
inflorescent commitment in floral meristems (Ng and
Yanofsky, 2001; Yu et al., 2004). The identified induction of
these transcripts in the soybean SAM after 4 SDs reveals that
the transition of the soybean SAM to reproductive devel-
opment has taken place at this particular time point. This
also lends further support to the potential of our study to
distinguish early molecular events taking place in the SAM
that contribute to the progression from the vegetative stage
to the inflorescent meristem.
To reveal the spatial expression patterns and to assess the
possible conserved function of MADS-box floral genes in
soybean, we performed in situ hybridization for three
selected genes. A robust AP1-related signal was apparent
in the incipient floral primordia at the floral development
stage, with expression of AP1 throughout the newly
emerged floral meristem (Figure 4a–c). Intriguingly, some
signal was also observed at the inflorescent meristem after 6
SDs (Figure 4c), which has not been reported in Arabidopsis
(Mandel et al., 1992). This probably reflects some diver-
gence of function of AP1 in soybean. Unfortunately, the
accumulation of the other two transcripts after 4 SDs was
only detectable by RT-PCR analysis (Figure 3), and not in situ
(Figure 4d,f). Faint signals associated with these two genes
were observed after 6 SDs throughout the inflorescent
meristem (Figure 4e,g).
Events potentially driving the floral initiation process at the
SAM. Clusters 3 and 5 contain transcripts with gene
expression induced prior to that of the floral meristem
identity genes, i.e. between 0 and 2 SDs. There are three
transcripts in cluster 3, and these are annotated as genes
encoding indole-3-acetic acid (IAA)-amino acid hydrolase 6
(Gma.3543.1.S1_at), b-amylase (GmaAffx.89961.1.S1_at) or
shikimate dehydrogenase (Gma.6184.1.S1_at). Cluster 5
contains 29 transcripts that are predicted to encode a variety
of gene products ranging from those that are associated with
the phytohormones, auxin, ABA and jasmonic acid, to those
that are annotated simply as unknown (Table S1). It is also
likely that some important transition events may have
occurred between 2 and 4 SDs of treatment, as demonstrated
by the marked increase of floral homeotic transcripts in
cluster 4.
The differential expression of a putative b-amylase gene
(GmaAffx.89961.1.S1_at; cluster 3) is not surprising, as
sugar has been suggested to promote the floral transition
in many plant species (Bernier et al., 1993; Ohto et al.,
2001). The corresponding encoded product is probably
associated with the mobilization of reserve starch in the
SAM, in response to the changes of relative sink strength
that favour the floral transition process. Nonetheless, the
availability of sugars could also be an important factor in
the control of the expression of a variety of genes, as
sugars not only serve as a source of carbon and energy,
but also have important signalling functions (Rook et al.,
2006). The concomitant upregulation of transcripts
associated with sugars and ABA is also in line with the
finding that signalling pathways mediated by ABA and
sugars interact to regulate plant development (Gibson,
2004; Rook et al., 2006).
In plants, IAA is the form of auxin that generates the
majority of auxin effects. Factors that influence the steady-
state levels of free IAA in plant cells include biosynthesis by
the tryptophan-dependent pathway, and reversible conju-
gation with amino acids. Our study provides correlative
evidence for the early presence of IAA in the SAM before the
induction of floral homeotic transcripts. The induction of a
putative IAA-amino acid hydrolase 6 (Gma.3543.1.S1_at;
cluster 3), as observed in this study (Figure 2), may be
associated with the immediate need to hydrolyse the stored
IAA-amino acid conjugate to release the active IAA for the
floral initiation process. The increased expression of puta-
tive tryptophan synthase (Gma.736.1.A1_at), an auxin efflux
carrier (Gma.11084.1.S1_at) and a number of auxin-respon-
sive proteins (Gma.17759.1.S1_at, GmaAffx.91936.1.S1_
s_at; Gma.2563.1.S1_a_at; Table S1) at a later time point (4
or 6 SDs) further support the possibility that there is an
increase in auxin levels in the SAM during the floral initiation
process.
The 9-cis-epoxycarotenoid dioxygenase (NCED) protein
catalyses a rate-limiting step in ABA biosynthesis in plants
by cleaving 9-cis-xanthophylls to xanthoxin, a precursor of
ABA (Taylor et al., 2005). The upregulation of NCED1 hints at
an increase in ABA levels in the SAM during the floral
evocation process. This prompted us to determine whether
the increase in ABA biosynthetic transcripts translates to an
increase in ABA levels in the SAM. The ABA content in SAMs
microdissected from plants treated with 0 or 4 SDs were
836 Chui E. Wong et al.
ª 2008 The AuthorsJournal compilation ª 2008 Blackwell Publishing Ltd, The Plant Journal, (2009), 57, 832–845
GmaAffx.18746.1.S1_at Basic leucine zipper transcription factor 1
1
1
2
2
2
3
3
3
4
4
4
4
4
5
5
6
6
7
7
8
9
9
9
10
10
10
Glutamate carboxypeptidase (AMP1)
ETHYLENE OVERPRODUCER 1
Unknown protein
SHOOT MERISTEMLESS (STM)
Regulator of chromosome condensation protein
IAA-amino acid hydrolase 6
Shikimate dehydrogenase
Beta-amylase
Abscisic acid responsive elements-binding factor
MADS box floral homeotic protein APETALA1
MADS box protein 2
MADS box fprotein FRUITFUL
MADS box protein AGL9
9-cis-epoxycarotenoid dioxygenase (NCED1)
Dof-type zinc finger protein
Serine carboxypeptidase (BRS1)
Serine/threonine protein kinase
INCOMPOSITA protein
Cytochrome P450 family protein
Polygalacturonase inhibiting protein 1
Glycosyl hydrolase family 1 protein
Hypoxia-responsive family protein
Basic helix-loop-helix (bHLH) family protein
Homeobox protein knotted-1 like 2 (KNAT2)
Trehalose-6-phosphate synthase (TPS)
Glycine-rich RNA-binding protein
Number of short-day cycle0 1 2 4 6 Clustera
GmaAffx.31209.1.S1_at
GmaAffx.48927.1.S1_at
Gma.12094.1.A1_at
Gma.7714.1.S1_at
Gma.3543.1.S1_at
Gma.6184.1.S1_at
GmaAffx.89961.S1_at
GmaAffx.32011.S1_at
Gma.16141.1.A1_at
Gma.1882.1.S1_at
Gma.4041.1.S1_at
GmaAffx.45324.1.S1_at
Gma.12393.S1_at
Gma.13269.2.A1_at
Gma.2488.1.S1_at
GmaAffx.81999.1.S1_at
GmaAffx.21003.1.S1_at
Gma.5650.2.S1_at
Gma.13085.1.S1_at
Gma.12619.1.A1_at
Gma.4206.1.S1_at
Gma.9637.1.S1_at
Gma.16515.2.S1_at
Gma.3013.1.S1_at
GmaAffx.79175.1.S1_at
Actin
GmaAffx.6888.2.S1_at
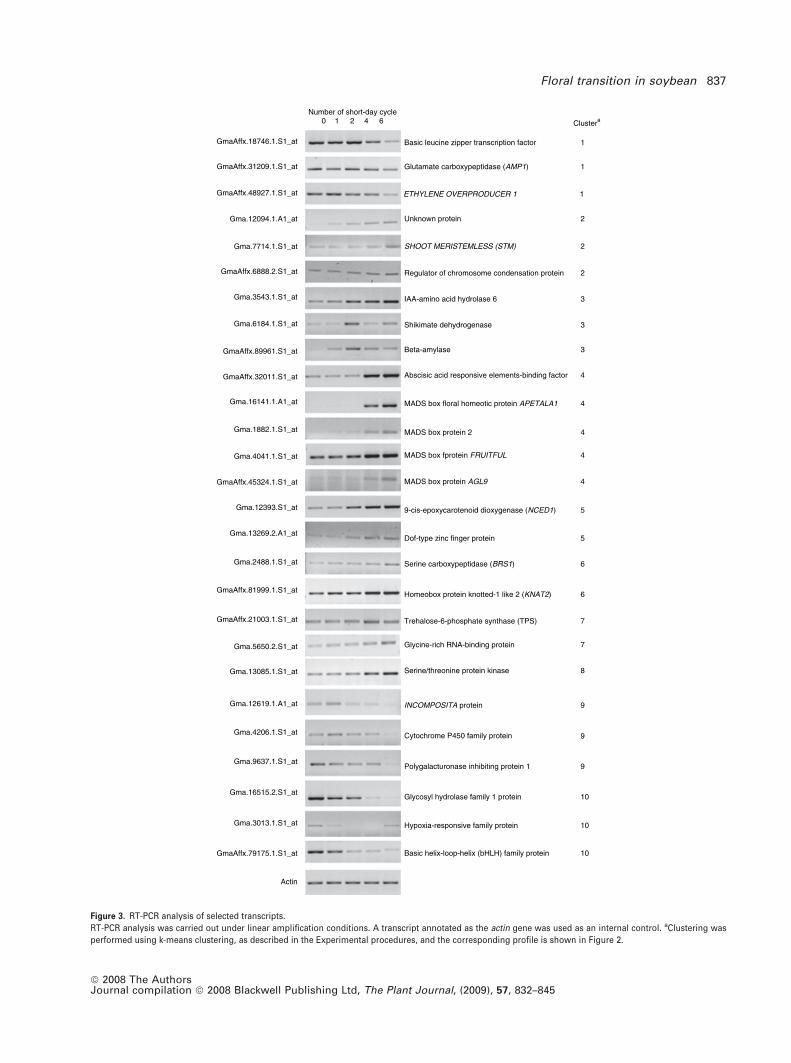
Figure 3. RT-PCR analysis of selected transcripts.
RT-PCR analysis was carried out under linear amplification conditions. A transcript annotated as the actin gene was used as an internal control. aClustering was
performed using k-means clustering, as described in the Experimental procedures, and the corresponding profile is shown in Figure 2.
Floral transition in soybean 837
ª 2008 The AuthorsJournal compilation ª 2008 Blackwell Publishing Ltd, The Plant Journal, (2009), 57, 832–845

measured using an immunoassay. There was a significant
increase in the ABA level in microdissected SAMs from 4-SD
plants in comparison with untreated 10-day-old controls
(Figure 5). This correlative evidence implies a floral-promot-
ing role for ABA in soybean. We further compared our data
set with the data sets generated from a recent study in
Arabidopsis analysing the transcriptional effects of different
hormones, including ABA (Nemhauser et al., 2006). This
resulted in the identification of 68 transcripts with Arabid-
opsis orthologues that are responsive to ABA (Table S2).
This lends further support to the possibility of an increase in
ABA levels in the soybean SAM during the early phase of
reproductive development.
Intriguingly, a transcript annotated as abscisic acid
responsive elements-binding factor (ABRE) is grouped
together in cluster 4 with other floral meristem identity
genes, including AP1 (Table S1). When the spatial expres-
sion of this gene was investigated, signals related to the
expression of this gene could be detected surrounding the
vascular system at the SAM after 4 SDs, but not in the
vegetative SAM (0 SD; Figure 6a,b). This spatial information
raises the possibility that the induction of ABRE expression
may result directly from the arrival of the floral stimulus at
the shoot apex, and may subsequently participate in the
induction of ABA-responsive genes.
The promoting role of ABA in flowering is ambiguous. A
recent study in Arabidopsis has reported an RNA binding
protein initially identified for its role in promoting flowering,
Flowering time control protein A (FCA), to be an ABA
receptor; the interaction of this protein with ABA resulted in
a delay of the flowering process (Razem et al., 2006).
Arabidopsis mutants with defects in a positive regulator of
ABA signalling have been found to display delayed flower-
ing (Brocard-Gifford et al., 2004), which seems to contradict
the postulated repressive role of ABA in flowering presented
by Razem et al. (2006). To complicate things further, there
are also Arabidopsis mutants with an impaired negative
regulator of ABA signalling, but with an early flowering
(a) (b) (c)
(d)
(g)
(e) (f)
4 SD AP1 6 SD AP12 SD AP1
6 SD AGL9 4 SD MADS BOX24 SD AGL9
6 SD MADS BOX2
Figure 4. In situ localization of putative floral
homeotic transcripts in the soybean shoot
apices.
(a–c) Expression of APETALA 1 (AP1;
Gma.16141.1.A_at) was detected after 4 short
days (SDs) in the outer region of the shoot apical
meristem (SAM), from which the floral primordia
eventually emerge. After 6 SDs, a signal was
observed in the inflorescent meristem and two
adjacent floral meristems.
(d, e) Expression of a transcript encoding the
MADS-box protein AGL9 (GmaAffx.45324.1.
S1_at) was detected after 6 SDs in the main
SAM with floral primordia.
(f, g) Expression of a putative MADS BOX 2 gene
(Gma.1882.1.S1_at) in the SAM with floral pri-
mordia after six SDs. All are longitudinal sections
of paraffin-embedded shoot apices probed with
the antisense strand of digoxigenin-labelled
RNA.
Figure 5. Measurement of ABA levels in the SAM during the floral transition
process.
Data represent mean values of n = 61 plants after 0 short days (SDs) or n = 57
plants after for 4-SDs of two biological replicates (levels of ABA: 0
SD1 = 0.0025, 4 SD1 = 0.012; 0 SD2 = 0.004, 4 SD2 = 0.0085 pmol per SAM);
error bars indicate the ranges of the data.
838 Chui E. Wong et al.
ª 2008 The AuthorsJournal compilation ª 2008 Blackwell Publishing Ltd, The Plant Journal, (2009), 57, 832–845
phenotype (Hugouvieux et al., 2001), and physiological
experiments have demonstrated that ABA can promote
flowering in a number of SD plants (El-Antably et al., 1967;
Podolnyi et al., 1989; Wilmowicz et al., 2008). It is likely that
the opposing effects of ABA on flowering revealed from
mutant analyses result from pleiotropic effects of the
mutations, rather than from direct consequences of altered
ABA signalling. FCA is known to act in the autonomous floral
pathway; whether this means that ABA may exert a different
effect in the photoperiodic regulation of flowering awaits
further investigation. Nonetheless, this study has revealed
an increase in ABA levels in the SAM during the floral
initiation process using an immunoassay, and hence
strongly implicates the involvement of ABA in regulating
the flowering process.
Our findings raise important questions about the under-
lying mechanisms by which hormones, ABA in particular,
associate with the floral transition process. The induction of
hormone-related transcripts in this study occurs prior to
known floral genes. There is thus a possibility that these
hormones may directly or indirectly regulate the transcrip-
tion of these genes. For example, the protein farnesyltrans-
ferase was found to be involved in ABA signal transduction
in Arabidopsis (Cutler et al., 1996), and the Yalovsky et al.
(2000) study has established that AP1 is a target of farnesyl-
transferase, and that farnesylation alters the function and
perhaps specificity of the transcription factor.
ABA is known as a stress hormone. There was also a
striking occurrence of transcripts associated with abiotic
stress among the sequences identified to be differentially
regulated in the flowering process in soybean. An overlap
of the floral signalling pathway in soybean with that of
abiotic stress is therefore very probable. Further molecu-
lar support comes from a recent study reporting the
existence of a cluster of flowering control proteins in the
interaction network associated with abiotic stress (Tardif
et al., 2007).
There is substantial evidence for crosstalk between the
signalling pathways regulating responses to ABA, auxin or
sugar. It is likely that each of these is involved in crosstalk
and interacts in a complex regulatory network, fine tuning
the floral initiation process and thereby allowing SAMs to
be flexible in responding to specific developmental and
environmental cues.
Transcripts associated with the establishment of the floral
meristem. Clusters 2, 6 and 7 contain transcripts that are
mostly upregulated after 6 SDs (the last time point), with
varying magnitudes of increase among the clusters (Fig-
ure 2), and these transcripts are likely to function in the
establishment of the floral meristem. The presence of a
possible meristem regulatory transcript, SHOOT MERI-
STEMLESS (STM), in cluster 2 probably reflects the increase
in meristem number after floral induction. In Arabidopsis,
STM is required for the initiation and maintenance of vege-
tative SAMs (Barton and Poethig, 1993; Endrizzi et al., 1996),
in addition to the well-established WUSCHEL-CLAVATA
antagonistic pathway (reviewed in Bhalla and Singh, 2006;
Singh and Bhalla, 2006). STM is also essential in floral
meristem patterning, and in the development of carpels
(Scofield et al., 2007). The spatial expression of this tran-
script throughout the floral meristem seems to suggest that
a conserved function is likely (Figure 6c,d). Other transcripts
annotated to encode homeobox proteins, such as the
KNOTTED1-LIKE family (KNAT2, GmaAffx.81999.1.S1_at;
(a) (b)
(c) (d)
(e) (f)
0 SD ABRE 4 SD ABRE
0 SD STM 6 SD STM
0 SD TPS 6 SD TPS
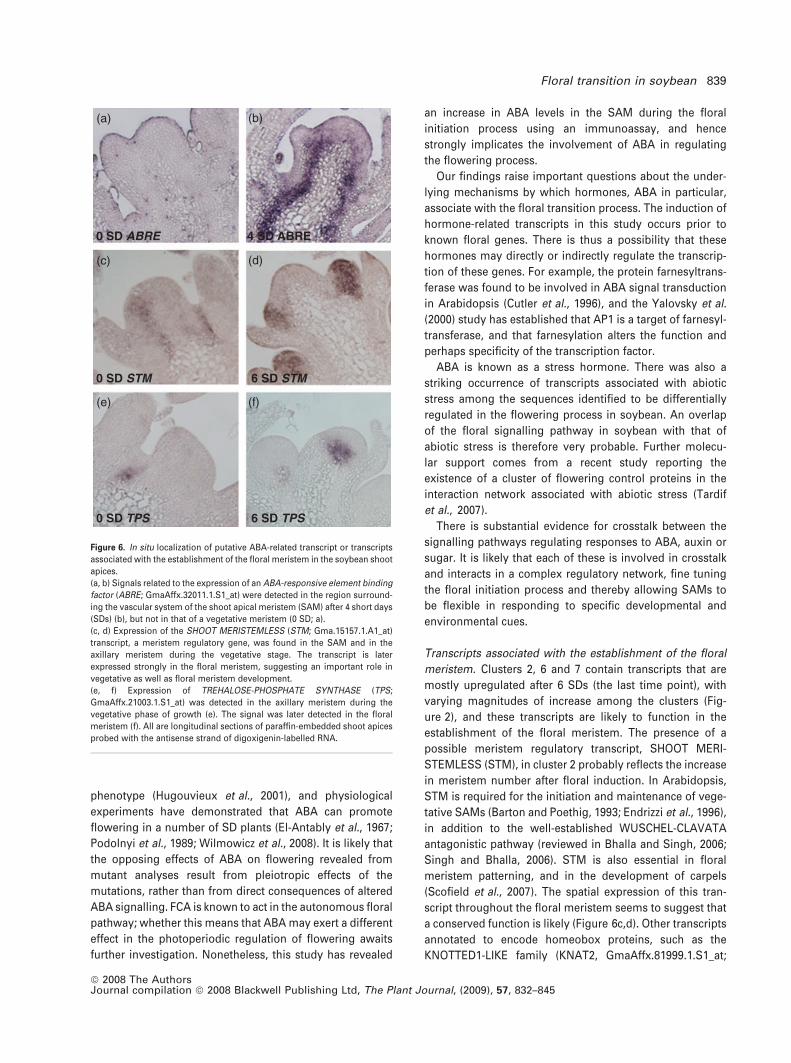
Figure 6. In situ localization of putative ABA-related transcript or transcripts
associated with the establishment of the floral meristem in the soybean shoot
apices.
(a, b) Signals related to the expression of an ABA-responsive element binding
factor (ABRE; GmaAffx.32011.1.S1_at) were detected in the region surround-
ing the vascular system of the shoot apical meristem (SAM) after 4 short days
(SDs) (b), but not in that of a vegetative meristem (0 SD; a).
(c, d) Expression of the SHOOT MERISTEMLESS (STM; Gma.15157.1.A1_at)
transcript, a meristem regulatory gene, was found in the SAM and in the
axillary meristem during the vegetative stage. The transcript is later
expressed strongly in the floral meristem, suggesting an important role in
vegetative as well as floral meristem development.
(e, f) Expression of TREHALOSE-PHOSPHATE SYNTHASE (TPS;
GmaAffx.21003.1.S1_at) was detected in the axillary meristem during the
vegetative phase of growth (e). The signal was later detected in the floral
meristem (f). All are longitudinal sections of paraffin-embedded shoot apices
probed with the antisense strand of digoxigenin-labelled RNA.
Floral transition in soybean 839
ª 2008 The AuthorsJournal compilation ª 2008 Blackwell Publishing Ltd, The Plant Journal, (2009), 57, 832–845
KNAT4, Gma.2376.1.S1_at) in cluster 6, may represent
candidates that are likely to be important in the maintenance
of the vegetative as well as the floral meristem. In fact, in
Arabidopsis, the KNAT2 (for KNOTTED-like from A. thaliana
2) homeobox gene is found to be expressed in the vegetative
apical meristem, and subsequently plays a role in carpel
development (Pautot et al., 2001).
Among the transcripts in clusters 2, 6 and 7, there were
three sequences associated with trehalose metabolism
(GmaAffx.65216.1.S1.at, GmaAffx.21003.1.S1.at and Gma
Affx.5765.1.S1.at; Table S1). Trehalose phosphate synthase
(TPS) is known to catalyse the transfer of glucose from
uridine diphosphate glucose (UDP) to glucose-6-phosphate,
producing trehalose-6-phosphate (T6P) and UDP, whereas
trehalose-6-phosphatase (TPP) hydrolyses T6P to release
trehalose. When the spatial expression of the two trehalose
metabolism-associated transcripts was investigated, we
could only successfully detect expression related to TPS
(Figure 6e,f). TPS was expressed in the axillary meristem
during the vegetative stage of development (0 SD; Fig-
ure 6e), and later on, its expression was detected in the
centre of the floral meristem (6 SDs; Figure 6f). The presence
of TPS in the axillary meristem and subsequently in the floral
meristem suggests a role in the control of the formation of
secondary axes of growth: vegetative and inflorescent
branches.
Intriguingly, there is evidence linking ABA with trehalose
metabolism (Li et al., 2006), and hence it is tempting to
speculate that ABA may act partly through trehalose in
triggering the later floral response. Trehalose, a dimer of
glucose, is a sugar of emerging significance (Grennan, 2007;
Paul, 2007), and has been described as ‘a metabolic regu-
lator that has an impact like that of a hormone’ (Paul, 2007). It
is believed that the phoshorylated form of trehalose, T6P, is
the active component that regulates its effect. The associa-
tion of trehalose metabolism with the flowering process was
first reported by Dijken and co-workers, who demonstrated
in Arabidopsis that TPS is not only essential for normal
vegetative growth but also for the transition to flowering
(Dijken et al., 2004). A recent study demonstrated that
inflorescent branching in maize is determined by a TPP
gene, probably through the alteration of a trehalose sugar
signal (Satoh-Nagasawa et al., 2006). T6P is associated with
the expression of transcription factors that regulate starch
synthesis and ABA signalling (Avonce et al., 2004; Ramon
et al., 2007), implicating a complex interplay between sugar
metabolism and ABA in the floral evocation process in
soybean.
Transcripts with a decreasing trend of expression during
floral initiation
The onset of reproductive development is also characterized
by the downregulation of genes in incipient floral primordia,
and the corresponding transcripts are grouped in clusters 1,
9 and 10. These clusters potentially contain floral repressors
that are downregulated to allow floral development to take
place. This is exemplified by the downregulation of a tran-
script annotated to encode the SHORT VEGETATIVE PHASE
protein (GmaAffx.9006.2.S1_at). The repression of this
MADS-box gene is in agreement with data in Arabidopsis
and barley that revealed the corresponding orthologue to be
a negative regulator of the flowering process (Hartmann
et al., 2000; Trevaskis et al., 2007). The occurrence of this
transcript further demonstrates the validity of our data, and
strengthens the probability that transcripts in this cluster
represent noteworthy candidates for floral repressors for
further study.
Functional categories of transcripts perturbed during
floral initiation
As most soybean transcripts could be assigned to a match-
ing Arabidopsis locus, based on its best match with the
Arabidopsis protein database, we used GOTOOLBOX (Martin
et al., 2004) to identify statistically over-represented gene
ontology (GO) terms in our data set to infer functional per-
turbations in response to floral initiation, or the subsequent
stages of floral meristem establishment. When the induced
gene data set was analysed with GOTOOLBOX, approxi-
mately 60% of the transcripts could be successfully cate-
gorized according to GO biological processes (http://
www.geneontology.org). Besides the expected GO terms
associated with processes such as response to ABA stimu-
lus, regulation of transcription and trehalose metabolism,
signal transduction and brassinosteroid-mediated signalling
were also significantly enriched in the induced gene data
sets (Table 1A). These categories include a two-component
phosphorelay mediator (Gma.12547.1.A1_at; AT3G21510), a
number of leucine-rich repeat protein kinases, a brassinos-
teroid (BR) signalling positive regulator, BES1/BZR1
(Gma.1423.1.S1_a_at; AT1G75080) and a serine carboxy-
peptidase, BRS1 (Gma.2488.1.S1_at; AT4G30610), that plays
a role in BR signalling (Li et al., 2001).
Protein phosphorylation is a key mechanism for intracel-
lular signal transduction in both eukaryotic and prokaryotic
cells. The enrichment of protein kinases in the signal
transduction functional category prompted us to examine
our gene list for the presence of other putative protein
kinases that are not annotated using the GO classification
system. This resulted in the identification of a total of 15
transcripts annotated to encode different protein kinases
(Table 2). In plants, phosphorelay two-component systems
play important roles in histidine kinase-mediated signal
transduction in response to environmental stimuli and
growth regulators (for a review, see Urao et al., 2000). The
temporal induction of this kinase in this study suggests
it may play additional roles in regulating the flowering
840 Chui E. Wong et al.
ª 2008 The AuthorsJournal compilation ª 2008 Blackwell Publishing Ltd, The Plant Journal, (2009), 57, 832–845
process. The induction of other protein kinases, such as the
leucine-rich repeat transmembrane protein kinase, may be
related to the ABA-mediated signalling pathway, as a recent
study has reported a similar gene to be a key membrane-
bound regulator of early ABA signalling in Arabidopsis
(Osakabe et al., 2005).
Surprisingly, in the repressed gene data set the functional
category associated with hormonal response was also
significantly enriched (Table 1B). This indicates a complex-
ity of hormone-mediated signalling that involves not only
positive but also negative elements. Furthermore, the
transcript profiling defining the floral evocation process, or
the subsequent stages of floral development described here,
involved the gene expression changes of all cell types in the
meristem. The up- or downregulation of different genes
responsive to the same hormone may reflect the different
effects of the hormones on the different cell types in
the meristem that are necessary to generate the desired
outcome at the SAM.
Comparison of expression profiles associated with floral
transition in Arabidopsis and soybean
Recently, a number of studies have aimed at the character-
ization of the Arabidopsis floral transcriptome (Schmid
et al., 2003; Zhang et al., 2005; Wellmer et al., 2006). How-
ever, only the approach of Schmid et al. (2003) in Arabid-
opsis is relevant to this study, as they used excised shoot
apexes (i.e. SAMs with leaf primordia and developing
leaves) at different time points following floral induction. In
contrast, in this study we used microdissected SAMs to
obtain a more accurate picture of global gene expression
changes happening in the meristem. Changes in the Ara-
bidopsis transcriptome were examined using the Arabid-
opsis ATH1 array, which contains 22 810 probe sets (Schmid
et al., 2003). Using matching Arabidopsis loci assigned to
the soybean transcripts (see Experimental procedures), we
compared the list of transcripts identified to be differentially
regulated in this study with that of Schmid et al. (2003)
(Table S3).
There was an overlap of only 24 transcripts, with 14 of
them displaying similar expression profile changes
(Figure 7). The lack of overlap can partly be attributed to
the fact that neither the meristem dissection scheme
employed nor the time points investigated are exactly
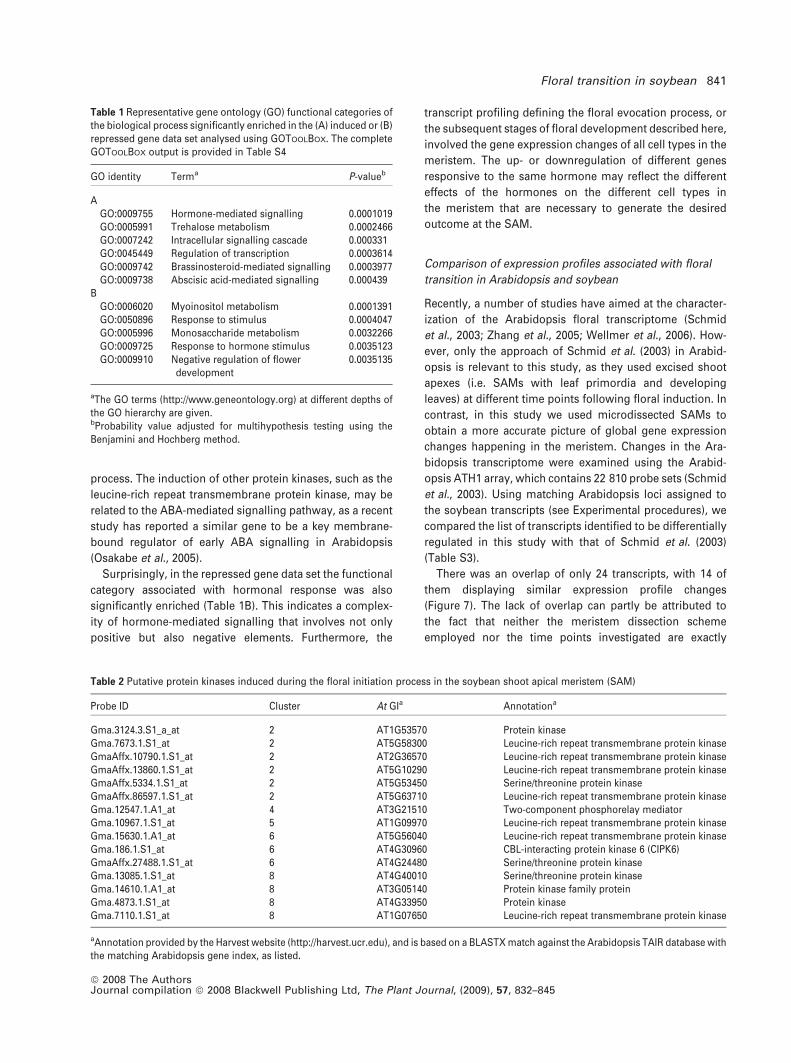
Table 2 Putative protein kinases induced during the floral initiation process in the soybean shoot apical meristem (SAM)
Probe ID Cluster At GIa Annotationa
Gma.3124.3.S1_a_at 2 AT1G53570 Protein kinaseGma.7673.1.S1_at 2 AT5G58300 Leucine-rich repeat transmembrane protein kinaseGmaAffx.10790.1.S1_at 2 AT2G36570 Leucine-rich repeat transmembrane protein kinaseGmaAffx.13860.1.S1_at 2 AT5G10290 Leucine-rich repeat transmembrane protein kinaseGmaAffx.5334.1.S1_at 2 AT5G53450 Serine/threonine protein kinaseGmaAffx.86597.1.S1_at 2 AT5G63710 Leucine-rich repeat transmembrane protein kinaseGma.12547.1.A1_at 4 AT3G21510 Two-component phosphorelay mediatorGma.10967.1.S1_at 5 AT1G09970 Leucine-rich repeat transmembrane protein kinaseGma.15630.1.A1_at 6 AT5G56040 Leucine-rich repeat transmembrane protein kinaseGma.186.1.S1_at 6 AT4G30960 CBL-interacting protein kinase 6 (CIPK6)GmaAffx.27488.1.S1_at 6 AT4G24480 Serine/threonine protein kinaseGma.13085.1.S1_at 8 AT4G40010 Serine/threonine protein kinaseGma.14610.1.A1_at 8 AT3G05140 Protein kinase family proteinGma.4873.1.S1_at 8 AT4G33950 Protein kinaseGma.7110.1.S1_at 8 AT1G07650 Leucine-rich repeat transmembrane protein kinase
aAnnotation provided by the Harvest website (http://harvest.ucr.edu), and is based on a BLASTX match against the Arabidopsis TAIR database withthe matching Arabidopsis gene index, as listed.
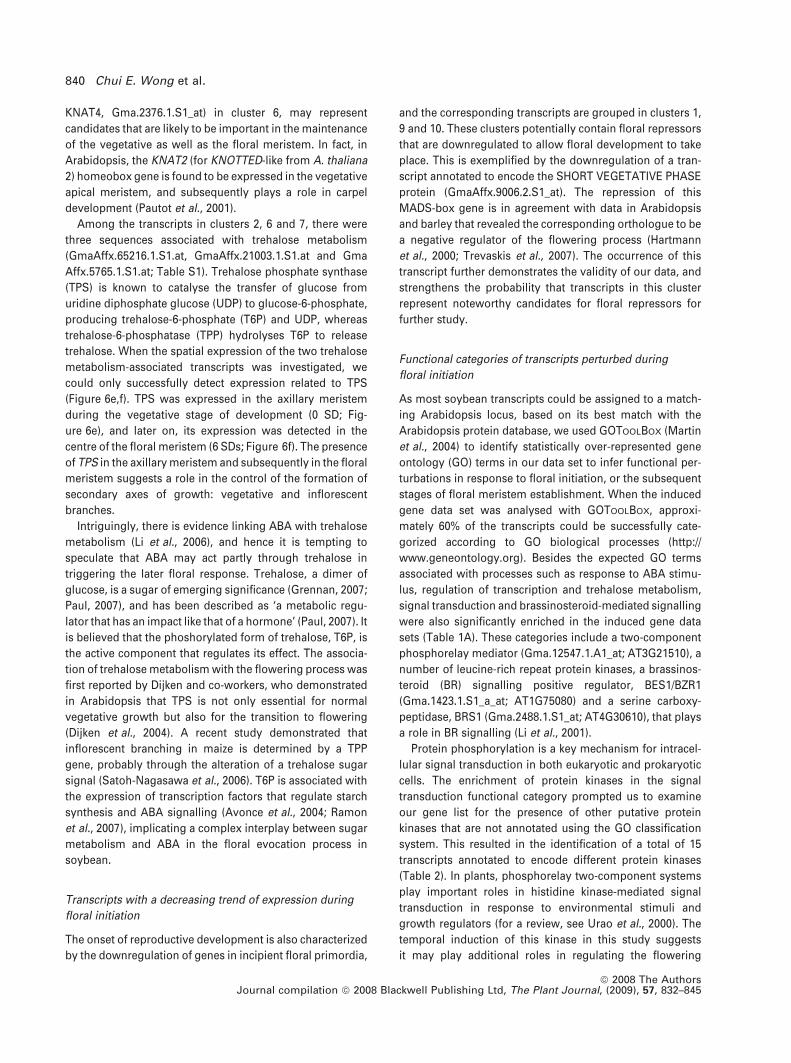
Table 1 Representative gene ontology (GO) functional categories ofthe biological process significantly enriched in the (A) induced or (B)repressed gene data set analysed using GOTOOLBOX. The completeGOTOOLBOX output is provided in Table S4
GO identity Terma P-valueb
AGO:0009755 Hormone-mediated signalling 0.0001019GO:0005991 Trehalose metabolism 0.0002466GO:0007242 Intracellular signalling cascade 0.000331GO:0045449 Regulation of transcription 0.0003614GO:0009742 Brassinosteroid-mediated signalling 0.0003977GO:0009738 Abscisic acid-mediated signalling 0.000439
BGO:0006020 Myoinositol metabolism 0.0001391GO:0050896 Response to stimulus 0.0004047GO:0005996 Monosaccharide metabolism 0.0032266GO:0009725 Response to hormone stimulus 0.0035123GO:0009910 Negative regulation of flower
development0.0035135
aThe GO terms (http://www.geneontology.org) at different depths ofthe GO hierarchy are given.bProbability value adjusted for multihypothesis testing using theBenjamini and Hochberg method.
Floral transition in soybean 841
ª 2008 The AuthorsJournal compilation ª 2008 Blackwell Publishing Ltd, The Plant Journal, (2009), 57, 832–845

equivalent in both studies. Unlike the Arabidopsis experi-
ment, in which shoot apices were used, we used microdis-
sected SAMs. Nevertheless, a closer inspection of the 14
transcripts reveals a high representation of flowering genes
(Figure 7), in line with a recent study proposing a conserva-
tion of Arabidopsis flowering genes in legumes (Hecht et al.,
2005). In addition to the flowering genes, another gene with
a similar expression profile in both datasets is BRS1, the
encoded product of which is associated with BR signalling
(Li et al., 2001). BRs have recently been discovered to play
unexpected novel roles in the floral induction network
(Domagalska et al., 2007).
In summary, our study provides a detailed description of
temporal gene expression changes in the soybean SAM
undergoing the floral evocation process. We have revealed
interesting features and potentially valuable traits associ-
ated with the floral initiation process in soybean that may be
useful starting points for a more thorough investigation into
uncovering novel strategies for manipulating flowering
processes, and thus yield, in crop plants.
Experimental procedures
Plant materials and RNA extraction
Soybean plants [G. max. (L) Merr. Cv. Bragg] were grown fromseeds in a glasshouse located at the University of Melbourne, Vic-toria, Australia, for 10 days (0 SD), before being shifted to a growthchamber under a 10-h light regime (100 lmol m)2 s)1) maintainedat a constant temperature of 24�C. SAMs were microdissected fromsoybean plants with a 26G syringe needle (Terumo Medical Cor-poration, http://www.terumomedical.com) under the dissecting
microscope at a 40· magnification. Any leaf primordia wereexcluded in order to create a meristem-enriched tissue collection(Wong et al., 2008). For the sample collection after 6 SDs, the con-verted inflorescence meristem and the adjacent floral meristemwere microdissected, and we consistently observed a similar rate offloral meristem development for all 6-SD replicates. Approximately80 SAMs were dissected for each time point (0, 1, 2, 4 and 6 SDs).Dissected samples were quickly frozen in liquid nitrogen and storedat )80�C. Total RNA was extracted from dissected SAMs usingQiagen RNeasy Mini Kit with on-column DNAse digestion (Qiagen,http://www.qiagen.com). Two independent tissue collections andRNA extractions were performed for each of the SAM samples.Subsequent cDNA labelling and Affymetrix Soybean GeneChip�
hybridization was carried out by AGRF (Australian GenomeResearch Facility, http://www.agrf.org.au) using 3 lg of total RNA.
Scanning electron microscopy (SEM)
Soybean shoot apices were dissected under the dissecting micro-scope at 40· magnification, and were fixed overnight in forma-lin:ethanol:glacial acetic acid:distilled water (1:5:0.5:3.5). Thesamples were then dehydrated through an ethanol series, and werestored in 100% ethanol until the process of critical point drying thenext day. The samples were dried using a critical point dryer (Model030; Bal-Tec AG, http://www.bal-tec.com) following the manufac-turer’s instructions. Dried samples were then carefully placed on astub before observation using a field-emission scanning electronmicroscope (FESEM, FEI XL30; Oregon Scientific, http://www.oregonscientific.com).
Analysis of expression data
Expression levels were estimated from Affymetrix hybridizationintensity data using MicroArray Suite 5.0 (Affymetrix 2001, http://www.affymetrix.com). The raw numerical values representing the
(a)
(b) 14
12
10
8
6
4
2
00 SD 1 SD 2 SD 4 SD 6 SD 0 LD 3 LD
Expressed protein
MADS box protein APETALA1 (AP1)
Soybean dataset
307 637 24
Arabidopsis dataset
MADS box protein FRUITFUL MADS box protein AGL9
MADS box protein 2 MADS box protein SEPALLATA1
Ieucine-rich repeat protein kinase
Serine carboxypeptidase (BRS1) Inositol-3-phosphate synthase
Major intrinsic family protein
Protein phosphatase 2C
Ubiquitin-conjugating enzyme 19 (UBC19)
Zinc finger (C2H2 type) family protein Auxin-responsive factor (ARF10)
5 LD 7 LD
14
12
10
8
6
4
2
0
Figure 7. Comparison of the floral data set
derived from soybean (this study) with that of
Arabidopsis (Schmid et al., 2003).
(a) A Venn diagram depicting the overlap
between transcripts identified to be differentially
expressed in response to the floral evocation
process in soybean or Arabidopsis.
(b) Expression profiles of orthologous genes in
soybean (left panel) or Arabidopsis (right panel).
842 Chui E. Wong et al.
ª 2008 The AuthorsJournal compilation ª 2008 Blackwell Publishing Ltd, The Plant Journal, (2009), 57, 832–845

signal of each feature were filtered so that genes with expressionlevels referred to as ‘Marginal’ or ‘Absent’ in all 10 arrays accordingto the Affymetrix statistical algorithms were excluded from furtheranalysis. The resulting data were then normalized using RobustMultiarray Averaging (RMA) implemented in AffylmGUI (Wettenhalland Smyth, 2004), and were then imported into MASIGPRO, a sta-tistical method employing a two-step regression approach (Conesaet al., 2006). For the first regression model, the P value was set at<0.05, whereas in the second regression step a backward methodwas selected. A combination of quadratic and cubic models wasused to evaluate significantly differential expression profiles inthe process. Microarray data have been deposited in the GEOdatabase (http://www.ncbi.nlm.nih.gov/geo) under accession num-ber GSE10251.
For the clustering analysis, the log2-transformed expressionratios of one time point over the next consecutive time point wascomputed for the transcripts with significant expression profilechanges. Based on these data, transcripts were classified into 10clusters using k-means clustering analysis implemented in GEN-
ECLUSTER 3.0 (de Hoon et al., 2004), using the Euclidean distance asthe similarity metric. The resulting clusters were then visualizedusing JAVA TREEVIEW (Saldanha, 2004).
The soybean GeneChip� has been annotated by HARVEST (http://www.harvest-web.org), based on the best BLASTX match of thecorresponding soybean sequences against either the TAIR Arabid-opsis protein database or the Uniprot protein database. For thecomparison of the data set from the analyses of the floral initiationprocess in Arabidopsis (Schmid et al., 2003), we re-analysed thecorresponding data using MASIGPRO with the same parameters asdescribed above, and the matching Arabidopsis loci for genes ofinterest were then used for the comparison. Similarly, the matchingloci were also used in the search for statistically over-representedGO terms with the program GOTOOLBOX (Martin et al., 2004), usinghypergeometric distribution as the statistical test, and Benjaminiand Hochberg correction for multi-hypothesis testing (Benjaminiand Hochberg, 1995).
RT-PCR analysis
The one-tube, two enzymes OneStep RT-PCR kit (Qiagen) wasused following the manufacturer’s instructions in all RT-PCRanalyses. RNA isolated from the SAMs at different time points(40 ng) were used as a template in a 10-ll reaction volume. Thesoybean actin gene (AFFX-GM_ACTIN_M_AT) that showed a sim-ilar expression level across the six hybridization experiments wasused as an internal control. Routinely, 25–30 cycles were used forthe PCR process to ensure that the quantity of amplified productremained in linear proportion to the initial template present in thereaction. The entire PCR reaction was separated on 1% agarose gelcontaining 0.1 lg ll)1 ethidium bromide, and was visualized underUV light.
In situ hybridization
The soybean shoot apices were dissected from 10-day-old seedlingsand fixed with 4% paraformaldehyde (Sigma-Aldrich, http://www.sigmaaldrich.com) in PBS overnight at 4�C after vacuuminfiltration. The tissue was then dehydrated and embedded inparaplast (Structure Probe, http://www.2spi.com) following stan-dard methods. The in situ hybridization was carried out according tomodified protocols from Jackson (1991). Observations and pho-tography were conducted with a microscope BX60 and digitalcamera DP70 (Olympus, http://www.olympus-global.com). Digoxi-
genin-labelled antisense RNA probes were transcribed from the T7or SP6 promoter of pGEM-Easy vector (Promega, http://www.promega.com), using the DIG RNA Labeling Kit (Roche Diagnostics,http://www.roche.com/diagnostics).
Measurement of ABA level
Soybean SAMs were dissected from plants after 0 or 4 SDs. Twobiological replicates of approximately 30 SAMs per replicate pertime point were used for the extraction of ABA, following themethods of Xiong et al. (2001). The ABA concentration in the extractwas then determined using the Phytodetek ABA immunoassay kit(Idetek Inc., http://www.agdia.com/phytodetek).
Acknowledgements
We thank Prof. Peter Gresshoff for providing Bragg seeds, Ms LinZhang for her assistance in growing the soybean plants, Dr AnaConesa for generous advice on using the MASIGPRO program, andthe Australian Research Council for financially supporting thisproject as a part of the ARC Centre of Excellence grant.
Supporting Information
Additional Supporting Information may be found in the onlineversion of this article:Table S1. Transcripts identified to have significant expressionprofile changes during the floral initiation process in the soybeanshoot apical meristem.Table S2. Soybean transcripts with putative Arabidopsis ortho-logues reported to be responsive to ABA (Nemhauser et al., 2006).Table S3. Arabidopsis transcript identified to be significantlyinduced or repressed during the floral initiation process; theresulting data set was used in the comparison indicated in Figure 7.The Arabidopsis floral initiation data set was generated by Schmidet al. (2003) and has been re-analysed using MASIGPRO, as outlinedin Experimetal procedures, for comparison with the data set in thisstudy.Table S4. Gene ontology (GO) functional categories of the biologicalprocess significantly enriched (P < 0.01) in the induced (A) orrepressed gene (B) data set analysed using GOTOOLBOX (Martinet al., 2004).Please note: Wiley-Blackwell are not responsible for the content orfunctionality of any supporting materials supplied by the authors.Any queries (other than missing material) should be directed to thecorresponding author for the article.
References
Abe, M., Kobayashi, Y., Yamamoto, S., Daimon, Y., Yamaguchi, A.,
Ikeda, Y., Ichinoki, H., Notaguchi, M., Goto, K. and Araki, T. (2005)FD, a bZIP protein mediating signals from the floral pathwayintegrator FT at the shoot apex. Science, 309, 1052–1056.
An, H.L., Roussot, C., Suarez-Lopez, P. et al. (2004) CONSTANS actsin the phloem to regulate a systemic signal that induces photo-periodic flowering of Arabidopsis. Development, 131, 3615–3626.
Avonce, N., Leyman, B., Mascorro-Gallardo, J.O., Van Dijck, P.,
Thevelein, J.M. and Iturriaga, G. (2004) The Arabidopsis treha-lose-6-P synthase AtTPS1 gene is a regulator of glucose, abscisicacid, and stress signaling. Plant Physiol. 136, 3649–3659.
Barton, M.K. and Poethig, R.S. (1993) Formation of the shoot apicalmeristem in Arabidopsis thaliana – an analysis of development in
Floral transition in soybean 843
ª 2008 The AuthorsJournal compilation ª 2008 Blackwell Publishing Ltd, The Plant Journal, (2009), 57, 832–845

the wild-type and in the shoot meristemless mutant. Develop-ment, 119, 823–831.
Benjamini, Y. and Hochberg, Y. (1995) Controlling the false dis-covery rate: a practical and powerful approach to multiple testing.J. R Stat. Soc. B, 57, 289–300.
Bernier, G., Havelange, A., Houssa, C., Petitjean, A. and Lejeune, P.
(1993) Physiological signals that induce flowering. Plant Cell, 5,1147–1155.
Bhalla, P.L. and Singh, M.B. (2006) Molecular control of stem cellmaintenance in shoot apical meristem. Plant Cell Rep. 25, 249–256.
Brocard-Gifford, I., Lynch, T.J., Garcia, M.E., Malhotra, B. and Fin-
kelstein, R.R. (2004) The Arabidopsis thaliana ABSCISIC ACID-INSENSITIVE8 locus encodes a novel protein mediating abscisicacid and sugar responses essential for growth. Plant Cell, 16, 406–421.
Conesa, A., Nueda, M.J., Ferrer, A. and Talon, M. (2006) maSigPro: amethod to identify significantly differential expression profiles intime-course microarray experiments. Bioinformatics, 22, 1096–1102.
Corbesier, L. and Coupland, G. (2006) The quest for florigen: areview of recent progress. J. Exp. Bot. 57, 3395–3403.
Corbesier, L., Vincent, C., Jang, S. et al. (2007) FT protein movementcontributes to long-distance signaling in floral induction ofArabidopsis. Science, 165, 1917–1928.
Cutler, S., Ghassemian, M., Bonetta, D., Cooney, S. and McCourt, P.
(1996) A protein farnesyl transferase involved in abscisic acidsignal transduction in Arabidopsis. Science, 273, 1239–1241.
Dijken, A.J.H.v., Schluepmann, H. and Smeekens, S.C.M. (2004)Arabidopsis trehalose-6-phosphate synthase 1 is essential fornormal vegetative growth and transition to flowering. PlantPhysiol. 135, 969–977.
Domagalska, M.A., Schomburg, F.M., Amasino, R.M., Vierstra, R.D.,
Nagy, F. and Davis, S.J. (2007) Attenuation of brassinosteroidsignaling enhances FLC expression and delays flowering. Devel-opment, 134, 2841–2850.
El-Antably, H.M.M., Wareing, P.F. and Hillman, J. (1967) Somephysiological responses to d,l abscisin (dormin). Planta, 73, 74–90.
Endrizzi, K., Moussian, B., Haecker, A., Levin, J.Z. and Laux, T.
(1996) The SHOOT MERISTEMLESS gene is required formaintenance of undifferentiated cells in Arabidopsis shoot andfloral meristems and acts at a different regulatory level thanthe meristem genes WUSCHEL and ZWILLE. Plant J. 10, 967–79.
Gibson, S.I. (2004) Sugar and phytohormone response pathways:navigating a signalling network. J. Exp. Bot. 55, 253–264.
Grennan, A.K. (2007) The role of trehalose biosynthesis in plants.Plant Physiol. 144, 3–5.
Hartmann, U., Hohmann, S., Nettesheim, K., Wisman, E., Saedler,
H. and Huijser, P. (2000) Molecular cloning of SVP: a negativeregulator of the floral transition in Arabidopsis. Plant J. 21, 351–360.
Hecht, V., Foucher, F., Ferrandiz, C. et al. (2005) Conservation ofArabidopsis flowering genes in model legumes. Plant Physiol.137, 1420–1434.
Hofer, J., Turner, L., Hellens, R., Ambrose, M., Matthews, P.,
Michael, A. and Ellis, N. (1997) UNIFOLIATA regulates leaf andflower morphogenesis in pea. Curr. Biol. 7, 581–587.
de Hoon, M.J.L., Imoto, S., Nolan, J. and Miyano, S. (2004) Opensource clustering software. Bioinformatics, 20, 1453–1454.
Hsu, C.Y., Liu, Y.X., Luthe, D.S. and Yuceer, C. (2006) Poplar FT2shortens the juvenile phase and promotes seasonal flowering.Plant Cell, 18, 1846–1861.
Hugouvieux, V., Kwak, J.M. and Schroeder, J.I. (2001) An mRNA capbinding protein, ABH1, modulates early abscisic acid signaltransduction in Arabidopsis. Cell, 106, 477–487.
Imaizumi, T. and Kay, S.A. (2006) Photoperiodic control of flower-ing: not only by coincidence. Trends Plant Sci. 11, 550–558.
Jackson, D. (1991) In-situ hybridization in plants. In Molecular PlantPathology: A Practical Approach (Gurr, S.J., McPherson, M.J. andBowles, D.J., eds). Oxford: Oxford University Press, pp. 163–174.
Kobayashi, Y. and Weigel, D. (2007) Move on up, it’s time for changemobile signals controlling photoperiod-dependent flowering.Genes Dev. 21, 2371–2384.
Li, J., Lease, K.A., Tax, F.E. and Walker, J.C. (2001) BRS1, a serinecarboxypeptidase, regulates BRI1 signaling in Arabidopsis thali-ana. Proc. Natl Acad. Sci. USA, 98, 5916–5921.
Li, Y.H., Lee, K.K., Walsh, S., Smith, C., Hadingham, S., Sorefan, K.,
Cawley, G. and Bevan, M.W. (2006) Establishing glucose- andABA-regulated transcription networks in Arabidopsis by micro-array analysis and promoter classification using a relevancevector machine. Genome Res. 16, 414–427.
Mandel, M.A., Gustafsonbrown, C., Savidge, B. and Yanofsky, M.F.
(1992) Molecular characterization of the Arabidopsis floralhomeotic gene APETALA1. Nature, 360, 273–277.
Martin, D., Brun, C., Remy, E., Mouren, P., Thieffry, D. and Jacq, B.
(2004) GOToolBox: functional analysis of gene datasets based onGene Ontology. Genome Biol. 5, R101.
Nemhauser, J.L., Hong, F.X. and Chory, J. (2006) Different planthormones regulate similar processes through largely nonover-lapping transcriptional responses. Cell, 126, 467–475.
Ng, M. and Yanofsky, M.F. (2001) Activation of the arabidopsis Bclass homeotic genes by APETALA1. Plant Cell, 13, 739–753.
Ohto, M., Onai, K., Furukawa, Y., Aoki, E., Araki, T. and Nakamura,
K. (2001) Effects of sugar on vegetative development and floraltransition in arabidopsis. Plant Physiol. 127, 252–261.
Osakabe, Y., Maruyama, K., Seki, M., Satou, M., Shinozaki, K. and
Yamaguchi-Shinozaki, K. (2005) Leucine-rich repeat receptor-likekinase1 is a key membrane-bound regulator of abscisic acid earlysignaling in Arabidopsis. Plant Cell, 17, 1105–1119.
Parcy, F. (2005) Flowering: a time for integration. Int. J. Dev. Biol. 49,585–593.
Paul, M. (2007) Trehallose 6-phosphate. Curr. Opin. Plant Biol. 10,303–309.
Pautot, V., Dockx, J., Hamant, O., Kronenberger, J., Grandjean, O.,
Jublot, D. and Traas, J. (2001) KNAT2: evidence for a Link be-tween Knotted-like Genes and Carpel Development. Plant Cell, 13,1719–1734.
Podolnyi, V., Josefusova, Z., Khmelnitskaya, I., Verenchikov, S.,
Krekule, J. and Chailakhyan, M. (1989) Abscisic acid as a potentregulator of the transition from juvenile to mature stage in Xan-thium strumarium. Biol. Plant. 31, 139–144.
Ramon, M., Rolland, F., Thevelein, J.M., Dijck, P.V. and Leyman, B.
(2007) ABI4 mediates the effects of exogenous trehalose on Ara-bidopsis growth and starch breakdown. Plant Mol. Biol. 63, 195–206.
Razem, F.A., El-Kereamy, A., Abrams, S.R. and Hill, R.D. (2006) TheRNA-binding protein FCA is an abscisic acid receptor. Nature,439, 290–294.
Rook, F., Hadingham, S.A., Li, Y. and Bevam, M.W. (2006) Sugar andABA response pathways and the control of gene expression. PlantCell Environ. 29, 426–434.
Saldanha, A.J. (2004) Java Treeview – extensible visualization ofmicroarray data. Bioinformatics, 20, 3246–3248.
Satoh-Nagasawa, N., Nagasawa, N., Malcomber, S., Sakai, H. and
Jackson, D. (2006) A trehalose metabolic enzyme controls inflo-rescence architecture in maize. Nature, 441, 227–230.
844 Chui E. Wong et al.
ª 2008 The AuthorsJournal compilation ª 2008 Blackwell Publishing Ltd, The Plant Journal, (2009), 57, 832–845

Schmid, M., Uhlenhaut, N.H., Godard, F., Demar, M., Bressan, R.,
Weigel, D. and Lohmann, J.U. (2003) Dissection of floral inductionpathways using global expression analysis. Development, 130,6001–6012.
Scofield, S., Dewitte, W. and Murray, J.A.H. (2007) The KNOX geneSHOOT MERISTEMLESS is required for the development ofreproductive meristematic tissues in Arabidopsis. Plant J. 50,767–781.
Singh, M.B. and Bhalla, P.L. (2006) Plant stem cells carve their ownniche. Trends Plant Sci. 11, 241–246.
Summerfield, R.J. and Roberts, E.H. (1983) The Soybean. Biologist,30, 223–231.
Tardif, G., Kane, N.A., Adam, H., Labrie, L., Major, G., Gulick, P.,
Sarhan, F. and Laliberte, J.F. (2007) Interaction network of pro-teins associated with abiotic stress response and development inwheat. Plant Mol. Biol. 63, 703–718.
Taylor, I.B., Sonneveld, T., Bugg, T.D.H. and Thompson, A.J. (2005)Regulation and manipulation of the biosynthesis of abscisic acid,including the supply of xanthophyll precursors. J. Plant GrowthRegul. 24, 253–273.
Thomas, J.F. and Raper, C.D. (1983) Photoperiod effects onsoybean growth during the onset of reproductive develop-ment under various temperature regimes. Bot. Gaz. 144, 471–476.
Trevaskis, B., Tadege, M., Hemming, M.N., Peacock, W.J., Dennis,
E.S. and Sheldon, C. (2007) Short vegetative phase-like MADS-box genes inhibit floral meristem identity in barley. Plant Physiol.143, 225–235.
Tucker, S.C. (2003) Floral development in legumes. Plant Physiol.131, 911–926.
Urao, T., Yamaguchi-Shinozaki, K. and Shinozaki, K. (2000) Two-component systems in plant signal transduction. Trends PlantSci. 5, 67–74.
Washburn, C.F. and Thomas, J.F. (2000) Reversion of flowering inGlycine Max (Fabaceae). Am. J. Bot. 87, 1425–1438.
Wellmer, F., Alves-Ferreira, M., Dubois, A., Riechmann, J.L. and
Meyerowitz, E.M. (2006) Genome-wide analysis of gene expres-sion during early Arabidopsis flower development. Plos Genetics,2, 1012–1024.
Wettenhall, J.M. and Smyth, G.K. (2004) limmaGUI: a graphical userinterface for linear modeling of microarray data. Bioinformatics,20, 3705–3706.
Wilmowicz, E., Kesy, J. and Kopcewicz, J. (2008) Ethylene and ABAinteractions in the regulation of flower induction in Pharbitis nil.J. Plant Physiol. doi: 10.1016/j.jplph.2008.04.009.
Wong, C.E., Bhalla, P.L., Ottenhof, H. and Singh, M.B. (2008) Tran-scriptional profiling of the pea shoot apical meristem revealsprocesses underlying its function and maintenance. BMC PlantBiol. 8, 73.
Xiong, L., Ishitani, M., Lee, H. and Zhu, J.K. (2001) The ArabidopsisLOS5/ABA3 locus encodes a molybdenum cofactor sulfurase andmodulates cold stress- and osmotic stress-responsive geneexpression. Plant Cell, 13, 2063–2083.
Yalovsky, S., Kulukian, A., Rodriguez-Concepcion, M., Young, C.A.
and Gruissem, W. (2000) Functional requirement of plant farne-syltransferase during development in Arabidopsis. Plant Cell, 12,1267–1278.
Yu, H., Ito, T., Wellmer, F. and Meyerowitz, E.M. (2004) Repressionof AGAMOUS-LIKE 24 is a crucial step in promoting flowerdevelopment. Nat. Genet. 36, 157–161.
Zhang, X., Feng, B., Zhang, Q., Zhang, D., Altman, N. and Ma, H.
(2005) Genome-wide expression profiling and identification ofgene activities during early flower development in Arabidopsis.Plant Mol. Biol. 58, 401–419.
Zhu, Y.L., Song, Q.J., Hyten, D.L., et al. (2003) Single-nucleotidepolymorphisms in soybean. Genetics, 163, 1123–1134.
Floral transition in soybean 845
ª 2008 The AuthorsJournal compilation ª 2008 Blackwell Publishing Ltd, The Plant Journal, (2009), 57, 832–845