Molecular phylogenetics of the spider infraorder Mygalomorphae using nuclear rRNA genes
18
Molecular phylogenetics of the spider infraorder Mygalomorphae using nuclear rRNA genes (18S and 28S): Conflict and agreement with the current system of classification Marshal Hedin a, * , Jason E. Bond b a San Diego State University, Department of Biology, San Diego, CA 92182, USA b East Carolina University, Department of Biology, Howell Science Complex N211, Greenville, NC 27858, USA Received 10 February 2006; revised 27 April 2006; accepted 4 May 2006 Available online 25 May 2006 Abstract Mygalomorph spiders, which include the tarantulas, trapdoor spiders, and their kin, represent one of three main spider lineages. Mygalomorphs are currently classified into 15 families, comprising roughly 2500 species and 300 genera. The few published phylogenies of mygalomorph relationships are based exclusively on morphological data and reveal areas of both conflict and congruence, suggesting the need for additional phylogenetic research utilizing new character systems. As part of a larger combined evidence study of global mygalomorph relationships, we have gathered 3.7 kb of rRNA data (18S and 28S) for a sample of 80 genera, representing all 15 myga- lomorph families. Taxon sampling was particularly intensive across families that are questionable in composition—Cyrtaucheniidae and Nemesiidae. The following primary results are supported by both Bayesian and parsimony analyses of combined matrices representing multiple 28S alignments: (1) the Atypoidea, a clade that includes the families Atypidae, Antrodiaetidae, and Mecicobothriidae, is recov- ered as a basal lineage sister to all other mygalomorphs, (2) diplurids and hexathelids form a paraphyletic grade at the base of the non- atypoid clade, but neither family is monophyletic in any of our analyses, (3) a clade consisting of all sampled nemesiids, Microstigmata and the cyrtaucheniid genera Kiama, Acontius, and Fufius is consistently recovered, (4) other sampled cyrtaucheniids are fragmented across three separate clades, including a monophyletic North American Euctenizinae and a South African clade, (5) of the Domiothelina, only idiopids are consistently recovered as monophyletic; ctenizids are polyphyletic and migids are only weakly supported. The Dom- iothelina is not monophyletic. The molecular results we present are consistent with more recent hypotheses of mygalomorph relationship; however, additional work remains before mygalomorph classification can be formally reassessed with confidence—increased taxonomic sampling and the inclusion of additional character systems (more genes and morphology) are required. Ó 2006 Elsevier Inc. All rights reserved. Keywords: DNA sequence alignment; Spider phylogeny; Tree space visualization; Gondwanaland; Historical biogeography; Long-branch attraction; Bayes factor 1. Introduction Mygalomorph spiders, which include the tarantulas, trapdoor spiders, and other less well-known groups, repre- sent one of three main spider lineages (Fig. 1A). Although mygalomorphs retain some features that are plesiomorphic in spiders (e.g., two pairs of book lungs), several characters support mygalomorph monophyly, and this monophyly has not been seriously questioned (see Coddington et al., 2004; Platnick and Gertsch, 1976; Raven, 1985). Mygalo- morphs are currently classified into 15 families, comprising roughly 2500 species and 300 genera (see Table 1; Platnick, 2006). These spiders build a diverse array of silk constructs (Coyle, 1986), range in size from the very small to the larg- est of all spiders, and exhibit an underappreciated diversity of morphological form (Fig. 2). Most mygalomorphs are, however, relatively large, bulky, sedentary, ground-dwell- ing spiders. Mygalomorphs are essentially worldwide in www.elsevier.com/locate/ympev Molecular Phylogenetics and Evolution 41 (2006) 454–471 1055-7903/$ - see front matter Ó 2006 Elsevier Inc. All rights reserved. doi:10.1016/j.ympev.2006.05.017 * Corresponding author. Fax: +1 619 594 5676. E-mail address: [email protected] (M. Hedin).
Transcript of Molecular phylogenetics of the spider infraorder Mygalomorphae using nuclear rRNA genes
www.elsevier.com/locate/ympev
Molecular Phylogenetics and Evolution 41 (2006) 454–471
Molecular phylogenetics of the spider infraorder Mygalomorphaeusing nuclear rRNA genes (18S and 28S): Conflict and agreement
with the current system of classification
Marshal Hedin a,*, Jason E. Bond b
a San Diego State University, Department of Biology, San Diego, CA 92182, USAb East Carolina University, Department of Biology, Howell Science Complex N211, Greenville, NC 27858, USA
Received 10 February 2006; revised 27 April 2006; accepted 4 May 2006Available online 25 May 2006
Abstract
Mygalomorph spiders, which include the tarantulas, trapdoor spiders, and their kin, represent one of three main spider lineages.Mygalomorphs are currently classified into 15 families, comprising roughly 2500 species and 300 genera. The few published phylogeniesof mygalomorph relationships are based exclusively on morphological data and reveal areas of both conflict and congruence, suggestingthe need for additional phylogenetic research utilizing new character systems. As part of a larger combined evidence study of globalmygalomorph relationships, we have gathered �3.7 kb of rRNA data (18S and 28S) for a sample of 80 genera, representing all 15 myga-lomorph families. Taxon sampling was particularly intensive across families that are questionable in composition—Cyrtaucheniidae andNemesiidae. The following primary results are supported by both Bayesian and parsimony analyses of combined matrices representingmultiple 28S alignments: (1) the Atypoidea, a clade that includes the families Atypidae, Antrodiaetidae, and Mecicobothriidae, is recov-ered as a basal lineage sister to all other mygalomorphs, (2) diplurids and hexathelids form a paraphyletic grade at the base of the non-atypoid clade, but neither family is monophyletic in any of our analyses, (3) a clade consisting of all sampled nemesiids, Microstigmata
and the cyrtaucheniid genera Kiama, Acontius, and Fufius is consistently recovered, (4) other sampled cyrtaucheniids are fragmentedacross three separate clades, including a monophyletic North American Euctenizinae and a South African clade, (5) of the Domiothelina,only idiopids are consistently recovered as monophyletic; ctenizids are polyphyletic and migids are only weakly supported. The Dom-iothelina is not monophyletic. The molecular results we present are consistent with more recent hypotheses of mygalomorph relationship;however, additional work remains before mygalomorph classification can be formally reassessed with confidence—increased taxonomicsampling and the inclusion of additional character systems (more genes and morphology) are required.� 2006 Elsevier Inc. All rights reserved.
Keywords: DNA sequence alignment; Spider phylogeny; Tree space visualization; Gondwanaland; Historical biogeography; Long-branch attraction;Bayes factor
1. Introduction
Mygalomorph spiders, which include the tarantulas,trapdoor spiders, and other less well-known groups, repre-sent one of three main spider lineages (Fig. 1A). Althoughmygalomorphs retain some features that are plesiomorphicin spiders (e.g., two pairs of book lungs), several characters
1055-7903/$ - see front matter � 2006 Elsevier Inc. All rights reserved.
doi:10.1016/j.ympev.2006.05.017
* Corresponding author. Fax: +1 619 594 5676.E-mail address: [email protected] (M. Hedin).
support mygalomorph monophyly, and this monophylyhas not been seriously questioned (see Coddington et al.,2004; Platnick and Gertsch, 1976; Raven, 1985). Mygalo-morphs are currently classified into 15 families, comprisingroughly 2500 species and 300 genera (see Table 1; Platnick,2006). These spiders build a diverse array of silk constructs(Coyle, 1986), range in size from the very small to the larg-est of all spiders, and exhibit an underappreciated diversityof morphological form (Fig. 2). Most mygalomorphs are,however, relatively large, bulky, sedentary, ground-dwell-ing spiders. Mygalomorphs are essentially worldwide in
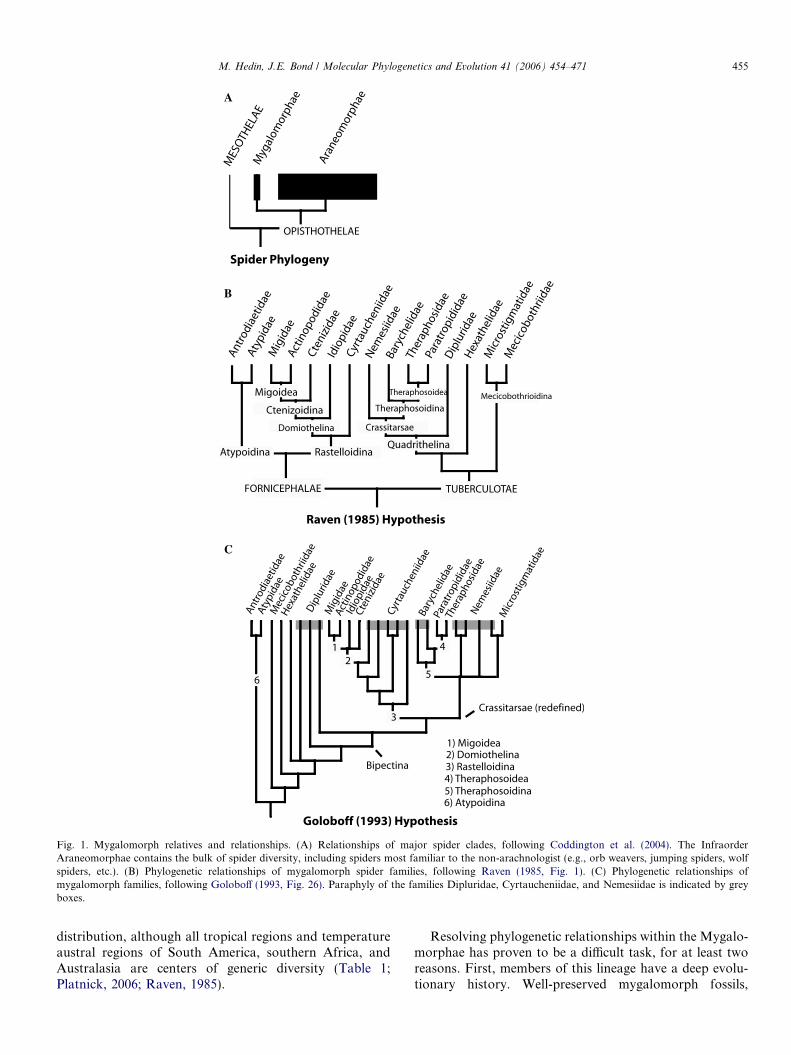
Fig. 1. Mygalomorph relatives and relationships. (A) Relationships of major spider clades, following Coddington et al. (2004). The InfraorderAraneomorphae contains the bulk of spider diversity, including spiders most familiar to the non-arachnologist (e.g., orb weavers, jumping spiders, wolfspiders, etc.). (B) Phylogenetic relationships of mygalomorph spider families, following Raven (1985, Fig. 1). (C) Phylogenetic relationships ofmygalomorph families, following Goloboff (1993, Fig. 26). Paraphyly of the families Dipluridae, Cyrtaucheniidae, and Nemesiidae is indicated by greyboxes.
M. Hedin, J.E. Bond / Molecular Phylogenetics and Evolution 41 (2006) 454–471 455
distribution, although all tropical regions and temperatureaustral regions of South America, southern Africa, andAustralasia are centers of generic diversity (Table 1;Platnick, 2006; Raven, 1985).
Resolving phylogenetic relationships within the Mygalo-morphae has proven to be a difficult task, for at least tworeasons. First, members of this lineage have a deep evolu-tionary history. Well-preserved mygalomorph fossils,
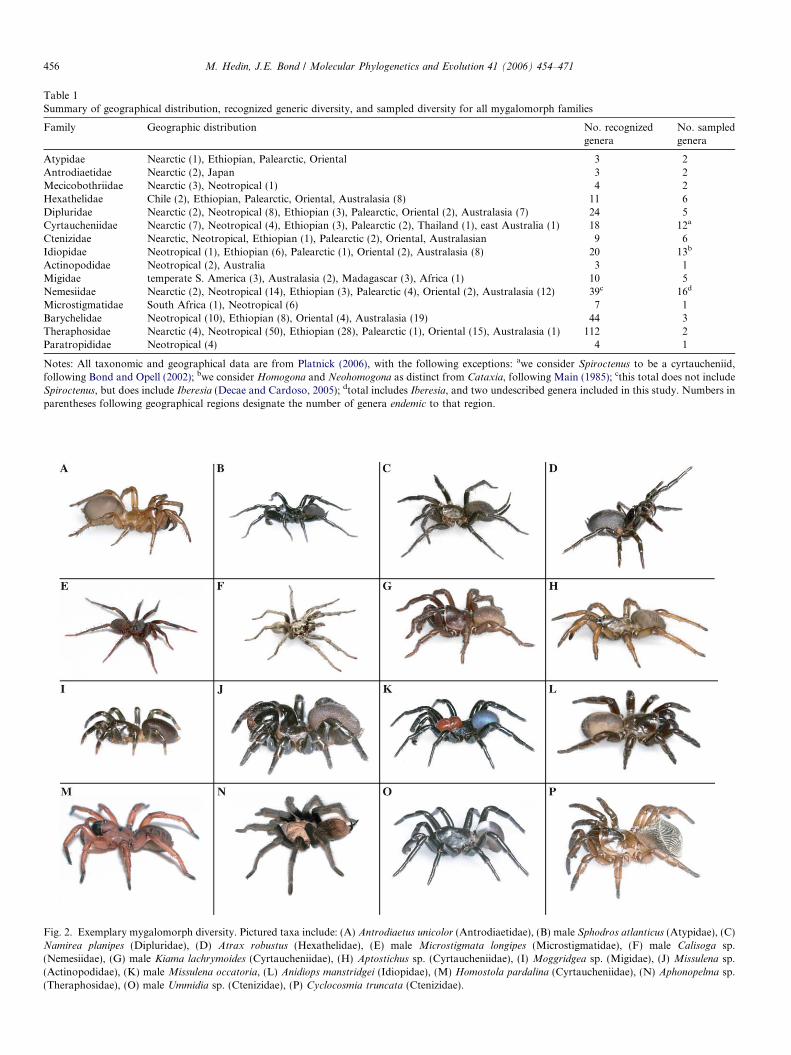
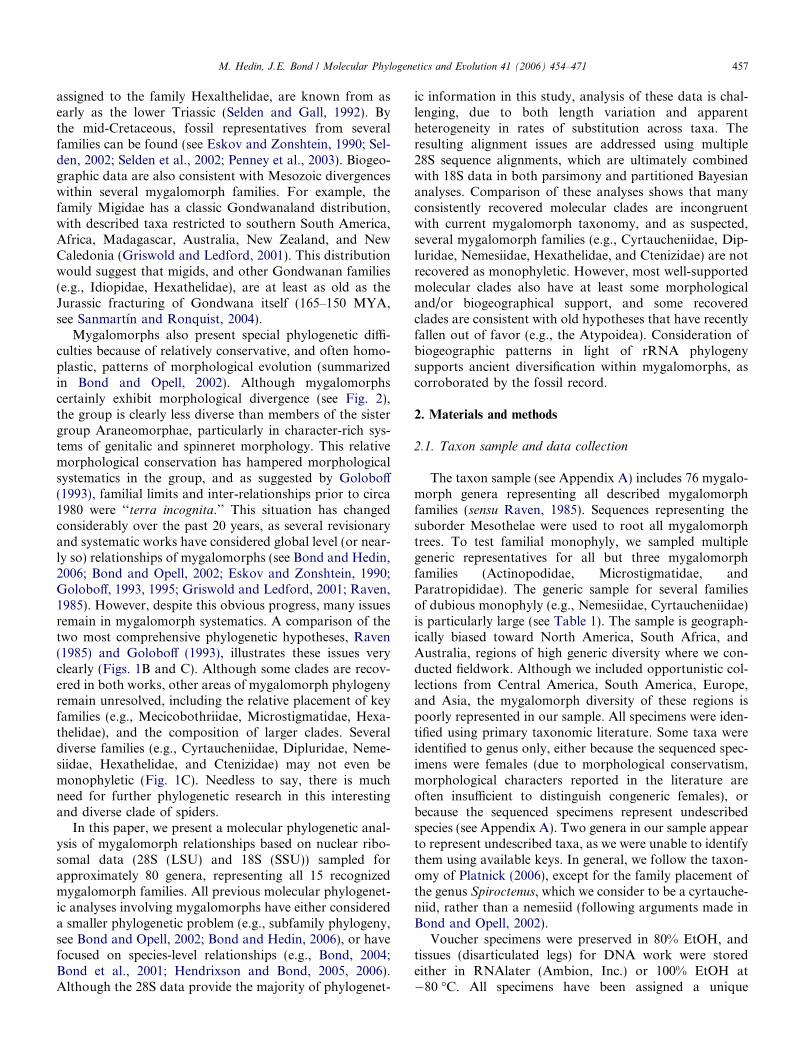
Table 1Summary of geographical distribution, recognized generic diversity, and sampled diversity for all mygalomorph families
Family Geographic distribution No. recognizedgenera
No. sampledgenera
Atypidae Nearctic (1), Ethiopian, Palearctic, Oriental 3 2Antrodiaetidae Nearctic (2), Japan 3 2Mecicobothriidae Nearctic (3), Neotropical (1) 4 2Hexathelidae Chile (2), Ethiopian, Palearctic, Oriental, Australasia (8) 11 6Dipluridae Nearctic (2), Neotropical (8), Ethiopian (3), Palearctic, Oriental (2), Australasia (7) 24 5Cyrtaucheniidae Nearctic (7), Neotropical (4), Ethiopian (3), Palearctic (2), Thailand (1), east Australia (1) 18 12a
Ctenizidae Nearctic, Neotropical, Ethiopian (1), Palearctic (2), Oriental, Australasian 9 6Idiopidae Neotropical (1), Ethiopian (6), Palearctic (1), Oriental (2), Australasia (8) 20 13b
Actinopodidae Neotropical (2), Australia 3 1Migidae temperate S. America (3), Australasia (2), Madagascar (3), Africa (1) 10 5Nemesiidae Nearctic (2), Neotropical (14), Ethiopian (3), Palearctic (4), Oriental (2), Australasia (12) 39c 16d
Microstigmatidae South Africa (1), Neotropical (6) 7 1Barychelidae Neotropical (10), Ethiopian (8), Oriental (4), Australasia (19) 44 3Theraphosidae Nearctic (4), Neotropical (50), Ethiopian (28), Palearctic (1), Oriental (15), Australasia (1) 112 2Paratropididae Neotropical (4) 4 1
Notes: All taxonomic and geographical data are from Platnick (2006), with the following exceptions: awe consider Spiroctenus to be a cyrtaucheniid,following Bond and Opell (2002); bwe consider Homogona and Neohomogona as distinct from Cataxia, following Main (1985); cthis total does not includeSpiroctenus, but does include Iberesia (Decae and Cardoso, 2005); dtotal includes Iberesia, and two undescribed genera included in this study. Numbers inparentheses following geographical regions designate the number of genera endemic to that region.
Fig. 2. Exemplary mygalomorph diversity. Pictured taxa include: (A) Antrodiaetus unicolor (Antrodiaetidae), (B) male Sphodros atlanticus (Atypidae), (C)Namirea planipes (Dipluridae), (D) Atrax robustus (Hexathelidae), (E) male Microstigmata longipes (Microstigmatidae), (F) male Calisoga sp.(Nemesiidae), (G) male Kiama lachrymoides (Cyrtaucheniidae), (H) Aptostichus sp. (Cyrtaucheniidae), (I) Moggridgea sp. (Migidae), (J) Missulena sp.(Actinopodidae), (K) male Missulena occatoria, (L) Anidiops manstridgei (Idiopidae), (M) Homostola pardalina (Cyrtaucheniidae), (N) Aphonopelma sp.(Theraphosidae), (O) male Ummidia sp. (Ctenizidae), (P) Cyclocosmia truncata (Ctenizidae).
456 M. Hedin, J.E. Bond / Molecular Phylogenetics and Evolution 41 (2006) 454–471
M. Hedin, J.E. Bond / Molecular Phylogenetics and Evolution 41 (2006) 454–471 457
assigned to the family Hexalthelidae, are known from asearly as the lower Triassic (Selden and Gall, 1992). Bythe mid-Cretaceous, fossil representatives from severalfamilies can be found (see Eskov and Zonshtein, 1990; Sel-den, 2002; Selden et al., 2002; Penney et al., 2003). Biogeo-graphic data are also consistent with Mesozoic divergenceswithin several mygalomorph families. For example, thefamily Migidae has a classic Gondwanaland distribution,with described taxa restricted to southern South America,Africa, Madagascar, Australia, New Zealand, and NewCaledonia (Griswold and Ledford, 2001). This distributionwould suggest that migids, and other Gondwanan families(e.g., Idiopidae, Hexathelidae), are at least as old as theJurassic fracturing of Gondwana itself (165–150 MYA,see Sanmartın and Ronquist, 2004).
Mygalomorphs also present special phylogenetic diffi-culties because of relatively conservative, and often homo-plastic, patterns of morphological evolution (summarizedin Bond and Opell, 2002). Although mygalomorphscertainly exhibit morphological divergence (see Fig. 2),the group is clearly less diverse than members of the sistergroup Araneomorphae, particularly in character-rich sys-tems of genitalic and spinneret morphology. This relativemorphological conservation has hampered morphologicalsystematics in the group, and as suggested by Goloboff(1993), familial limits and inter-relationships prior to circa1980 were ‘‘terra incognita.’’ This situation has changedconsiderably over the past 20 years, as several revisionaryand systematic works have considered global level (or near-ly so) relationships of mygalomorphs (see Bond and Hedin,2006; Bond and Opell, 2002; Eskov and Zonshtein, 1990;Goloboff, 1993, 1995; Griswold and Ledford, 2001; Raven,1985). However, despite this obvious progress, many issuesremain in mygalomorph systematics. A comparison of thetwo most comprehensive phylogenetic hypotheses, Raven(1985) and Goloboff (1993), illustrates these issues veryclearly (Figs. 1B and C). Although some clades are recov-ered in both works, other areas of mygalomorph phylogenyremain unresolved, including the relative placement of keyfamilies (e.g., Mecicobothriidae, Microstigmatidae, Hexa-thelidae), and the composition of larger clades. Severaldiverse families (e.g., Cyrtaucheniidae, Dipluridae, Neme-siidae, Hexathelidae, and Ctenizidae) may not even bemonophyletic (Fig. 1C). Needless to say, there is muchneed for further phylogenetic research in this interestingand diverse clade of spiders.
In this paper, we present a molecular phylogenetic anal-ysis of mygalomorph relationships based on nuclear ribo-somal data (28S (LSU) and 18S (SSU)) sampled forapproximately 80 genera, representing all 15 recognizedmygalomorph families. All previous molecular phylogenet-ic analyses involving mygalomorphs have either considereda smaller phylogenetic problem (e.g., subfamily phylogeny,see Bond and Opell, 2002; Bond and Hedin, 2006), or havefocused on species-level relationships (e.g., Bond, 2004;Bond et al., 2001; Hendrixson and Bond, 2005, 2006).Although the 28S data provide the majority of phylogenet-
ic information in this study, analysis of these data is chal-lenging, due to both length variation and apparentheterogeneity in rates of substitution across taxa. Theresulting alignment issues are addressed using multiple28S sequence alignments, which are ultimately combinedwith 18S data in both parsimony and partitioned Bayesiananalyses. Comparison of these analyses shows that manyconsistently recovered molecular clades are incongruentwith current mygalomorph taxonomy, and as suspected,several mygalomorph families (e.g., Cyrtaucheniidae, Dip-luridae, Nemesiidae, Hexathelidae, and Ctenizidae) are notrecovered as monophyletic. However, most well-supportedmolecular clades also have at least some morphologicaland/or biogeographical support, and some recoveredclades are consistent with old hypotheses that have recentlyfallen out of favor (e.g., the Atypoidea). Consideration ofbiogeographic patterns in light of rRNA phylogenysupports ancient diversification within mygalomorphs, ascorroborated by the fossil record.
2. Materials and methods
2.1. Taxon sample and data collection
The taxon sample (see Appendix A) includes 76 mygalo-morph genera representing all described mygalomorphfamilies (sensu Raven, 1985). Sequences representing thesuborder Mesothelae were used to root all mygalomorphtrees. To test familial monophyly, we sampled multiplegeneric representatives for all but three mygalomorphfamilies (Actinopodidae, Microstigmatidae, andParatropididae). The generic sample for several familiesof dubious monophyly (e.g., Nemesiidae, Cyrtaucheniidae)is particularly large (see Table 1). The sample is geograph-ically biased toward North America, South Africa, andAustralia, regions of high generic diversity where we con-ducted fieldwork. Although we included opportunistic col-lections from Central America, South America, Europe,and Asia, the mygalomorph diversity of these regions ispoorly represented in our sample. All specimens were iden-tified using primary taxonomic literature. Some taxa wereidentified to genus only, either because the sequenced spec-imens were females (due to morphological conservatism,morphological characters reported in the literature areoften insufficient to distinguish congeneric females), orbecause the sequenced specimens represent undescribedspecies (see Appendix A). Two genera in our sample appearto represent undescribed taxa, as we were unable to identifythem using available keys. In general, we follow the taxon-omy of Platnick (2006), except for the family placement ofthe genus Spiroctenus, which we consider to be a cyrtauche-niid, rather than a nemesiid (following arguments made inBond and Opell, 2002).
Voucher specimens were preserved in 80% EtOH, andtissues (disarticulated legs) for DNA work were storedeither in RNAlater (Ambion, Inc.) or 100% EtOH at�80 �C. All specimens have been assigned a unique

458 M. Hedin, J.E. Bond / Molecular Phylogenetics and Evolution 41 (2006) 454–471
specimen identification number and have had a label refer-encing this study added to their vial. Upon completion ofour on-going studies, voucher specimens will be depositedin the Nation Museum of Natural History, SmithsonianInstitution, Washington, DC, USA and the CaliforniaAcademy of Sciences, San Francisco, CA, USA. GenomicDNA was extracted and purified from 1 to 2 legs using theDNeasy Tissue Kit (Qiagen, Inc.). Procedures used toamplify (via polymerase chain reaction) and sequence the50 half of the 28S rRNA (�1.9 kb) and nearly the entire(�1.7 kb) 18S rRNA gene are detailed in Bond and Hedin(2006). Sequence contigs for both the 28S and 18S data setswere assembled and edited using Sequencher (Genecodes,Madison, WI), then imported into MacClade V4.06(Maddison and Maddison, 2001) for manual alignment,matrix concatenation, and further analysis.
2.2. Sequence alignments
We observed relatively little length variation in the 18SrRNA data set (see Section 3), allowing a fairly straightfor-ward manual alignment, which was conducted usingMacClade V4.06. Length variation was extreme in the28S rRNA data, necessitating a multifaceted alignmentapproach that incorporated both different alignment meth-ods and an array of alignment parameters. We evaluatedsequence alignment using three different alignmentapproaches, including: (1) progressive alignment usingCLUSTALX (Thompson et al., 1997) evaluated across awide range of parameters (see below), (2) a probabilisticprogressive alignment approach proposed by Loytynojaand Goldman (2005) that avoids repeated penalization ofinsertions and has the capacity to distinguish insertionsfrom deletions through the employment of a phylogeneticscoring function, and (3) a ‘‘manual’’ alignment, completedby one of the authors (MH) using MacClade V4.06.Because taxon labels were not hidden during this process,preconceived notions of mygalomorph phylogeny mayhave biased the manual alignment.
The computer program ClustalX (Thompson et al.,1997) was used to align the 28S data using a traditionalprogressive alignment approach. To investigate the sensi-tivity of the phylogenetic solution to alignment parameters,we explored gap-opening/gap-extension parameters over abroad range of values: 15/6–33/15 (10 alignments, parame-ters adjusted stepwise +2/+1). Gap-opening and extensionparameters were adjusted concurrently for both multipleand pairwise alignments. Ambiguous regions of theClustalX alignments were not modified or manually adjust-ed upon completion of the alignments.
The computer program Prank version 1508b (availableat http://www.ebi.ac.uk/goldman/prank) employs theapproach outlined by Loytynoja and Goldman (2005).We used the default gap-opening rate and gap-extensionprobabilities with the correction for insertion sites enabledand allowing the option that gaps be closed. We consideredalignments based on both the JC and HKY models of
molecular evolution implemented in this software. Firstiteration alignments were based on a guide tree taken fromClustalX using a pairwise gap opening and extension costof 15/6. As pointed out by Loytynoja and Goldman(2005), any multiple alignment for which the correct phy-logeny is unknown is going to be sensitive to alignmentguide tree choice. Upon close examination, we found theguide tree generated by ClustalX to be highly suspect(i.e., recovering few expected mygalomorph relationships).Therefore, we produced a second-generation alignmentfrom a rooted guide tree based on a distance analysis (min-imum evolution) conducted in PAUP* ver. 4.0b10 (Swof-ford, 2002). This analysis consisted of a single heuristicsearch with a General Time Reversible Model of molecularevolution with a c-shaped parameter of rate heterogeneity,the objective function set to unweighted least squares, andbranch lengths constrained to be non-negative. A seconditeration alignment was then produced in Prank from thenewly formed guide tree, using the same parametersdescribed for the first iteration alignments above.
2.3. Phylogenetic analyses of 28S alignments
All of the resulting individual 28S alignments (10 Clus-tal, 2 Prank, 1 Manual) were first analyzed as a batch par-simony search using PAUP* v. 4.0b10 (Swofford, 2002).For each alignment, we performed 10,000 random additionsequence replicates with TBR branch swapping, eachsearch replicate limited to 1 million rearrangements, treat-ing gaps as missing. All alignments and associated tree filesare available for download at http://www.mygalomorp-hae.org. Due to possible inefficiencies of heuristic searchesfor data sets of this size (99 terminals), we repeated foursearches using the improved search technologies (Goloboff,1999; Nixon, 1999) implemented in the computer programTNT v. 1.0 (Goloboff et al., 2003). Searches in TNT con-sisted of 1000 random addition sequence replicates eachemploying default sectorial, ratchet and tree fusing param-eters. Upon completion of the ‘‘New Technology search’’ atraditional search with TBR branch swapping was runusing the trees retained in memory from the previoussearch.
2.4. Visualization of 28S alignment tree space
Trees obtained from parsimony analyses of all 28Salignments were compared using multi-dimensional scaling(MDS) of unweighted Robinson–Foulds topological dis-tances. This approach helped to visualize the ‘‘tree space’’implied by the various alignment procedures and parame-ters explored (see Hillis et al., 2005 for other examples oftree space visualization), and was used as a guide for select-ing a subset of alignments for combined phylogenetic anal-yses. The MDS scaling was implemented using theTreeSetVis module (Amenta et al., 2005) in MesquiteV1.05 (Maddison and Maddison, 2004). We repeated theprocedure four times using the ‘‘Scramble’’ feature to
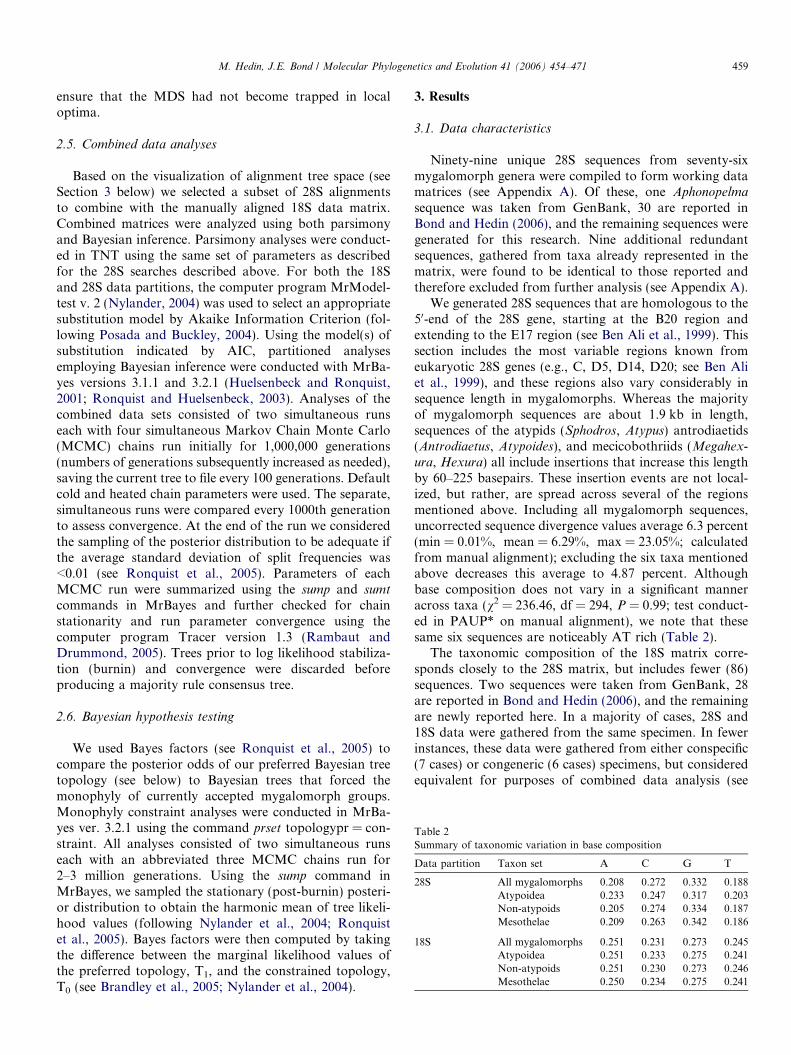
Table 2Summary of taxonomic variation in base composition
Data partition Taxon set A C G T
28S All mygalomorphs 0.208 0.272 0.332 0.188Atypoidea 0.233 0.247 0.317 0.203Non-atypoids 0.205 0.274 0.334 0.187Mesothelae 0.209 0.263 0.342 0.186
18S All mygalomorphs 0.251 0.231 0.273 0.245Atypoidea 0.251 0.233 0.275 0.241Non-atypoids 0.251 0.230 0.273 0.246Mesothelae 0.250 0.234 0.275 0.241
M. Hedin, J.E. Bond / Molecular Phylogenetics and Evolution 41 (2006) 454–471 459
ensure that the MDS had not become trapped in localoptima.
2.5. Combined data analyses
Based on the visualization of alignment tree space (seeSection 3 below) we selected a subset of 28S alignmentsto combine with the manually aligned 18S data matrix.Combined matrices were analyzed using both parsimonyand Bayesian inference. Parsimony analyses were conduct-ed in TNT using the same set of parameters as describedfor the 28S searches described above. For both the 18Sand 28S data partitions, the computer program MrModel-test v. 2 (Nylander, 2004) was used to select an appropriatesubstitution model by Akaike Information Criterion (fol-lowing Posada and Buckley, 2004). Using the model(s) ofsubstitution indicated by AIC, partitioned analysesemploying Bayesian inference were conducted with MrBa-yes versions 3.1.1 and 3.2.1 (Huelsenbeck and Ronquist,2001; Ronquist and Huelsenbeck, 2003). Analyses of thecombined data sets consisted of two simultaneous runseach with four simultaneous Markov Chain Monte Carlo(MCMC) chains run initially for 1,000,000 generations(numbers of generations subsequently increased as needed),saving the current tree to file every 100 generations. Defaultcold and heated chain parameters were used. The separate,simultaneous runs were compared every 1000th generationto assess convergence. At the end of the run we consideredthe sampling of the posterior distribution to be adequate ifthe average standard deviation of split frequencies was<0.01 (see Ronquist et al., 2005). Parameters of eachMCMC run were summarized using the sump and sumt
commands in MrBayes and further checked for chainstationarity and run parameter convergence using thecomputer program Tracer version 1.3 (Rambaut andDrummond, 2005). Trees prior to log likelihood stabiliza-tion (burnin) and convergence were discarded beforeproducing a majority rule consensus tree.
2.6. Bayesian hypothesis testing
We used Bayes factors (see Ronquist et al., 2005) tocompare the posterior odds of our preferred Bayesian treetopology (see below) to Bayesian trees that forced themonophyly of currently accepted mygalomorph groups.Monophyly constraint analyses were conducted in MrBa-yes ver. 3.2.1 using the command prset topologypr = con-straint. All analyses consisted of two simultaneous runseach with an abbreviated three MCMC chains run for2–3 million generations. Using the sump command inMrBayes, we sampled the stationary (post-burnin) posteri-or distribution to obtain the harmonic mean of tree likeli-hood values (following Nylander et al., 2004; Ronquistet al., 2005). Bayes factors were then computed by takingthe difference between the marginal likelihood values ofthe preferred topology, T1, and the constrained topology,T0 (see Brandley et al., 2005; Nylander et al., 2004).
3. Results
3.1. Data characteristics
Ninety-nine unique 28S sequences from seventy-sixmygalomorph genera were compiled to form working datamatrices (see Appendix A). Of these, one Aphonopelma
sequence was taken from GenBank, 30 are reported inBond and Hedin (2006), and the remaining sequences weregenerated for this research. Nine additional redundantsequences, gathered from taxa already represented in thematrix, were found to be identical to those reported andtherefore excluded from further analysis (see Appendix A).
We generated 28S sequences that are homologous to the50-end of the 28S gene, starting at the B20 region andextending to the E17 region (see Ben Ali et al., 1999). Thissection includes the most variable regions known fromeukaryotic 28S genes (e.g., C, D5, D14, D20; see Ben Aliet al., 1999), and these regions also vary considerably insequence length in mygalomorphs. Whereas the majorityof mygalomorph sequences are about 1.9 kb in length,sequences of the atypids (Sphodros, Atypus) antrodiaetids(Antrodiaetus, Atypoides), and mecicobothriids (Megahex-
ura, Hexura) all include insertions that increase this lengthby 60–225 basepairs. These insertion events are not local-ized, but rather, are spread across several of the regionsmentioned above. Including all mygalomorph sequences,uncorrected sequence divergence values average 6.3 percent(min = 0.01%, mean = 6.29%, max = 23.05%; calculatedfrom manual alignment); excluding the six taxa mentionedabove decreases this average to 4.87 percent. Althoughbase composition does not vary in a significant manneracross taxa (v2 = 236.46, df = 294, P = 0.99; test conduct-ed in PAUP* on manual alignment), we note that thesesame six sequences are noticeably AT rich (Table 2).
The taxonomic composition of the 18S matrix corre-sponds closely to the 28S matrix, but includes fewer (86)sequences. Two sequences were taken from GenBank, 28are reported in Bond and Hedin (2006), and the remainingare newly reported here. In a majority of cases, 28S and18S data were gathered from the same specimen. In fewerinstances, these data were gathered from either conspecific(7 cases) or congeneric (6 cases) specimens, but consideredequivalent for purposes of combined data analysis (see
460 M. Hedin, J.E. Bond / Molecular Phylogenetics and Evolution 41 (2006) 454–471
Appendix A). Seventeen additional redundant 18Ssequences were found to be identical to sequences alreadyrepresented in the matrix and excluded from data analysis(see Appendix A).
Hendriks et al. (1988) published a complete 18Ssequence from a tarantula (Aphonopelma) that is 1814 bpin length and includes a secondary structure with 48 univer-sal or eukaryotic-specific helices (conserved stems and/orloops). We generated sequences that are homologous tomost (�1750 bp) of this gene region, all but two(Bymainiella MY2045 and Migas MY2104) of which aremore than 95% complete. Length variation across taxa isconfined to one of seven regions, and again, is largelyattributable to insertion events in atypids (Atypus,Sphodros), antrodiaetids (Antrodiaetus, Atypoides), andmecicobothriids (Hexura, Megahexura) that result in long-er sequences. The Megahexura sequence is particularly longand divergent, but was validated by the sequencing of mul-tiple individuals (see Appendix A). Apart from these longsequences, 18S is highly conserved within mygalomorphs,with uncorrected sequence divergence values averaging lessthan one percent across all pairwise comparisons(min = 0%, mean = 0.96%, max = 4.84%). There is noevidence for statistically significant base composition vari-ation in these sequences (v2 = 34.64, df = 300, P = 1.0; testconducted in PAUP*; Table 2).
3.2. Alignment, analysis, and tree space visualization of 28S
data
Heuristic parsimony analyses were conducted on all 13different 28S alignments, treating gaps as missing. TNTsearches confirmed that the parsimony searches were findingthe shortest trees possible; the only discrepancy was thatPAUP* in a couple of instances found more trees of equallength. The parsimony tree space implied by these differentalignments was visualized using multi-dimensional scaling(MDS) of unweighted Robinson–Foulds topological dis-tances (Fig. 3). This visualization highlights several patternsin the data. First, the total tree space implied by all align-ments is rather ‘‘diffuse,’’ clearly demonstrating that bothalignment procedure and parameterization is influencingthe resulting phylogenetic estimate. Second, some align-ments result in trees found in multiple, topologically distant,tree islands (e.g., Prank HKY1, 15_06, etc.), whereas othersresult in trees that are more cohesive in space (e.g., PrankHKY2, 33_15, etc). Third, different alignments result in dif-ferent numbers of most-parsimonious trees, with someimplying a single most-parsimonious tree.
3.3. Combined data analysis
We chose a subset of six 28S alignments for further com-bined data analysis, including Manual, Prank HKY2,Prank JC2, Clustal 19_08, Clustal 31_14, and Clustal33_15. Alignment lengths are reported in Table 3. As apoint of reference, about 15% (on average) of the positions
include gaps in the shortest (31_14) alignment. All of thesealignments resulted in multiple most-parsimonious treesthat were found in a single tree island, and in combination,spanned the tree space implied by all thirteen alignments(see Fig. 3). We reasoned that this subset would thus repre-sent a fair cross-section of the total implied tree space.
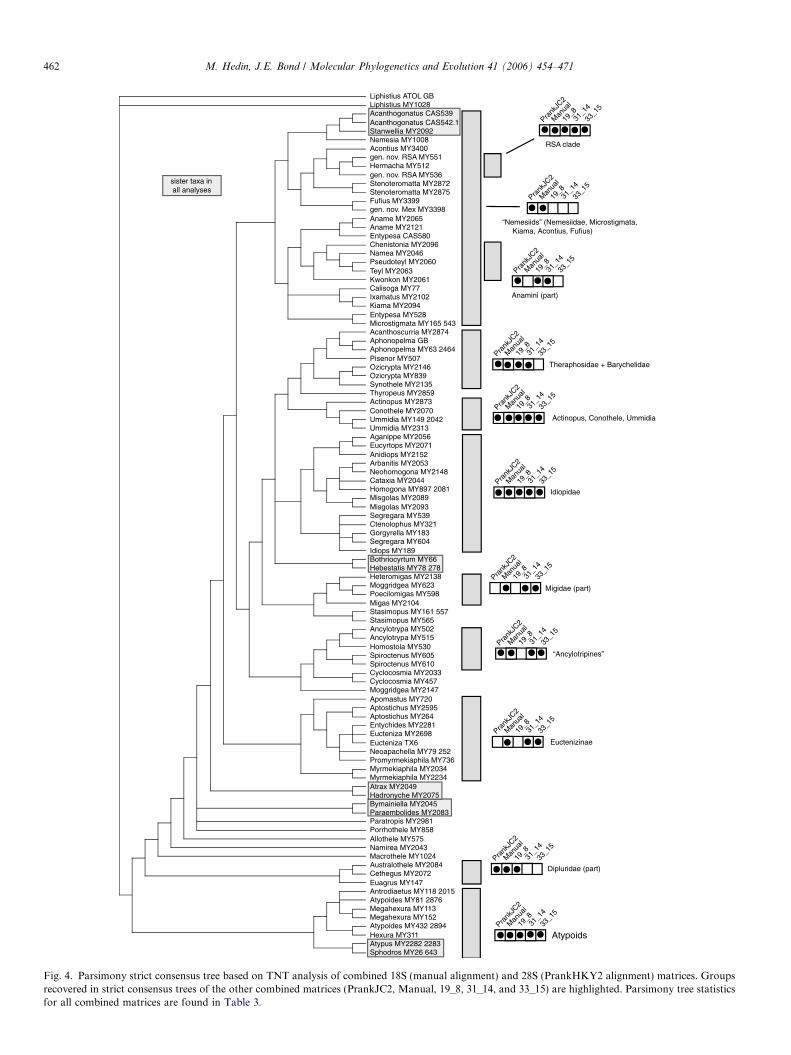
Results of parsimony analyses (using TNT) of the sixconcatenated matrices are summarized in Table 3, whichindicates that 28S Prank combined matrices result in short-er trees with higher average CI and RI values. This differ-ence likely reflects the fact that in these longer, gappieralignments, more positions are scoring as missing, decreas-ing both tree length and observed homoplasy. Fig. 4 showsa strict consensus of parsimony trees resulting from thePrank HKY2 combined matrix, and summarizes consisten-cy in clade recovery across the six different combinedmatrices. The consistently recovered clades are thoroughlydiscussed below in the context of the Bayesian results.
A GTR + I + G model was chosen by the Akaike Infor-mation Criterion as the best-fit model for both 18S and 28Sdata partitions. Results of partitioned Bayesian analysissearches are summarized in Table 4. Although the averagestandard deviation of split frequencies was relatively highfor two Clustal alignments (19_18, 33_15), further sump
and Tracer comparisons of independent runs suggestedconvergence of all parameters. Fig. 5 shows a Bayesianmajority-rule consensus tree derived from the Prank JC2combined matrix, and summarizes consistency in claderecovery across all combined matrices. We chose to illus-trate this tree because it is well resolved, generally consis-tent with other Bayesian results, but in addition includesclades congruent with current mygalomorph classification(migid monophyly in particular).
Bayesian analyses consistently and strongly support (pos-terior probability values above 0.95) the monophyly of thefamilies Antrodiaetidae, Atypidae, Idiopidae, and Theraph-osidae (Fig. 5). Migids are supported (often weakly) asmonophyletic in only three of six alignments. Samplednemesiids form a clade in three of six alignments, but onlywith inclusion of Microstigmata and the cyrtaucheniidsKiama, Acontius, and Fufius. Both ctenizids and cyrtaucheni-ids are fragmented on all Bayesian trees, represented by well-supported branches or subclades that never fall together(e.g., the cyrtauchniid subclades Euctinizinae, Ancylotry-pines, Kiama, etc). Neither diplurids nor hexathelids aremonophyletic, these groups forming a mixed grade towardthe base of the tree. The only consistently supported deepergrouping is the basal separation of a clade including ant-rodiaetids, atypids, and mecicobothriids from all other fam-ilies. A barychelid plus theraphosid grouping is also stronglysupported in all Bayesian trees.
3.4. Bayesian hypothesis testing
We compared the posterior odds of our preferredBayesian tree topology (PrankJC2, see above) to those ofBayesian trees that forced the monophyly of the groups
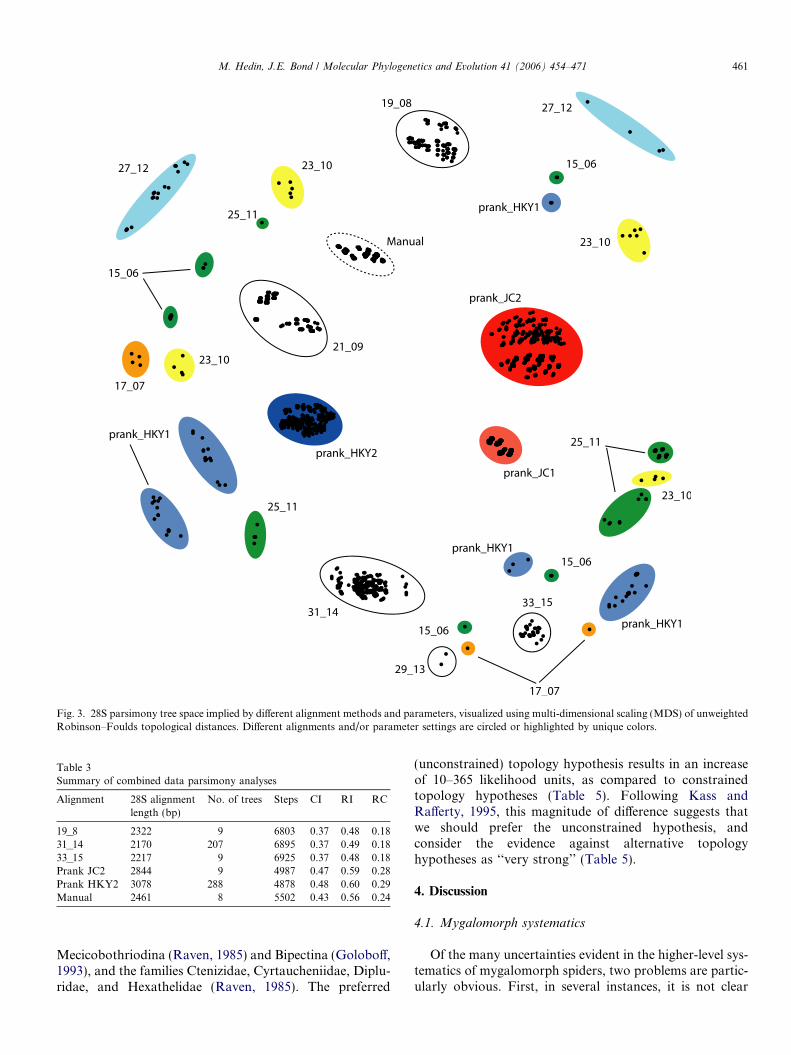
Fig. 3. 28S parsimony tree space implied by different alignment methods and parameters, visualized using multi-dimensional scaling (MDS) of unweightedRobinson–Foulds topological distances. Different alignments and/or parameter settings are circled or highlighted by unique colors.
Table 3Summary of combined data parsimony analyses
Alignment 28S alignmentlength (bp)
No. of trees Steps CI RI RC
19_8 2322 9 6803 0.37 0.48 0.1831_14 2170 207 6895 0.37 0.49 0.1833_15 2217 9 6925 0.37 0.48 0.18Prank JC2 2844 9 4987 0.47 0.59 0.28Prank HKY2 3078 288 4878 0.48 0.60 0.29Manual 2461 8 5502 0.43 0.56 0.24
M. Hedin, J.E. Bond / Molecular Phylogenetics and Evolution 41 (2006) 454–471 461
Mecicobothriodina (Raven, 1985) and Bipectina (Goloboff,1993), and the families Ctenizidae, Cyrtaucheniidae, Diplu-ridae, and Hexathelidae (Raven, 1985). The preferred
(unconstrained) topology hypothesis results in an increaseof 10–365 likelihood units, as compared to constrainedtopology hypotheses (Table 5). Following Kass andRafferty, 1995, this magnitude of difference suggests thatwe should prefer the unconstrained hypothesis, andconsider the evidence against alternative topologyhypotheses as ‘‘very strong’’ (Table 5).
4. Discussion
4.1. Mygalomorph systematics
Of the many uncertainties evident in the higher-level sys-tematics of mygalomorph spiders, two problems are partic-ularly obvious. First, in several instances, it is not clear
Liphistius ATOL GBLiphistius MY1028Acanthogonatus CAS539Acanthogonatus CAS542.1Stanwellia MY2092Nemesia MY1008Acontius MY3400gen. nov. RSA MY551Hermacha MY512gen. nov. RSA MY536Stenoteromatta MY2872Stenoteromatta MY2875Fufius MY3399 gen. nov. Mex MY3398Aname MY2065Aname MY2121Entypesa CAS580Chenistonia MY2096Namea MY2046Pseudoteyl MY2060Teyl MY2063Kwonkon MY2061Calisoga MY77Ixamatus MY2102Kiama MY2094Entypesa MY528Microstigmata MY165 543Acanthoscurria MY2874Aphonopelma GBAphonopelma MY63 2464Pisenor MY507Ozicrypta MY2146Ozicrypta MY839Synothele MY2135Thyropeus MY2859Actinopus MY2873Conothele MY2070Ummidia MY149 2042Ummidia MY2313Aganippe MY2056Eucyrtops MY2071Anidiops MY2152Arbanitis MY2053Neohomogona MY2148Cataxia MY2044Homogona MY897 2081Misgolas MY2089Misgolas MY2093Segregara MY539Ctenolophus MY321Gorgyrella MY183Segregara MY604Idiops MY189Bothriocyrtum MY66Hebestatis MY78 278Heteromigas MY2138Moggridgea MY623Poecilomigas MY598Migas MY2104Stasimopus MY161 557Stasimopus MY565Ancylotrypa MY502Ancylotrypa MY515Homostola MY530Spiroctenus MY605Spiroctenus MY610Cyclocosmia MY2033Cyclocosmia MY457Moggridgea MY2147Apomastus MY720Aptostichus MY2595Aptostichus MY264Entychides MY2281Eucteniza MY2698Eucteniza TX6Neoapachella MY79 252Promyrmekiaphila MY736Myrmekiaphila MY2034Myrmekiaphila MY2234Atrax MY2049Hadronyche MY2075Bymainiella MY2045Paraembolides MY2083Paratropis MY2981Porrhothele MY858Allothele MY575Namirea MY2043Macrothele MY1024Australothele MY2084Cethegus MY2072Euagrus MY147Antrodiaetus MY118 2015Atypoides MY81 2876Megahexura MY113Megahexura MY152Atypoides MY432 2894 Hexura MY311Atypus MY2282 2283Sphodros MY26 643
Prank
JC2
Man
ual
19_8
31_1
4
33_1
5
Prank
JC2
Man
ual
19_8
31_1
4
33_1
5
Prank
JC2
Man
ual
19_8
31_1
4
33_1
5
Prank
JC2
Man
ual
19_8
31_1
4
33_1
5
Prank
JC2
Man
ual
19_8
31_1
4
33_1
5
Prank
JC2
Man
ual
19_8
31_1
4
33_1
5
Prank
JC2
Man
ual
19_8
31_1
4
33_1
5
Prank
JC2
Man
ual
19_8
31_1
4
33_1
5
Prank
JC2
Man
ual
19_8
31_1
4
33_1
5
“Nemesiids” (Nemesiidae, Microstigmata, Kiama, Acontius, Fufius)
Anamini (part)
Theraphosidae + Barychelidae
Actinopus, Conothele, Ummidia
Idiopidae
Migidae (part)
“Ancylotripines”
Euctenizinae
Atypoids
Prank
JC2
Man
ual
19_8
31_1
4
33_1
5
Dipluridae (part)
Prank
JC2
Man
ual
19_8
31_1
4
33_1
5
RSA clade
sister taxa in all analyses
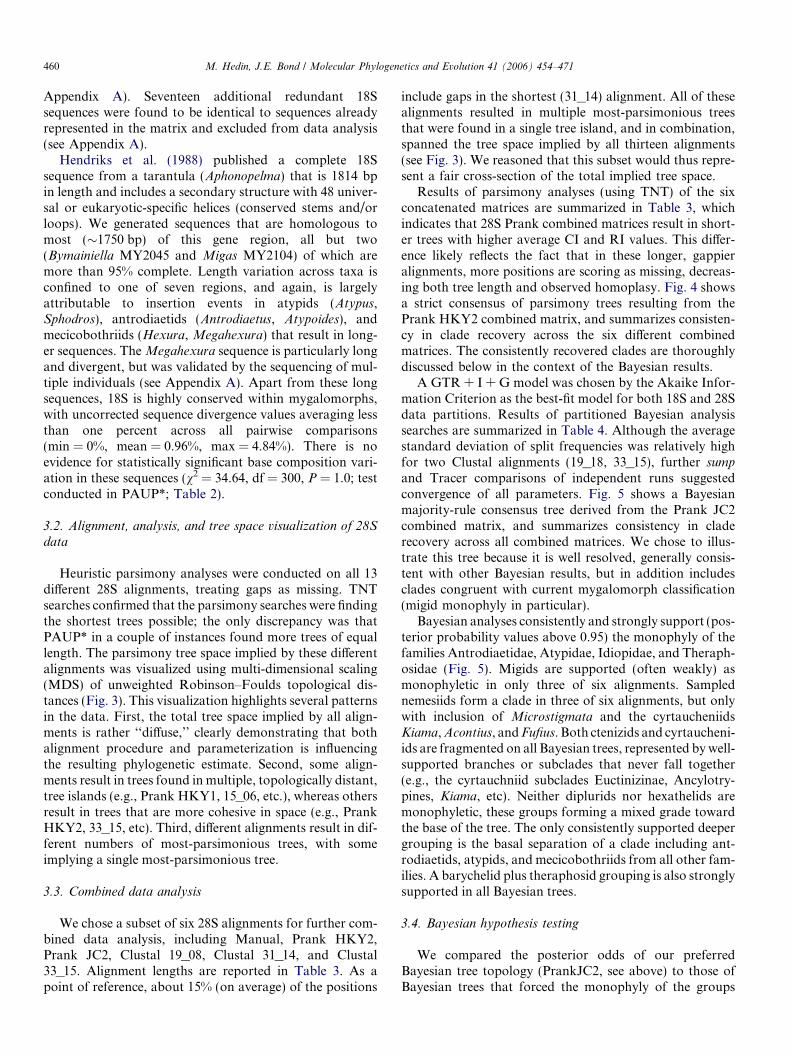
Fig. 4. Parsimony strict consensus tree based on TNT analysis of combined 18S (manual alignment) and 28S (PrankHKY2 alignment) matrices. Groupsrecovered in strict consensus trees of the other combined matrices (PrankJC2, Manual, 19_8, 31_14, and 33_15) are highlighted. Parsimony tree statisticsfor all combined matrices are found in Table 3.
462 M. Hedin, J.E. Bond / Molecular Phylogenetics and Evolution 41 (2006) 454–471
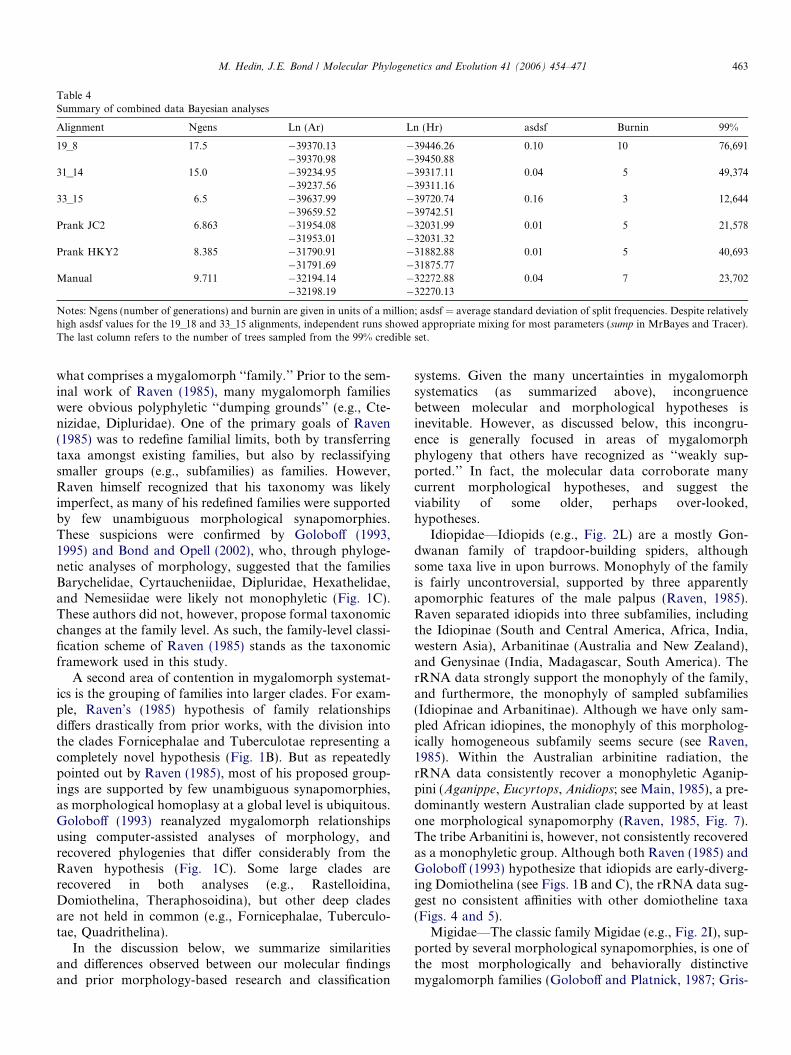
Table 4Summary of combined data Bayesian analyses
Alignment Ngens Ln (Ar) Ln (Hr) asdsf Burnin 99%
19_8 17.5 �39370.13 �39446.26 0.10 10 76,691�39370.98 �39450.88
31_14 15.0 �39234.95 �39317.11 0.04 5 49,374�39237.56 �39311.16
33_15 6.5 �39637.99 �39720.74 0.16 3 12,644�39659.52 �39742.51
Prank JC2 6.863 �31954.08 �32031.99 0.01 5 21,578�31953.01 �32031.32
Prank HKY2 8.385 �31790.91 �31882.88 0.01 5 40,693�31791.69 �31875.77
Manual 9.711 �32194.14 �32272.88 0.04 7 23,702�32198.19 �32270.13
Notes: Ngens (number of generations) and burnin are given in units of a million; asdsf = average standard deviation of split frequencies. Despite relativelyhigh asdsf values for the 19_18 and 33_15 alignments, independent runs showed appropriate mixing for most parameters (sump in MrBayes and Tracer).The last column refers to the number of trees sampled from the 99% credible set.
M. Hedin, J.E. Bond / Molecular Phylogenetics and Evolution 41 (2006) 454–471 463
what comprises a mygalomorph ‘‘family.’’ Prior to the sem-inal work of Raven (1985), many mygalomorph familieswere obvious polyphyletic ‘‘dumping grounds’’ (e.g., Cte-nizidae, Dipluridae). One of the primary goals of Raven(1985) was to redefine familial limits, both by transferringtaxa amongst existing families, but also by reclassifyingsmaller groups (e.g., subfamilies) as families. However,Raven himself recognized that his taxonomy was likelyimperfect, as many of his redefined families were supportedby few unambiguous morphological synapomorphies.These suspicions were confirmed by Goloboff (1993,1995) and Bond and Opell (2002), who, through phyloge-netic analyses of morphology, suggested that the familiesBarychelidae, Cyrtaucheniidae, Dipluridae, Hexathelidae,and Nemesiidae were likely not monophyletic (Fig. 1C).These authors did not, however, propose formal taxonomicchanges at the family level. As such, the family-level classi-fication scheme of Raven (1985) stands as the taxonomicframework used in this study.
A second area of contention in mygalomorph systemat-ics is the grouping of families into larger clades. For exam-ple, Raven’s (1985) hypothesis of family relationshipsdiffers drastically from prior works, with the division intothe clades Fornicephalae and Tuberculotae representing acompletely novel hypothesis (Fig. 1B). But as repeatedlypointed out by Raven (1985), most of his proposed group-ings are supported by few unambiguous synapomorphies,as morphological homoplasy at a global level is ubiquitous.Goloboff (1993) reanalyzed mygalomorph relationshipsusing computer-assisted analyses of morphology, andrecovered phylogenies that differ considerably from theRaven hypothesis (Fig. 1C). Some large clades arerecovered in both analyses (e.g., Rastelloidina,Domiothelina, Theraphosoidina), but other deep cladesare not held in common (e.g., Fornicephalae, Tuberculo-tae, Quadrithelina).
In the discussion below, we summarize similaritiesand differences observed between our molecular findingsand prior morphology-based research and classification
systems. Given the many uncertainties in mygalomorphsystematics (as summarized above), incongruencebetween molecular and morphological hypotheses isinevitable. However, as discussed below, this incongru-ence is generally focused in areas of mygalomorphphylogeny that others have recognized as ‘‘weakly sup-ported.’’ In fact, the molecular data corroborate manycurrent morphological hypotheses, and suggest theviability of some older, perhaps over-looked,hypotheses.
Idiopidae—Idiopids (e.g., Fig. 2L) are a mostly Gon-dwanan family of trapdoor-building spiders, althoughsome taxa live in upon burrows. Monophyly of the familyis fairly uncontroversial, supported by three apparentlyapomorphic features of the male palpus (Raven, 1985).Raven separated idiopids into three subfamilies, includingthe Idiopinae (South and Central America, Africa, India,western Asia), Arbanitinae (Australia and New Zealand),and Genysinae (India, Madagascar, South America). TherRNA data strongly support the monophyly of the family,and furthermore, the monophyly of sampled subfamilies(Idiopinae and Arbanitinae). Although we have only sam-pled African idiopines, the monophyly of this morpholog-ically homogeneous subfamily seems secure (see Raven,1985). Within the Australian arbinitine radiation, therRNA data consistently recover a monophyletic Aganip-pini (Aganippe, Eucyrtops, Anidiops; see Main, 1985), a pre-dominantly western Australian clade supported by at leastone morphological synapomorphy (Raven, 1985, Fig. 7).The tribe Arbanitini is, however, not consistently recoveredas a monophyletic group. Although both Raven (1985) andGoloboff (1993) hypothesize that idiopids are early-diverg-ing Domiothelina (see Figs. 1B and C), the rRNA data sug-gest no consistent affinities with other domiotheline taxa(Figs. 4 and 5).
Migidae—The classic family Migidae (e.g., Fig. 2I), sup-ported by several morphological synapomorphies, is one ofthe most morphologically and behaviorally distinctivemygalomorph families (Goloboff and Platnick, 1987; Gris-

Liphistius ATOL GBLiphistius MY1028Acanthogonatus CAS539Acanthogonatus CAS542.1Stanwellia MY2092Acontius MY3400gen. nov. RSA MY551Hermacha MY512gen. nov. RSA MY536gen. nov. Mex MY3398Stenoteromatta MY2872Stenoteromatta MY2875Nemesia MY1008Ixamatus MY2102Kiama MY2094Aname MY2065Aname MY2121Fufius MY3399Calisoga MY77Entypesa CAS580Microstigmata MY165 543Chenistonia MY2096Kwonkon MY2061Namea MY2046Pseudoteyl MY2060Teyl MY2063Entypesa MY528Actinopus MY2873Conothele MY2070Ummidia MY149 2042Ummidia MY2313Apomastus MY720Aptostichus MY2595Aptostichus MY264Myrmekiaphila MY2034Myrmekiaphila MY2234Entychides MY2281Eucteniza MY2698Eucteniza TX6Neoapachella MY79 252Promyrmekiaphila MY736Acanthoscurria MY2874Aphonopelma GBAphonopelma MY63 2464Pisenor MY507Ozicrypta MY2146Synothele MY2135Ozicrypta MY839Ancylotrypa MY502Ancylotrypa MY515Homostola MY530Spiroctenus MY605Spiroctenus MY610Bothriocyrtum MY66Hebestatis MY78 278Cyclocosmia MY2033Cyclocosmia MY457Aganippe MY2056Eucyrtops MY2071Anidiops MY2152Misgolas MY2089Misgolas MY2093Arbanitis MY2053Neohomogona MY2148Cataxia MY2044Homogona MY897 2081Segregara MY539Idiops MY189Gorgyrella MY183Segregara MY604Ctenolophus MY321Heteromigas MY2138Thyropeus MY2859Moggridgea MY623Poecilomigas MY598Migas MY2104Moggridgea MY2147Stasimopus MY161 557Stasimopus MY565Atrax MY2049Hadronyche MY2075Paratropis MY2981Allothele MY575Namirea MY2043Bymainiella MY2045Paraembolides MY2083Porrhothele MY858Macrothele MY1024Australothele MY2084Cethegus MY2072Euagrus MY147Antrodiaetus MY118 2015Atypoides MY81 2876Atypoides MY432 2894Hexura MY311Megahexura MY113Megahexura MY152Atypus MY2282 2283Sphodros MY26 643
Prank
HKY2
Man
ual
19_8
31_1
4
33_1
5
Prank
HKY2
Man
ual
19_8
31_1
4
33_1
5
Prank
HKY2
Man
ual
19_8
31_1
4
33_1
5
Prank
HKY2
Man
ual
19_8
31_1
4
33_1
5
Prank
HKY2
Man
ual
19_8
31_1
4
33_1
5
Prank
HKY2
Man
ual
19_8
31_1
4
33_1
5
Prank
HKY2
Man
ual
19_8
31_1
4
33_1
5
Prank
HKY2
Man
ual
19_8
31_1
4
33_1
5
Prank
HKY2
Man
ual
19_8
31_1
4
33_1
5
Idiopidae
Migidae
“Ancylotripines”
Euctenizinae
Atypoids
Prank
HKY2
Man
ual
19_8
31_1
4
33_1
5
Dipluridae (part)
Prank
HKY2
Man
ual
19_8
31_1
4
33_1
5
RSA Clade
Prank
HKY2
Man
ual
19_8
31_1
4
33_1
5
Antrodiaetidae
sister taxa in all analyses
“Nemesiids” (Nemesiidae, Microstigmata, Kiama, Acontius, Fufius)
Theraphosidae + Barychelidae
Actinopus, Conothele, Ummidia
Anamini (part)
91
55
86 80
81 76
88
464 M. Hedin, J.E. Bond / Molecular Phylogenetics and Evolution 41 (2006) 454–471

Table 5Summary of Bayes factor analyses
Constraint Model likelihood (harmonic mean) Evidence against T0
logef ðX jT 1Þ logef ðX jT 0Þ loge B10
Ctenizidae �32031.99 �32064.37 32.38 ‘‘very strong’’Mecicobothriodina �32031.99 �32397.25 365.26 ‘‘very strong’’Cyrtaucheniidae �32031.99 �32331.81 299.82 ‘‘very strong’’Hexathelidae �32031.99 �32067.87 35.88 ‘‘very strong’’Dipluridae �32031.99 �32042.07 10.08 ‘‘very strong’’Bipectina �32031.99 �32050.40 18.41 ‘‘very strong’’
M. Hedin, J.E. Bond / Molecular Phylogenetics and Evolution 41 (2006) 454–471 465
wold and Ledford, 2001; Raven, 1985). Many speciesplaced in this family build their unique sac-like, trap-door-covered burrows on the sides of trees throughoutthe southern hemisphere. Migid taxa possess quadrateand keeled fangs, have a recurved thoracic fovea, and lackboth anterior sternal sigilla and a rastellum. Given thestrong morphological support for the family, the relativelyweak support offered by the rRNA data is somewhat sur-prising. Migids are recovered as monophyletic in onlyone of six combined-data parsimony searches (19_8 align-ment, Fig. 4), and only half of the combined-data Bayesiananalyses (Fig. 5), sometimes with weak support. Within theMigidae, molecular data never support a monophyleticMoggridgea, suggesting that the Australian Moggridgeatingle (Main, 1991) may not be as closely related to AfricanMoggridgea as previously hypothesized. This result, how-ever, conflicts with the results of Griswold and Ledford(2001), who cite three morphological synapomorphies sup-porting Moggridgea monophyly. The superfamily Migoi-dea, which comprises Migidae plus Actinopodidae(Griswold and Ledford, 2001; Platnick and Shadab,1976), is never recovered in rRNA analyses.
Ctenizidae—The family Ctenizidae (e.g., Figs. 2O andP) comprises the species typically thought of as the trap-door or corkdoor spiders. Raven (1985) dismantled theold, clearly polyphyletic Ctenizidae, transferring manytaxa to other, mostly rastelloid families. Despite thisdownsizing of the family, the remaining genera are stillnot obviously members of a single clade, as reflected inRaven’s statement (1985, p 4) that a single defining apo-morphy includes ‘‘possibly the single tooth on the pairedclaw.’’ Our sample of ctenizid diversity includes the cteni-zine genera Bothriocyrtum, Cyclocosmia, and Stasimopus,and the pachylomerines Hebestatis, Conothele, and Ummi-
dia. Family and subfamily monophyly is not supported bythe rRNA data, and constraint analyses likewise do notsupport a family monophyly hypothesis (Table 5). Consis-tently recovered placements include Stasimopus at thebase of migids, Conothele and Ummidia (always together)
Fig. 5. Bayesian majority rule consensus tree based on analysis of combined 18black branches indicate posterior clade probabilities above 0.95; thickened grerecovered in Bayesian consensus trees of other combined matrices (PrankHKYposterior clade probabilities above 0.95. Values below this cut-off, but above 0.are found in Table 4.
b
with the actinopodid Actinopus, and the CalifornianHebestatis plus Bothriocyrtum always together as sistertaxa (see Figs. 4 and 5). Considering that all currently rec-ognized ctenizid genera are robust, ground-dwelling trap-door spiders, the anterolateral leg spination shared bythese taxa (and cited as a possible synapomorphy, Raven,1985, p. 57), may be convergently evolved. This conver-gence argument is supported by the observation of similaranterolateral spines in some trapdoor-building migids andidiopines (see Goloboff, 1993; Griswold and Ledford,2001; Raven, 1985).
Cyrtaucheniidae—The family Cyrtaucheniidae includesa diverse assemblage of taxa, often referred to as thewafer-lid trapdoor spiders (e.g., Figs. 2G, H, and M).Raven (1985) elevated the Cyrtaucheniinae to family sta-tus, and transferred to this family other genera that werethen classified as diplurids and ctenizids. Raven arguedthat three characters supported cyrtaucheniid monophyly,including the first and second tarsi both scopulate andweakly spinose, and the presense of multilobular sperma-theca. However, he also noted apparent affinities bothbetween members of the subfamily Euctenizinae and rastel-loid taxa (e.g., ctenizids), and between other cyrtaucheniidsand nemesiids. Cyrtaucheniid monophyly was tentativelyrejected by Goloboff (1993) with a small cyrtaucheniidsample (5 genera), and more conclusively rejected by Bondand Opell (2002), who scored morphological data for 16cyrtaucheniid genera. In analyses of Bond and Opell(2002), sampled cyrtaucheniids form a grade of multiplelineages at the base of the Rastelloidina. Rastelloids arestill recovered as monophyletic, but the authors hinted thata larger sample of non-rastelloids (e.g., additional nemesi-ids) might ultimately disrupt this monophyly.
We have collected molecular data for representatives ofall three cyrtaucheniid subfamilies recognized by Raven(1985), including all members of the North AmericanEuctenizinae (Aptostichus, Apomastus, Promyrmekiaphila,Myrmekiaphila, Eucteniza, Entychides, and Neoapachella;see Bond and Opell, 2002), one of two cyrtaucheniines
S (manual alignment) and 28S (PrankJC2 alignment) matrices. Thickenedy branches indicate posterior clade probabilities above 0.50. Major clades2, Manual, 19_8, 31_14, and 33_15) are highlighted. Dark circles represent50, are shown as numerical values. Tree statistics for all Bayesian searches

466 M. Hedin, J.E. Bond / Molecular Phylogenetics and Evolution 41 (2006) 454–471
(the African Homostola), and a diverse assemblage of apor-optychines (Kiama from Australia, Fufius from SouthAmerica, and the African Acontius, Ancylotrypa and Spi-
roctenus). Raven (1985) considered the inclusion of Kiama
and Ancylotrypa into this last subfamily as incertae sedis.Consistent with prior morphological analyses of this fami-ly, this taxon sample is never recovered as monophyletic,and constraint analyses likewise do not support monophylyof the family (Table 5). Instead, ‘‘cyrtaucheniids’’ are frag-mented into at least four separate lineages on rRNA trees(Figs. 4 and 5). The Australian Kiama is nested within aclade of mostly nemesiid taxa, and often allied with theAustralian Ixamatus. The peculiar pustulose cuticle (Bondand Opell, 2002; Raven, 1981) and elevated, rodlike tarsalorgan (Raven 1981, Fig. 63; 1985) shared by these taxamay represent morphological synapomorphies for thispairing. The aporoptychines Fufius and Acontius are alsonested within a mostly nemesiid clade, but are not obvious-ly closely related to one another. A clade of South Africantaxa, including Ancylotrypa, Homostola, and Spiroctenus
(informally called the ‘‘Ancylotripine’’ clade), is recoveredin essentially all analyses (Figs. 4 and 5). Finally, the euct-enizines, as originally defined by Raven (1985), are recov-ered as monophyletic in essentially all analyses. Exceptfor the placement of Homostola, this general phylogeneticstructuring (Kiama, Fufius plus Acontius, Ancylotrypa,and euctenizines all on independent branches) is consistentwith the morphological findings of Bond and Opell (2002,Fig. 6).
Theraphosidae, Barychelidae, and Paratropididae—Thefamily Theraphosidae, including the ‘‘true’’ tarantulas(e.g., Fig. 2N), is the most genus-rich of all mygalomorphfamilies (Platnick, 2006). Theraphosids share distinctiveclaw tufts and well-developed scopulae on all legs (Raven,1985). As such, we have presumed monophyly of this fam-ily and have not included a large taxon sample for molec-ular analyses. The two genera that we have sampled(Acanthoscurria and Aphonopelma), placed into the samesubfamily by Raven (1985), are always sister taxa on rRNAtrees (Figs. 4 and 5). Theraphosids are clearly morpholog-ically related to barychelids (see Raven, 1985, 1994), andthis relationship is supported by rRNA trees. The place-ment of Pisenor, however, makes barychelids paraphyleticwith respect to theraphosids. We note, however, that thePisenor specimens that we sequenced lack teeth on theanterior booklung openings, which is a proposed synapo-morphy for the Barychelidae (see Goloboff, 1993, Figs. 4and 5). If Pisenor is misplaced, both Barychelidae and The-raphosidae are monophyletic.
We have only included a single representative of the dis-tinctive family Paratropididae (subfamily Paratropidinae),so cannot test the monophyly of this family. However,we can test Raven’s (1985) hypothesis of a sister-taxonrelationship between paratropidids and theraphosids. TheParatropis that we have sampled has a fairly unique rRNAsequence, and the placement of this taxon varies consider-ably across analyses. A grouping with theraphosids and
barychelids is, however, never recovered in molecular trees.This result is perhaps not surprising, because unlike thera-phosids and barychelids, paratropidines generally lack clawtufts, leg scopulae, and fine hairs clothing the legs. Glab-ropelmatine paratropidids are more similar to the formergroups, but we have not sampled this subfamily.
Nemesiidae and Microstigmatidae—The recognizedgeneric diversity represented in the family Nemesiidae,the tube trapdoor or wishbone spiders (e.g., Fig. 2F), is sur-passed only by theraphosids and barychelids (see Table 1;Platnick, 2006). But unlike these latter two families, con-vincing morphological support for nemesiid monophyly isgenerally lacking, as it is basically impossible to cite a mor-phological definition that applies universally to nemesiidtaxa (see Goloboff, 1995). Raven (1985) redefined the limitsof this family, but even he doubted nemesiid monophyly(pp. 61, 65). These doubts were supported by analyses ofGoloboff (1993, Fig. 1C). The most comprehensive analysisof nemesiid relationships (Goloboff, 1995) includes mostNeotropical and several non-Neotropical ‘‘nemesiids,’’scored for over 100 morphological characters. Again, thisanalysis strongly suggests that nemesiids (sensu Raven,1985) are paraphyletic with respect to other mygalomorphtaxa, including Theraphosoidina, Microstigmatidae, andsome cyrtaucheniids.
Our nemesiid generic sample represents five of six sub-families recognized by Raven (1985, pp. 43, 81). These gen-era never form a clade exclusive of other mygalomorphtaxa on molecular trees (Figs. 4 and 5). Instead, samplednemesiids form a clade in half of the combined-data Bayes-ian analyses, and one-third of the parsimony analyses, butonly with inclusion of Microstigmata and the cyrtaucheni-ids Kiama, Acontius, and Fufius. Within this larger ‘‘nemes-iid’’ clade, several rRNA subclades with eithermorphological and/or biogeographical support are recov-ered. For example, the consistent sister pairing of Stanwel-
lia (eastern Australia) and Acanthogonatus (SouthAmerica) is supported by at least two morphological syna-pomorphies, including pseudosegmented tarsi in males,and a well-developed intercheliceral tumescence (see Rav-en, 1985, p. 48; Goloboff, 1995). An Australian cladeincluding Teyl, Pseudoteyl, Namea, Kwonkan, and Chenis-
tonia (=Aname) tepperi is consistently recovered in rRNAtrees (Figs. 4 and 5). This group corresponds to part ofRaven’s Anamini (1985, p. 50). However, contra Raven(1985), other Aname species that we have sampled are neverclosely related to this clade (i.e., Anamini as a whole is notmonophyletic). Another regional clade is represented by asubset of the South African nemesiids that we have sam-pled (Hermacha, undescribed genus), which togetheralmost always form a clade. Finally, as mentioned above,a Kiama plus Ixamatus pairing (both from easternAustralia) also has morphological support.
We have sampled a single representative of the uniquefamily Microstigmatidae (Microstigmata, Fig. 2E), and assuspected by both Raven (1985, p. 65) and Goloboff(1993), this taxon falls within a larger ‘‘nemesiid’’ clade.
M. Hedin, J.E. Bond / Molecular Phylogenetics and Evolution 41 (2006) 454–471 467
This derived placement within the nemesiids suggests thatmany of the apomorphic characters possessed by micro-stigmatids (e.g., small round booklung openings) may beneotenic, as hypothesized by both Griswold (1985) andRaven (1985). Superficially, microstigmatids have a pustu-lose cuticle similar to Ixamatus and Kiama. However,rRNA trees do not suggest a particularly close relationshipbetween these taxa, and SEM analyses suggest that thesesimilarities are likely convergent (see Raven and Platnick,1981). Although additional microstigmatids must ultimate-ly be sampled, our molecular results are consistent withGoloboff’s (1993) suggestion that ‘‘either Nemesiidae mustbe divided into several families, or the Microstigmatidaemust become a subfamily of Nemesiidae’’.
Hexathelidae and Dipluridae—The families Hexatheli-dae and Dipluridae comprise mygalomorph species typi-cally referred to as the sheet-web, curtain-web orfunnel-web spiders (e.g., Figs. 2C and D). Raven (1980,1985) cites a single morphological synapmorphy support-ing hexathelid monophyly (numerous labial cuspules),but this hypothesis was questioned by Goloboff (1993).Our hexathelid sample includes representatives of twoof three subfamilies recognized by Raven (1980), includ-ing the Macrothelinae (Macrothele, Porrthothele, Atrax,Hadronyche) and the Hexathelinae (Bymainiella, Paraem-
bolides). Although the hexathelines Bymainiella and Para-
embolides of eastern Australia are consistently recoveredas sister taxa, neither the macrothelines, nor the hexathe-lids together, form a clade on molecular trees. Instead,hexathelids are typically part of a paraphyletic grade(along with diplurids) at the base of the non-atypoidclade (Figs. 4 and 5). Raven (1985, p. 55) discusses theuncomfortable positioning of Atrax (Hadronyche wasthen synonymous with Atrax) within the Hexathelidae,requiring homoplasy in several characters, and suggestspossible relationships with cyrtaucheniids. The rRNAresults indicate that Atrax and Hadronyche are indeedphylogenetically distinct from other hexathelids, but arenever associated with cyrtaucheniids or other rastelloids.
Raven cites three morphological synapomorphies forthe Dipluridae (long posterior lateral spinnerets, widelyseparated posterior median spinerrets, low caput), butagain, this monophyly is disputed by Goloboff (1993,Fig. 1C). Our limited sample of diplurid diversity (onlyEuagrinae of four recognized diplurid subfamilies) is neverrecovered as monophyletic on rRNA trees. With hexathe-lids, sampled diplurids are typically part of a paraphyleticgrade at the base of the non-Atypoid clade (Figs. 4 and5). This paraphyly and relative basal placement is consis-tent with the hypothesis of Goloboff (1993, Fig. 1C), whostated that ‘‘non-diplurine diplurids form a ‘‘gray area’’between the four-spinnereted taxa and the more plesiomor-phic, six-spinnereted hexathelids’’.
Higher-level clades—The molecular data consistentlyrecover a taxon bipartition that separates a clade includ-ing the families Atypidae, Antrodiaetidae, and Mecicobo-thriidae, from all remaining mygalomorph taxa (Figs. 4
and 5). This primary division is consistent with one ofthe earliest mygalomorph classifications, as Simon(1892) placed the Antrodiaetidae, Atypidae, and Mecic-obothriidae into a group separate from other mygalo-morphs. This group ultimately became known as theAtypoidea (sensu Chamberlin and Ivie, 1945), and waslater accepted by researchers such as Coyle (1971,1974), and most recently, Eskov and Zonshtein (1990).Although Raven (1985) ultimately rejected this hypothe-sis (as did many others, see below), he consideredSimon’s hypothesis to be ‘‘comprehensive and nonregion-al (i.e., global),’’ and ‘‘highly innovative.’’
The Atypoidea hypothesis is one of the most controver-sial in mygalomorph systematics. The hypothesis was dis-cussed at length, and ultimately rejected, by Platnick(1977); Gertsch and Platnick (1979); Raven (1985) andGoloboff (1993). These authors generally agree that ant-rodiaetids and atypids (=Atypoidina, sensu Raven, 1985,see Figs. 2A and B) are related, and Goloboff (1993) suggeststhat Atypoidina are sister to all remaining mygalomorphs(see Fig. 1C). At issue is the placement of the Mecicobothrii-dae. Mecicobothriids share several morphological featuresin common with antrodiaetids and atypids. Chamberlinand Ivie (1945) listed six such features (e.g., male palpus withconducter, dorsal sclerites on anterior abdominal segments,etc.), but these were later suggested to be plesiomorphies(Gertsch and Platnick, 1979; Platnick, 1977). More recently,Eskov and Zonshtein (1990) argued for Atypoidea mono-phyly using additional characters (e.g., shape of chelicerae,shape of male tarsi, pleurital extensions, foveal shape), butagain, this hypothesis was disputed. In particular, Goloboff(1993) cites several characters (e.g., cheliceral shape, fovealshape, male palpal structure, etc.) that he scores as ‘‘contra
Eskov and Zonshtein,’’ indicating disagreement in interpre-tation of characters and character states.
Rather than provide a full discussion of the morpholog-ical evidence here, we simply note that (1) the rRNA dataare consistent with an Atypoidea hypothesis, and that thishypothesis has (disputable) morphological support, and (2)it will crucial to corroborate this hypothesis using otherDNA evidence, as it is possible that long branch attractionis influencing the rRNA in favor of an Atypoideahypothesis (see below).
Another possible major grouping is the Bipectina ofGoloboff (1993), a proposed clade that includes all mygalo-morphs except for Atypoids, hexathelids, and non-diplu-rine diplurids (Fig. 1C). Bipectines share severalcharacters, including two rows of teeth on the superior tar-sal claws of both sexes, although many of these charactersare reversed or modified in various derived bipectine taxa.Strictly speaking, this group is not recovered in rRNAtrees, because of the relatively basal placement of the para-tropidid sample (Figs. 4 and 5). Likewise, constraint anal-yses do not support monophyly of this group (Table 5).However, a monophyletic Bipectina was recovered in par-simony and Bayesian analyses of combined matrices with‘‘manual’’ 28S alignments.
468 M. Hedin, J.E. Bond / Molecular Phylogenetics and Evolution 41 (2006) 454–471
Essentially all other higher-level groups proposed byRaven (1985), including the Fornicephalae, Rastelloidina,Domiothelina, Ctenizoidina, Tuberculotae, Mecicoboth-rioidina, Quadrithelina, Crassitarsae, and Theraphosoidina(see Fig. 1B) are not formally supported by molecular anal-yses. We, however, have not conducted statistical tests toreject most of these hypotheses. Of these, we believe thatboth the Domiothelina (sensu Raven, 1985) and Crassitar-sae (as redefined by Goloboff, 1993, Fig. 1C) are viable tax-onomic hypotheses, although the latter clade almostcertainly includes several taxa currently classified ascyrtaucheniids (e.g., Kiama).
4.2. Summary hypothesis and regional biogeographicpatterns
Fig. 6 summarizes, in a conservative manner, mygalo-morph relationships as reflected in rRNA molecular phy-logenies. This summary diagram provides a graphicalpoint-of-comparison between previous and futurehypotheses, and we expect this provisional hypothesisto change and evolve as additional data and taxa areconsidered. Although we believe that formal changes inthe classification system of Mygalomorphae are neededand are imminent, these revisions are not made here,but rather will be made after completion of an on-goingstudy involving combined analysis of both morphologicaland molecular characters (Bond and Hedin,unpublished).
Many mygalomorphs are sedentary, dispersal-limitedanimals with apparently deep evolutionary histories. Assuch, these spiders have long been favored by historicalbiogeographers (see Raven, 1980; Platnick, 1981; Griswoldand Ledford, 2001). The phylogenetic framework providedby our molecular data (Fig. 6) sheds new light on mygalo-morph biogeography. First, we have evidence supportingthe monophyly of some classic Gonwandaland taxa, suchas Migidae and Idiopidae. Migids are found in southernSouth America, Africa, Madagascar, Australia, New Zea-land, and New Caledonia, while essentially all idiopidsare distributed in southern South America, southern Afri-ca, Madagascar, Australia, Tasmania, New Zealand, andIndia (see Table 1). Although additional taxon samplingis required to confirm monophyly of these families, ourresults are at least consistent with a deep history for thesetaxa. Another piece of evidence in favor of ancientphylogenetic diversification is the observation of regional,family-level faunas that are polyphyletic. The nemesiid fau-na of Australia, which includes representatives of severaldifferent lineages (e.g., Stanwellia, derived Anamini, Ixam-
atus plus Kiama), is one such example. If we view the poly-phyly of this regional fauna as evidence for taxonomic andbiogeographic diversification prior to continental break-up, rather than more recent dispersal, then deep historyis implied. Finally, layered upon this relatively deep historyis evidence for more recent, continent-limited (i.e., region-al), diversification. Examples include the Australian idiopid
and Anamini radiations, the North American euctenizineradiation, and the African ‘‘ancylotrypine’’ radiation. Foreach of these well-supported monophyletic groups, our tax-on sample is fairly comprehensive, allowing us to reject thepossibility of undetected relatives living on othercontinents.
4.3. Caveats of molecular results
Nuclear ribosomal genes have been used successfullyand extensively in animal molecular systematics, at manydifferent taxonomic levels (e.g., Kjer, 2004; Mallatt et al.,2004; Winchell et al., 2002). Despite this proven utility,these genes pose several well-known data collection andanalytical problems (e.g., contamination, paralogy, align-ment), several of which we have faced in this study. Inparticular, we are concerned with the issue of lineage-specific rate acceleration, or so-called ‘‘episodic change,’’which has been revealed in the rRNA genes of a widevariety of eukaryotic taxa (Friedrich and Tautz, 1997;Omilian and Taylor, 2001; Philippe and Germot, 2000;Stiller and Hall, 1999). Substitution rate accelerationoften impacts both 28S and 18S simultaneously, andcan accentuate among-site rate variation, cause biasesin base composition, and lead to dramatic length varia-tion. If rate acceleration occurs independently in multiplelineages, problems of long-branch attraction (Felsenstein,1978) can arise. In fact, one of the most well studiedexamples of possible long-branch attraction involves rateacceleration of rDNA genes in the insect orders Dipteraand Strepsiptera (Whiting et al., 1997; Huelsenbeck,1997, 1998).
Signs of rate acceleration are evident in both rRNAgenes of three mygalomorph lineages, including theatypids, antrodiaetids and mecicobothriids (i.e., theAtypoids). This rate acceleration is evidenced by severalpatterns in the data. Extensive nucleotide insertions char-acterize atypoid expansion segments, making thesesequences longer than all other mygalomorph sequences.Unique substitutions, found in otherwise conservedregions, are evident in many atypoid sequences. Thereare hints of shared biases in base composition (e.g., the28S genes of atypoids are relatively AT rich, Table 2),although this variation is not statistically significant.Finally, the rRNA genes in these lineages are variableat unexpectedly low taxonomic levels. For example, 18Sis highly variable at the species level in the antrodiaetidsAntrodiaetus and Aliatypus (Hendrixson and Bond, 2006;Hedin, unpublished data). These signs of shared rateacceleration force us to question the validity of theobserved Atypoidea grouping, because independent rateacceleration may be causing long-branch attraction ofthese lineages. Alternatively, rate acceleration of rRNAgenes may be a synapomorphy uniting the Atypoidea.As argued above, the morphological evidence supportingan Atypoidea hypothesis is contentious, so congruencewith morphology does not strongly favor one hypothesis

Ancylotripines
Euctenizinae
Migidae
Aganippini
Arbinitini
Idiopinae
Idiopidae
Theraphosidae
Pisenor
Barychelidae
Anamini
IxamatusKiamaAname
Cyclocosmia
Stasimopus
Hebestatis + Bothriocyrtum
StanwelliaAcanthogonatus
Microstigmata
RSA Clade
AcontiusFufius
ParatropisAtraxHadronycheParaembolidesBymainiella
other Diplurids + Hexathelids
Atypidae
Antrodiaetidae
MecicobothriidaeAtypoidea
Bipectina
Ummidia, Conothele, & Actinopus
“Nemesiids”
Distribution
southern Africa
North America,western Mexico
Australia, south Africa, Madagascar
California
Australia(mostly western)
Australia
Africa
eastern Australia
Australia
eastern Australia,South America
South Africa
eastern Australia
eastern Australia
??
Fig. 6. Conservative summary of mygalomorph relationships based on rRNA analyses. Distributional data are included for major clades recovered inrRNA analyses; additional distributional data can be found in Table 1. The uncertain phylogenetic placement of Paratropis is indicated by question marks.
M. Hedin, J.E. Bond / Molecular Phylogenetics and Evolution 41 (2006) 454–471 469
over another. We suggest that additional molecular databe gathered to test the Atypoidea hypothesis, and indi-rectly, the hypothesis of shared versus parallel rRNArate acceleration.
4.4. Future directions in mygalomorph systematics
Although the taxon sample considered here is fairlyrepresentative of mygalomorph diversity, many important
470 M. Hedin, J.E. Bond / Molecular Phylogenetics and Evolution 41 (2006) 454–471
sampling gaps remain. From a biogeographic perspective,the faunas of the Mediterranean, tropical Asia and Africa,and both temperate and tropical South America remainundersampled. The inclusion of additional taxa from tem-perate South America and India will be particularly impor-tant in testing biogeographic scenarios for several familieswith mostly Gondwanan distributions (e.g., migids, idio-pids). Taxonomically, more sampling is needed for the fol-lowing groups: South American microstigmatids andparatropidids; nemesiids from South America, Europe,and Asia; Asian ctenizids; diplurids and hexathelids; andgenysine Idiopids (e.g., Neocteniza). In addition to increasedtaxon sampling, mygalomorph systematics still awaits thedevelopment of additional, slowly evolving, molecular phy-logenetic markers (e.g., nuclear protein-coding genes), andthe integration of both molecular and morphological datainto a single, global analysis. Ultimately, we believe that suchdata will be necessary if we are to reconstruct a robust phy-logenetic hypothesis of Mygalomorphae that can be usedto reclassify mygalomorph diversity, interpret biogeograph-ic history, and comprehend patterns of morphological evolu-tion in this diverse group of spiders.
Acknowledgments
This study was supported by National Science Foun-dation grants DEB 0108575 (to M.H. and J.E.B.),DEB 0322650 supplement (to M.H.), and DEB 0236020(to J.E.B.). David Beamer, Sarah Crews, Brent Hendrix-son, and Steven Thomas assisted in data collection andanalysis. Tom Prentice and Brent Hendrixson helped inthe collection of North American taxa. Special thanksto Arthur Fong at the California Department of Parksand Recreation for arranging CA State Parks collectingpermits. Collections in South Africa were made possiblewith help from Elizabeth Kassimatis, Jaques van Heer-den, Martin Paulsen, Roland Jones and Norman Larsen.Dr. Ansie Dippenaar-Schoeman deserves special thanksfor her generous assistance and hospitality in South Afri-ca. Barbara York Main, Bert Main, Mark Harvey, MikeGray, Graham Wishart, Fred Coyle, and Rob Ravenprovided assistance, housing hospitality and collectionshelp in Australia. Australian collections were made underpermit from Western Australia (License NumberSF4101), New South Wales (License Number A1397),and Queensland (Permit Number WISP01242003), andexported under permit from Environment Australia (Per-mit No. WT2003-1002). Additional specimens were col-lected by Pedro Cardosa, Charles Griswold, WayneMaddison, Lorenzo Prendini, Martın Ramı´ rez, RobertRaven and Cor Vink. The collecting efforts of Griswold,Maddison, Prendini, and Ramı´ rez were supported by anNSF ATOL Grant (EAR0228699) to Ward Wheeler,Jonathan Coddington, Gustavo Hormiga, Lorenzo Pren-dini and Petra Sierwald (http://research.amnh.org/atol/files/). Suggestions by two anonymous reviewers helpedto improve the manuscript.
Appendix A. Supplementary data
Supplementary data associated with this article can befound, in the online version, at doi:10.1016/j.ympev.2006.05.017.
References
Amenta, N., St. John, K., Klingner, J., et. al., 2005. Tree Set Visualizationmodule for Mesquite. <http://comet.lehman.cuny.edu/treeviz/in-dex.html/>.
Ben Ali, A., Wuyts, J., Wachter, R.D., Meyer, A., Van de Peer, Y., 1999.Construction of a variability map for eukaryotic large subunitribosomal RNA. Nucleic Acids Res. 27, 2825–2831.
Bond, J.E., 2004. Systematics of the Californian euctenizine spider genusApomastus (Araneae: Mygalomorphae: Cyrtaucheniidae): the relation-ship between molecular and morphological taxonomy. Invert. Syst. 18,361–376.
Bond, J.E., Hedin, M., 2006. A total evidence assessment of the phylogenyof North American euctenizine trapdoor spiders (Araneae, Mygalo-morphae, Cyrtaucheniidae) using Bayesian inference. Mol. Phylogen.Evol., in press, doi:10.1016/j.ympev.2006.04.026.
Bond, J.E., Opell, B.D., 2002. Phylogeny and taxonomy of the genera ofsouth-western North American Euctenizine trapdoor spiders and theirrelatives (Araneae: Mygalomorphae, Cyrtaucheniidae). Zool. J. Linn.Soc. 136, 487–534.
Bond, J.E., Hedin, M.C., Ramirez, M.G., Opell, B.D., 2001. Deepmolecular divergence in the absence of morphological and ecologicalchange in the California coast dune endemic trapdoor spider Aptosti-
chus simus. Mol. Ecol. 10, 899–910.Brandley, M.C., Schmitz, A., Reeder, T.Ws., 2005. Partitioned Bayesian
analyses, partition choice, and the phylogenetic relationships of scincidlizards. Syst. Biol. 54, 373–390.
Chamberlin, R.V., Ivie, W., 1945. On some Nearctic mygalomorphspiders. Ann. Entomol. Soc. Am. 38, 549–558.
Coddington, J.A., Giribet, G., Harvey, M.S., Prendini, L., Walter, D.,2004. Arachnida. In: Cracraft, J., Donoghue, M.J. (Eds.), Assemblingthe Tree of Life. Oxford University Press, pp. 296–318.
Coyle, F.A., 1971. Systematics and natural history of the mygalomorphspider genus Antrodiaetus and related genera (Araneae: Antrodiaeti-dae). Bull. Mus. Comp. Zool. 141, 269–402.
Coyle, F.A., 1974. Systematics of the trapdoor spider genus Aliatypus
(Araneae: Antrodiaetidae). Psyche 81, 431–500.Coyle, F.A., 1986. The role of silk in prey capture by nonaraneomorph
spiders. In: Shear, W.A. (Ed.), Spiders: Webs, Behavior and Evolution.Stanford University Press, Stanford, pp. 269–305.
Decae, A., Cardoso, P., 2005. Iberesia, a new genus of trapdoor spiders(Araneae, Nemesiidae) from Portugal and Spain. Revista Iberica deAracnologia 12, pp. 3–11.
Eskov, K., Zonshtein, S., 1990. First Mesozoic mygalomorph spiders fromthe Lower Cretaceous of Siberia and Mongolia, with notes on thesystem and evolution of the infraorder Mygalomorphae (Chelicerata:Araneae). Neues Jahrb. Geol. Palaontol. Abh. 178, 325–368.
Felsenstein, J., 1978. Cases in which parsimony or compatibility methodswill be positively misleading. Syst. Zool. 27, 401–410.
Friedrich, M., Tautz, D., 1997. An episodic change of rDNA nucleotidesubstitution rate has occurred during the emergence of the insect orderDiptera. Mol. Biol. Evol. 14, 644–653.
Gertsch, W.J., Platnick, N.I., 1979. A revision of the spider familyMecicobothriidae (Araneae, Mygalomorphae). Am. Mus. Nov. 2687,1–32.
Goloboff, P.A., 1993. A reanalysis of mygalomorph spider families(Araneae). Am. Mus. Nov. 3056, 1–32.
Goloboff, P.A., 1995. A revision of the South American spiders of the familyNemesiidae (Araneae, Mygalomorphae). Part I: Species from Peru,Chile, Argentina, and Uruguay. Bull. Am. Mus. Nat. Hist. 224, 1–189.
M. Hedin, J.E. Bond / Molecular Phylogenetics and Evolution 41 (2006) 454–471 471
Goloboff, P.A., 1999. Analyzing large datasets in reasonable times:solutions for composite optima. Cladistics 15, 415–428.
Goloboff, P.A., Platnick, N.I., 1987. A review of the Chilean spiders of thesuperfamily Migoidea (Araneae, Mygalomorphae). Am. Mus. Nov.2888, 1–15.
Goloboff, P.A., Farris, S., Nixon, K. 2003. T.N.T.: Tree analysis usingnew technology. Program and documentation, available at <http://www.zmuc.dk/public/phylogeny/tnt/>.
Griswold, C.E., 1985. A revision of the African spiders of the familyMicrostigmatidae (Araneae: Mygalomorphae). Ann. Natal. Mus. 27,1–37.
Griswold, C., Ledford, J., 2001. A monograph of the migid trap-doorspiders of Madagascar, with a phylogeny of world genera (Araneae,Mygalomorphae, Migidae). Occ. Pap. Calif. Acad. Sci. 151, 1–120.
Hendriks, L., Van Broeckhoven, C., Vandenberghe, A., Van de Peer, Y., DeWachter, R., 1988. Primary and secondary structure of the 18Sribosomal RNA of the bird spider Eurypelma californica and evolution-ary relationships among eukaryotic phyla. Eur. J. Biochem. 177, 15–20.
Hendrixson, B.E., Bond, J.E., 2005. Testing species boundaries in theAntrodiaetus unicolor complex (Araneae: Mygalomorphae: Antrodia-etidae): ‘‘Paraphyly’’ and cryptic diversity. Mol. Phylogenet. Evol. 36,405–416.
Hendrixson, B.E., Bond, J.E., 2006. Molecular phylogeny and biogeogra-phy of an ancient Holarctic lineage of mygalomorph spiders (Araneae:Antrodiaetidae: Antrodiaetus). Mol. Phylogenet. Evol., in revision.
Hillis, D.M., Heath, T.A., St. John, K., 2005. Analysis and visualizationof tree space. Syst. Biol. 53, 471–482.
Huelsenbeck, J.P., 1997. Is the Felsenstein Zone a fly trap? Syst. Biol. 46,69–74.
Huelsenbeck, J.P., 1998. Systematic bias in phylogenetic analysis: Is theStrepsiptera problem solved? Syst. Biol. 47, 519–537.
Huelsenbeck, J.P., Ronquist, F., 2001. MrBayes: Bayesian inference ofphylogeny. Bioinformatics 17, 754–755.
Kass, R.E., Rafferty, A.E., 1995. Bayes factors. J. Am. Stat. Assoc. 90,773–795.
Kjer, K.M., 2004. Aligned 18S and insect phylogeny. Syst. Biol. 53, 506–514.
Loytynoja, A., Goldman, N., 2005. An algorithm for progressive multiplealignment of sequences with insertions. Proc. Natl. Acad. Sci. USA102, 10557–10562.
Maddison, D.R., Maddison, W.P., 2001. MacClade: analysis of phylogenyand character evolution, version 4.0. Sinauer Associates, Sunderland,MA, USA.
Maddison, W.P., Maddison, D.R., 2004. Mesquite: A Modular System forEvolutionary Analysis. Version 1.05, online at <http://mesquitepro-ject.org/> (last accessed 20.01.06).
Main, B.Y., 1985. Further studies on the systematics of ctenized trapdoorspiders: a review of the Australian genera (Araneae: Mygalomorphae:Ctenizidae). Aust. J. Zool. Suppl. Ser. 108, 1–84.
Main, B.Y., 1991. Occurrence of the trapdoor spider genus Moggridgea inAustralia with descriptions of two new species (Araneae: Mygalomorp-hae: Migidae). J. Nat. Hist. 25, 383–397.
Mallatt, J.M., Garey, J.R., Schultz, R., 2004. Ecdysozoan phylogeny andBayesian inference: First use of nearly complete 28S and 18S rRNAgene sequences to classify the arthropods and their kin. Mol.Phylogenet. Evol. 31, 178–191.
Nixon, K.C., 1999. The parsimony ratchet, a new method for rapidparsimony analysis. Cladistics 15, 407–414.
Nylander, J.A.A., 2004. MrModeltest v2. Program distributed by theauthor. Evolutionary Biology Centre, Uppsala University.
Nylander, J.A.A., Ronquist, F., Huelsenbeck, J.P., Nieves-Aldre, J.L.,2004. Bayesian phylogenetic analysis of combined data. Syst. Biol. 53,47–67.
Omilian, A.R., Taylor, D.J., 2001. Rate acceleration and long-branchattraction in a conserved gene of cryptic daphniid (Crustacea) species.Mol. Biol. Evol. 18, 2201–2212.
Penney, D., Wheater, C.P., Selden, P.A., 2003. Resistance of spiders toCretaceous-Tertiary extinction events. Evolution 57, 2599–2607.
Philippe, H., Germot, A., 2000. Phylogeny of eukaryotes based onribosomal RNA: Long-branch attraction and models of sequenceevolution. Mol. Biol. Evol. 17, 830–834.
Platnick, N.I., 1977. The hypochiloid spiders: A cladistic analysis, withnotes of the Atypoidea (Arachnida, Araneae). Am. Mus. Nov. 2627, 1–23.
Platnick, N.I., 1981. Spider biogeography: past, present, and future. Rev.Arachnol. 3, 85–96.
Platnick, N.I., 2006. The world spider catalog, version 6.5. AmericanMuseum of Natural History, online at <http://research.amnh.org/entomology/spiders/catalog/index.html/> (last accessed 20.01.06).
Platnick, N.I., Gertsch, W.J., 1976. The suborders of spiders: a cladisticanalysis (Arachnida, Araneae). Am. Mus. Nov. 2607, 1–15.
Platnick, N.I., Shadab, M.U., 1976. A revision of the mygalomorph spidergenus Neocteniza (Araneae, Actinopodidae). Am. Mus. Nov. 2603, 1–19.
Posada, D., Buckley, T.R., 2004. Model selection and model averaging inphylogenetics: advantages of Akaike Information Criterion and Bayes-ian approaches over likelihood ratio rests. Syst. Biol. 53, 793–808.
Rambaut, A., Drummond, A., 2005. Tracer, A program for analyzingresults from Bayesian MCMC programs such as BEAST & MrBayes,version 1.3.Oxford, online at <http://evolve.zoo.ox.ac.uk/software.html?id=tracer/> (last accessed 12.02.06).
Raven, R.J., 1980. The evolution and biogeography of the mygalomorphspider family Hexathelidae (Araneae, Chelicerata). J. Arachnol. 8,251–266.
Raven, R.J., 1981. A review of the Australian genera of the mygalomorphspider subfamily Diplurinae (Dipluridae: Chelicerata). Aust. J. Zool.29, 321–363.
Raven, R.J., 1985. The spider infraorder Mygalomorphae (Araneae):cladistics and systematics. Bull. Am. Mus. Nat. Hist. 182, 1–180.
Raven, R.J., 1994. Mygalomorph spiders of the Barychelidae in Australiaand the western Pacific. Mem. Qd. Mus. 35, 291–706.
Raven, R.J., Platnick, N.I., 1981. A revision of the American spiders ofthe family Microstigmatidae (Araneae, Mygalomorphae). Am. Mus.Nov. 2707, 1–20.
Ronquist, F., Huelsenbeck, J.P., 2003. MrBayes 3: Bayesian phylogeneticinference under mixed models. Bioinformatics 19, 1572–1574.
Ronquist, F., Huelsenbeck, J.P., van der Mark, P., 2005. MrBayes 3.1Manual, Draft 5/26/2005, online at <http://mrbayes.csit.fsu.edu/manual.php/> (last accessed 20.01.06).
Sanmartın, I., Ronquist, F., 2004. Southern hemisphere biogeographyinferred by event-based models: plant versus animal patterns. Syst.Biol. 53, 216–243.
Selden, P.A., 2002. First British Mesozoic spider, from Cretaceous amberof the Isle of Wight, southern England. Palaeontology 45, 973–983.
Selden, P.A., Gall, J.-C., 1992. A Triassic Mygalomorph spider from thenorthern Vosges, France. Paleontology 35, 211–235.
Selden, P.A., Casado, F. da C., Mesquita, M.V., 2002. Funnel-web spiders(Araneae: Dipluridae) from the Lower Cretaceous of Brazil. Boletimdo 6� Simposio sobre o Cretacio do Brasil/2do Simposio sobre elCretacico de America del Sur (2002), 89–91.
Simon, E., 1892. Histoire Naturelle des Araignees. 1, 1-256. Paris.Stiller, J., Hall, B., 1999. Long branch attraction and the rDNA model of
early eukaryotic evolution. Mol. Biol. Evol. 16, 1270–1279.Swofford, D.L., 2002. PAUP*: phylogenetic analysis using parsimony,
version 4.0b10. Sinauer Associates, Sunderland, MA, USA.Thompson, J.D., Gibson, T.J., Plewniak, F., Jeanmougin, F., Higgins,
D.G., 1997. The Clustal_X windows interface: flexible strategies formultiple sequence alignment aided by quality analysis tools. NucleicAcids Res. 25, 4876–4882.
Whiting, M.F., Carpenter, J.C., Wheeler, Q.D., Wheeler, W.C., 1997. TheStrepsiptera problem: phylogeny of the holometabolous insect ordersinferred from 18S and 28S ribosomal DNA sequences and morphol-ogy. Syst. Biol. 46, 1–68.
Winchell, C.J., Sullivan, J., Cameron, C.B., Swalla, B.J., Mallatt, J., 2002.Evaluating hypotheses of deuterostome phylogeny and chordateevolution with new LSU and SSU ribosomal DNA data. Mol. Biol.Evol. 19, 762–776.