Molecular Insight into the Anion Effect and Free Volume ...
33
1 Molecular Insight into the Anion Effect and Free Volume Effect of CO 2 Solubility in Multivalent Ionic Liquids Xiaoyang Liu, Kathryn E. O’Harra, Jason E. Bara, C. Heath Turner * , Department of Chemical and Biological Engineering, The University of Alabama, Tuscaloosa, AL 35487, USA *E-mail: [email protected] ABSTRACT: For many years, experimental and theoretical studies have investigated the solubility of CO 2 in a variety of ionic liquids (ILs), but the overarching absorption mechanism is still unclear. Currently, two different factors are believed to dominate the absorption performance: (a) the fractional free volume (FFV) accessible for absorption; and (b) the nature of the CO 2 interactions with the anion species. The FFV is often more influential than the specific choice of the anion, but neither mechanism provides a complete picture. Herein, we have attempted to decouple these mechanisms in order to provide a more definitive molecular-level perspective of CO 2 absorption in IL solvents. We simulate a series of nine different multivalent ILs comprised of imidazolium cations and sulfonate/sulfonimide anions tethered to benzene rings, along with a comprehensive analysis of the CO 2 absorption and underlying molecular-level features. We find that the CO 2 solubility has a very strong, linear correlation with respect to FFV, but only when comparisons are constrained to a common anion species. The choice of anion results in a fundamental remapping of the correlation between CO 2 solubility and FFV. Overall, the free volume effect dominates in the ILs with smaller FFV values, while the choice of anion becomes more important in the systems with larger FFVs. Our proposed mechanistic map is intended to provide a more consistent framework for guiding further IL design for gas absorption applications. KEYWORDS: ILs, CO 2 Capture, Molecular dynamics, Absorption, Monte Carlo
Transcript of Molecular Insight into the Anion Effect and Free Volume ...
1
Molecular Insight into the Anion Effect and Free Volume Effect of CO2 Solubility in Multivalent Ionic Liquids Xiaoyang Liu, Kathryn E. O’Harra, Jason E. Bara, C. Heath Turner*, Department of Chemical and Biological Engineering, The University of Alabama, Tuscaloosa, AL 35487, USA *E-mail: [email protected]
ABSTRACT: For many years, experimental and theoretical studies have investigated the solubility of CO2 in a variety of ionic liquids (ILs), but the overarching absorption mechanism is still unclear. Currently, two different factors are believed to dominate the absorption performance: (a) the fractional free volume (FFV) accessible for absorption; and (b) the nature of the CO2 interactions with the anion species. The FFV is often more influential than the specific choice of the anion, but neither mechanism provides a complete picture. Herein, we have attempted to decouple these mechanisms in order to provide a more definitive molecular-level perspective of CO2 absorption in IL solvents. We simulate a series of nine different multivalent ILs comprised of imidazolium cations and sulfonate/sulfonimide anions tethered to benzene rings, along with a comprehensive analysis of the CO2 absorption and underlying molecular-level features. We find that the CO2 solubility has a very strong, linear correlation with respect to FFV, but only when comparisons are constrained to a common anion species. The choice of anion results in a fundamental remapping of the correlation between CO2 solubility and FFV. Overall, the free volume effect dominates in the ILs with smaller FFV values, while the choice of anion becomes more important in the systems with larger FFVs. Our proposed mechanistic map is intended to provide a more consistent framework for guiding further IL design for gas absorption applications.
KEYWORDS: ILs, CO2 Capture, Molecular dynamics, Absorption, Monte Carlo

2
INTRODUCTION Over the past two decades, ionic liquids (ILs) have emerged as potential candidates
for CO2 capture and separation due to their tunable properties.1-4 Some of the first reports on the efficient absorption of CO2 focused on [C4mim][PF6] (1-butyl-3-methylimidazolium hexafluorophosphate), with the CO2 solubility reaching a mole fraction of 0.6 at 25 °C and 8 MPa.5 Imidazolium ILs are the most commonly studied species,6 since they possess lower viscosity than other pyridinium- and ammonium-based ILs, and the CO2 absorption properties (e.g., Henry’s constants) of many of these ILs have been reported in the literature.7-10 As is the case with thermophysical properties (e.g., density, viscosity) of ILs, the gas absorption characteristics are also dictated by the pairing of different anions and cations.4 Our current study is intended to provide a more consistent and generalized framework for guiding IL solvent and IL-based membrane design for gas absorption and separation.
When comparing the performance among different ILs, several previous studies have shown that anions often play an important role in CO2 absorption, and this mechanism is generally called the “anion effect.”2, 4 For instance, a series of ten systematically varied imidazolium ILs was experimentally investigated, and the results showed that the solubility of CO2 is strongly dependent on the type of anion but only slightly changes with respect to the alkyl chain length of the cation.9 Previous studies using the COSMO-RS simulation approach11 also led to the same trend.12-13 In another experimental study, ILs composed of several different cations (imidazolium, ammonium, pyrrolidinium, and phosphonium), and anions ([Tf2N]- (bis(trifluoromethylsulfonyl)imide), [PF6]- and [BF4]- (tetrafluoroborate)) were investigated,8 and the results showed that ILs with the [Tf2N]- anion always demonstrated gas solubilities higher than those with the [BF4]- and [PF6]- anions, suggesting the dominant role of the anion species.
In other work, the same [Tf2N]- anion was used but several different cations were explored ([Pmmim]+ (1,2-dimethyl-3-propylimidazolium), [C4mim]+, [C4mpy]+ (1-butyl-3-methylpyridinium), [perfluoro-C6mim]+ (1-(3,4,5,6-perfluorohexyl)-3-methylimdazolium)) at temperatures ranging from 10-50 °C, and the results showed that the CO2 solubility was only slightly affected by the different cations (within 10 bar Henry's constant at the same corresponding temperature).14 Another series of ILs of the type 1-alkyl-pyridinium bis(trifluoromethylsulfonyl)imide, [CXpy][Tf2N] (X = 4, 8, 10, 12), have also been previously investigated.15 The Henry’s constants of the CO2 solubility in [C12py][Tf2N] with the longest
3
alkyl chain only slightly decreased (~5 bar at 298 K) when compared to the shortest chain length [C4py][Tf2N]. In comparison, the anion effect is clearly evident when different anions were used ([C4py][Tf2N], [C4py][TfAc] ([TfAc]-: trifluoroacetate), and [C4py][dca] ([dca]-: dicyanamide)), with corresponding CO2 Henry’s constant of 32 bar, 57 bar, and 64 bar at 298 K, respectively.
In order to more rigorously characterize the gas interactions with respect to the different ion species, high-pressure X-ray diffraction cells have been used to determine the solvation structure of CO2 in [C4mim][PF6]. This work provided direct evidence of the anion effect by showing that CO2 molecules were preferentially solvated within the vicinity of the [PF6]- anions.16 More recent studies have shown that by tuning the basicity of the anions in [P66614]+-based (trihexyl(tetradecyl)phosphonium) ILs, the CO2 absorption capacity can be increased.17-18 The relationship between the CO2 absorption capacity and the pKa value of the anions provides additional perspective and corroborates the idea that the anion domain contributes more to the overall CO2 absorption.
Besides the physisorption of CO2 within ILs, the chemisorption by the chemical reaction of CO2 with carbene present in [C2mim][oAc] (1,3-dialkylimidazolium acetate) has been reported by Gurau et al.,19 which revealed the supporting role of the acetate ion. Moreover, Kelemen et al.20 also studied 1-ethyl-3-methylimidazolium acetate [C2C1Im][oAc] for CO2 capture, and revealed the importance of the basicity of anions, e.g., ions containing an amine or acetate moiety.
Although the anion selection is very important, many researchers are also beginning to recognize the role of the free volume for determining CO2 solubility.2 As mentioned before, previous studies have indicated that CO2 solubility can be slightly elevated by increasing the imidazolium alkyl chain length.15 It is hypothesized that a longer alkyl chain increases the free volume in the solvent, providing more available space for CO2 absorption. In general, the free volume is defined as the difference between the molar volume and 1.3 times the van der Waals volume occupied by the solvent molecules,2 while the fractional free volume (FFV) is the free volume normalized by the total volume of the system. The Bara group used the concept of fractional free volume (FFV) to describe the physical dissolution of CO2 in IL across a wide range of [Cnmim][X] ILs.21 Our previous studies have explored this concept using a series of 1-n-alkylimidazoles (non-ionic), with chain lengths ranging from methyl (C1) to tetradecyl (C14). A combination of experiments22 and molecular simulations23 were used to comprehensively study the
4
methyl (C1) to heptyl (C7) systems, and the results indicated a clear connection to the FFV, with the shorter-chain imidazoles (methyl and ethyl) displaying reduced CO2 solubility in proportion to the reduction in void volume.
Our previous simulation study of imidazole-based solvents for CO2/CH4 absorption and separation also highlighted the role of the local electrostatic interactions within the solvent free volume. The electrostatic potential surrounding the free volume spaces can vary, depending upon the nature of the ions and the specific arrangement of the ions in the system. This information can also be used to interpret the gas selectivity and possibly guide the development of more effective solvents.24
While our understanding of the different factors controlling the gas solubility of ILs is maturing, the interrelationship between the different underlying performance factors is still difficult to predict. A more generally-applicable framework of the structure-property relationships for IL gas absorption behavior is essential for designing new ILs, and especially for incorporating these cation and anion functionalities within polymeric gas separation membranes.25 Herein, we study a series of different multivalent anion and cation combinations that allow us to sample a range of solvent structures, electrostatic interactions, and gas absorption properties. Overall, we find extremely consistent (linear) correlations between gas solubility and FFV, as long as the anion species is unchanged. If the anion species changes, the slope of the linear relationship with the FFV changes, but the correlation still remains high. Thus, as long as the FFV is evaluated within a consistent context, it appears to be very indicative of the CO2 solubility.
In order to better understand the balance between the free volume versus anion effects in ILs, we explore a new system where two or more cations (or anions) are directly tethered to one or more aromatic rings, with the size of side chains minimized, effectively forming IL “frameworks”. Experimentally, polykis(imidazole-1-yl)benzenes are readily synthesized via Ullmann coupling of imidazole to brominated benzenes (e.g., 1,3,5-tribromobenzene) and the imidazolium form can be obtained by methylation. Corresponding anionic species can be obtained by sulfonation of benzene (or other aromatics), optionally followed by conversion to the sulfonimide forms. These multivalent cations and anions can be combined in stoichiometric ratios to form new types of rigidified ILs wherein the free volume may be fairly static and there is minimal local phase separation of charged and uncharged domains. Furthermore, the use of such rigid, multivalent cations and/or anions in combination with poly(IL) or ionenes may provide a

5
way of increasing permeability by forcing polymer chains further apart. The experimental investigation of these compounds has recently commenced,
opening the door for direct comparisons in the future. The specific ions investigated here have been designed to yield increased FFV, while also exploring multivalent ions that can be used to further elevate the structural rigidity and tune the electrostatic interactions with solutes. While a high IL viscosity is often a major impediment for an industrial solvent application, using these ILs in membrane systems (as polymerized ILs or supported IL membranes26-27) potentially helps circumvent some of the inherent transport limitations.28 In the current study, a total of nine different ILs are modeled, with the chemical structures and respective acronyms summarized in Figure 1. In order to maintain charge neutrality, the following system stoichiometries are used: A1C1 [NpO2][Bzmim2], A1C2 [NpO2]3[Bzmim3]2, A1C3 [NpO2]2[Bzmim4], A2C1 [Np(TfNO)2][Bzmim2], A2C2 [Np(TfNO)2]3[Bzmim3]2, A2C3 [Np(TfNO)2]2[Bzmim4], A3C1 [BzO3]2[Bzmim2]3, A3C2 [BzO3][Bzmim3], and A3C3 [BzO3]4[Bzmim4]3. C1 C2 C3
1,1'-(1,4-phenylene)bis(3-methylimidazolium)
1,1',1''-(benzene-1,3,5-triyl)tris(3-methylimidazolium)
1,1',1'',1'''-(benzene-1,2,4,5-tetrayl)tetrakis(3-
methylimidazolium) [Bzmim2]2+ [Bzmim3]3+ [Bzmim4]4+
A1 A2 A3
naphthalene-1,5-disulfonate naphthalene-1,5-disulfonyl-bis(trifluoromethylsulfonylamide) benzene-1,3,5-trisulfonate
[NpO2]2- [Np(TfNO)2]2- [BzO3]3- Figure 1. Chemical structures of the three cations in the present study C1 [Bzmim2]2+, C2 [Bzmim3]3+, and C3 [Bzmim4]4+ and the three anions A1 [NpO2]2-, A2 [Np(TfNO)2] 2-, and A3 [BzO3]3-.
6
METHODS
Our investigation combines different modeling approaches. Quantum chemical (QC) methods are used to refine the intermolecular potentials for our system, while molecular dynamics (MD) and grand canonical Monte Carlo (GCMC) simulations are used to study the overall system thermophysical characteristics and gas absorption properties. We also perform several different structural and energetic analyses of the MD trajectories in order to quantify the subtle molecular-level differences between the different systems.
Quantum Mechanical Calculations. All of the QC calculations were performed by using first-principles density functional theory (DFT), as implemented in Gaussian 09.29 These calculations were primarily performed to estimate the partial charges on the different atomic sites of the anions and cations, in order to refine the intermolecular force field. Geometric optimizations of the ions were performed using the B3LYP functional30-31 with the 6-311+g(d,p) basis set, and the optimized structures and coordinates of the ions are listed in Section 1 of the Supporting Information. Following the geometry optimizations, the partial charges were estimated using Charge Model 5 (CM5)32 at the same level of theory. The CM5 method has shown some improvement versus other charge assignment methods. It is appropriate for describing the molecular interactions in condensed phases, and it has been used previously in IL simulations.32,33 The predicted CM5 charges were scaled by a factor of 1.2, according to previous guidance.34 The calculated charges using other common charge assignment methods are included for comparison in Section 1 of SI.
Molecular Dynamics Simulations. After the geometry optimizations of the ions, the ion pairs were randomly inserted into the simulation box at a low density by Packmol,35 followed by MD simulation in Gromacs 5.0.36 The total number of ions varied, depending upon the system stoichiometry, with a minimum of at least 216 ions of each species (see Table 1). The OPLS-AA force field37 was used to describe the ion interactions in our system (along with the 1.2*CM5 charges), as assigned by Ligpargen.38 The simulations were performed in the isothermal–isobaric (NPT) ensemble, where the Nosé–Hoover thermostat39 was used to maintain the temperature and the pressure was maintained with the Parrinello–Rahman barostat with time constant of 0.5 and 1 ps, respectively.40-41 Following initial relaxation by the steepest-descent algorithm, the equations of motion were integrated with a time step of 1 fs at 300 K and 1 bar for 10 ns

7
to equilibrate the system. The production phases were conducted for an additional 10 ns at the same conditions. The Lennard-Jones potential and the electrostatic interactions were calculated with a cutoff distance of 1.2 nm, and the particle mesh Ewald (PME)42 method was implemented for long-range electrostatic interaction with 0.12 nm of Fourier spacing, while the bonds with H-atoms were constrained using LINCS method.43 Periodic boundary conditions were implemented in all three dimensions.
Gas Absorption Simulations. The final frame from the MD simulation stages are used as the rigid geometry of the ILs for the subsequent GCMC simulation stages. The absorption of CO2 was modeled using GCMC simulations using the Cassandra package,44-
45 which has been used to model similar systems in the past.46-49 The TraPPE CO2 interaction potential of Potoff and Siepmann50 was used to account for the CO2 interactions, and the cross-term parameters between the ILs and the CO2 were approximated with the Lorentz–Berthelot mixing rules applied to the LJ terms of the interaction potential. In order to increase sampling efficiency, the GCMC simulations are performed with alternating stages of MD. During the GCMC simulations, the ILs are held rigid, while the GCMC steps involving the gas absorbates were run for 1 × 10⁷ steps (with 33% insertion, 33% deletion, 17% translation, and 17% rotation), using 5 × 10⁶ steps for equilibrium and another 5 × 10⁶ steps for sampling. The MD stages involve full system relaxation with NPT ensemble with 5 ns for equilibrium and additional 5 ns for production. After only a few MD/GCMC cycles (<10), the total CO2 absorption reaches a consistent value. An example MD/GCMC run for the highest CO2 solubility in the A1C3 IL is shown in Figure S1 to illustrate the convergence. In order to calculate the interaction energy of the ILs with CO2, only one CO2 molecule was present in the simulation, in order to avoid the possibility of any solute-solute interactions. Ten different independent MD simulations were performed (corresponding to ten different initial CO2 positions) with 1 ns of equilibration in the NPT ensemble and another 1 ns for production. In order to identify our systems during MD simulations are fully equilibrated, the density profile during equilibrium stages within each IL system in different simulations are shown in Figure S2. And the density profiles show our system are equilibrated rapidly even in several pico-seconds.
The solubility of CO2 in ILs can be expressed different ways, depending upon the benchmark or application. Here, we report the “apparent mole fraction” of CO2 (𝑥 , in units of mol CO2 ⋅mol-1 IL) where 𝑛 represents a mole of the IL. In our case, an IL molecule

8
includes the stoichiometric factors (e.g., one A3C1 molecule = [BzO3]2[Bzmim2]3): 𝑥 = (1)
The volumetric solubility of CO2 is equivalent to (𝑆, in units of g CO2 ⋅L-1 IL): 𝑆 = (2)
where 𝑀 is the molecular weight of CO2 and 𝑉 is the molar volume of the neat IL. The Henry’s law constant 𝐻 (atm) is a measure of gas solubility in a liquid at infinite
dilution (often reported in experimental studies), and it can be related to the mole faction solubility at same pressure, as: 𝐻 = (3)
where 𝑃 is the pressure in units of atm. However, as discussed previously,22 a comparison of CO2 solubility based exclusively on Henry’s constants can be deceiving, since increases of the solvent molecular weight can naturally inflate the calculated solubility values. Thus, we focus here on volumetric solubility of CO2 in ILs, which also provides a more direct context for evaluating the free volume effect.
Analysis. The electrostatic characteristics of a system have been confirmed to be very important for analyzing chemical properties of compounds,51-52 and so we have performed extensive analysis of the different electrostatic details in our current IL solvents in order to understand the electrostatic interactions felt by the CO2 absorbates. First, we calculate the local electrostatic potential (ESP) corresponding to the exposed surfaces of the ILs in the fluid (most relevant to gas absorption). These surface regions are simply identified as the Connolly surface using different probe diameters, as a probe travels along the respective Lennard-Jones diameters of the IL atomic sites. Although the overall systems are charge-neutral, there can be a range of different electrostatic interactions that exist in the vicinity of these exposed surfaces, and this analysis has been described in detail previously.24 The electrostatic potential 𝑉 at a given point (𝑥, 𝑦, 𝑧) in the simulation box is calculated as: 𝑉(𝑥, 𝑦, 𝑧) = ∑ (4)
where 𝑞 represents the stationary partial charges on the different IL atomic sites and 𝑟 is the distance to 𝑞 . The ESP is defined as the potential felt by an electron probe (i.e., the

9
value will be positive in regions of negative-negative repulsion), and the analysis is averaged over several different independent snapshots from the MD trajectory. The ESP value averaged over all of the exposed solvent surfaces of the system is calculated as: 𝑉 = (1 𝑛⁄ ) ∑ 𝑉 (𝑥, 𝑦, 𝑧) (5) The average ESP value (𝑉) can be separated into the average positive (𝑉 ) and negative contributions (𝑉 ); 𝑉 is mainly associated with the anions, and 𝑉 is mainly associated with the cations. The variation in the ESP charge on the exposed surface is represented by 𝛱 and is calculated as: 𝛱 = (1 𝑛⁄ ) ∑ |𝑉 (𝑥, 𝑦, 𝑧) − 𝑉| (6) The total ESP variance (𝜎 ) can be written as the sum of positive (𝜎 ) and negative (𝜎 ) contributions, and the degree of charge balance is represented by (𝜈), according to the following equations: 𝜎 = 𝜎 + 𝜎 (7) 𝜎 / = (1 𝑛⁄ ) ∑ 𝑉 (𝑥, 𝑦, 𝑧) − 𝑉 / (8) 𝜈 = ( ) (9)
The structural analysis includes geometrical approaches that have been applied previously, such as the calculation of radial distribution functions (RDF), surface area (SA), and cavity size distributions (CSD). The cavity distributions of ILs are obtained from the MD trajectories by calculating the maximum probe size at random locations within the ILs; the same procedure has been described in previous studies.23, 53 It should be noted that this procedure neglects the radii of the solvent atoms, i.e., CO2 here.23 Thus, we do not account for the specific role of cavity shape and its effect on the absorption of a linear molecule like CO2. In addition, we also calculate the local density distributions (LDD) with respect to the intermixing of the anion and cation species. The distribution probabilities are evaluated by subdividing the system into a three-dimensional grid of cubes (1 nm × 1 nm × 1 nm), and then quantifying the mass density within each cube corresponding to the separate cation and anion contributions. In general, a system with more homogeneous cation and anion mixing would result in a narrower density probability distribution.
In order to further investigate the cation-anion ordering behavior within the ILs, spatial distribution functions (SDFs) have been generated and connection matrices (CMat)

10
of select systems were calculated using the TRAVIS package.54-55 A total of 100 snapshots from the production stages of the MD trajectories are used in the IL structural analyses (RDF, SA, CSD, etc.), and the energetic calculations of the CO2 within the ILs. Because of the computational demands, the ESP calculations are performed using just 10 snapshots for each analysis, but in preliminary calculations we have verified that the number of snapshots does not impact the ESP results within these highly-charged ILs. The snapshots of the ILs from MD simulations were visualized by VMD.56
RESULTS AND DISCUSSION
Structural Properties of the Neat ILs. The density (𝜌), surface area (SA), and FFV of all ILs are summarized in Table 1. The maximum density corresponds to A2C1 (1.588 g/cm3) and the minimum density corresponds to A1C3 (1.376 g/cm3). Overall, the A2-based ILs have larger densities than the A1- and A3-based ILs. In order to evaluate the surface area of the ILs, a probe diameter of 3.64 Å is used, which corresponds to the kinetic diameter of N2.57 Obviously, if a different probe size is used, the surface area values will shift up or down, but according to previous investigations,49 the relative rankings of the system tend to be very consistent. Since the IL structure is dynamic, the surface area (as well as the FFV) is averaged over multiple individual snapshots from the MD trajectories in order to provide representative statistics. The largest surface area in our simulations corresponds to A2C2 (242 m2/cm3) and the smallest surface area is found in the A1C1 mixture (16 m2/cm3).
The calculated FFV of the ILs displays almost the same trend as found with the surface area; A2C2 has the maximum FFV (0.360) and A1C1 has the minimum FFV (0.253). Comparing ILs with the same anion, using A1 as an example, the surface area and the FFV increase with respect to the number of imidazole rings (C1, C2 and C3 have 2, 3, and 4 imidazolium rings, respectively). The same trend is also observed with the A3-based ILs, but there is a slightly different trend with the A2-based ILs, where A2C2 has a larger surface area and FFV than A2C3 and A2C1. Overall, the A2-based ILs have a larger surface area and fractional free volume than A3- and A1-based ILs. Comparing ILs with the same cation, for example C1, A2C1 has a larger surface area and FFV, followed by A3C1 and A1C1. The same trend is also found with the C2- and C3-based ILs. With respect to the chemical structures of the ions, the larger surface areas and FFVs of the A2- and C3-based ILs most likely originate from their larger sizes. However, this trend does not explain why

11
the A2C2 has a larger surface area and FFV than A2C3. Table 1. Summary of the simulated IL properties composed of different ion pairs (m=cation number and n=anion number) at a temperature of 300 K and a pressure of 1 bar.
m n 𝜌a 𝑆𝐴b 𝐹𝐹𝑉c mol g/cm3 m2/cm3 NA
A1C1 216 216 1.460 16 0.253 A1C2 432 648 1.378 69 0.310 A1C3 216 432 1.376 140 0.321 A2C1 216 216 1.588 103 0.289 A2C2 432 648 1.464 242 0.360 A2C3 216 432 1.512 208 0.346 A3C1 648 432 1.466 85 0.269 A3C2 216 216 1.411 100 0.319 A3C3 648 864 1.412 181 0.328
aDensity is obtained from MD simulations with a 0.1% standard deviation; bThe simulated surface area is measured with a probe size representative of N2 (3.64 Å), resulting in a 6% standard deviation; cFFV is measured with a probe size of 0 Å; the resulting values have an error within ±0.002.
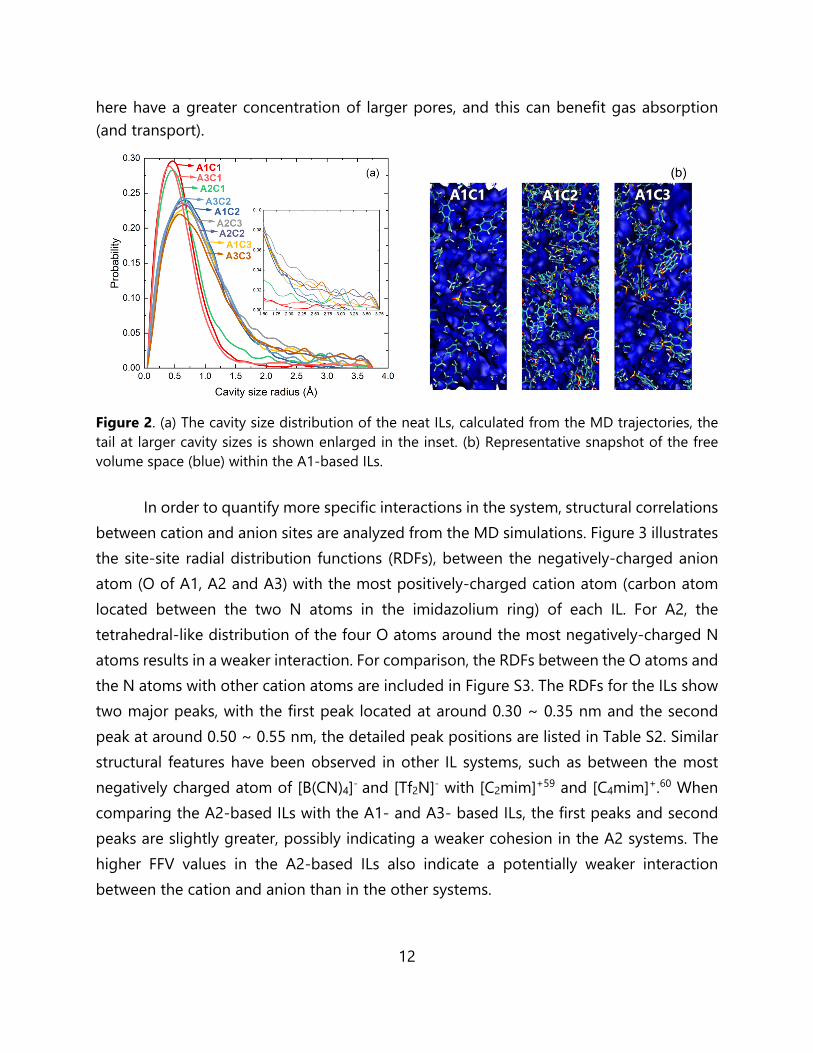
In order to provide additional insight into the neat IL structure, we also calculated the cavity size distribution of the different IL systems, as illustrated in Figure 2. While the cavities in the fluids are dynamic, a statistical analysis over a range of different snapshots from the MD trajectories provide a quantitative analysis of the void spaces available for gas absorption. The CSD results show that C1-based ILs possess cavities that are generally smaller in size, as compared to the C2- or C3- based ILs. Regardless of the anion species, the C1-based ILs display a peak at around 0.5 Å, while the C2- and C3-based ILs have peaks around 0.75 Å. When comparing the C2- and C3-based ILs, the C3-based systems have slightly larger pores than the C2-based ILs, but the difference is not significant. With respect to the different anions, there is also a very slight trend with respect to the CSD, in the order A2 > A1 > A3. While there can be several differences identified in the CSD plot, it is important to emphasize that the tail section corresponding to the larger cavity sizes (~1.5 Å and larger) is more relevant to gas absorption, since the smaller pores are naturally less accessible. Within this tail region, the same observations can be made as before. Margulis reported the CSD of 1-alkyl-3-methylimidazolium hexafluorophosphate (where alkyl=hexyl, octyl, decyl, dodecyl) showing that the cavity distributions were nearly identical for all solvents studied. While the ILs with longer alky chain lengths have a slightly larger CSD, all of the ILs had decrease probability within the larger cavity sizes (2 Å to 3 Å).58 Moreover, when comparing these results directly against our previous materials (containing both ionic polyimides and various ILs),46-49 the C2- and C3-based ILs shown
12
here have a greater concentration of larger pores, and this can benefit gas absorption (and transport).
Figure 2. (a) The cavity size distribution of the neat ILs, calculated from the MD trajectories, the tail at larger cavity sizes is shown enlarged in the inset. (b) Representative snapshot of the free volume space (blue) within the A1-based ILs. In order to quantify more specific interactions in the system, structural correlations between cation and anion sites are analyzed from the MD simulations. Figure 3 illustrates the site-site radial distribution functions (RDFs), between the negatively-charged anion atom (O of A1, A2 and A3) with the most positively-charged cation atom (carbon atom located between the two N atoms in the imidazolium ring) of each IL. For A2, the tetrahedral-like distribution of the four O atoms around the most negatively-charged N atoms results in a weaker interaction. For comparison, the RDFs between the O atoms and the N atoms with other cation atoms are included in Figure S3. The RDFs for the ILs show two major peaks, with the first peak located at around 0.30 ~ 0.35 nm and the second peak at around 0.50 ~ 0.55 nm, the detailed peak positions are listed in Table S2. Similar structural features have been observed in other IL systems, such as between the most negatively charged atom of [B(CN)4]- and [Tf2N]- with [C2mim]+59 and [C4mim]+.60 When comparing the A2-based ILs with the A1- and A3- based ILs, the first peaks and second peaks are slightly greater, possibly indicating a weaker cohesion in the A2 systems. The higher FFV values in the A2-based ILs also indicate a potentially weaker interaction between the cation and anion than in the other systems.

13
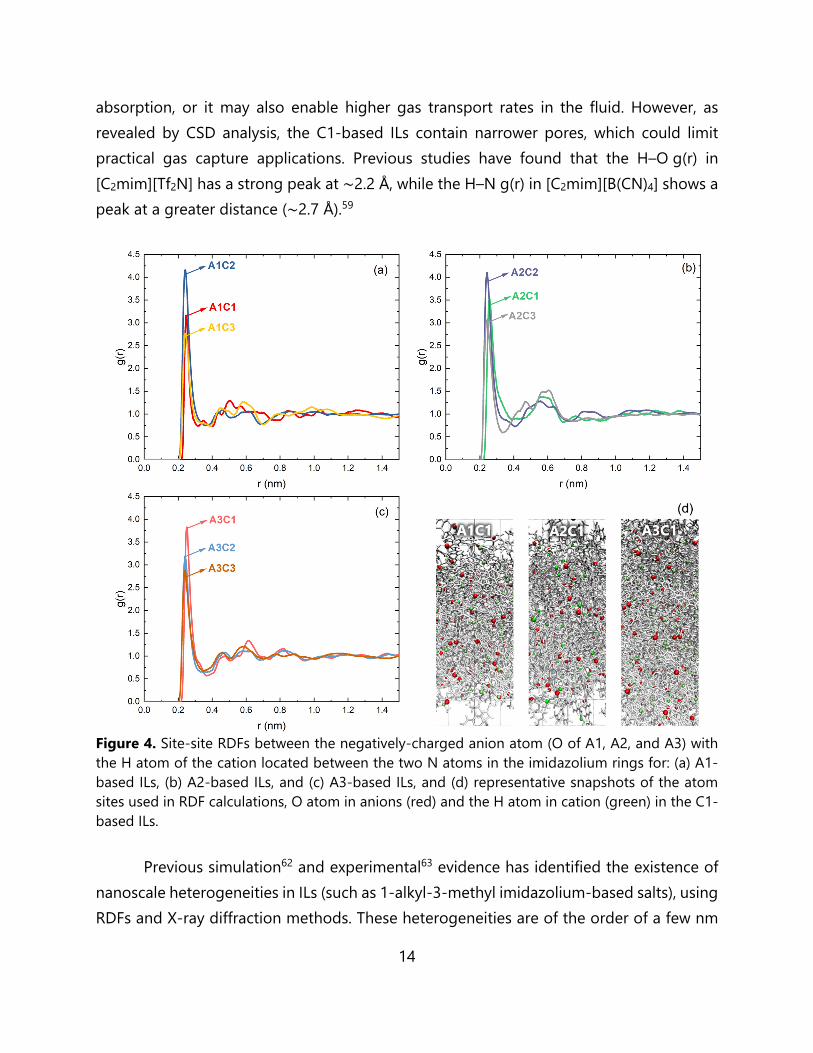
Figure 3. Site-site RDFs between the negatively-charged anion atom (O of A1, A2 and A3) with the most positively-charged cation atom (carbon atom located between the two N atoms in the imidazolium ring) in the following IL mixtures: (a) A1-based ILs, (b) A2-based ILs, (c) A3-based ILs, and (d) representative snapshots of the atom sites used in RDF calculations, O atom in anions (red) and the C atom in cation (blue) in the C1-based ILs. The RDF analysis shown in Figure 4 reflects the H-bond like interactions in the system (although here, we only base this on a distance criterion between the sites;61 for simplicity we will refer to these interactions as H-bonds). The H-bonding RDFs are represented by the interaction between the negatively-charged anion atom (O of A1, A2 and A3) with the H atom of the cation located between the two N atoms in the imidazolium rings. The g(r) plots involving the A1-, A2- and A3-based ILs show strong peaks at around 0.24~0.26 nm. It is notable that regardless of the anion species, the C1-based ILs show a slightly greater H-O g(r) peak distance than the C2- and C3-based ILs. The weaker H-bonding may lead to more noticeable structural changes upon gas
14
absorption, or it may also enable higher gas transport rates in the fluid. However, as revealed by CSD analysis, the C1-based ILs contain narrower pores, which could limit practical gas capture applications. Previous studies have found that the H–O g(r) in [C2mim][Tf2N] has a strong peak at ∼2.2 Å, while the H–N g(r) in [C2mim][B(CN)4] shows a peak at a greater distance (∼2.7 Å).59
Figure 4. Site-site RDFs between the negatively-charged anion atom (O of A1, A2, and A3) with the H atom of the cation located between the two N atoms in the imidazolium rings for: (a) A1-based ILs, (b) A2-based ILs, and (c) A3-based ILs, and (d) representative snapshots of the atom sites used in RDF calculations, O atom in anions (red) and the H atom in cation (green) in the C1-based ILs. Previous simulation62 and experimental63 evidence has identified the existence of nanoscale heterogeneities in ILs (such as 1-alkyl-3-methyl imidazolium-based salts), using RDFs and X-ray diffraction methods. These heterogeneities are of the order of a few nm
15
and the domain size tends to be proportional to the alkyl chain length. In order to provide more quantitative information about the structuring in our system, we calculate the local density distributions associated with the respective anion or cation species. This analysis reflects the anion-cation mixing behavior at small lengths scales (each cell corresponding to 1 nm3).
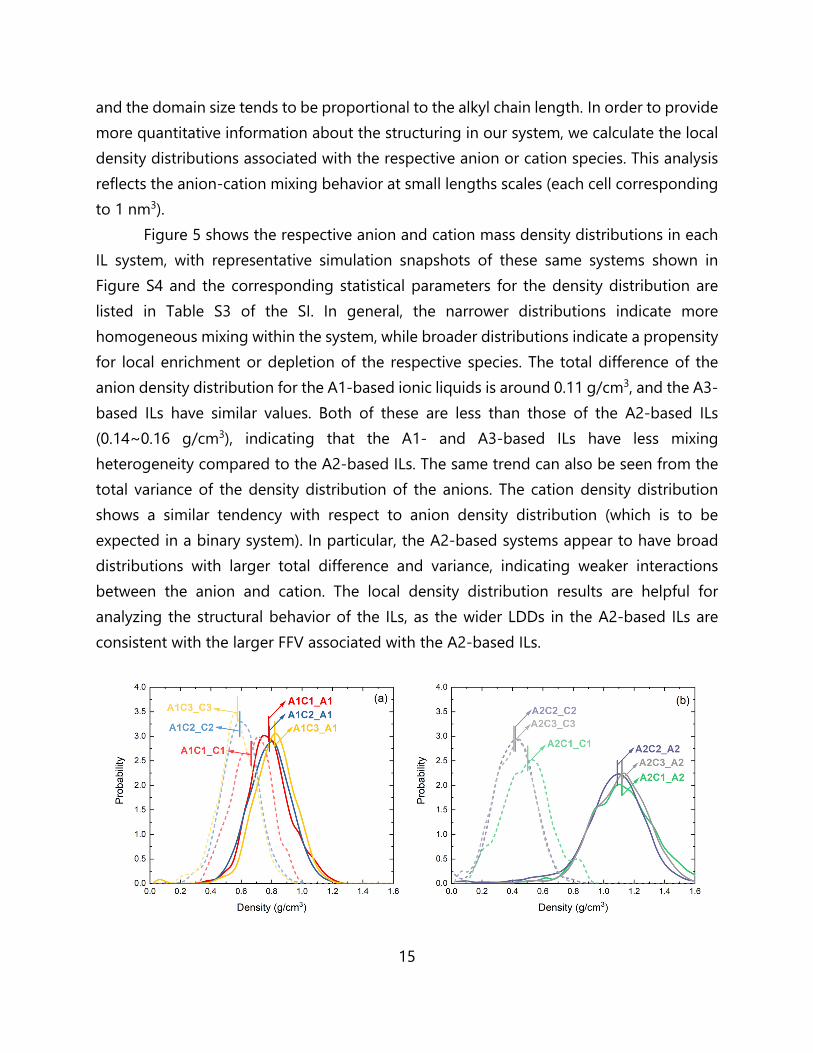
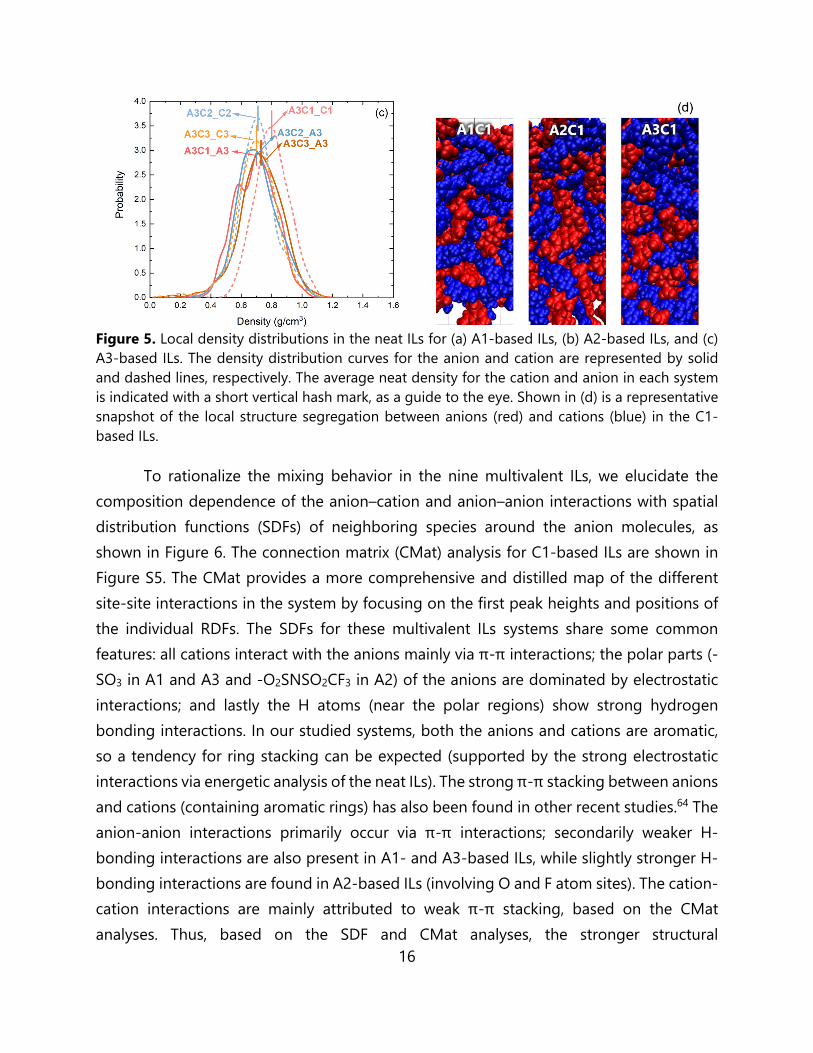
Figure 5 shows the respective anion and cation mass density distributions in each IL system, with representative simulation snapshots of these same systems shown in Figure S4 and the corresponding statistical parameters for the density distribution are listed in Table S3 of the SI. In general, the narrower distributions indicate more homogeneous mixing within the system, while broader distributions indicate a propensity for local enrichment or depletion of the respective species. The total difference of the anion density distribution for the A1-based ionic liquids is around 0.11 g/cm3, and the A3-based ILs have similar values. Both of these are less than those of the A2-based ILs (0.14~0.16 g/cm3), indicating that the A1- and A3-based ILs have less mixing heterogeneity compared to the A2-based ILs. The same trend can also be seen from the total variance of the density distribution of the anions. The cation density distribution shows a similar tendency with respect to anion density distribution (which is to be expected in a binary system). In particular, the A2-based systems appear to have broad distributions with larger total difference and variance, indicating weaker interactions between the anion and cation. The local density distribution results are helpful for analyzing the structural behavior of the ILs, as the wider LDDs in the A2-based ILs are consistent with the larger FFV associated with the A2-based ILs.
16
Figure 5. Local density distributions in the neat ILs for (a) A1-based ILs, (b) A2-based ILs, and (c) A3-based ILs. The density distribution curves for the anion and cation are represented by solid and dashed lines, respectively. The average neat density for the cation and anion in each system is indicated with a short vertical hash mark, as a guide to the eye. Shown in (d) is a representative snapshot of the local structure segregation between anions (red) and cations (blue) in the C1-based ILs.
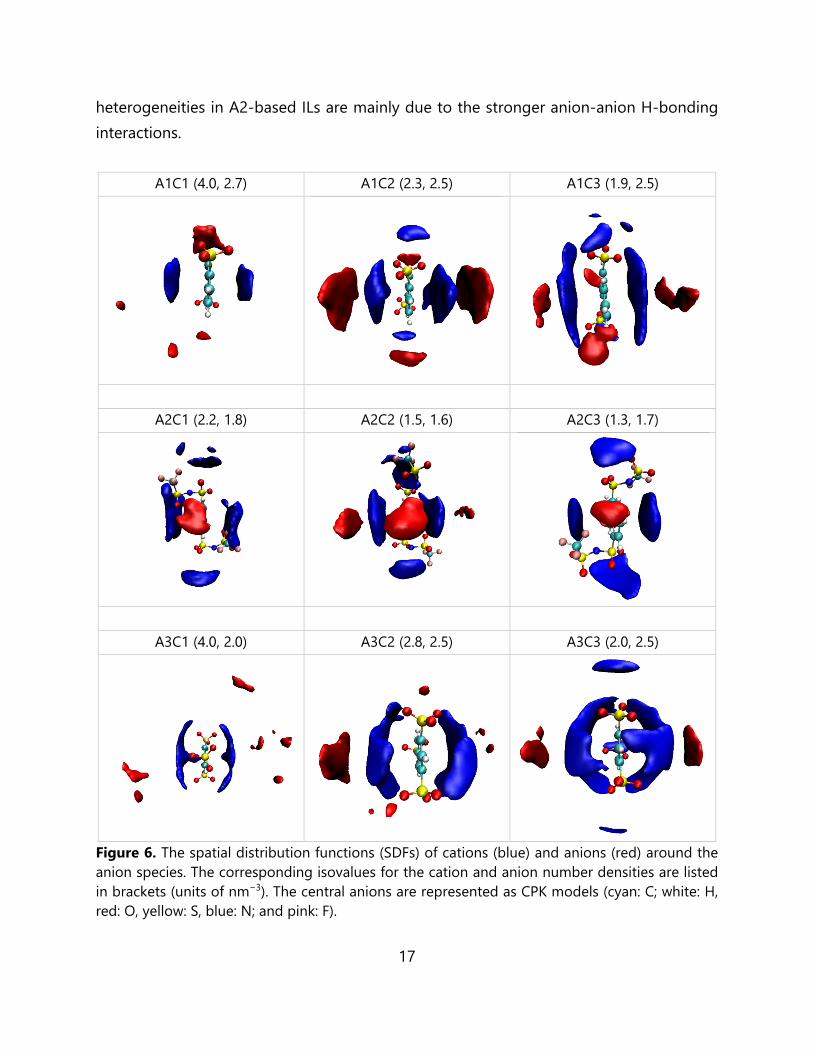
To rationalize the mixing behavior in the nine multivalent ILs, we elucidate the composition dependence of the anion–cation and anion–anion interactions with spatial distribution functions (SDFs) of neighboring species around the anion molecules, as shown in Figure 6. The connection matrix (CMat) analysis for C1-based ILs are shown in Figure S5. The CMat provides a more comprehensive and distilled map of the different site-site interactions in the system by focusing on the first peak heights and positions of the individual RDFs. The SDFs for these multivalent ILs systems share some common features: all cations interact with the anions mainly via π-π interactions; the polar parts (-SO3 in A1 and A3 and -O2SNSO2CF3 in A2) of the anions are dominated by electrostatic interactions; and lastly the H atoms (near the polar regions) show strong hydrogen bonding interactions. In our studied systems, both the anions and cations are aromatic, so a tendency for ring stacking can be expected (supported by the strong electrostatic interactions via energetic analysis of the neat ILs). The strong π-π stacking between anions and cations (containing aromatic rings) has also been found in other recent studies.64 The anion-anion interactions primarily occur via π-π interactions; secondarily weaker H-bonding interactions are also present in A1- and A3-based ILs, while slightly stronger H-bonding interactions are found in A2-based ILs (involving O and F atom sites). The cation-cation interactions are mainly attributed to weak π-π stacking, based on the CMat analyses. Thus, based on the SDF and CMat analyses, the stronger structural
17
heterogeneities in A2-based ILs are mainly due to the stronger anion-anion H-bonding interactions.
A1C1 (4.0, 2.7) A1C2 (2.3, 2.5) A1C3 (1.9, 2.5)
A2C1 (2.2, 1.8) A2C2 (1.5, 1.6) A2C3 (1.3, 1.7)
A3C1 (4.0, 2.0) A3C2 (2.8, 2.5) A3C3 (2.0, 2.5)
Figure 6. The spatial distribution functions (SDFs) of cations (blue) and anions (red) around the anion species. The corresponding isovalues for the cation and anion number densities are listed in brackets (units of nm−3). The central anions are represented as CPK models (cyan: C; white: H, red: O, yellow: S, blue: N; and pink: F).

18
CO2 Solubility. Due to the molecular structuring and domain segregation that can emerge in these ILs on the nanometer length-scale, the CO2 absorption properties reflect both the energetic interactions and the configurational details of the solvation environment. The solvation properties of our simulated IL solvents are compared on the basis of their volumetric CO2 solubility at 300 K and 1 bar, as listed in Table 2. The corresponding CO2 mole faction and Henry’s constant are also listed as reference. Although there is a similar trend, there are clear differences when analyzing the mole fraction versus the volumetric solubility of the CO2. According to the discussion provided in the computational methods, the volumetric solubility of CO2 is the most relevant basis for comparison. When the anion is the same, the systems with more imidazolium rings on the cations seem to have larger CO2 solubility. Our highest predicted volumetric CO2 solubilities are 26 g/L, 30 g/L, and 25 g/L at 300 K and 1 bar for A1C2, A1C3, and A3C3, respectively. These relatively high values are similar to our previous study of ionic polyimides and composite materials.46-49 Also, the volumetric solubility of CO2 of our ILs are higher than those reported for more common univalent ILs, such as [Cnmim][X],25 with n = 2, 4, 6 and X = [BF4]-, [PF6]-, or [Tf2N]- at around 3~5 g/L at 298~313 K at 1 atm, with corresponding Henry’s law constants of 30~100 atm.
We can identify a strong linear relationship between the CO2 solubility and the FFV of our IL systems, when the systems are grouped by the corresponding anions, as shown in Figure 7. As mentioned in the introduction, the correlation between gas solubility and FFV has been previously identified. However, here we find a distinct free volume effect within each anion group, and the FFV tends to increase with respect to the number of imidazolium rings of the cation. While the free volume effect is clearly illustrated, the anion effect is also notable. Even though the A2-based ILs have larger FFVs than the A1- or A3-based ILs, the A2-based systems have lower CO2 solubility. The three different anion-based ILs have three distinct linear relationships with respect to their CO2 solubility relative to their FFV. Although our comparison is limited to nine different systems, the emergent trends in Figure 7 shed light on the balance between the free volume effect versus the anion effect, highlighting the importance of each. With respect to the cations, the C1-based ILs with lower FFVs are dominated by the free volume effect. While for C2- and C3-based ILs with higher FFVs, the anion effect has a larger impact on the solubility, regardless of the FFV decrease.

19
Table 2. The molar weight (𝑀 ), molar volume (𝑉 ) of ILs and CO2 molar fraction solubility (𝑥 ), Henry’s law constant (𝐻), and volumetric solubility (𝑆) in ILs. 𝑀 𝑉 𝑥 𝐻 𝑆
g/mol Å3 mol/mol atm g/L A1C1 527 599 ± 0 0.024 ± 0.006 42.861 ± 11.420 2.951 ± 0.752 A1C2 1502 1809 ± 0 0.635 ± 0.028 2.572 ± 0.006 25.645 ± 1.139 A1C3 975 1177 ± 0 0.478 ± 0.028 2.998 ± 0.019 29.689 ± 1.763 A2C1 789 825 ± 1 0.119 ± 0.024 8.639 ± 0.547 10.624 ± 2.091 A2C2 2288 2595 ± 2 0.572 ± 0.052 2.682 ± 0.127 16.152 ± 1.461 A2C3 1499 1646 ± 1 0.321 ± 0.039 4.147 ± 0.070 14.235 ± 1.729 A3C1 1351 1531 ± 0 0.085 ± 0.018 9.827 ± 2.380 4.073 ± 0.840 A3C2 637 749 ± 1 0.215 ± 0.020 5.745 ± 0.317 20.931 ± 1.966 A3C3 2469 2902 ± 2 0.974 ± 0.047 2.045 ± 0.024 24.611 ± 1.175
Figure 7. Correlation between FFV of ILs with CO2 solubility. Red: A1-based ionic liquids (e.g., A1C1, A1C2, A1C3) (R2 = 0.9996); blue: A2-based ILs (R2 = 0.9751); orange: A3-based ILs (R2 = 0.9998); green: C1-based ILs (R2 = 0.8953); purple: C2-based ILs (R2 = 0.8817); gray: C3-based ILs (R2 = 0.9984).
Electrostatic Potential Analysis. In order to provide more perspective on the CO2 absorption, further analysis of the electrostatic interactions in the IL systems has been performed. The electrostatic potential distribution corresponding to the exposed surfaces of the IL ions is generated with a 0 Å probe size; the plot is illustrated in Figure 8, and the corresponding ESP distribution descriptors are listed in Table 3. Additionally, ESP distributions generated with different probe sizes and in different systems are shown in
20
Figure S6, and the corresponding average ESP values (𝑉) are listed in Table S4. The ESP curves shift to narrower distributions as the probe size increases, but the 𝑉 values shift in different directions, depending upon the specific system.
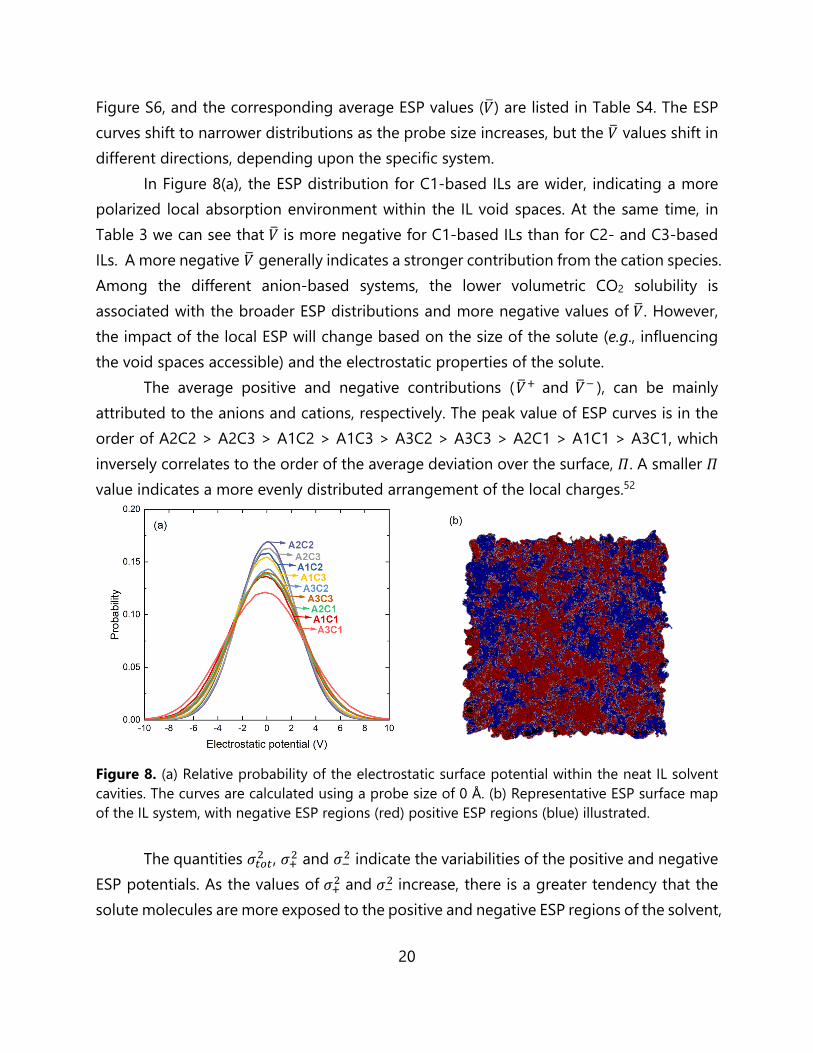
In Figure 8(a), the ESP distribution for C1-based ILs are wider, indicating a more polarized local absorption environment within the IL void spaces. At the same time, in Table 3 we can see that 𝑉 is more negative for C1-based ILs than for C2- and C3-based ILs. A more negative 𝑉 generally indicates a stronger contribution from the cation species. Among the different anion-based systems, the lower volumetric CO2 solubility is associated with the broader ESP distributions and more negative values of 𝑉. However, the impact of the local ESP will change based on the size of the solute (e.g., influencing the void spaces accessible) and the electrostatic properties of the solute.
The average positive and negative contributions (𝑉 and 𝑉 ), can be mainly attributed to the anions and cations, respectively. The peak value of ESP curves is in the order of A2C2 > A2C3 > A1C2 > A1C3 > A3C2 > A3C3 > A2C1 > A1C1 > A3C1, which inversely correlates to the order of the average deviation over the surface, 𝛱. A smaller 𝛱 value indicates a more evenly distributed arrangement of the local charges.52
Figure 8. (a) Relative probability of the electrostatic surface potential within the neat IL solvent cavities. The curves are calculated using a probe size of 0 Å. (b) Representative ESP surface map of the IL system, with negative ESP regions (red) positive ESP regions (blue) illustrated.
The quantities 𝜎 , 𝜎 and 𝜎 indicate the variabilities of the positive and negative ESP potentials. As the values of 𝜎 and 𝜎 increase, there is a greater tendency that the solute molecules are more exposed to the positive and negative ESP regions of the solvent,
21
respectively. For instance, the A1C1 IL corresponds to 𝜎 = 5.6 and 𝜎 = 11.7. Thus, the negative ESP regions of A1C1 have a greater opportunity to interact with CO2 or other molecules, and these regions are mainly generated by the cations in the system. For an isolated CO2 molecule, the ESP distribution (calculated from DFT by Multiwfn65) is illustrated in Figure S7 and Table S5, showing its strong quadrupole nature. The IL systems with larger 𝜎 show less CO2 solubility (e.g., A1C1 and A3C1).
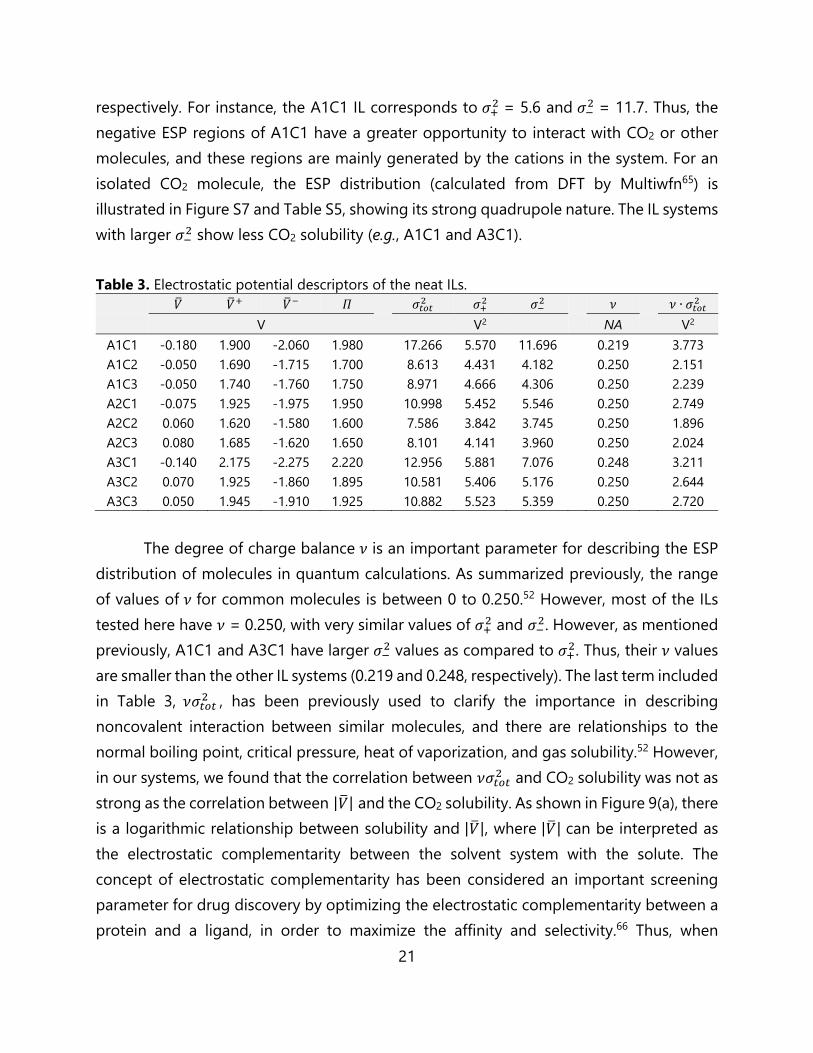
Table 3. Electrostatic potential descriptors of the neat ILs.
𝑉 𝑉 𝑉 𝛱 𝜎 𝜎 𝜎 𝜈 𝜈 ∙ 𝜎 V V2 NA V2
A1C1 -0.180 1.900 -2.060 1.980 17.266 5.570 11.696 0.219 3.773 A1C2 -0.050 1.690 -1.715 1.700 8.613 4.431 4.182 0.250 2.151 A1C3 -0.050 1.740 -1.760 1.750 8.971 4.666 4.306 0.250 2.239 A2C1 -0.075 1.925 -1.975 1.950 10.998 5.452 5.546 0.250 2.749 A2C2 0.060 1.620 -1.580 1.600 7.586 3.842 3.745 0.250 1.896 A2C3 0.080 1.685 -1.620 1.650 8.101 4.141 3.960 0.250 2.024 A3C1 -0.140 2.175 -2.275 2.220 12.956 5.881 7.076 0.248 3.211 A3C2 0.070 1.925 -1.860 1.895 10.581 5.406 5.176 0.250 2.644 A3C3 0.050 1.945 -1.910 1.925 10.882 5.523 5.359 0.250 2.720
The degree of charge balance 𝜈 is an important parameter for describing the ESP
distribution of molecules in quantum calculations. As summarized previously, the range of values of 𝜈 for common molecules is between 0 to 0.250.52 However, most of the ILs tested here have 𝜈 = 0.250, with very similar values of 𝜎 and 𝜎 . However, as mentioned previously, A1C1 and A3C1 have larger 𝜎 values as compared to 𝜎 . Thus, their 𝜈 values are smaller than the other IL systems (0.219 and 0.248, respectively). The last term included in Table 3, 𝜈𝜎 , has been previously used to clarify the importance in describing noncovalent interaction between similar molecules, and there are relationships to the normal boiling point, critical pressure, heat of vaporization, and gas solubility.52 However, in our systems, we found that the correlation between 𝜈𝜎 and CO2 solubility was not as strong as the correlation between |𝑉| and the CO2 solubility. As shown in Figure 9(a), there is a logarithmic relationship between solubility and |𝑉|, where |𝑉| can be interpreted as the electrostatic complementarity between the solvent system with the solute. The concept of electrostatic complementarity has been considered an important screening parameter for drug discovery by optimizing the electrostatic complementarity between a protein and a ligand, in order to maximize the affinity and selectivity.66 Thus, when

22
considering gas capture and separation by ionic liquids or similar materials, the electrostatic complementarity between a solute and a solvent can also be a powerful screening tool for maximizing the solubility and selectivity. A similar trend has been previously identified between the electrostatic potential in 1-n-alkyl-2-methyl-imidazole solvents with CO2/CH4 selectivity.24 With respect to our current calculations, the CO2 solubility is higher when |𝑉| is closer to zero.
Combining the ESP descriptors listed in Table 3 with FFV data, a linear trend can be established between the FFV and 𝑉 , as shown in Figure 9(b). When the 𝑉 is more positive, the FFV of the neat ILs increases with respect to the value of 𝑉, but there are still questions about the nature and location of the free volume spaces within ILs and other solvents.2 One interpretation is that the free volume lies in the interionic space between cation and anions,59 based on correlating the volume expansion with the interaction between the cation and anion. Thus, a weaker cation-anion pair attraction provides more free volume and is more amenable to expansion and CO2 absorption.59 Our results support this interpretation, for as the 𝑉 increases, the vdW interaction decreases (while keeping the same anion). This is particularly true for C1-based ILs, as systems with more negative 𝑉 show stronger vdW interaction, which is summarized in Table S5. Thus, the FFV of the neat ILs can be analyzed with respect to the average electrostatic potential and related to the electrostatic complementarity of the cation and anion.
Figure 9. (a) The logarithmic regression between |𝑉| with the CO2 solubility in ILs (𝑅 = 0.934); (b) the linear regression between 𝑉 and the FFV of the IL solvent (𝑅 = 0.843).
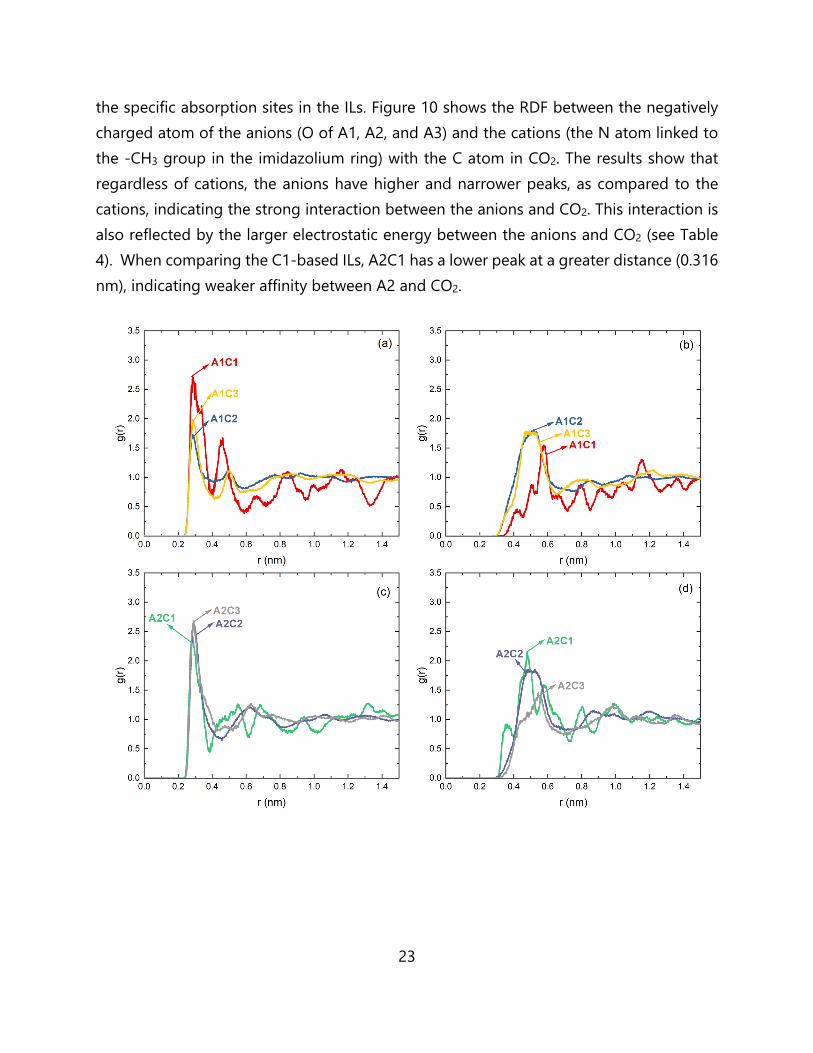
Analysis of Solute-Solvent Interactions. In order to better understand the gas absorption behavior, RDFs are used to characterize the CO2 absorption interactions and
23
the specific absorption sites in the ILs. Figure 10 shows the RDF between the negatively charged atom of the anions (O of A1, A2, and A3) and the cations (the N atom linked to the -CH3 group in the imidazolium ring) with the C atom in CO2. The results show that regardless of cations, the anions have higher and narrower peaks, as compared to the cations, indicating the strong interaction between the anions and CO2. This interaction is also reflected by the larger electrostatic energy between the anions and CO2 (see Table 4). When comparing the C1-based ILs, A2C1 has a lower peak at a greater distance (0.316 nm), indicating weaker affinity between A2 and CO2.

24
Figure 10. Site-site RDFs between the negatively charged anion atoms (O of A1, A2 and A3, left panel) and cation atoms (the N atom linked with -CH3 group in imidazolium ring, right panel) with the carbon atom in CO2, corresponding to: (a, b) A1-based ILs, (c, d) A2-based ILs, and (e, f) A3-based ILs. The average potential interaction energy of one CO2 molecule (taken from ten different independent starting positions) absorbed within the ILs has been summarized in Table 4, and the representative snapshots and energetic data for several CO2 molecules after MD/GCMC simulation is shown in Figure S8 and Table S7 as reference, respectively. The total values are separated into the individual contributions (anion versus cation; van der Waals (vdW, 𝐸 ) versus electrostatic (𝐸 ); total interaction (𝐸 = 𝐸 + 𝐸 )), which was obtained with the g_mmpbsa tool.67 Despite the large charges in the systems, the van der Waals interaction still remains the larger contribution, and this trend has also been confirmed by previous molecular dynamics simulations,68 Monte Carlo simulations,69 and quantum chemical calculations.70 However, the balance of anion versus cation contributions to the interaction energy depends on the system. For the A1-based ILs, the A1C1 system shows the strongest total interaction energy, especially with respect to the vdW contribution. The strong vdW interaction originating from the cation can also be seen in A2C1 and A3C1. With respect to the previous analyses of the CSD and the FFV, although the C1-based ILs have strong interactions with CO2, the constraint of smaller cavities and less free volume leads to lower overall CO2 solubility.
When comparing with different anion systems, the contribution of the vdW interaction versus electrostatic interaction for A1 is almost identical, while much different results can be seen with the A2-based ILs (stronger vdW contribution versus electrostatic interaction). Furthermore, for A3-based ILs, the electrostatic interactions are
25
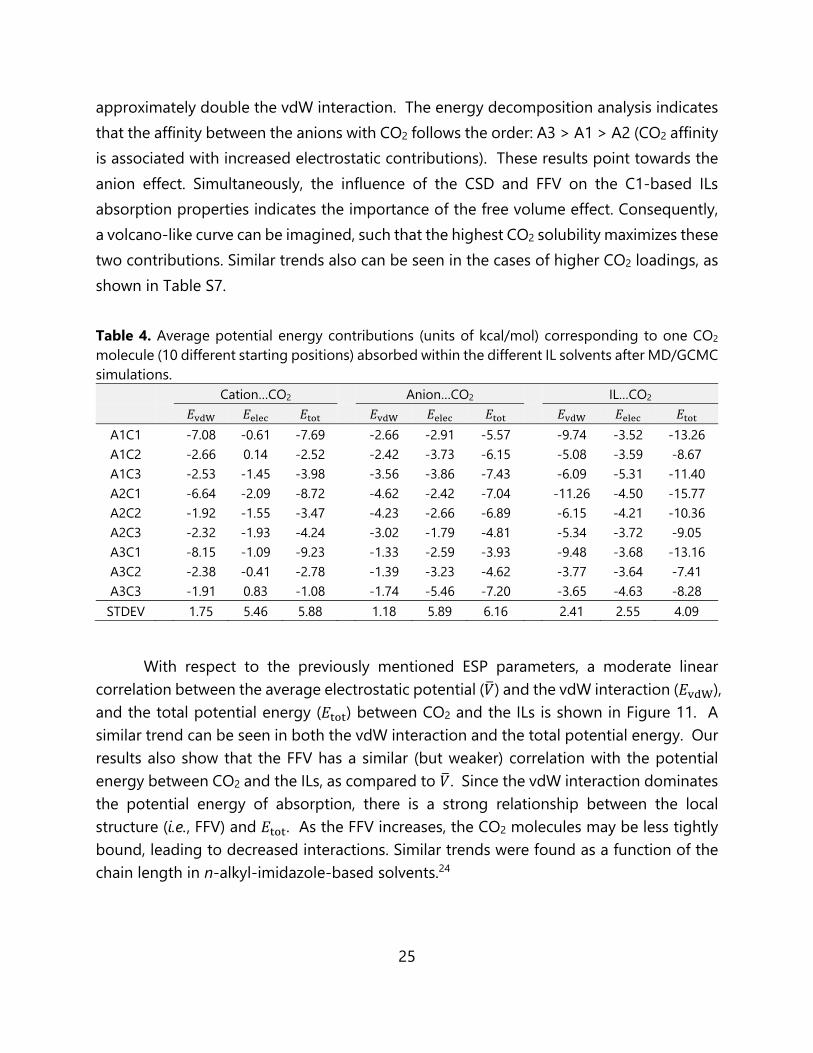
approximately double the vdW interaction. The energy decomposition analysis indicates that the affinity between the anions with CO2 follows the order: A3 > A1 > A2 (CO2 affinity is associated with increased electrostatic contributions). These results point towards the anion effect. Simultaneously, the influence of the CSD and FFV on the C1-based ILs absorption properties indicates the importance of the free volume effect. Consequently, a volcano-like curve can be imagined, such that the highest CO2 solubility maximizes these two contributions. Similar trends also can be seen in the cases of higher CO2 loadings, as shown in Table S7. Table 4. Average potential energy contributions (units of kcal/mol) corresponding to one CO2 molecule (10 different starting positions) absorbed within the different IL solvents after MD/GCMC simulations.
Cation…CO2 Anion…CO2 IL…CO2 𝐸 𝐸 𝐸 𝐸 𝐸 𝐸 𝐸 𝐸 𝐸
A1C1 -7.08 -0.61 -7.69 -2.66 -2.91 -5.57 -9.74 -3.52 -13.26 A1C2 -2.66 0.14 -2.52 -2.42 -3.73 -6.15 -5.08 -3.59 -8.67 A1C3 -2.53 -1.45 -3.98 -3.56 -3.86 -7.43 -6.09 -5.31 -11.40 A2C1 -6.64 -2.09 -8.72 -4.62 -2.42 -7.04 -11.26 -4.50 -15.77 A2C2 -1.92 -1.55 -3.47 -4.23 -2.66 -6.89 -6.15 -4.21 -10.36 A2C3 -2.32 -1.93 -4.24 -3.02 -1.79 -4.81 -5.34 -3.72 -9.05 A3C1 -8.15 -1.09 -9.23 -1.33 -2.59 -3.93 -9.48 -3.68 -13.16 A3C2 -2.38 -0.41 -2.78 -1.39 -3.23 -4.62 -3.77 -3.64 -7.41 A3C3 -1.91 0.83 -1.08 -1.74 -5.46 -7.20 -3.65 -4.63 -8.28 STDEV 1.75 5.46 5.88 1.18 5.89 6.16 2.41 2.55 4.09
With respect to the previously mentioned ESP parameters, a moderate linear
correlation between the average electrostatic potential (𝑉) and the vdW interaction (𝐸 ), and the total potential energy (𝐸 ) between CO2 and the ILs is shown in Figure 11. A similar trend can be seen in both the vdW interaction and the total potential energy. Our results also show that the FFV has a similar (but weaker) correlation with the potential energy between CO2 and the ILs, as compared to 𝑉. Since the vdW interaction dominates the potential energy of absorption, there is a strong relationship between the local structure (i.e., FFV) and 𝐸 . As the FFV increases, the CO2 molecules may be less tightly bound, leading to decreased interactions. Similar trends were found as a function of the chain length in n-alkyl-imidazole-based solvents.24

26
Figure 11. The correlation between 𝑉 with the potential energy of interaction (𝐸 : 𝑅 = 0.6133, 𝐸 : 𝑅 = 0.5525) between the ILs and CO2.
In conclusion, the average electrostatic potential in an IL solvent can be an indication of the FFV available for absorption. The FFV also influences the total binding energy between the ILs and CO2. Our results show that particularly strong or weak interactions are not beneficial for CO2 solubility. As the overall ESP has both negative and positive values, these are nominally ascribed to cation or anion domains in the system, respectively. The anion species has the strongest effect on the CO2 solubility, as confirmed by the radial distribution functions and the interactions between the ILs and CO2. However, the cation influences the CO2 solubility via changes in the cavity size distribution. Thus, the ESP can capture both anion and cation contributions and relate these interactions to the CO2 solubility, as shown in Figure 9(a). When the 𝑉 value is closer to zero, there is an optimal electrostatic complementarity between the cation and anion, leading to higher CO2 solubility.
CONCLUSIONS Here, we reported the CO2 solubility in nine different ILs comprised of multivalent
cations and anions, with a range of different structures and electrostatic interactions. While our initial analysis of the absorption results appeared to be uncorrelated, a separation of the anion effect versus the free volume effect provides much more clarity. While some systems with larger FFVs (such as our A2-based ILs) display lower solubility, this behavior can be normalized with respect to different anion compositions. According to the IL compositions explored here, the CO2 solubility displays a direct linear relationship
27
with respect to the fractional free volume (FFV), but only when comparisons are constrained to a common anion species. Deeper analysis shows that the gas solubility in the ILs can be related to the overall electrostatic potential within the system, which also shows a strong connection to the FFV. Our proposed deconvolution of the CO2 solubility to a mapping of the anion versus FFV factors will be explored further, as we continue seeking materials for industrially-relevant gas separation applications.
Declaration of Competing Interest The authors declare that they have no known competing financial interests or personal relationships that could have appeared to influence the work reported in this paper. Acknowledgments Support for this work was provided by the National Science Foundation (CBET-1605411) and the U.S. Department of Energy, Office of Science, Office of Basic Energy Sciences, Separation Science program under Award Number DE-SC0018181. Computer resources were provided by the Alabama Supercomputer Center. KEO acknowledges support in the form of a GAANN Fellowship from the U.S. Department of Education (P200A180056). Supporting Information Available: This material is available free of charge via the Internet. Summary of structural analyses (optimized molecular structures, including coordinates calculated charges of ions; and representative CO2 solubility simulations in A1C3; density profiles for IL systems during equilibration; RDFs of A2-based ILs; peak positions in RDFs; structural snapshots; density distributions; comparison of the connection matrix (CMat) analyses of C1-based ILs; and ESP curves) in the neat ionic liquids; electrostatic potential distribution of isolated CO2 in gas phase; calculated interactions between cation and anion in ILs; and snapshots and interactions of CO2 absorbed within ionic liquids after MD/GCMC simulation.
28
References 1. Zhang, X.; Zhang, X.; Dong, H.; Zhao, Z.; Zhang, S.; Huang, Y., Carbon Capture with
Ionic Liquids: Overview and Progress. Energy Environ. Sci. 2012, 5, 6668-6681. 2. Lei, Z.; Dai, C.; Chen, B., Gas Solubility in Ionic Liquids. Chem. Rev. 2014, 114, 1289-
326. 3. Izgorodina, E. I.; Seeger, Z. L.; Scarborough, D. L. A.; Tan, S. Y. S., Quantum Chemical
Methods for the Prediction of Energetic, Physical, and Spectroscopic Properties of Ionic Liquids. Chem. Rev. 2017, 117, 6696-6754.
4. Zeng, S.; Zhang, X.; Bai, L.; Zhang, X.; Wang, H.; Wang, J.; Bao, D.; Li, M.; Liu, X.; Zhang, S., Ionic-Liquid-Based CO2 Capture Systems: Structure, Interaction and Process. Chem. Rev. 2017, 117, 9625-9673.
5. Blanchard, L. A.; Hancu, D.; Beckman, E. J.; Brennecke, J. F., Green Processing Using Ionic Liquids and CO2. Nature 1999, 399, 28-29.
6. Scalfani, V. F.; Al Alshaikh, A.; Bara, J. E., Analysis of the Frequency and Diversity of 1,3-Dialkylimidazolium Ionic Liquids Appearing in the Literature. Ind. Eng. Chem. Res. 2018, 57, 15971-15981.
7. Anthony, J. L.; Maginn, E. J.; Brennecke, J. F., Solubilities and Thermodynamic Properties of Gases in the Ionic Liquid 1-n-Butyl-3-methylimidazolium Hexafluorophosphate. J. Phys. Chem. B. 2002, 106, 7315-7320.
8. Anthony, J. L.; Anderson, J. L.; Maginn, E. J.; Brennecke, J. F., Anion Effects on Gas Solubility in Ionic Liquids. J. Phys. Chem. B. 2005, 109, 6366-6374.
9. Aki, S. N.; Mellein, B. R.; Saurer, E. M.; Brennecke, J. F., High-Pressure Phase Behavior of Carbon Dioxide with Imidazolium-Based Ionic Liquids. J. Phys. Chem. B. 2004, 108, 20355-20365.
10. Muldoon, M. J.; Aki, S. N.; Anderson, J. L.; Dixon, J. K.; Brennecke, J. F., Improving Carbon Dioxide Solubility in Ionic Liquids. J. Phys. Chem. B. 2007, 111, 9001-9009.
11. Klamt, A., COSMO-RS: from Quantum Chemistry to Fluid Phase Thermodynamics and Drug Design. Elsevier: 2005.
12. Maiti, A., Theoretical Screening of Ionic Liquid Solvents for Carbon Capture. ChemSusChem 2009, 2, 628-631.
13. Sistla, Y. S.; Khanna, A., Validation and Prediction of the Temperature-Dependent Henry's Constant for CO2–Ionic Liquid Systems Using the Conductor-Like Screening Model for Realistic Solvation (COSMO-RS). J. Chem. Eng. Data 2011, 56, 4045-4060.
29
14. Hou, Y.; Baltus, R. E., Experimental Measurement of the Solubility and Diffusivity of CO2 in Room-Temperature Ionic Liquids Using a Transient Thin-Liquid-Film Method. Ind. Eng. Chem. Res. 2007, 46, 8166-8175.
15. Yunus, N. M.; Mutalib, M. A.; Man, Z.; Bustam, M. A.; Murugesan, T., Solubility of CO2 in Pyridinium Based Ionic Liquids. Chem. Eng. J 2012, 189, 94-100.
16. Kanakubo, M.; Umecky, T.; Hiejima, Y.; Aizawa, T.; Nanjo, H.; Kameda, Y., Solution Structures of 1-Butyl-3-Methylimidazolium Hexafluorophosphate Ionic Liquid Saturated with CO2: Experimental Evidence of Specific Anion−CO2 Interaction. J. Phys. Chem. B. 2005, 109, 13847-13850.
17. Wang, C.; Luo, X.; Luo, H.; Jiang, D. E.; Li, H.; Dai, S., Tuning the Basicity of Ionic Liquids for Equimolar CO2 Capture. Angew. Chem. Int. Ed. 2011, 50, 4918-4922.
18. Wang, C.; Luo, H.; Li, H.; Zhu, X.; Yu, B.; Dai, S., Tuning the Physicochemical Properties of Diverse Phenolic Ionic Liquids for Equimolar CO2 Capture by the Substituent on the Anion. Chem. Eur. J. 2012, 18, 2153-2160.
19. Gurau, G.; Rodríguez, H.; Kelley, S. P.; Janiczek, P.; Kalb, R. S.; Rogers, R. D., Demonstration of Chemisorption of Carbon Dioxide in 1, 3-Dialkylimidazolium Acetate Ionic Liquids. Angew. Chem. Int. Ed. 2011, 50, 12024-12026.
20. Kelemen, Z.; Péter-Szabó, B.; Székely, E.; Hollóczki, O.; Firaha, D. S.; Kirchner, B.; Nagy, J.; Nyulászi, L., An Abnormal N-Heterocyclic Carbene–Carbon Dioxide Adduct from Imidazolium Acetate Ionic Liquids: The Importance of Basicity. Chem. Eur. J. 2014, 20, 13002-13008.
21. Shannon, M. S.; Tedstone, J. M.; Danielsen, S. P.; Hindman, M. S.; Irvin, A. C.; Bara, J. E., Free Volume as the Basis of Gas Solubility and Selectivity in Imidazolium-Based Ionic Liquids. Ind. Eng. Chem. Res. 2012, 51, 5565-5576.
22. Shannon, M. S.; Bara, J. E., Properties of Alkylimidazoles as Solvents for CO2 Capture and Comparisons to Imidazolium-Based Ionic Liquids. Ind. Eng. Chem. Res. 2011, 50, 8665-8677.
23. Turner, C. H.; Cooper, A.; Zhang, Z.; Shannon, M. S.; Bara, J. E., Molecular Simulation of the Thermophysical Properties of N-Functionalized Alkylimidazoles. J. Phys. Chem. B. 2012, 116, 6529-6535.
24. Liu, H.; Zhang, Z.; Bara, J. E.; Turner, C. H., Electrostatic Potential within the Free Volume Space of Imidazole-Based Solvents: Insights into Gas Absorption Selectivity. J. Phys. Chem. B. 2014, 118, 255-264.
25. Bara, J. E.; Carlisle, T. K.; Gabriel, C. J.; Camper, D.; Finotello, A.; Gin, D. L.; Noble, R. D., Guide to CO2 Separations in Imidazolium-Based Room-Temperature Ionic
30
Liquids. Ind. Eng. Chem. Res. 2009, 48, 2739-2751. 26. Gupta, K. M.; Chen, Y.; Hu, Z.; Jiang, J., Metal–Organic Framework Supported Ionic
Liquid Membranes for CO2 Capture: Anion Effects. Phys. Chem. Chem. Phys. 2012, 14, 5785-5794.
27. Gouveia, A. S.; Tomé, L. C.; Lozinskaya, E. I.; Shaplov, A. S.; Vygodskii, Y. S.; Marrucho, I. M., Exploring the Effect of Fluorinated Anions on the CO2/N2 Separation of Supported Ionic Liquid Membranes. Phys. Chem. Chem. Phys. 2017, 19, 28876-28884.
28. Nguyen, P. T.; Wiesenauer, E. F.; Gin, D. L.; Noble, R. D., Effect of Composition and Nanostructure on CO2/N2 Transport Properties of Supported Alkyl-Imidazolium Block Copolymer Membranes. J. Membr. Sci. 2013, 430, 312-320.
29. Frisch, M.; Trucks, G. W.; Schlegel, H. B.; Scuseria, G. E.; Robb, M. A.; Cheeseman, J. R.; Scalmani, G.; Barone, V.; Mennucci, B.; Petersson, G.; et al., Gaussian 09, Revision D. 01. Gaussian, Inc. 2009, Wallingford, CT.
30. Becke, A. D., A New Mixing of Hartree–Fock and Local Density-Functional Theories. J. Chem. Phys. 1993, 98, 1372-1377.
31. Lee, C.; Yang, W.; Parr, R. G., Development of the Colle-Salvetti Correlation-Energy Formula into a Functional of the Electron Density. Phys. Rev. B 1988, 37, 785.
32. Marenich, A. V.; Jerome, S. V.; Cramer, C. J.; Truhlar, D. G., Charge Model 5: An Extension of Hirshfeld Population Analysis for the Accurate Description of Molecular Interactions in Gaseous and Condensed Phases. J. Chem. Theory Comput. 2012, 8, 527-541.
33. Dodda, L. S.; Vilseck, J. Z.; Tirado-Rives, J.; Jorgensen, W. L., 1.14*CM1A-LBCC: Localized Bond-Charge Corrected CM1A Charges for Condensed-Phase Simulations. J. Phys. Chem. B. 2017, 121, 3864-3870.
34. Dodda, L. S.; Vilseck, J. Z.; Cutrona, K. J.; Jorgensen, W. L., Evaluation of CM5 Charges for Nonaqueous Condensed-Phase Modeling. J. Chem. Theory Comput. 2015, 11, 4273-4282.
35. Martínez, L.; Andrade, R.; Birgin, E. G.; Martínez, J. M., PACKMOL: A Package for Building Initial Configurations for Molecular Dynamics Simulations. J. Comput. Chem. 2009, 30, 2157-2164.
36. Abraham, M. J.; Murtola, T.; Schulz, R.; Páll, S.; Smith, J. C.; Hess, B.; Lindahl, E., GROMACS: High Performance Molecular Simulations Through Multi-Level Parallelism from Laptops to Supercomputers. SoftwareX 2015, 1, 19-25.
37. Robertson, M. J.; Tirado-Rives, J.; Jorgensen, W. L., Improved Peptide and Protein

31
Torsional Energetics with the OPLS-AA Force Field. J. Chem. Theory Comput. 2015, 11, 3499-3509.
38. Dodda, L. S.; Cabeza de Vaca, I.; Tirado-Rives, J.; Jorgensen, W. L., LigParGen Web Server: An Automatic OPLS-AA Parameter Generator for Organic Ligands. Nucleic Acids Res. 2017, 45, W331-W336.
39. Hoover, W. G., Canonical Dynamics: Equilibrium Phase-Space Distributions. Phys. Rev. A 1985, 31, 1695.
40. Parrinello, M.; Rahman, A., Crystal Structure and Pair Potentials: A Molecular-Dynamics Study. Phys. Rev. Lett. 1980, 45, 1196.
41. Parrinello, M.; Rahman, A., Polymorphic Transitions in Single Crystals: A New Molecular Dynamics Method. J. Appl. Phys. 1981, 52, 7182-7190.
42. Darden, T.; York, D.; Pedersen, L., Particle Mesh Ewald: An N⋅ log (N) Method for Ewald Sums in Large Systems. J. Chem. Phys. 1993, 98, 10089-10092.
43. Hess, B.; Bekker, H.; Berendsen, H. J.; Fraaije, J. G., LINCS: a Linear Constraint Solver for Molecular Simulations. J. Comput. Chem. 1997, 18, 1463-1472.
44. Shah, J. K.; Maginn, E. J., A General and Efficient Monte Carlo Method for Sampling Intramolecular Degrees of Freedom of Branched and Cyclic Molecules. J. Chem. Phys. 2011, 135, 134121.
45. Shah, J. K.; Marin-Rimoldi, E.; Mullen, R. G.; Keene, B. P.; Khan, S.; Paluch, A. S.; Rai, N.; Romanielo, L. L.; Rosch, T. W.; Yoo, B., Cassandra: An Open Source Monte Carlo Package for Molecular Simulation. J. Comput. Chem. 2017, 38, 1727-1739.
46. Abedini, A.; Crabtree, E.; Bara, J. E.; Turner, C. H., Molecular Simulation of Ionic Polyimides and Composites with Ionic Liquids as Gas-Separation Membranes. Langmuir 2017, 33, 11377-11389.
47. Abedini, A.; Crabtree, E.; Bara, J. E.; Turner, C. H., Molecular Analysis of Selective Gas Adsorption within Composites of Ionic Polyimides and Ionic Liquids as Gas Separation Membranes. Chem. Phys. 2019, 516, 71-83.
48. Szala-Bilnik, J.; Abedini, A.; Crabtree, E.; Bara, J. E.; Turner, C. H., Molecular Transport Behavior of CO2 in Ionic Polyimides and Ionic Liquid Composite Membrane Materials. J. Phys. Chem. B. 2019, 123, 7455-7463.
49. Szala-Bilnik, J.; Crabtree, E.; Abedini, A.; Bara, J. E.; Turner, C. H., Solubility and Diffusivity of CO2 in Ionic Polyimides with [C(CN)3]x[oAc]1−x Anion Composition. Comput. Mater. Sci 2020, 174, 109468.
50. Potoff, J. J.; Siepmann, J. I., Vapor–Liquid Equilibria of Mixtures Containing Alkanes, Carbon Dioxide, and Nitrogen. AlChE J. 2001, 47, 1676-1682.

32
51. Politzer, P.; Murray, J. S., The Fundamental Nature and Role of the Electrostatic Potential in Atoms and Molecules. Theor. Chem. Acc. 2002, 108, 134-142.
52. Murray, J. S.; Brinck, T.; Lane, P.; Paulsen, K.; Politzer, P., Statistically-Based Interaction Indices Derived from Molecular Surface Electrostatic Potentials: A General Interaction Properties Function (GIPF). J. Mol. Struct. THEOCHEM 1998, 307, 55-64.
53. Kupgan, G.; Abbott, L. J.; Hart, K. E.; Colina, C. M., Modeling Amorphous Microporous Polymers for CO2 Capture and Separations. Chem. Rev. 2018, 118, 5488-5538.
54. Martin, B.; Kirchner, B., TRAVIS-A Free Analyzer and Visualizer for Monte Carlo and Molecular Dynamics Trajectories. J. Chem. Inf. Model. 2011, 51, 2007-2023.
55. Brehm, M.; Thomas, M.; Gehrke, S.; Kirchner, B., TRAVIS—A Free Analyzer for Trajectories from Molecular Simulation. J. Chem. Phys. 2020, 152, 164105.
56. Humphrey, W.; Dalke, A.; Schulten, K., VMD: Visual Molecular Dynamics. J. Mol. Graphics 1996, 14, 33-38.
57. Ismail, A. F.; Khulbe, K. C.; Matsuura, T., Gas Separation Membranes. Switz. Springer 2015, 10, 978-3.
58. Margulis, C. J., Computational Study of Imidazolium-Based Ionic Solvents with Alkyl Substituents of Different Lengths. Mol. Phys. 2004, 102 (9), 829-838.
59. Babarao, R.; Dai, S.; Jiang, D.-e., Understanding the High Solubility of CO2 in an Ionic Liquid with the Tetracyanoborate Anion. J. Phys. Chem. B. 2011, 115, 9789-9794.
60. Gupta, K. M.; Jiang, J., Systematic Investigation of Nitrile Based Ionic Liquids for CO2 Capture: A Combination of Molecular Simulation and ab Initio Calculation. J. Phys. Chem. C. 2014, 118, 3110-3118.
61. Jeffrey, G. A., An Introduction to Hydrogen Bonding. Oxford university press New York: 1997; Vol. 12.
62. Wang, Y.; Voth, G. A., Unique Spatial Heterogeneity in Ionic Liquids. J. Am. Chem. Soc. 2005, 127, 12192-12193.
63. Triolo, A.; Russina, O.; Bleif, H.-J.; Di Cola, E., Nanoscale Segregation in Room Temperature Ionic Liquids. J. Phys. Chem. B. 2007, 111, 4641-4644.
64. Brehm, M.; Radicke, J.; Pulst, M.; Shaabani, F.; Sebastiani, D.; Kressler, J., Dissolving Cellulose in 1, 2, 3-Triazolium-and Imidazolium-Based Ionic Liquids with Aromatic Anions. Molecules 2020, 25, 3539.
33
65. Lu, T.; Chen, F., Multiwfn: A Multifunctional Wavefunction Analyzer. J. Comput. Chem. 2012, 33, 580-592.
66. Rathi, P. C.; Ludlow, R. F.; Verdonk, M. L., Practical High-Quality Electrostatic Potential Surfaces for Drug Discovery Using a Graph-Convolutional Deep Neural Network. J. Med. Chem. 2019, DOI: 10.1021/acs.jmedchem.9b01129.
67. Kumari, R.; Kumar, R.; Open Source Drug Discovery, C.; Lynn, A., g_mmpbsa-A GROMACS Tool for High-Throughput MM-PBSA Calculations. J. Chem. Inf. Model. 2014, 54, 1951-1962.
68. Liu, H.; Dai, S.; Jiang, D. E., Solubility of Gases in a Common Ionic Liquid from Molecular Dynamics Based Free Energy Calculations. J. Phys. Chem. B. 2014, 118, 2719-2725.
69. Zhang, X.; Huo, F.; Liu, Z.; Wang, W.; Shi, W.; Maginn, E. J., Absorption of CO2 in the Ionic Liquid 1-n-Hexyl-3-methylimidazolium Tris(pentafluoroethyl)trifluorophosphate ([hmim][FEP]): A Molecular View by Computer Simulations. J. Phys. Chem. B. 2009, 113, 7591-7598.
70. Palomar, J.; Gonzalez-Miquel, M.; Polo, A.; Rodriguez, F., Understanding the Physical Absorption of CO2 in Ionic Liquids Using the COSMO-RS Method. Ind. Eng. Chem. Res. 2011, 50, 3452-3463.