Molecular evolution of the membrane associated ...
17
Molecular evolution of the membrane associated progesterone receptor in the Brachionus plicatilis (Rotifera, Monogononta) species complex *Hilary A. Smith (1), David B. Mark Welch (2), & Terry W. Snell (1) (1) School of Biology, Georgia Institute of Technology, Atlanta, GA 30332-0230, USA (2) Josephine Bay Paul Center for Comparative Molecular Biology and Evolution, Marine Biological Laboratory, Woods Hole, MA 02543-1015, USA (*Author for correspondence: E-mail: [email protected]) Key words: d N /d S , gene tree, PGRMC1, protein structure, signaling, substitution The original publication is available at www.springerlink.com . Specifically, see: http://www.springerlink.com/content/0g3240324448351u/
Transcript of Molecular evolution of the membrane associated ...
Molecular evolution of the membrane associated progesterone receptor in the Brachionus
plicatilis (Rotifera, Monogononta) species complex
*Hilary A. Smith (1), David B. Mark Welch (2), & Terry W. Snell (1)
(1) School of Biology, Georgia Institute of Technology, Atlanta, GA 30332-0230, USA
(2) Josephine Bay Paul Center for Comparative Molecular Biology and Evolution, Marine
Biological Laboratory, Woods Hole, MA 02543-1015, USA
(*Author for correspondence: E-mail: [email protected])
Key words: dN/dS, gene tree, PGRMC1, protein structure, signaling, substitution
The original publication is available at www.springerlink.com. Specifically, see:
http://www.springerlink.com/content/0g3240324448351u/

1
Abstract
Many studies have investigated physiological roles of the membrane associated progesterone
receptor (MAPR), but little is known of its evolution. Marked variations in response to
exogenous progesterone have been reported for four brachionid rotifer species, suggesting
differences in progesterone signaling and reception. Here we report sequence variation for the
MAPR gene in the Brachionus plicatilis species complex. Phylogenetic analysis of this receptor
is compared with relatedness based on cytochrome c oxidase subunit 1 sequences.
Nonsynonymous to synonymous site substitution rate ratios, amino acid divergence, and
variations in predicted phosphorylation sites are examined to assess evolution of the MAPR
among brachionid clades.
Introduction
Considering the roles of hormones in moderating life history traits (Ketterson & Val Nolan,
1999), studies of sex steroid hormones and their receptors may be key to understanding life cycle
transitions. In Brachionus manjavacas, exogenous progesterone can increase mixis rates (Snell
& DesRosiers, 2008). Searches of a brachionid transcriptome yielded an expressed sequence tag
(EST) contig identified as a potential membrane associated progesterone receptor (MAPR) (Snell
& DesRosiers, 2008). The MAPR gene family is proposed to have originated from an ancestral
cytochrome b5 (Cyt b5), and contains Neudesin and the vertebrate-specific paralogs
progesterone receptor membrane component (PGRMC) 1 and 2 (Cahill, 2007). Functions of
MAPR proteins vary across phyla and range from inhibition of apoptosis in ovarian granulosa
cells to cholesterol synthesis and axon guidance (Cahill, 2007; Rohe et al., 2009). While
progesterone binding cannot be assumed by homology, it is notable that the Brachionus putative
MAPR is the only known candidate receptor for progesterone. Chemical signals mediate

2
brachionid rotifer mate recognition and mixis induction (Snell et al., 2006; Snell et al., 2009), but
little is known of their evolution.
Through phylogenetic and substitution rate analyses and structural protein modeling we
provide further evidence that this EST is a rotifer homolog of membrane associated progesterone
receptors, and report on molecular evolution of the rotifer MAPR. Sex-related genes are
associated with higher tendencies for positive selection (Civetta & Singh, 1998). Thus, given the
ability of progesterone to affect rotifer reproduction, the receptor may undergo positive selection.
The fact that some rotifers in the B. plicatilis species complex increase diapausing embryo
production in response to exogenous progesterone, while others remain unaffected at the same
concentrations (Snell & DesRosiers, 2008), reveals the potential for variations in receptor
sequence. This could cause differential response to the ligand. We conduct a phylogenetic
analysis to assess evolution of the MAPR in the B. plicatilis complex, and test for positive,
purifying, or neutral selection using ratios of nonsynonymous to synonymous site substitution
rates (dN/dS). Ratios of dN/dS > 1 suggest positive selection, ratios < 1 indicate purifying
selection, and ratios = 1 imply neutral evolution. We also examine amino acid variation in the
predicted protein structure.
Methods
Cultures — We studied five taxa of the larger L morphotype: B. plicatilis sensu strictu of Poza
Sur, Spain; B. plicatilis s.s. of Tokyo, Japan; B. manjavacas of the Azov Sea, Russia; B. plicatilis
“Austria” of Tianjin, China (hereafter “Austria”); and B. plicatilis “Nevada” of Little Fish Lake,
Nevada, USA (hereafter “Nevada”). We examined three taxa of the smaller SS morphotype: B.
rotundiformis of Poza Sur, Spain; B. rotundiformis of the Adriatic Sea, Italy; and B.
rotundiformis of Hawaii (obtained from the Oceanographic Institute of Hawaii; exact collection

3
site unknown). Taxonomy and morphotype classification follows prior descriptions (Gómez et
al., 2002; Snell & Stelzer, 2005; Fontaneto et al., 2007). Diapausing embryos were hatched at 25º
C in 15 ppt artificial seawater (ASW, Instant Ocean). For each taxon, we used a single hatchling
to initiate a clonal lineage, kept at 22º C in 15 ppt ASW and fed Tetraselmis suecica. Embryos
and hatchlings were kept near 2,000 lux fluorescent lights.
DNA isolation, amplification, cloning, and sequencing — Roughly 100–500 clonemates from ≥
2 replicate cultures were filtered with 68 µm Nitex mesh, then rinsed into a Petri plate with 15
ppt ASW. Rotifers were ground with a pestle in a microcentrifuge tube with 180 µL of ATL
buffer of the DNeasy Blood and Tissue kit (Qiagen). DNA was extracted immediately using the
DNeasy kit. PCR amplification and sequencing were performed for both the nuclear MAPR and
mitochondrial cytochrome c oxidase subunit 1 (cox1) genes. Sequences of cox1 for four taxa and
MAPR homologs across eukaryotes were extracted from GenBank (accessions in Figs. 1b, 2); all
other sequences were obtained in this study and deposited in GenBank (HM024707–
HM024718). PCR conditions are available upon request. The LCO1490 and HCO2198 primers
were used to amplify cox1 (Folmer et al., 1994), modified by eliminating the first 6 bases at the
5’ end of LCO1490. Following prior identification of a progesterone receptor partial transcript
from searches in an EST library (Snell & DesRosiers, 2008), 5’-RACE or rapid amplification of
complementary DNA ends (Frohman et al., 1988) was performed on a cDNA library to obtain
the complete coding sequence for the current study. MAPR primers were designed from complete
coding sequences from 5’-RACE of B. manjavacas (Russia) and B. plicatilis s.s. (NH1L, Japan).
These were MAPR.F1 (5’-ATGCCAGAAGCGTTTGCTATGG-3’), beginning at position 1 of
the coding sequence and MAPR.R1 (5’-TAACTTCGGCTGACTCTTCTTCGT-3’), ending 11
bases upstream of the stop codon.

4
Amplicons were PCR purified after visualizing samples via gel electrophoresis or extracted
with a MinElute Gel Extraction kit (Qiagen). Products of ≥ 2 separate thermal cycling reactions
were combined, ligated into pCRII-TOPO vector, and transformed into chemically competent
TOP10 cells with the TopoTA Cloning Kit (Invitrogen). Colonies were subcloned, and plasmids
purified using the QIAprep Spin Miniprep Kit (Qiagen). From each cloning reaction, ≥ 8
plasmids were sequenced in forward and reverse with M13 primers on an ABI 3730xl Genetic
Analyzer with an ABI Big Dye Terminator v3.1 Cycle Sequencing Kit (Applied Biosystems).
Assembly and analysis — Initial editing and assembly used unix shell scripts from the Josephine
Bay Paul Center of the Marine Biological Laboratory, combining phred, cross_match, and phrap
(Ewing & Green, 1998). Chromatograms were reviewed in consed (Gordon et al., 1998). Reads
were aligned in Clustal X 2.0 (Larkin et al., 2007), and consensus sequences from replicate
plasmids from the same cloning reaction were made in BioEdit (Hall, 1999). We compared
mRNA reads from 5’-RACE with DNA sequences to identify intronic v. coding regions.
The translated B. manjavacas MAPR sequence was submitted to TMHMM server v. 2.0
(Krogh et al., 2001) and Pfam (Finn et al., 2008) to identity transmembrane helix and functional
domains. Protein sequences of MAPR homologs from species representing plants, fungi, and an
array of metazoans were aligned with the amino acid translation of B. manjavacas MAPR using
the Espresso module of T-Coffee (Notredame et al., 2000). Because the amino and carboxy
termini were poorly conserved, phylogenies were constructed from both the full-length
alignment and the high-quality region of the alignment corresponding to positions 53–161 of the
B. manjavacas peptide using maximum likelihood (ML) and Bayesian methods with the WAG
model of amino acid change with a gamma shape correction, as chosen by ProtTest (Abascal et
al., 2005). For ML, four independent runs of Garli 0.96b8 (Zwickl, 2006) were used to find the
5
best tree and 1000 bootstrap replicates were examined to determine support for each node. For
Bayesian inference, two independent runs of MrBayes v3.1 (Huelsenbeck & Ronquist, 2001)
using 4 chains and 2 million generations each converged on the same tree and parameter values;
the first 1 million generations were discarded as burn-in to generate posterior probability support
for each node.
Regions between PCR primers (163 codons plus the intron for MAPR, 201 codons for cox1)
were used for phylogenetic analysis among brachionids. Gene trees of cox1 and MAPR were
generated using MrBayes 3.1 (Huelsenbeck & Ronquist, 2001), with nucleotide frequencies and
parameters for the GTR + gamma model estimated independently for codon first + second
positions and codon third positions (+ intron positions for MAPR). Two independent runs of four
chains were run for 2 million generations and sampled every 100 generations; comparison of
parameter estimates indicated convergence (Gelman & Rubin, 1992). The first 1 million
generations were discarded as burn-in and consensus trees examined with FigTree v1.2.2
(Rambaut, 2009). Consensus trees and sequence alignments (without the MAPR intron) were
input in codeml in PAML 4.0 (Yang, 2007) to estimate dN and dS. Likelihood ratio tests
supported use of codon tables to estimate codon frequency for both genes (CodonFreq=3 in the
codeml control file); transition/transversion and dN/dS ratios were estimated from the data. Tests
for selection were M0 (default codeml parameters) v. M3 (Nsites=3, ncat=3); M1a (Nsites=1) v.
M2a (Nsites=2); and M7 (Nsites=7, ncat=10) v. M8 (Nsites=8, ncat=10) (Zhang et al., 2005);
results were evaluated by likelihood ratio tests (Yang & Nielsen, 2002). Competing tree
topologies were evaluated via the Kishino Hasegawa test (Kishino & Hasegawa, 1989) in
codeml.
The 3-dimensional structure for MAPR was predicted by submitting the B. manjavacas
6
translated coding sequence to SWISS-MODEL for automated comparative modeling (Schwede
et al., 2003). Structures were visualized in Cn3D (Wang et al., 2000) after conversion to the
appropriate format in VAST (Gibrat et al., 1996). Amino acid (aa) substitutions were classified
as conservative, moderately conservative, moderately radical, or radical (Li et al., 1984). MAPR
sequences were scanned for PROSITE motifs with ScanProsite (de Castro et al., 2006).
Results
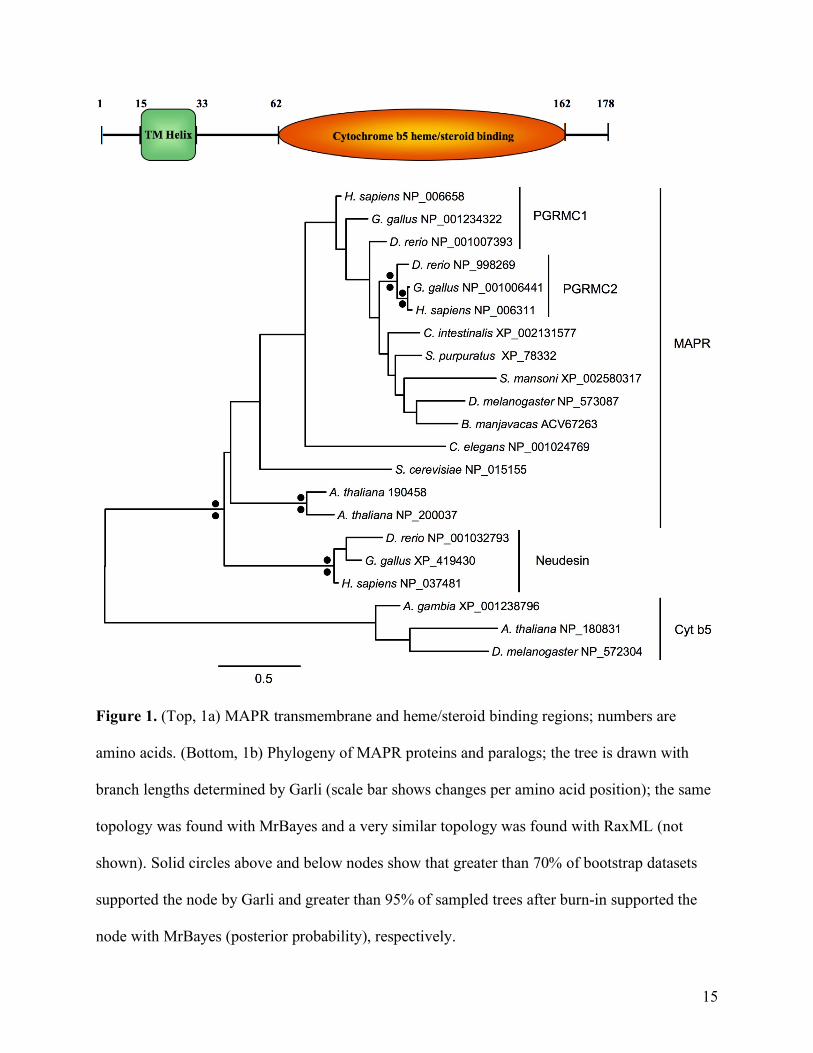
The rotifer MAPR amplified region, which began with the presumptive start codon and ended 11
bases before the stop codon, consisted of 535 bp of coding sequence (178 aa), split by an intron
of 53–54 bp that began after coding position 458. One transmembrane helix was predicted and
the only domain with a significant E value found by Pfam was a cytochrome b5-like
heme/steroid binding domain (Fig. 1a), a domain found in MAPRs of other eukaryotes (Mifsud
& Bateman, 2002). A search of the NCBI nr database using blastp revealed that the most similar
sequences contained this domain and were annotated as membrane associated steroid or
progesterone receptors. In phylogenetic analyses of a diverse set of MAPR homologs, although
support for nodes was generally poor different methods returned the same best tree topology with
the B. manjavacas MAPR grouped deeply within the clade of metazoan MAPRs (Fig. 1b),
distinct from conserved paralogs cytochrome b5 and Neudesin (Cahill, 2007).
The gene tree of Brachionus MAPR sequences (Fig. 2) was consistent with established
phylogenetic relationships among Brachionus spp. based on cox1 and ITS (Gómez et al., 2002;
Suatoni et al., 2006). In contrast, the Bayesian consensus tree for cox1 had no significant support
for relative positions of “Austria,” “Nevada,” B. manjavacas, and B. plicatilis s.s., and arranged
the B. plicatilis clade as (“Austria”(B. plicatilis s.s.(“Nevada”, B. manjavacas))), an inaccurate
arrangement based on the clades’ placement in prior studies (Gómez et al., 2002; Suatoni et al.,
7
2006). All codeml analyses using cox1 were performed on the topology of both the cox1
Bayesian consensus tree and the MAPR tree; resulting likelihoods were compared with the
Kishino Hasegawa test. In no case was one topology significantly better than the other. Thus,
further analysis and trees reported in this study (Fig. 2) only use the topology from the MAPR
consensus tree. Tests for positive selection showed no significant difference in dN/dS between
branches or across sites, with strong purifying selection for both genes. Allowing variation of
dN/dS across branches did not result in a significantly better model than keeping the ratio constant
(for the latter model, dN/dS = 0.06 for MAPR and 0.0003 for cox1), but yielded values of dN up to
76x higher and dS up to 79x lower for MAPR v. cox1 (Table 1).
Structural modeling used the Arabidopsis thaliana MAPR homolog, PDB entry 1J03, as a
template (E value of 8.7x10⁻³⁰, 42% sequence identity). The model predicted a structure from
amino acid 61 to 162 of MAPR (Fig. 3). Rohe et al. (2009) reviewed four sites required for heme
binding in the homolog PGRMC1 surrounding a putative ligand-binding cleft, which we found
were identical to those in rotifers at analogous sites (Fig. 3).
Scanning for PROSITE motifs yielded ≥ 10 predicted phosphorylation sites per taxon:
protein kinase C phosphorylation sites, cAMP- and cGMP-dependent protein kinase
phosphorylation sites, and casein kinase II phosphorylation sites. With a mere 25 sites of amino
acid variation among the eight taxa, motifs varied. A phosphorylation site was predicted at 51–54
aa for the L morphotypes, while those in the three B. rotundiformis were slightly downstream
(one at 59–62 aa, one at 59–61 aa). Only B. manjavacas had a phosphorylation site predicted at
64–67 aa, and only B. rotundiformis of Spain and of Italy had phosphorylation sites at 93–96 aa.
Discussion
We report the first in-depth analysis of molecular evolution of a MAPR gene in any eukaryotic

8
lineage. Purifying selection on MAPR suggests it has an important role conserved among rotifers.
Yet, small amino acid differences may enable some functional divergence, perhaps underlying
variation in life history traits regulated by a progesterone signaling pathway.
Comparing MAPR and cox1 genes enhances insight of their evolution. The ability of MAPR
to produce a gene topology consistent with the cox1 gene trees in Gómez et al. (2002) and
Suatoni et al. (2006) shows its utility as a phylogenetic marker and supports their findings. In the
MAPR tree genetic distance (branch length, i.e., substitutions per codon) is much shorter among
members of the SS morphotype and among members of the L morphotype than between these
two groups, but the difference is less pronounced on the cox1 tree. Use of more samples (rotifer
lineages) may improve resolution for the cox1 gene tree; however, the fact that the MAPR gene
provided better resolution for relatedness of the L morphotype clades may be due to the higher
relative number of nonsynonymous substitutions for MAPR relative to cox1. Since these
nonsynonymous substitutions represent amino acid changes, and thus are more likely targets for
the action of selection, they may represent important differences fixed among the clades.
The branch-site test performed here suggests both genes are under purifying selection (dN/dS
< 1). Thus, variation in the degree to which exogenous progesterone impacts rotifer reproduction
(Snell & DesRosiers, 2008) does not appear to reflect positive selection pressure on the MAPR
gene among sites or branches. Positive selection may occur on other genes in a progesterone
signaling pathway, or other, as yet unidentified, receptors may play a role in signaling. Still, the
higher dN of the MAPR v. cox1, despite its lower dS, suggests MAPR is under less intense
purifying selection. The lower dS is expected, considering the typical trend for mitochondrial
DNA to show higher rates of mutation than nuclear DNA (Haag-Liautard et al., 2008). The
higher dN could underlie weak positive selection on MAPR not detected by the branch-site test,

9
or relaxed selection pressure relative to cox1, but further study is needed (e.g., with more clades).
It has been suggested that some pine tree expressed sequence tags with a dN/dS of 0.20–0.52 are
under positive selection (Palmé et al., 2008). As Palmé et al. note, a dN/dS above 1 is a
conservative test for positive selection, and thus absence of a ratio above 1 in our study does not
eliminate the potential for a weak level of positive selection below the limits of detection.
Amino acid substitutions that accrued over time may have altered MAPR function even with
purifying selection. The large number of predicted phosphorylation sites supports a role in signal
transduction, as reviewed by Cahill (2007). Variation in predicted sites among rotifers could
allow for differential signal transduction, though more research is required to confirm the sites’
function. Four residues critical for heme binding in PGRMC1 are conserved in rotifers. It has
been proposed structural elements required for binding heme also function in interactions with a
binding partner that mediates progesterone signaling (Rohe et al., 2009), though study is needed
to clarify roles of specific amino acids in a progesterone pathway. In rotifers, most substitutions
in the heme/steroid binding domain are distal to the ligand-binding cleft and are conservative or
moderately conservative. Still, such changes could affect interactions with other molecules (e.g.,
binding partners). In one human patient a mutation from histidine to arginine at 165 aa was
found to prevent binding of cytochrome P450 7A1, and linked to premature ovarian failure
(Mansouri et al., 2008). In all eight rotifers a proline exists at the site; binding of P450 7A1 in
humans may be derived trait. In conclusion, evolution of the MAPR may represent an overall
sequence conservation, marked by small but significant changes allowing functional divergence.
Acknowledgements
National Science Foundation grant BE/GenEn MCB-0412674E to TWS and DMW, and an NSF
IGERT fellowship to HAS under DGE 0114400, supported this work. E. García-Roger provided

10
subcultures of B. rotundiformis and B. plicatilis s.s. of Spain. B. Hecox-Lea did 5’-RACE. T.
Shearer gave advice. Comments by R.L. Wallace, M. Serra, and two anonymous reviewers
improved this manuscript.
References
Abascal, F., R. Zardoya & D. Posada, 2005. ProtTest: selection of best-fit models of protein
evolution. Bioinformatics 21: 2104–2105.
Cahill, M. A., 2007. Progesterone receptor membrane component 1: an integrative review.
Journal of Steroid Biochemistry and Molecular Biology 105: 16–36.
Civetta, A. & R. S. Singh, 1998. Sex-related genes, directional sexual selection, and speciation.
Molecular Biology and Evolution 15: 901–909.
de Castro, E., C. J. A. Sigrist, A. Gattiker, V. Bulliard, P. S. Langendijk-Genevaux, E. Gasteiger,
A. Bairoch & N. Hulo, 2006. ScanProsite: detection of PROSITE signature matches and
ProRule-associated functional and structural residues in proteins. Nucleic Acids Research 34:
W362–W365.
Ewing, B. & P. Green, 1998. Base-calling of automated sequencer traces using phred. II. Error
probabilities. Genome Research 8: 186–194.
Finn, R. D., J. Tate, J. Mistry, P. C. Coggill, J. S. Sammut, H. R. Hotz, G. Ceric, K. Forslund, S.
R. Eddy, E. L. Sonnhammer & A. Bateman, 2008. The Pfam protein families database.
Nucleic Acids Research 36: D281–D288.
Folmer, O., M. Black, W. Hoeh, R. Lutz & R. Vrijenhoek, 1994. DNA primers for amplification
of mitochondrial cytochrome c oxidase subunit I form diverse metazoan invertebrates.
Molecular Marine Biology and Biotechnology 3: 294–299.

11
Fontaneto, D., I. Giordani, G. Melone & M. Serra, 2007. Disentangling the morphological stasis
in two rotifer species of the Brachionus plicatilis species complex. Hydrobiologia 583: 297–
307.
Frohman, M. A., M. K. Dush & G. R. Martin, 1988. Rapid production of full-length cDNAs
from rare transcripts: amplification using a single gene-specific oligonucleotide primer.
Proceedings of the National Academy of Sciences of the United States of America 85: 8998–
9002.
Gelman, A. & D. B. Rubin, 1992. Inference from iterative simulation using multiple sequences.
Statistical Science 7: 434–455.
Gibrat, J.-F., T. Madej & S. H. Bryant, 1996. Surprising similarities in structure comparison.
Current Opinion in Structural Biology 6: 377–385.
Gómez, A., M. Serra, G. R. Carvalho & D. H. Lunt, 2002. Speciation in ancient cryptic species
complexes: evidence from the molecular phylogeny of Brachionus plicatilis (Rotifera).
Evolution 56: 1431–1444.
Gordon, D., C. Abajian & P. Green, 1998. Consed: a graphical tool for sequence finishing.
Genome Research 8: 195–202.
Haag-Liautard, C., N. Coffey, D. Houle, M. Lynch, B. Charlesworth & P. D. Keightley, 2008.
Direct estimation of the mitochondrial DNA mutation rate in Drosophila melanogaster.
PLoS Biology 6: e204.
Hall, T. A., 1999. BioEdit: a user-friendly biological sequence alignment editor and analysis
program for Windows 95/98/NT. Nucleic Acids Symposium Series 41: 95–98.
Huelsenbeck, J. P. & F. Ronquist, 2001. MRBAYES: Bayesian inference of phylogenetic trees.
Bioinformatics 17: 754–755.

12
Ketterson, E. D. & J. Val Nolan, 1999. Adaptation, exaptation, and constraint: a hormonal
perspective. The American Naturalist 154: S4–S25.
Kishino, H. & M. Hasegawa, 1989. Evaluation of the maximum likelihood estimate of the
evolutionary tree topologies from DNA sequence data, and the branching order in
Hominoidea. Journal of Molecular Evolution 29: 170–179.
Krogh, A., B. Larsson, G. v. Heijne & E. L. L. Sonnhammer, 2001. Predicting transmembrane
protein topology with a hidden Markov model: application to complete genomes. Journal of
Molecular Biology 305: 567–580.
Larkin, M. A., G. Blackshields, N. P. Brown, R. Chenna, P. A. McGettigan, H. McWilliam, F.
Valentin, I. M. Wallace, A. Wilm, R. Lopez, J. D. Thompson, T. J. Gibson & D. G. Higgins,
2007. Clustal W and Clustal X version 2.0. Bioinformatics 23: 2947–2948.
Li, W.-H., C.-I. Wu & C.-C. Luo, 1984. Nonrandomness of point mutation as reflected in
nucleotide substitutions in pseudogenes and its evolutionary implications. Journal of
Molecular Evolution 21: 58–71.
Mansouri, M. R., J. Schuster, J. Badhai, E.-L. Stattin, R. Lösel, M. Wehling, B. Carlsson, O.
Hovatta, P. O. Karlström, I. Golovleva, D. Toniolo, S. Bione, J. Peluso & N. Dahl, 2008.
Alterations in the expression, structure and function of progesterone receptor membrane
component-1 (PGRMC1) in premature ovarian failure. Human Molecular Genetics 17: 3776–
3783.
Mifsud, W. & A. Bateman, 2002. Membrane-bound progesterone receptors contain a cytochrome
b5-like ligand-binding domain. Genome Biology 3: research0068.0061–research0068.0065.
Notredame, C., D. G. Higgins & J. Heringa, 2000. T-Coffee: a novel method for fast and
accurate multiple sequence alignment. Journal of Molecular Biology 302: 205–217.

13
Palmé, A. E., M. Wright & O. Savolainen, 2008. Patterns of divergence among conifer ESTs and
polymorphism in Pinus sylvestris identify putative selective sweeps Molecular Biology and
Evolution 25: 2567–2577.
Rambaut, A., 2009. FigTree v1.2.2. Available at http://tree.bio.ed.ac.uk/software/figtree/.
Rohe, H. J., I. S. Ahmed, K. E. Twist & R. J. Craven, 2009. PGRMC1 (progesterone receptor
membrane component 1): a targetable protein with multiple functions in steroid signaling,
P450 activation and drug binding. Pharmacology and Therapeutics 121: 14–19.
Schwede, T., J. Kopp, N. Geux & M. C. Peitsch, 2003. SWISS-MODEL: an automated protein
homology-modeling server. Nucleic Acids Research 31: 3381–3385.
Snell, T. W. & C.-P. Stelzer, 2005. Removal of surface glycoproteins and transfer among
Brachionus species. Hydrobiologia 546: 267–274.
Snell, T. W. & N. J. D. DesRosiers, 2008. Effects of progesterone on sexual reproduction of
Brachionus manjavacas (Rotifera). Journal of Experimental Marine Biology and Ecology
363: 104–109.
Snell, T. W., T. L. Shearer, H. A. Smith, J. Kubanek, K. E. Gribble & D. B. Mark Welch, 2009.
Genetic determinants of mate recognition in Brachionus manjavacas (Rotifera). BMC
Biology 7: 60.
Snell, T. W., J. Kubanek, W. Carter, A. B. Payne, J. Kim, M. K. Hicks & C.-P. Stelzer, 2006. A
protein signal triggers sexual reproduction in Brachionus plicatilis (Rotifera). Marine
Biology 149: 763–773.
Suatoni, E., S. Vicario, S. Rice, T. Snell & A. Caccone, 2006. An analysis of species boundaries
and biogeographic patterns in a cryptic species complex: the rotifer—Brachionus plicatilis.
Molecular Phylogenetics and Evolution 41: 86–98.

14
Wang, Y., L. Y. Geer, C. Chappey, J. A. Kans & S. H. Bryant, 2000. Cn3D: sequence and
structure views for Entrez. Trends in Biochemical Sciences 25: 300–302.
Yang, Z., 2007. PAML 4: Phylogenetic analysis by maximum likelihood. Molecular Biology and
Evolution 24: 1586–1591.
Yang, Z. & R. Nielsen, 2002. Codon-substitution models for detecting molecular adaptation at
individual sites along specific lineages. Molecular Biology and Evolution 19: 908–917.
Zhang, J., R. Nielsen & Z. Yang, 2005. Evaluation of an improved branch-site likelihood method
for detecting positive selection at the molecular level. Molecular Biology and Evolution 22:
2472–2479.
Zwickl, D. J., 2006. Genetic algorithm approaches for the phylogenetic analysis of large
biological sequence datasets under the maximum likelihood criterion. School of Biological
Sciences. The University of Texas at Austin, Austin, TX: 115.
Table 1. Values of dN, dS, and dN/dS for MAPR and cox1 tree branches, with labels as in Fig. 2.
dN dS dN/dS dN dS dN/dS dN/dN dS/dS
(a) 0.0000 0.0000 -- 0.0000 0.0276 0.0001 -- 0.00(b) 0.0000 0.1666 0.00 0.0000 0.0173 0.0001 -- 9.63(c) 0.0023 3.4325 0.0007 0.0024 0.0714 0.0332 0.96 48.07(d) 0.0002 2.4332 0.0001 0.0072 0.0307 0.2361 0.03 79.26(e) 0.0000 0.0000 -- 0.0024 0.0211 0.1154 0.00 0.00(f) 0.0023 1.9178 0.0012 0.0024 0.0905 0.0266 0.96 21.19(g) 0.0000 0.0000 -- 0.0027 0.0030 0.8853 0.00 0.00(h) 0.0005 5.4011 0.0001 0.0151 0.2354 0.0639 0.03 22.94(i) 0.0006 5.9428 0.0001 0.0455 1.2175 0.0374 0.01 4.88(j) 0.0002 2.3357 0.0001 0.0074 0.0576 0.1287 0.03 40.55(k) 0.0000 0.0145 0.0001 0.0000 0.0000 -- -- --(l) 0.0000 0.0000 -- 0.0000 0.0000 -- -- --(m) 0.0022 1.7975 0.0012 0.0046 0.0000 -- 0.48 --
BranchcoxI MAPR coxI : MAPR
15
Figure 1. (Top, 1a) MAPR transmembrane and heme/steroid binding regions; numbers are
amino acids. (Bottom, 1b) Phylogeny of MAPR proteins and paralogs; the tree is drawn with
branch lengths determined by Garli (scale bar shows changes per amino acid position); the same
topology was found with MrBayes and a very similar topology was found with RaxML (not
shown). Solid circles above and below nodes show that greater than 70% of bootstrap datasets
supported the node by Garli and greater than 95% of sampled trees after burn-in supported the
node with MrBayes (posterior probability), respectively.

16
Figure 2. Bayesian gene trees of cox1 and MAPR with branch lengths from codeml. Scale bars
are number of nucleotide changes per codon. Letters identify branches in Table 1; numbers are
Bayesian posterior probabilities (percentages). Accessions are given for cox1 sequences taken
from GenBank.
Figure 3. Modeled B. manjavacas MAPR from amino acid 61 to 162, with putative ligand-
binding cleft to the right. Image A: amino acid differences among rotifers. Image B: five residues
conserved among rotifers where the human analog is important to function; all but P156 match
human analogs.


![Membrane-bound mucins and mucin terminal glycans ... · associated with higher morbidity and mortality[1-7]. Mucins, heavily glycosylated high-molecular-weight glycoproteins, are](https://static.fdocuments.in/doc/165x107/5fcbfea3277df0670a5fee63/membrane-bound-mucins-and-mucin-terminal-glycans-associated-with-higher-morbidity.jpg)