Molecular dynamics study of interaction of dimyristoyl ... · PDF fileMolecular dynamics study...
21
J. Biosci., Vol. 21, Number 5, September 1996, pp 577–597. © Printed in India. Molecular dynamics study of interaction of dimyristoyl phosphotidyl choline with water V KOTHEKAR Department of Biophysics, All India Institute of Medical Sciences, New Delhi 110029, India MS received 2 January 1996; revised 30 April 1996 Abstract. We present here results of molecular dynamics (MD) simulations on hydrated bilayers of 40 molecules of 1-2-dimyristoyl-sn-glycero-3-phosphatidyl choline (DMPC) in liquid crystalline (Lα) phase using two different models (i) with same (A) conformation for all DMPC molecules, (ii) with alternate rows having different (A and B reported in crystallographic studies on DMPC) conformations. The bilayers were hydrated using 776 and 1064 water molecules. Simulations have been carried out at 310K with AMBER 4·0 program, using united atom force field for 200 pico seconds (ps) after equilibration. During heating and equilibration constant pressure temperature (PT) conditions were maintained while in simulation of equillibrated bilayers constant volume temperature (VT) conditions were used. Subaveraged atomic coordi- nates were used to calculate geometric parameters of lipid molecules and lipid water interaction. Our results show larger flexibility of polar head group and glycerol region in Lα phase compared to gel or non-hydrated bilayers. Chain disorder was more towards end. Sn-2 chains were more disordered. Use of two types of starting conformations increased disorder. Trans fraction of chain torsional angle was higher in non-hydrated bilayer. However it was more disordered due to ‘swing’ movement of chains because of distortion in torsional angles α2 and 03 due to absence of water molecules. Trans fraction of the chains, order parameter and water penetration showed general agreement with the available experimental results. On the whole MD technique was found to be quite useful for depicting microscopic behaviour of liquid crystalline system and correlating the same with macroscopic changes observed experimentally. Keywords. Molecular dynamics; simulation of DMPC; water interaction. 1. Introduction Phospholipids form an integral part of biological membranes. These molecules in aqueous environment and in changing conditions of temperature, pressure and ionic concentration undergo structural rearrangements known conventionally as ‘phase changes’. Biological membranes, by themselves are quite heterogeneous. Embedded in lipid matrix are number of proteins and receptor molecules which interact with various hormones and ligands. Latter control transport properties of the membranes and are important clinically. Until recently, our understanding of role of structural transitions in membrane lipids in regulating ligand-receptor interaction is incomplete. This was because, evaluation of membrane properties in physico-chemical terms, requires knowledge of dynamical structural changes in the membrane at atomic resolution. Latter was difficult using conventional structure determining techniques. Much of our current understanding is based on structural studies on isolated molecules (Hauser et al 1981) or using macroscopic methods as electron microscopy, low angle x-ray diffrac- tion, differential scanning calorimeter, etc. (Reiss Hudson 1967; Chapman and Wallach 1968; Levine and Wilkins 1971; Tardieu et al 1973; Buildt et al 1978; Janiak et al 1979; Lis et al 1982; Cevec and Marsh 1987). Lot of progress has been made during last one 577
-
Upload
hoangthien -
Category
Documents
-
view
216 -
download
2
Transcript of Molecular dynamics study of interaction of dimyristoyl ... · PDF fileMolecular dynamics study...
J. Biosci., Vol. 21, Number 5, September 1996, pp 577–597. © Printed in India. Molecular dynamics study of interaction of dimyristoylphosphotidyl choline with water
V KOTHEKAR Department of Biophysics, All India Institute of Medical Sciences, New Delhi 110029, India
MS received 2 January 1996; revised 30 April 1996
Abstract. We present here results of molecular dynamics (MD) simulations on hydrated bilayers of 40 molecules of 1-2-dimyristoyl-sn-glycero-3-phosphatidyl choline (DMPC) in liquid crystalline (Lα) phase using two different models (i) with same (A) conformation for all DMPC molecules, (ii) with alternate rows having different (A and B reported in crystallographic studies on DMPC) conformations. The bilayers were hydrated using 776 and 1064 water molecules. Simulations have been carried out at 310K with AMBER 4·0 program, using united atom force field for 200 pico seconds (ps) after equilibration. During heating and equilibration constant pressure temperature (PT) conditions were maintained while in simulation of equillibrated bilayers constant volume temperature (VT) conditions were used. Subaveraged atomic coordi-nates were used to calculate geometric parameters of lipid molecules and lipid water interaction. Our results show larger flexibility of polar head group and glycerol region in Lα phase compared to gel or non-hydrated bilayers. Chain disorder was more towards end. Sn-2 chains were more disordered. Use of two types of starting conformations increased disorder. Trans fraction of chain torsional angle was higher in non-hydrated bilayer. However it was more disordered due to ‘swing’ movement of chains because of distortion in torsional angles α2 and 03 due to absence of water molecules. Trans fraction of the chains, order parameter and water penetration showed general agreement with the available experimental results. On the whole MD technique was found to be quite useful for depicting microscopic behaviour of liquid crystalline system and correlating the same with macroscopic changes observed experimentally.
Keywords. Molecular dynamics; simulation of DMPC; water interaction.
1. Introduction Phospholipids form an integral part of biological membranes. These molecules in aqueous environment and in changing conditions of temperature, pressure and ionic concentration undergo structural rearrangements known conventionally as ‘phase changes’. Biological membranes, by themselves are quite heterogeneous. Embedded in lipid matrix are number of proteins and receptor molecules which interact with various hormones and ligands. Latter control transport properties of the membranes and are important clinically. Until recently, our understanding of role of structural transitions in membrane lipids in regulating ligand-receptor interaction is incomplete. This was because, evaluation of membrane properties in physico-chemical terms, requires knowledge of dynamical structural changes in the membrane at atomic resolution. Latter was difficult using conventional structure determining techniques. Much of our current understanding is based on structural studies on isolated molecules (Hauser et al 1981) or using macroscopic methods as electron microscopy, low angle x-ray diffrac- tion, differential scanning calorimeter, etc. (Reiss Hudson 1967; Chapman and Wallach 1968; Levine and Wilkins 1971; Tardieu et al 1973; Buildt et al 1978; Janiak et al 1979; Lis et al 1982; Cevec and Marsh 1987). Lot of progress has been made during last one
577
578 V Kothekar decade using X-ray diffraction studies on unilamelar vesicles (Hui and He 1983; Lewis and Engleman 1983) and deuterium magnetic resonance (De Young and Dill 1988).
Theoretical simulation of lipid-water system had been extremely helpful. Pioneering work had been done by Van der Ploeg and Berendsen (1982, 1983) on membrane models consisting of decanol-decanoid system. Later Egberts (1988) and Egberts and Berendsen (1988) studied sodium-decanoate/decanol/water system. The authors also simulated bilayer of 64 dipalmitoyl phosphatidyl choline (DPPC) molecules with 736 water molecules in simple point charge (SPC) model. To avoid large computational time they used non-bonded cut off distance (7·5 Å) and 0·002 ps time step for simulation. The authors treated long range electrostatic interaction separately.
During the last one decade variety of different simulation strategies were employed. Brownian and mean field stochastic dynamics was used by Pastor et al (1988, 1991) and De Loof et al (1991). Monte Carlo simulations were reported by Scott and Kalaskar (1989), Scott (1991), and Sperotto and Mouritsen (1991). Simulation on micells were reported by Jonsson et al (1986) and Wendoloski et al (1989). Several detailed and realistic simulations have been reported in the last couple of years. Heller et al (1993) used a very large lipid water system and stochastic boundary conditions. Hydrated monolayer was studied by Alper et al (1993) and Charifson et al (1990). Membrane water interface was studied by Berkowitz and Raghavan (1991), Raghavan et al (1992) and oil surface solutions by Karaborni et al (1993). Damodaran et al (1992), Damodaran and Merz (1993, 1994) studied dilaurayl phosphatidyl ethenolamine (DLPE) and DMPC. Huang et al (1994) studied hydrated DLPE, diodeylphos-phatidylethenohmine (DOPE) and dioleylphosphatidyl choline (DOPC). Hydrated DMPC bilayers were also studied by Essex et al (1994). Robinson et al (1994) tried to evaluate effect of conformation of polar head group.
There are several studies on interaction of ligand with hydrated bilayers. Thus for example interaction of Benzene with DMPC bilayer was studied by Bassolino et al (1993); local anesthetic trichloroethylene (TCE) with DOPC bilayer is studied by Huang et al (1995); a peptide fragment from corticotropin releasing factor (CRF) with DOPC by Huang and Loew (1995); fusion inhibitory peptide fragment (FIC) with (N-Me-DOPE) by Damodaran and Merz (1995); Cholesterol with DMPC bilayer by Robinson et al (1995); gramicidin channel with DMPC bilayer by Woolf and Roux (1994) and analogue of nifedipine with DMPC bilayer by Alper and Stouch (1995).
Initial model in each of the above case was obtained using different criterion and procedures. Simulation protocols and strategies used by different workers were also substantially different. Number of different conformational and packing parameters were studied by them.
The long term objective of our work is to understand drug induced microscopic structural changes in the hydrated membranes responsible for their macroscopic behaviour. Setting a proper protocol for simulation to reproduce experimentally measurable parameters of phospholipid-water interaction is a prerequisite for simula- ing drug-membrane assemblies. The objective of the present paper is to study dynamic structural changes in dry and hydrated phospholipids so as to: (i) standardize protocols for simulation, (ii) obtain results which agree with experimental data, and (iii) compare our results with those obtained by other workers using similar or different protocols. This we feel is necessary, since modeling lipid assemblies is still an emerging field.
We have chosen phospholipids DMPC for this purpose because: (i) transition temperature for gel to liquid crystalline phase is 24°C and at physiological temperature
Molecular dynamics study of interaction 579 it is in liquid crystalline (Lα) phase; (ii) we have already studied dynamic structural changes in DMPC micells in the presence of drugs nifedipine, verapamil and prostag-landins (Kaul and Kothekar 1988) and (iii) we have also done preliminary simulations on interaction of nifedipine with DMPC membrane (Kothekar and Gupta 1994). We report here many conventional parameters as order parameter, trans fraction (number of torsional angles within 180 ± 30°) in glycerol, polar head and acyl chain torsional angles and pair correlation function. We have also studied some new parameters as number of water molecules with their O and H atoms within 3·5 and 1·8 Å from oppositely charged atoms in DMPC, H-bonding pattern between lipid and water molecules, water penetration profiles, chain lengths and angles between polar head group and fatty acid chains, etc., in order to understand microscopic nature of lipid- water interaction. The studies have been carried out using two different models.
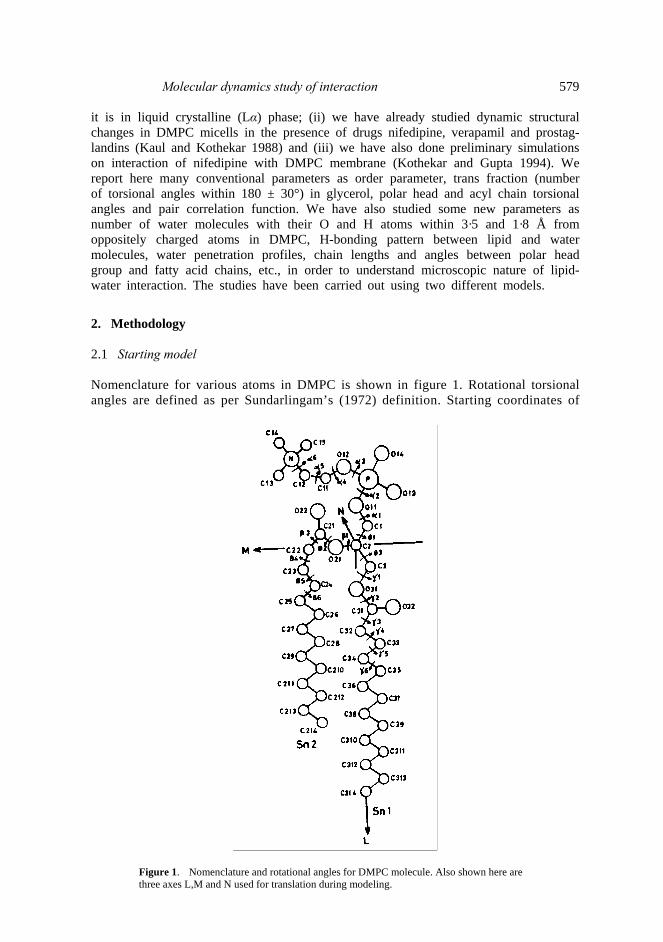
2. Methodology 2.1 Starting model Nomenclature for various atoms in DMPC is shown in figure 1. Rotational torsional angles are defined as per Sundarlingam’s (1972) definition. Starting coordinates of
Figure 1. Nomenclature and rotational angles for DMPC molecule. Also shown here are three axes L,M and N used for translation during modeling.

580 V Kothekar DMPC molecule were taken from X-ray crystallographic data by Pearson and Pascher(1979). The authors have proposed two different conformations A and B.Conformer A had angle θ1 in g+ and θ3 in t (note: we use conventional notation g+, t and g– to designate torsional angles 60 ± 30°, 180 ± 30° and – 60 ± 30°). Conformer B had θ1 as well as θ3 in trans conformation. The head group conformation is dictated by five torsional angles α1–α5. The two conformers had these angles in t, g+, g+, t, g– or t, g–, g–, tg+. Two starting models were built. Model-I has only conformer A, while model-II was built using A and B conformers in alternate rows. This was done to see the effect of head group conformation on simulation. Initial model was built using our model building program IMF (Mrigank et al 1986). We fixed three mutually perpendicular axes. Axis L or long axis passes through C2 and along the Sn1 chain. Axis M is perpendicular to L and passes through C2. It is in the plane of Sn1 and Sn2 chains, Axis N passes through C2 and is perpendicular to both L and M. The first DMPC molecule is oriented with L along X axis, M along Y axis and N along Z axis. The next molecular is added by overlapping it on the existing DMPC molecule (molecule 1) and translating it along M or N and rotating along its long axis (L). The polar head group was considered to be rigid. Its position is optimized by energy minimization following grid search method by our program IMF (Mrigank et al 1986). This program uses force field parameters from Weiner et al (1984). The same procedure is repeated for subsequent molecules adding one molecule each time, to make a monolayer with 4 × 5 = 20DMPC molecules. The second layer is created by inverting the first layer and translating the same in X, Y, and Z directions so as to have lowest energy for the bilayer. Compact structures with dimensions 40·6 × 40·1 × 34·6 and 39 × 39·4 × 34 Å3 were obtained. Surface area per lipid molecule was respectively equal to 68·2 and 67 Å2 in these two models. It was close to the value obtained by deuterium magnetic resonance by De Young and Dill (1988). The phosphorous-phosphorous separation across the bilayer was 35·6 and 34 Å. It was little larger in the first model than the 34 Å observed by Lewis and Engleman (1983) for Lα phase. Water molecules in TIP3P model of Jorgensen et al (1983) were added as a 10 Å thick layer on both sides of the bilayer using BOX option and modified version of EDIT module of AMBER 4·0 created by us for the purpose. A solute-solvent cut off distances for oxygen and hydrogen atoms of water were 3·5 and 1·8Å respectively. This gave total 776 and 1064 water molecules in two models. There were 20·6 and 26·6 molecules of water per lipid molecule which gave 34 and 41 % water by weight and well above the liquid crystalline transition limit. With the incorporation of water the BOX parameters were 60·6 × 40·1 × 34·6 and 59 × 39·4 × 34 Å3. This configuration was ideal for Lα phase (Janiak et al 1979). 2.2 Potential parameters Through out the simulation we used non-bonded parameters interpolated from the data on DPPC bilayer by Egberts and Berendsen (1988) (see appendix). These were incorporated in the parm 94.dat file. The charges on various atoms were obtained by CNDO/II method (Pople et al 1965). Charges of hydrogen atoms attached to carbon were merged with those of respective carbons in keeping with the united atom force field used throughout the present calculations. These charges are given in table 1. The main difference between these charges and those used by other workers (Egberts 1988; Damodaran and Merz 1994; Essex et al 1994) was in the phosphate group. Since we

Molecular dynamics study of interaction 581
Table 1. Fractional charges on DMPC molecule.
used explicit solvent for our calculations a constant dielectric constant equal to 1 was used. The non-bonded and electrostatic interactions were scaled by factor of 8 and 2. In order to avoid large computation times associated with calculation of nonbonded interactions of such a large system a residue based non-bonded pair list with a cut off of 12·5 Å was used. This, as suggested by Bassolino et al (1993) amounts to much larger atom based cut off. Updating pairlists is equally computer time consuming. The pair lists were updated after every 20 cycles. (Note: Conventionally much smaller cut off distances 7–10 Å are used and updating is done after 100 cycles). This protocol is close to incorporation of full nonbonded interaction calculations. Use of longer cut off distance avoids artifacts due to abrupt termination of electrostatic interaction. One also need not use complicated switching functions for electrostatic interaction. With 4168 and 5034 atoms in models I and II this led to 2·1 and 2·7 h of CPU time per 1000 cycles of simulation on INDIGO/II R 4400 dedicated work station which was used throughout this study. 2.3 Energy minimization Both energy minimization and dynamics simulations were done using MINMD module of AMBER 4·0 (Pearlman et al 1991). First 100 cycles of minimization were done using steepest descent method with step length 0·001. This was followed by conjugate gradient energy minimization. The structure minimized in 907 and 880 cycles respectively giving Emin – 5491 and – 5434 Kcal/mol. 2.4 Molecular dynamic simulation Molecular dynamic (MD) simulation hydrated DMPC was divided in three parts. (i) Heating cycles: Initial temperature 10 K was set by allowing Maxwellian distribu- tion of velocities. The system was weakly coupled to a temperature bath which was kept

582 V Kothekar at 20° higher temperature than that of computational cell. The system was equillibrated for 2 ps in time step of 0·001 ps. Thus the system temperature was raised by 20° in 2 ps time. System reached 310° on 30 ps. Simulation was done under PT condition. Coordinate data was collected after 1000 steps (1 ps). During heating cycles system parameter was close to gel or Lβ phase. (ii) Eguillibration: Both the models were equilibrated for 150 ps under PT conditions. Simulation protocol was same as earlier. (iii) Simulation of equillibrated bilayer: Equillibrated bilayers were simulated for 200 ps in 0·001 ps time interval under VT condition. This was done to avoid reduction in density due to any volume expansion. Solute and solvent were imaged together. They were separately coupled to temperature baths with the time constant 0·4 ps. This gave a weaker coupling to the temperature bath but more realistic trajectories. Coordinate data was collected after 100 cycles (0·1 ps) and subaveraged for 1 ps. A snap shop for the two models during MD simulation is shown in figure 2a, b. The graphics is by using RASMOL (Sayle 1994).
2.5 Simulation of non-hydrated bilayer We also simulated DMPC matrix without any water using model-I. This was done for the sake of comparison of geometric parameters in Lα and non-hydrated phase. Heating was carried out by coupling the system to a temperature bath at temperature 30° higher than that of computational cell. System was equilibrated for 100 ps. Coordinate data was collected for 50 ps after equillibration in 0·2 ps interval and subaveraged for 1 ps. The system parameters at low temperature could be compared to gel phase. MD simulations were done at VT conditions.
Here we mainly compare geometric parameters of DMPC in equillibrated models. We have given few comparisons with geometric parameters during ‘heating’, and of non-hydrated bilayers. Lipid-water parameters are discussed during ‘heating’ equillib- rated and non-hydrated bilayer for model-I.
The analysis was done by a special program package ANALMB developed by us for the purpose.
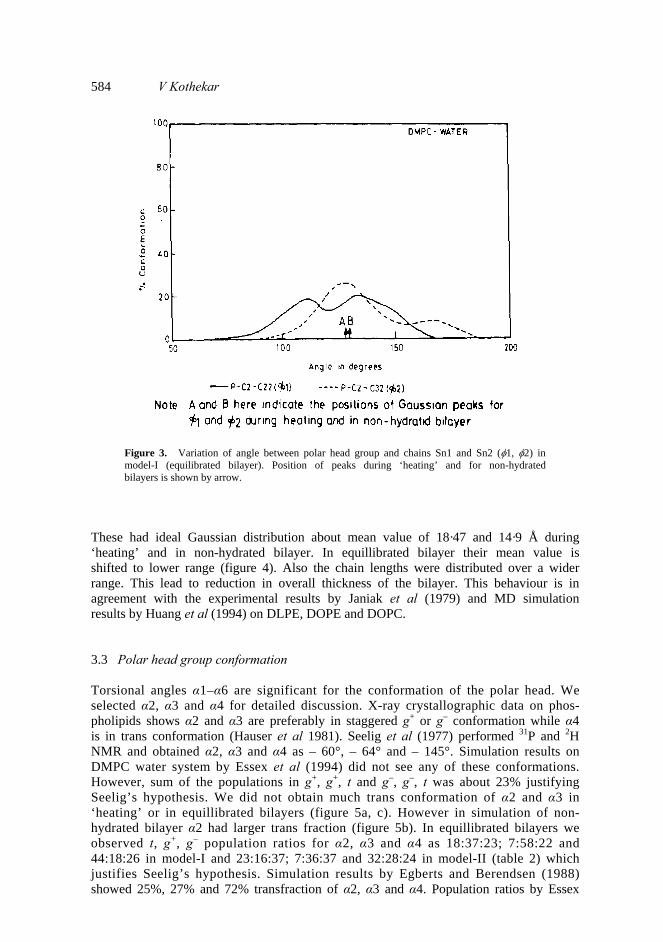
3. Results and discussion 3.1 Chain orientation For model-I we monitored two angles P-C2-C22 (φ1) and P-C2-C32 (φ2) which signify orientation of acyl chains with respect to polar head group. These two angles show Gaussian distribution about mean value of 128º and 130º during heating and in non-hydrated bilayer but had larger variation in equillibrated bilayer in Lα phase (figure 3). This result is indicative of larger flexibility of chains with respect to polar head group in Lα phase and increase in head group surface area.
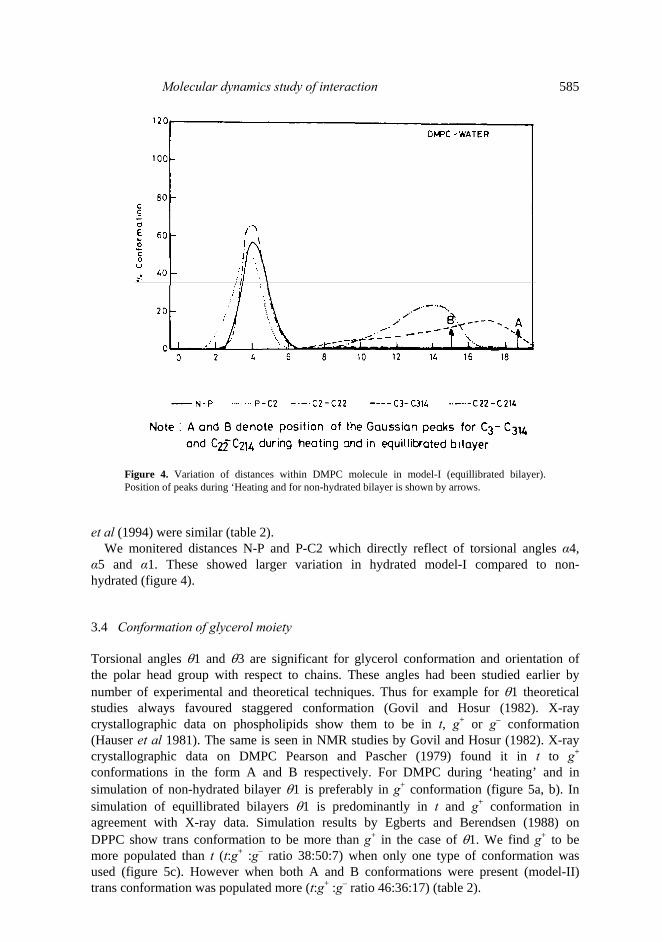
3.2 Chain lengths Lengths of the two chains Sn1 and Sn2 directly affect the bilayer thickness. We monitored distance C3-C314 and C22-C214 indicative of the chain length fluctuation.

Molecular dynamics study of interaction 583
Figure 2. (a) A snapshot during MD simulation of model-I at 40 ps. (b) A snap shot of energy minimized model-II showing two different types of lipid conformation. Water molecules are not shown for the sake of clarity.
584 V Kothekar
Figure 3. Variation of angle between polar head group and chains Sn1 and Sn2 (φ1, φ2) in model-I (equilibrated bilayer). Position of peaks during ‘heating’ and for non-hydrated bilayers is shown by arrow.
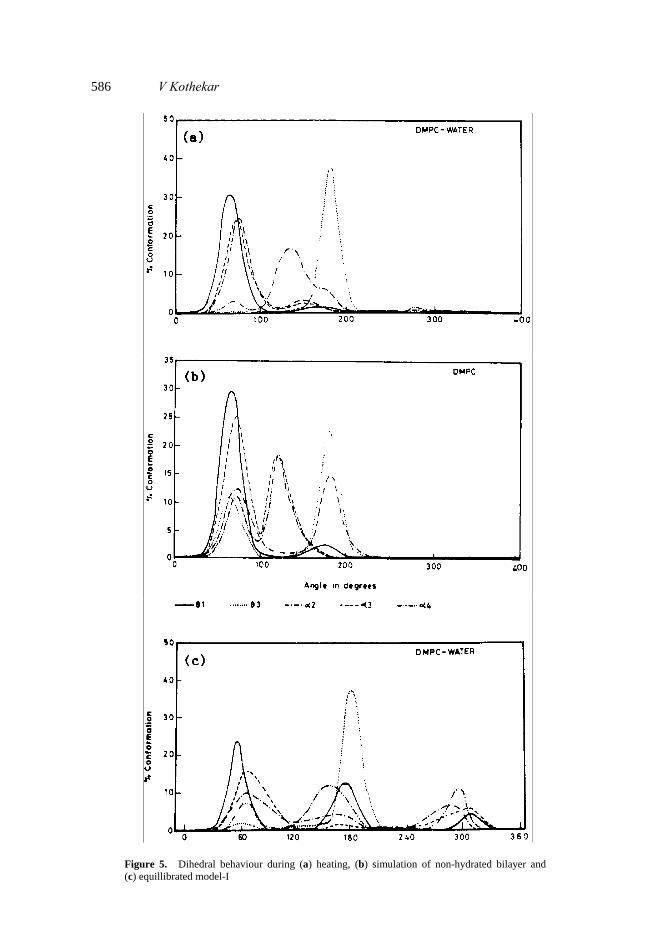
These had ideal Gaussian distribution about mean value of 18·47 and 14·9 Å during ‘heating’ and in non-hydrated bilayer. In equillibrated bilayer their mean value is shifted to lower range (figure 4). Also the chain lengths were distributed over a wider range. This lead to reduction in overall thickness of the bilayer. This behaviour is in agreement with the experimental results by Janiak et al (1979) and MD simulation results by Huang et al (1994) on DLPE, DOPE and DOPC. 3.3 Polar head group conformation Torsional angles α1–α6 are significant for the conformation of the polar head. We selected α2, α3 and α4 for detailed discussion. X-ray crystallographic data on phos- pholipids shows α2 and α3 are preferably in staggered g+ or g– conformation while α4 is in trans conformation (Hauser et al 1981). Seelig et al (1977) performed 31P and 2H NMR and obtained α2, α3 and α4 as – 60°, – 64° and – 145°. Simulation results on DMPC water system by Essex et al (1994) did not see any of these conformations. However, sum of the populations in g+, g+, t and g–, g–, t was about 23% justifying Seelig’s hypothesis. We did not obtain much trans conformation of α2 and α3 in ‘heating’ or in equillibrated bilayers (figure 5a, c). However in simulation of non- hydrated bilayer α2 had larger trans fraction (figure 5b). In equillibrated bilayers we observed t, g+, g– population ratios for α2, α3 and α4 as 18:37:23; 7:58:22 and 44:18:26 in model-I and 23:16:37; 7:36:37 and 32:28:24 in model-II (table 2) which justifies Seelig’s hypothesis. Simulation results by Egberts and Berendsen (1988) showed 25%, 27% and 72% transfraction of α2, α3 and α4. Population ratios by Essex
Molecular dynamics study of interaction 585
Figure 4. Variation of distances within DMPC molecule in model-I (equillibrated bilayer). Position of peaks during ‘Heating and for non-hydrated bilayer is shown by arrows.
et al (1994) were similar (table 2).
We monitered distances N-P and P-C2 which directly reflect of torsional angles α4, α5 and α1. These showed larger variation in hydrated model-I compared to non- hydrated (figure 4). 3.4 Conformation of glycerol moiety Torsional angles θ1 and θ3 are significant for glycerol conformation and orientation of the polar head group with respect to chains. These angles had been studied earlier by number of experimental and theoretical techniques. Thus for example for θ1 theoretical studies always favoured staggered conformation (Govil and Hosur (1982). X-ray crystallographic data on phospholipids show them to be in t, g+ or g– conformation (Hauser et al 1981). The same is seen in NMR studies by Govil and Hosur (1982). X-ray crystallographic data on DMPC Pearson and Pascher (1979) found it in t to g+ conformations in the form A and B respectively. For DMPC during ‘heating’ and in simulation of non-hydrated bilayer θ1 is preferably in g+ conformation (figure 5a, b). In simulation of equillibrated bilayers θ1 is predominantly in t and g+ conformation in agreement with X-ray data. Simulation results by Egberts and Berendsen (1988) on DPPC show trans conformation to be more than g+ in the case of θ1. We find g+ to be more populated than t (t:g+ :g– ratio 38:50:7) when only one type of conformation was used (figure 5c). However when both A and B conformations were present (model-II) trans conformation was populated more (t:g+ :g– ratio 46:36:17) (table 2).
586 V Kothekar
Figure 5. Dihedral behaviour during (a) heating, (b) simulation of non-hydrated bilayer and (c) equillibrated model-I

Molecular dynamics study of interaction 587
Table 2A. Comparison of torsional angle distribution in α2, α3 and α4.
Table 2B. Comparison of distribution of torsional angles θ1 and θ3.
Note: In column 1 NMR1 refers to NMR data from book Conformation of Biological molecules by Govil and Hosur (1982); NMR2, NMR data by Seelig and Seelig (1974), Lipid Ave., X-ray data from Hauser et al (1981), DMPC, Crystallographic data by Pearson and Pascher (1979), MD1 results by Egbert and Berendsen (1988) on DPPC; MD2 and MD3 Essex et al (1994) results on MD simulation during equillibra- tion and production runs respectively; MD4 and MD5 results of MD simula- tion in the present paper during ‘heating’ and in non-hydrated model-I, MD6 and MD7 results on MD simulation of equillibrated models-I and II.
All the data on θ3 shows it to be preferably in trans conformation. Essex et al (1994) find 94% trans fraction during ‘equilibration’ which reduces to 86% during their ‘production simulation’ (table 2). We obtained 92% trans fraction during ‘heating’ which reduces to 78% in equillibrated bilayer simulation of model-I. However, in simulation of non-hydrated bilayer there was more flexibility in the angle θ3 and reduction in trans fraction to 58%. Flexibility of θ3 in non-hydrated DMPC had been noted by us earlier (Kothekar and Gupta 1994). This we believed lead to ‘swinging motion’ of the lipid chains.
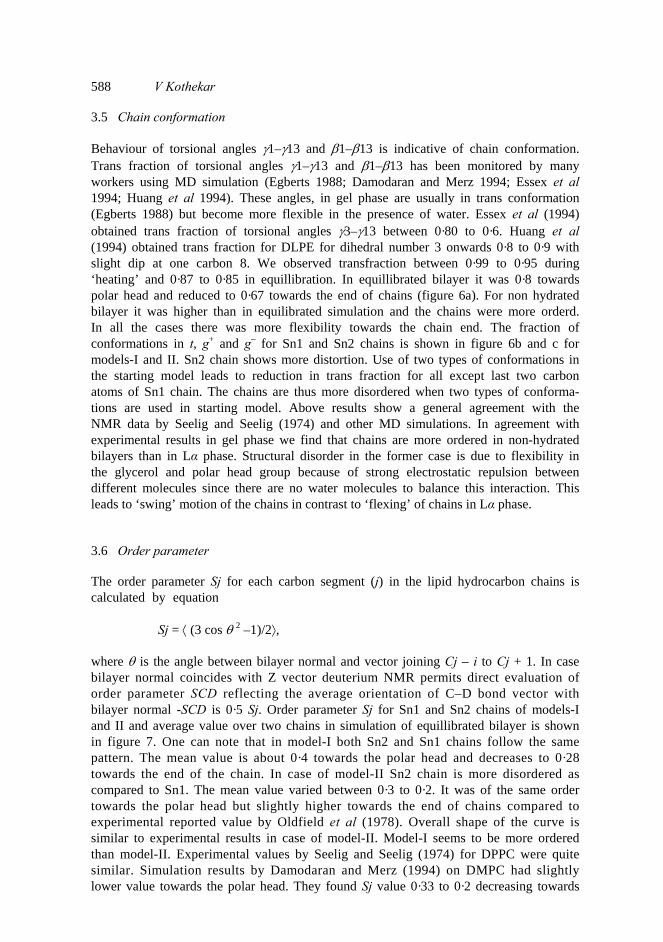
588 V Kothekar 3.5 Chain conformation Behaviour of torsional angles γ1–γ13 and β1–β13 is indicative of chain conformation. Trans fraction of torsional angles γ1–γ13 and β1–β13 has been monitored by many workers using MD simulation (Egberts 1988; Damodaran and Merz 1994; Essex et al 1994; Huang et al 1994). These angles, in gel phase are usually in trans conformation (Egberts 1988) but become more flexible in the presence of water. Essex et al (1994) obtained trans fraction of torsional angles γ3–γ13 between 0·80 to 0·6. Huang et al (1994) obtained trans fraction for DLPE for dihedral number 3 onwards 0·8 to 0·9 with slight dip at one carbon 8. We observed transfraction between 0·99 to 0·95 during ‘heating’ and 0·87 to 0·85 in equillibration. In equillibrated bilayer it was 0·8 towards polar head and reduced to 0·67 towards the end of chains (figure 6a). For non hydrated bilayer it was higher than in equilibrated simulation and the chains were more orderd. In all the cases there was more flexibility towards the chain end. The fraction of conformations in t, g+ and g– for Sn1 and Sn2 chains is shown in figure 6b and c for models-I and II. Sn2 chain shows more distortion. Use of two types of conformations in the starting model leads to reduction in trans fraction for all except last two carbon atoms of Sn1 chain. The chains are thus more disordered when two types of conforma- tions are used in starting model. Above results show a general agreement with the NMR data by Seelig and Seelig (1974) and other MD simulations. In agreement with experimental results in gel phase we find that chains are more ordered in non-hydrated bilayers than in Lα phase. Structural disorder in the former case is due to flexibility in the glycerol and polar head group because of strong electrostatic repulsion between different molecules since there are no water molecules to balance this interaction. This leads to ‘swing’ motion of the chains in contrast to ‘flexing’ of chains in Lα phase. 3.6 Order parameter The order parameter Sj for each carbon segment (j) in the lipid hydrocarbon chains is calculated by equation
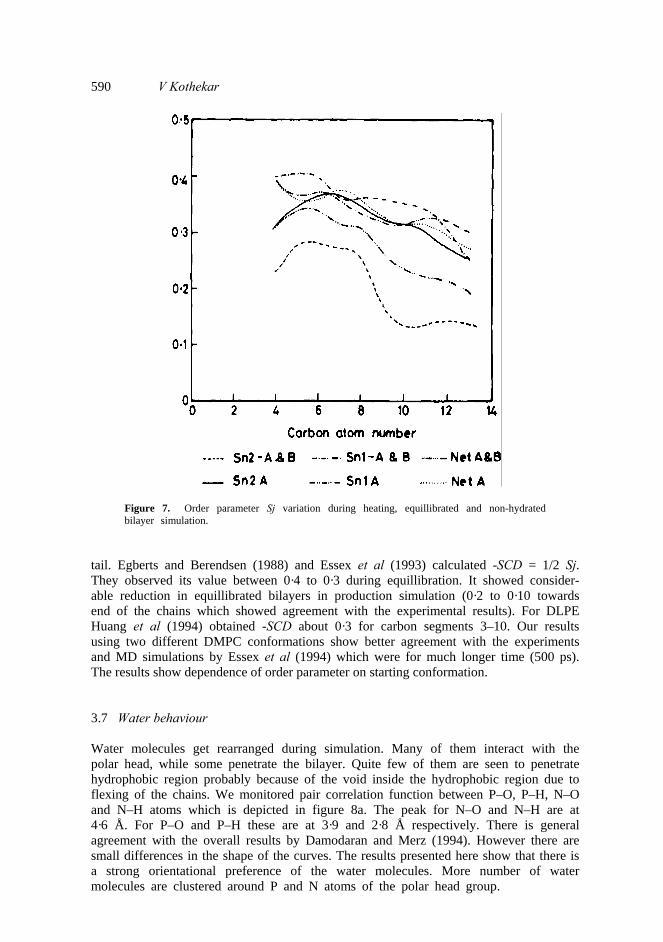
Sj = ⟨ (3 cos θ 2 –1)/2⟩, where θ is the angle between bilayer normal and vector joining Cj – i to Cj + 1. In case bilayer normal coincides with Z vector deuterium NMR permits direct evaluation of order parameter SCD reflecting the average orientation of C–D bond vector with bilayer normal -SCD is 0·5 Sj. Order parameter Sj for Sn1 and Sn2 chains of models-I and II and average value over two chains in simulation of equillibrated bilayer is shown in figure 7. One can note that in model-I both Sn2 and Sn1 chains follow the same pattern. The mean value is about 0·4 towards the polar head and decreases to 0·28 towards the end of the chain. In case of model-II Sn2 chain is more disordered as compared to Sn1. The mean value varied between 0·3 to 0·2. It was of the same order towards the polar head but slightly higher towards the end of chains compared to experimental reported value by Oldfield et al (1978). Overall shape of the curve is similar to experimental results in case of model-II. Model-I seems to be more ordered than model-II. Experimental values by Seelig and Seelig (1974) for DPPC were quite similar. Simulation results by Damodaran and Merz (1994) on DMPC had slightly lower value towards the polar head. They found Sj value 0·33 to 0·2 decreasing towards

Molecular dynamics study of interaction 589
Figure 6. (a) Mean variation in transfraction during heating, equillibration, simulation of equillibrated and non-hydrated bilayer in model-I. (b) Conformational behaviour of chains Sn2 and Sn1 of hydrated DMPC in model-I (equillibrated). (c) Conformational behaviour of chains Sn2 and Snip of hydrated DM PC in model-II (equillibrated).
590 V Kothekar
Figure 7. Order parameter Sj variation during heating, equillibrated and non-hydrated bilayer simulation.
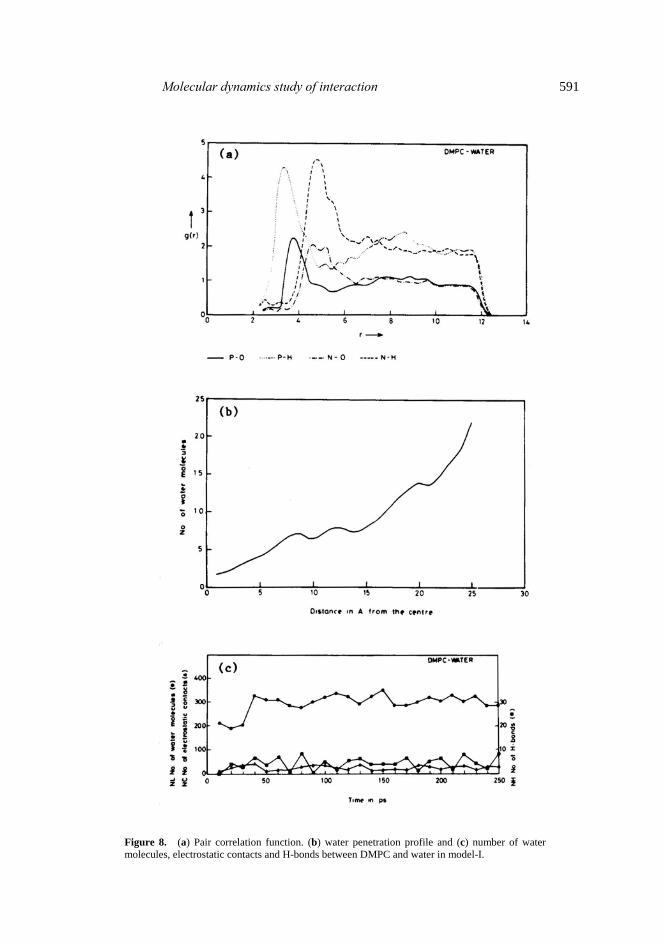
tail. Egberts and Berendsen (1988) and Essex et al (1993) calculated -SCD = 1/2 Sj. They observed its value between 0·4 to 0·3 during equillibration. It showed consider- able reduction in equillibrated bilayers in production simulation (0·2 to 0·10 towards end of the chains which showed agreement with the experimental results). For DLPE Huang et al (1994) obtained -SCD about 0·3 for carbon segments 3–10. Our results using two different DMPC conformations show better agreement with the experiments and MD simulations by Essex et al (1994) which were for much longer time (500 ps). The results show dependence of order parameter on starting conformation. 3.7 Water behaviour Water molecules get rearranged during simulation. Many of them interact with the polar head, while some penetrate the bilayer. Quite few of them are seen to penetrate hydrophobic region probably because of the void inside the hydrophobic region due to flexing of the chains. We monitored pair correlation function between P–O, P–H, N–O and N–H atoms which is depicted in figure 8a. The peak for N–O and N–H are at 4·6 Å. For P–O and P–H these are at 3·9 and 2·8 Å respectively. There is general agreement with the overall results by Damodaran and Merz (1994). However there are small differences in the shape of the curves. The results presented here show that there is a strong orientational preference of the water molecules. More number of water molecules are clustered around P and N atoms of the polar head group.
Molecular dynamics study of interaction 591
Figure 8. (a) Pair correlation function. (b) water penetration profile and (c) number of water molecules, electrostatic contacts and H-bonds between DMPC and water in model-I.
592 V Kothekar
Figure 8b shows a typical water penetration profile. The number of water molecules from the center of the bilayer towards the polar head in the slab of 1 Å thick are plotted. The results clearly show that more number of water molecules accumulate towards the polar head. Definite number penetrates hydrophobic region. Same was noted early for sodium-decanoate/decanol/water system by Egberts and Berendsen (1988). The water distribution can be compared with distribution in micelle simulation by Jonsson et al (1986).
From thermodynamic point of view, maximum absorption of water occurs when the chemical potential of the water molecules located interstitially between bilayer is that of bulk water (Janiak et al 1979). This happens at about 25 molecules of water in DML. We monitored: NL, Number of water molecules within bilayer; NC, number of water molecules having strong electrostatic interaction with DMPC molecule (O and H atoms of water within 3·5 and 1·8 Å from the oppositely charged atoms in DMPC), and NH, number of H–bonds between lipid and water. Variation in NL, NC and NH is shown in figure 8c. There are on an average 292 water molecules within the bilayer which gives about 12·2 water molecules per DMPC molecule strongly interacting with it. Out of these at least 10 water molecules (80%) interact with the polar head group. This number shows agreement with observed 11 structured or bound waters by DSC, hydrodynamic measurement, water vapour absorption and nuclear magnetic resonance techniques (Hauser et al 1975). We find roughly 26 water molecules having strong electrostatic interaction with DMPC, while 4–8 water molecules having good hydro- gen bonds with DMPC molecules. 4. Conclusion The main results of the above simulations can be summarized as follows. (i) In the model-I involving only one type of conformation in the starting model angle P-C2-C22 (φ1) and P-C2-C32 (φ2) had larger flexibility in hydrate form (equillibrated simulation) compared to non-hydrated. Similarly lengths of chains Sn1 and Sn2 as judged from the distances C3-C314 and C22-C214 are reduced in hydrated bilayers compared to non-hydrated or gel phase. (ii) As regards to torsional angles in the polar head group α2 and α3 were mostly in g+
and g– confl;ormation in hydrated form, while in non hydrated bilayer they had largertrans conformations. Distances N–P and P–C2 which reflect behaviour of angles α4, α5and α1 were of the same order in non-hydrated samples as in ‘heating’ phase. In the glycerol region angle θ1 had higher trans fraction in equillibrated bilayer especially involving two different starting conformations (model-II). Angle θ3 showed larger variation in non-hydrated bilayers. On the whole equillibrated bilayers had higher distorsion in the polar head group and glycerol region which increased with the incorporation of two types of conformations. The non-hydrated bilayers showed large distorsion in only two angles α2 and θ3. (iii) We observed reduction in the trans fraction of the chain torsional angles β3 – β13 and γ3 – γ13 in equilibrated bilayers compared to those during ‘heating’. However in non-hydrated bilayers transfraction was higher. (iv) Order parameter calculations and water penetration showed agreement with NMR results. The Sn2 chains were more disordered. Disroder increased towards the end of chains. It also increased when two different starting conformations are used. (v) The pair correlation function showed organization of water molecules around the polar head.

Molecular dynamics study of interaction 593
Present calculations show that temperature, hydration state and starting conformationof individual lipid molecule influence distribution of torsional angles and order parameter.
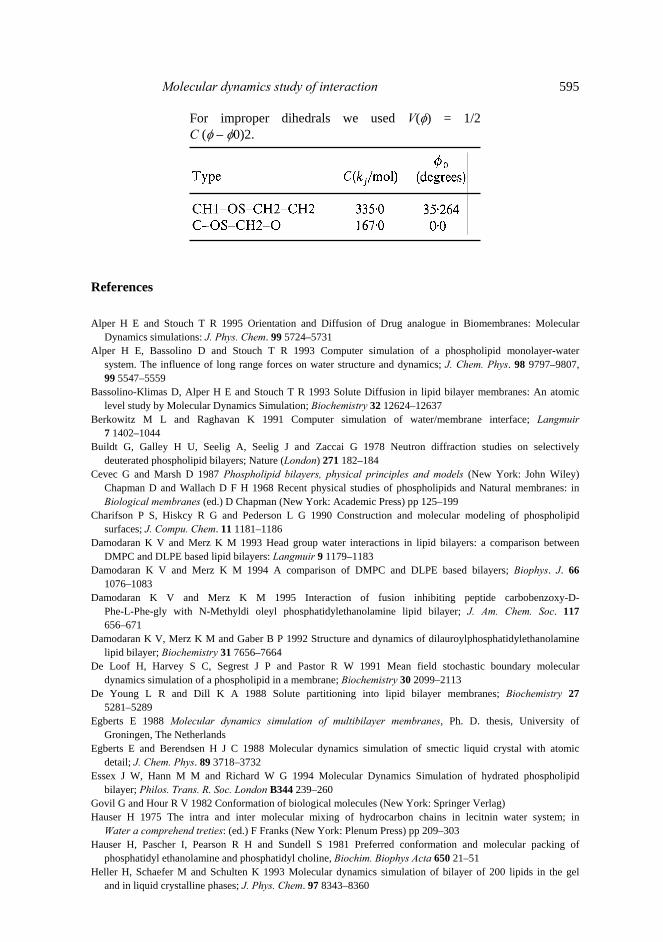
On the whole MD technique is found to be quite useful for depicting microscopic behaviour of liquid Crystalline system and correlating the same with macroscopic changes observed experimentally. Acknowledgment The author is thankful to the Department of Science and Technology, New Delhi, for financial support for the purchase of INDIGO/II graphics work station. Appendix MD parameters by Berendsen (Egberts and Berendsen 1988). Note: Atom types: NL nitrogen, OS Esster oxygen, OM Phosphate oxygen, O Carbonyl oxygen, CH1, CH2, CH3 are carbon atoms as defined in AMBER force field. Table 1. Lennard-Jones contributions are calculated as: V(rij) = 4ε i j[(σ i j)12 – (σ i j/rij)6], where εij (upper value kJ/mol) and σij (lower value in nm) are:
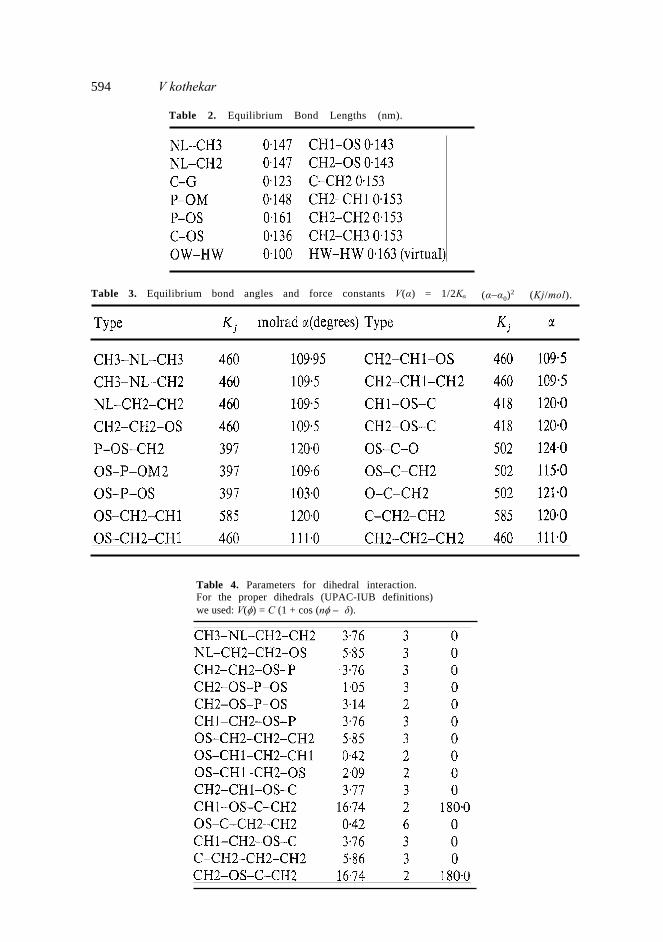
594 V kothekar
Table 2. Equilibrium Bond Lengths (nm).
Table 3. Equilibrium bond angles and force constants V(α) = 1/2Kα (α–α0)2 (Kj/mol).
Table 4. Parameters for dihedral interaction.For the proper dihedrals (UPAC-IUB definitions)we used: V(φ) = C (1 + cos (nφ – δ).
Molecular dynamics study of interaction 595
For improper dihedrals we used V(φ) = 1/2C (φ – φ0)2.
References Alper H E and Stouch T R 1995 Orientation and Diffusion of Drug analogue in Biomembranes: Molecular
Dynamics simulations: J. Phys. Chem. 99 5724–5731 Alper H E, Bassolino D and Stouch T R 1993 Computer simulation of a phospholipid monolayer-water
system. The influence of long range forces on water structure and dynamics; J. Chem. Phys. 98 9797–9807, 99 5547–5559
Bassolino-Klimas D, Alper H E and Stouch T R 1993 Solute Diffusion in lipid bilayer membranes: An atomic level study by Molecular Dynamics Simulation; Biochemistry 32 12624–12637
Berkowitz M L and Raghavan K 1991 Computer simulation of water/membrane interface; Langmuir 7 1402–1044
Buildt G, Galley H U, Seelig A, Seelig J and Zaccai G 1978 Neutron diffraction studies on selectively deuterated phospholipid bilayers; Nature (London) 271 182–184
Cevec G and Marsh D 1987 Phospholipid bilayers, physical principles and models (New York: John Wiley) Chapman D and Wallach D F H 1968 Recent physical studies of phospholipids and Natural membranes: in Biological membranes (ed.) D Chapman (New York: Academic Press) pp 125–199
Charifson P S, Hiskcy R G and Pederson L G 1990 Construction and molecular modeling of phospholipid surfaces; J. Compu. Chem. 11 1181–1186
Damodaran K V and Merz K M 1993 Head group water interactions in lipid bilayers: a comparison between DMPC and DLPE based lipid bilayers: Langmuir 9 1179–1183
Damodaran K V and Merz K M 1994 A comparison of DMPC and DLPE based bilayers; Biophys. J. 66 1076–1083
Damodaran K V and Merz K M 1995 Interaction of fusion inhibiting peptide carbobenzoxy-D- Phe-L-Phe-gly with N-Methyldi oleyl phosphatidylethanolamine lipid bilayer; J. Am. Chem. Soc. 117 656–671
Damodaran K V, Merz K M and Gaber B P 1992 Structure and dynamics of dilauroylphosphatidylethanolamine lipid bilayer; Biochemistry 31 7656–7664
De Loof H, Harvey S C, Segrest J P and Pastor R W 1991 Mean field stochastic boundary molecular dynamics simulation of a phospholipid in a membrane; Biochemistry 30 2099–2113
De Young L R and Dill K A 1988 Solute partitioning into lipid bilayer membranes; Biochemistry 27 5281–5289
Egberts E 1988 Molecular dynamics simulation of multibilayer membranes, Ph. D. thesis, University of Groningen, The Netherlands
Egberts E and Berendsen H J C 1988 Molecular dynamics simulation of smectic liquid crystal with atomic detail; J. Chem. Phys. 89 3718–3732
Essex J W, Hann M M and Richard W G 1994 Molecular Dynamics Simulation of hydrated phospholipid bilayer; Philos. Trans. R. Soc. London B344 239–260
Govil G and Hour R V 1982 Conformation of biological molecules (New York: Springer Verlag) Hauser H 1975 The intra and inter molecular mixing of hydrocarbon chains in lecitnin water system; in
Water a comprehend treties: (ed.) F Franks (New York: Plenum Press) pp 209–303 Hauser H, Pascher I, Pearson R H and Sundell S 1981 Preferred conformation and molecular packing of
phosphatidyl ethanolamine and phosphatidyl choline, Biochim. Biophys Acta 650 21–51 Heller H, Schaefer M and Schulten K 1993 Molecular dynamics simulation of bilayer of 200 lipids in the gel
and in liquid crystalline phases; J. Phys. Chem. 97 8343–8360

596 V Kothekar Huang P and Loew G H 1995 Interaction of ampiphilic peptide with phospholipid bilayer surface by
molecular dynamics simulation study: J. Biomol. Struct. Dynam. 12 937–956 Huang P, Bertaccini Ed and Loew G H 1995 Molecular Dynamics simulation of Anesthetic-phospholipid
bilayer interaction; J. Biomol. Struct. Dynam. 12 725–754 Huang P, Perez J J and Loew G H 1994 Molecular dynamics simulation of phospholipid bilayer; J. Biomol.
Struct. Dynam. 11 927–956 Hui S W and He N B 1983 Molecular organisation in cholesterol lecithin bilayers by X-ray and electron
diffraction measurements; Biochemistry 22 1159–1164 Janiak M J, Small D M and Shipley G G 1979 Temperature and composition dependence of the structure of
hydrated dimyristoyl lecithin; J. Biol. Chem. 254 6068–6078 Jonsson B, Edholm O and Teleman O 1986 Molecular dynamics simulation of a sodium octanoate micelle in
aqueous solution; J. Chem. Phys. 85 2259–2271 Jorgenson W L, Chandrasekhar J, Medura J D, Impey R W and Klein M M L 1983 Comparison of simple
potential functions for simulating liquid water; J. Chem. Phys. 79 926–935 Karaborni S, van Os N M, Esselink E and Hilbers P A J 1993 Molecular dynamics solution of oil
solubilisation in surfactant solution; Langmuir 9 1175–1178 Kaul P and Kothekar V 1988 Dynamic fluorescence polarization studies on lipid mobilities in phospholipid
vescicles in presence of cation mediators: BioScience 13 359–365 Kothekar V and Gupta D 1994 200 ps molecular dynamics studies on interaction of nifedipine with 1–2
dimyristoyl phospitidyl choline membrane; Indian J. Biochem. Biophys. 31 24–30 Levine Y K and Wilkins M H F 1971 Interaction between neutral phospholipid bilayer membranes; Nature
New Biol. 230 69–72 Lewis B A and Engleman D M 1983 Lipid bilayer thickness varies linearly with acyl chain length in fluid
phosphtidyl choline vescicles; J. Mel. Biol. 166 211–217 Lis L J, McAlister M, Fuller N, Rand R P and Parsegian V A 1982 Interaction between neutral phosphalipid
bilayer membranes; Biophys. J. 37 657–666 Mrigank, Royyuru A K and Kothekar V 1986 Origin of sequence specific recognition of DNA by non
intercalating antitumour antibiotics; FEBS Lett. 195 203–207 Oldfield E, Meadows D, Rice D and Jacobs R 1978 Spectroscopic studies of specifically labeled membrane
systems. Nuclear magnetic investigation of the effect of cholesterol on model systems; Biochemistry 17 2727–2740
Pastor R W, Venable R M and Karplus M 1991 Model for the structure of the lipid bilayer; Proc. Natl. Acad.Sci. USA 88 892–896
Pastor R W, Venable R M and Karplus M 1988 A simulation based model of NMR T, relaxation in lipid bilayer vescicles; J. Chem. Phys. 89 1112–1127
Pearlman D A, Case D A, Caldwell J C, Seibel G L, Singh U C, Weiner P and Kollman P A 1991 AMBER 4·0 UCSF version.
Pearson R H and Pascher I 1979 The molecular structure of lecithin dehydrate: Nature (London) 281 499–501 Pople J A, Santry D P and Segal G A 1965 Approximate self-consistent molecular orbital theory I. Invariant
Procedures; J. Chem. Phys. 43 129–135 Raghavan K, Reddy M R and Berkowitz M L 1992 A molecular dynamics study of the structure and
dynamics of water between dilauroylphosphatidylethanolarnine bilayers; Langmuir 8 233–240 Reiss-Husson F 1967 Structure desphase liquide crystalliner de different phospholipids, monoglycerides,
sphingolipids anhydresan on en presence d’eau; J. Mol. Biol. Chem. Phys. Lipids 1 445–475 Robinson A J, Richards W G, Thimas P J and Hann M M 1994 Head group and chain behaviour in
Biological Membranes A molecular dynamics computer simulation; Biochemistry 67 2345–2354 Robinson A J, Richards W G, Thimas P J and Hann M M 1995 Behavior of Cholesterol and its effect on
head group and chain conformation in lipid bilayer: Molecular dynamics simulation; Biophys, J. 66 164–170
Sayle R 1994 A Molecular Visualisation Program RasMol (Glaxo Research and Development, Greenfield, Middlesex, UK)
Scott H L 1991 Lipid cholesterol interaction; Biophys, J. 59 445–455 Scott H L and Kalaskar 1989 Lipid chains and cholesterol in model membranes; Biochemistry 28 3687–3692 Seelig A and Seelig J 1974 The dynamic structure of fatty acyl chains in phospholipid bilayer measured by
deutericum magnetic resonance; Biochemistry 13 4839–4845 Seelig J, Gaily H U and Wohlgeinulh R 1977 Orientation and flexibility of choline head groups in
phosphatidyl choline bilayers; Biochim. Biophys. Acta 467 109–119

Molecular dynamics study of interaction 597 Sperotto M M and Mouritsen O G 1991 Monte Carlo simulation of lipid order parameter profiles near
integral membrane lipids: Biophys. J. 59 261–270 Sundarlingam M 1972 Molecular structures and conformations of the phospholipids; Ann. N. Y. Acad. Sci.
USA 195 324–355 Tardieu A, Luzzati V and Reman F C 1973 Structure and Polymorphism of hydrocarbon chains of lipids.
Study of lipid water interaction; J. Moil. Biol. 75 711–733 Van Der Ploeg P and Berendsen H J C 1982 Molecular dynamics simulation of bilayer membrane; J. Chem.
Phys. 76 3271–3276 Van der Ploeg P and Berendsen H J C 1983 Molecular dynamics simulation of bilayer membrane; Mol. Phys.
49 233–248 Weiner SJ, Kollman P A, Case D A, Chandra singh U, Ghio C, Alagona A G, Profeta S and Weiner P J 1984.
A new force field for molecular mechanical simulation of nucleic acids and proteins; J. Am. Chem. Soc. 106 765–784
Wendoloski J J, Kimatian S J, Schutt C E and Salemme F R 1989 Molecular dynamics simulation of phospholipid micelle; Science 243 636–637
Woolf T B and Roux B 1994 Molecular dynamics simulation of gramicidin channel in a phospholipid bilayer; Proc. Natl. Acad. Sci. USA 91 11631–11635
Corresponding editor: SAMIR K BRAHMACHARI