Molecular complexes for artificial photosynthesis
153
HAL Id: tel-02408916 https://tel.archives-ouvertes.fr/tel-02408916 Submitted on 13 Dec 2019 HAL is a multi-disciplinary open access archive for the deposit and dissemination of sci- entific research documents, whether they are pub- lished or not. The documents may come from teaching and research institutions in France or abroad, or from public or private research centers. L’archive ouverte pluridisciplinaire HAL, est destinée au dépôt et à la diffusion de documents scientifiques de niveau recherche, publiés ou non, émanant des établissements d’enseignement et de recherche français ou étrangers, des laboratoires publics ou privés. Molecular complexes for artificial photosynthesis Youngju Ro To cite this version: Youngju Ro. Molecular complexes for artificial photosynthesis. Inorganic chemistry. Université Paris Saclay (COmUE), 2019. English. NNT : 2019SACLS412. tel-02408916
Transcript of Molecular complexes for artificial photosynthesis

HAL Id: tel-02408916https://tel.archives-ouvertes.fr/tel-02408916
Submitted on 13 Dec 2019
HAL is a multi-disciplinary open accessarchive for the deposit and dissemination of sci-entific research documents, whether they are pub-lished or not. The documents may come fromteaching and research institutions in France orabroad, or from public or private research centers.
L’archive ouverte pluridisciplinaire HAL, estdestinée au dépôt et à la diffusion de documentsscientifiques de niveau recherche, publiés ou non,émanant des établissements d’enseignement et derecherche français ou étrangers, des laboratoirespublics ou privés.
Molecular complexes for artificial photosynthesisYoungju Ro
To cite this version:Youngju Ro. Molecular complexes for artificial photosynthesis. Inorganic chemistry. Université ParisSaclay (COmUE), 2019. English. �NNT : 2019SACLS412�. �tel-02408916�
Molecular complexes for artificial photosynthesis
Thèse de doctorat de l'Université Paris-Saclay
préparée à Université Paris Sud
École doctorale n°571 Sciences chimiques : molécules, matérieux, instrumentation et biosystèmes (2MIB)
Spécialité de doctorat: Chimie
Thèse présentée et soutenue à Orsay, le 6 novembre 2019, par
Mme Youngju RO Composition du Jury : Pierre MIALANE
Professeur, Université Versailles Saint-Quentin-en-Yvelines Président
Sébastien RICHETER Maître de Conférences - HDR, Université de Montpellier Rapporteur
Yann PELLEGRIN Directeur de Recherches, Université de Nantes Rapporteur
Eric DORIS Chercheur de CEA, CEA Saclay Examinateur
Charles DEVILLERS Maître de Conférences - HDR, Université de Bourgogne Examinateur
Ally AUKAULOO Professeur, Université Paris Sud Directeur de thèse
NN
T :
20
19
SA
CLS
412

Université Paris-Saclay Espace Technologique / Immeuble Discovery Route de l’Orme aux Merisiers RD 128 / 91190 Saint-Aubin, France


4

5
Acknowledgement
I appreciate Prof. Ally Aukauloo for giving me an opportunity to work in Laboratoire de Chimie
Inorganique. I remember the moment when I met him first time. He convinced me to go ahead
for the research to focus on science. The most memorable sentence which he told me is “I will
take the challenge.”. With his impact decision, all situations flowed naturally, and I also reacted
to produce fruitful output. I really liked to discuss with him whenever I had curiosity and
questions in any kinds of topic. It had always been my strong motivation to go through the
meaningful road. Especially, I could learn about Artificial Photosynthesis by approaching various
points of view. Thank you for being my supervisor.
I would like to thank Dr. Winfried Leibl. He is my great advisor both in research and life. If
someone ask me ‘express him in some words’, without hesitating, I would say ‘wisdom and
warmness’, which I like most. We often shared the research idea, tried and finally succeed.
Among his teaching for me, mainly I learned photophysics and understood the principle of
photocatalysis.
I am thankful to Dr. Zakaria Halime. I was impressed with his passion toward the research. I could
learn a lot from the beginning to the end! How to synthesis, characterize metal complexes,
control the parameter to make crystal, and work in glove box….all about chemistry! When I asked
about science, anytime he opened his heart and he spent time for me. Especially, I will miss his
joking which makes me fun during working.
I thanks to Dr. Marie Sircoglou. She took care of my safe and security so I could be careful about
my experiment. For the ion pair study, her comments helped me to approach in depth.
Thank you Dr. Annamaria Quaranta. When I used instruments in CEA, she helped me a lot. I was
happy when you commented to me for my presentation during weekly seminar. I liked the
environment which we could discuss freely.

6
Many thanks to Dr. Christian Herrero for EPR measurements. I would like to thank Dr. Régis for
analysis crystals. Also, lots of thanks to Dr. Eric for the magnetism measurements. You all
explained the data analysis carefully and always you welcome me!
I appreciate to Dr. Sébastien Richeter and Dr. Yann Pellegrin who accepted the task of being
reporters of my defense. They reviewed my thesis report and commented to support the results.
Furthermore, I would like to thank Prof. Pierre Mialane, Dr. Eric Doris, and Dr. Charles Devilliers
for examining my thesis.
I always try to find for diverse challenging & rewarding higher education and the SERP-Chem
which was my master program in Europe made it possible for me which I am always thankful for.
Above all, I thanks to Prof. Sandrine Lacombe who is the director of the SERP-Chem Program, she
listened to me always and suggest better way for me not only during master but also during my
Ph.D.
I appreciate to people in Institut de Chimie Moléculaire et des Matériaux d'Orsay (ICMMO) at
Université Paris-Sud, Institut de biologie intégrative de la cellule (I2BC) at CEA Saclay. In addition,
thanks to École doctorale for the financial supporting during my Ph.D.
Last but not the least, I am always thankful to my family members. My study in Europe was fully
supported by your love and pray! Jin Choi, my husband since my master in 2014, thanks for his
following to cheer me up throughout my Ph.D degree have been memorable. Especially my lovely
babies (puppies) Sun & Moon, you are my sunshine and moonlight during day and night. Let’s
make new road for the bright future together to be happy.

7

8

9
The goal is not to be perfect by the end. The goal is to be better today.
Simon Sinek

10

11
Table of contents
Acknowledgement ........................................................................................................................................ 5
Table of contents ........................................................................................................................................ 11
Abbreviations .............................................................................................................................................. 15
0. Thesis Overview ................................................................................................................................... 19
1. General Introduction ........................................................................................................................... 23
1.1. Artificial Photosynthesis ............................................................................................................. 23
1.1.1. From biological to artificial photosynthesis ........................................................................ 23
1.1.2. Global Warming crisis and Solar Energy ............................................................................. 25
1.1.3. Photosystem II : Oxygen Evolving Center and Water Splitting ........................................... 27
1.2. Photoinduced activation of water .............................................................................................. 28
1.2.1. Water Oxidation, O2 evolution ............................................................................................ 28
1.2.2. Ruthenium-based Photosensitizers .................................................................................... 33
1.2.3. Study of Water Oxidation using Copper Catalysts .............................................................. 35
1.3. Ion Pair Formation ...................................................................................................................... 38
2. Electrochemical Water Oxidation ....................................................................................................... 43
2.1. Introduction ................................................................................................................................ 43
2.2. Experimental methods ................................................................................................................ 48
2.2.1. Synthesis of Copper complex .............................................................................................. 48
2.2.2. Electron acceptors .............................................................................................................. 48
2.3. Characterizations of CuIIOPBI ...................................................................................................... 52
2.3.1. Cyclic Voltammetry (CV) ..................................................................................................... 52
2.4. Electrochemical water oxidation ................................................................................................ 54
2.5. EPR spectro-electrochemical experiments ................................................................................. 58
2.6. Other Copper complex, CuIIOBBZ................................................................................................ 64
2.6.1. CV of CuIIOBBZ ..................................................................................................................... 65
2.6.2. Electrochemical water oxidation by CuIIOBBZ .................................................................... 66
2.7. Photochemical water oxidation .................................................................................................. 71
2.7.1. Photophysical studies between [Ru(bpy)3]2+ and Copper complex .................................... 71
2.7.2. Oxygen measurement by Clark Electrode ........................................................................... 73
2.8. Conclusions & Perspectives ........................................................................................................ 75
12
3. Ion pair formation ............................................................................................................................... 79
3.1. Introduction ................................................................................................................................ 79
3.2. Synthesis and Characterizations ................................................................................................. 83
3.2.1. Synthesis ............................................................................................................................. 83
3.2.2. Characterizations ................................................................................................................ 84
A) 1H NMR analysis of Ligand .............................................................................................................. 84
B) MS analysis of CuL(TMA)2 ............................................................................................................... 85
C) IR analysis (MVCl2, [CuIIOPBI](TMA)2 and [CuIIOPBI]MV) ................................................................ 85
D) Crystal structures : [CuIIOPBI](TMA)2 and [CuIIOPBI]MV ................................................................ 86
3.3. Electrochemical Study ................................................................................................................. 88
3.3.1. Cyclic Voltammetry (CV) ..................................................................................................... 88
A) [CuIIOPBI](TMA)2 vs. [CuIIOPBI]MV ................................................................................................. 88
3.4. UV-Vis spectroscopy ................................................................................................................... 91
3.4.1. [CuIIOPBI](TMA)2 ................................................................................................................. 91
3.4.2. Ion pair formation between [CuIIOPBI](TMA)2 and MV(PF6) 2 ............................................ 91
3.4.3. Effect of dielectric constant ................................................................................................ 95
3.5. EPR measurements ..................................................................................................................... 96
3.6. NiIIOPBI ([NiIIOPBI]2-) and CuIIOBBZ ([CuIIOBBZ]2-) ..................................................................... 100
3.6.1. Ni OPBI ([NiIIOPBI]2-) .......................................................................................................... 100
3.6.2. CuIIOBBZ ([CuIIOBBZ]2-) ...................................................................................................... 102
3.7. Conclusions & Perspectives ...................................................................................................... 104
4. Intramolecular Electron Transfer ...................................................................................................... 107
4.1. Introduction .............................................................................................................................. 107
4.2. Synthesis and Characterizations ............................................................................................... 109
4.2.1. Synthesis of RuIILMnIII ........................................................................................................ 109
4.2.2. Characterizations .............................................................................................................. 111
A) Cyclic Voltammetry (CV) ............................................................................................................... 111
B) Absorption spectra of complexes and their emission properties ................................................ 112
4.2.3. Photophysical Studies : Laser Flash Photolysis ................................................................. 113
A) RuIIL ............................................................................................................................................... 113
B) RuIILMnIII ........................................................................................................................................ 114
C) RuIILZnII .......................................................................................................................................... 116
4.3. Conclusions & Perspectives ...................................................................................................... 118

13
References ................................................................................................................................................ 119
Annex ........................................................................................................................................................ 125
(A) Experimental part ............................................................................................................................ 125
A.1. Electrochemistry ........................................................................................................................ 125
A.2. UV-Visible Spectrophotometry .................................................................................................. 128
A.3. Infrared (IR) Spectroscopy ......................................................................................................... 130
A.4. Nuclear magnetic resonance (NMR) Spectroscopy ................................................................... 131
A.5. Electron Paramagnetic Resonance (EPR) ................................................................................... 133
A.6. Mass Spectrometry (MS) ........................................................................................................... 136
A.7. Transient Absorption (TA) / Laser Flash photolysis (LFP) .......................................................... 137
A.8. Clark Electrode ........................................................................................................................... 138
A.9. Glove box system ....................................................................................................................... 140
(B) Synthesis and Characterizations ...................................................................................................... 141
B.1. [NiIIOPBI](TMA)2 ......................................................................................................................... 141
B.2. RuIILMnIII ..................................................................................................................................... 141
(C) X-ray Crystal Structure ..................................................................................................................... 143
C.1. [CuIIOPBI](TMA)2 and [CuIIOPBI]MV ........................................................................................... 144
C.2. [CuIIOPBI]MV (in glove box, Oxygen-free condition) ................................................................. 145
C.3. [NiIIOPBI](TMA)2 ......................................................................................................................... 145
C.4. [CuIIOBBZ](TBA)2......................................................................................................................... 147
References ................................................................................................................................................ 148
Résumé (en français) ................................................................................................................................ 149

14

15
Abbreviations
ACN acetonitrile
ATP adenosine triphosphate
BE bulk electrolysis
CA chronoamperometry
CE counter electrode
CEEC chemical-electrochemical-electrochemical-chemical
ClO4 perchlorate
[CoIII(NH3)5Cl]2+ chloropentamminecobalt chloride
CPE controlled potential electrolysis
CuIIOBBZ copper (II) N,N-oxamido bis(benzoato)
[CuIIOBBZ]2- copper (II) N,N-oxamido bis(benzoato) dianion
CuIIOPBI copper (II) bisoxamidate
[CuIIOPBI]2- copper (II) bisoxamidate dianion
[CuIIOPBI] MV isolated [CuIIOPBI]2- MV2+ compound via metathesis
CV cyclic voltammetry
DMSO dimethyl sulfoxide
DPV differential pulse voltammetry
ECEC electrochemical-chemical-electrochemical-chemical
EE electrochemical-electrochemical
EECC electrochemical-electrochemical-chemical-chemical
EtOH ethanol
FE faradic efficiency
FOWA foot-of-the-wave analysis
GCE glassy carbon electrode
HOMO highest occupied molecular orbital
ISC intersystem crossing
kobs rate constant
LFP laser flash photolysis
LUMO lowest unoccupied molecular orbital
MeOH methanol
MLCT metal-to-ligand charge-transfer band
MV+. methylviologen cation radical
MV0 methylviologen neutral
MV2+ methylviologen dication
NBD 4-nitrobenzenediazonium tetrafluoroborate
NHE normal hydrogen electrode
16
NiIIOPBI nickel (II) bisoxamidate
[NiIIOPBI]2- nickel (II) bisoxamidate dianion
OEC oxygen evolving complex
OER oxygen evolution reaction
Pers persulfate (S2O82-)
Ph phenyl group
PSII photosystem II
PV photovoltaics
RDS rate-determining step
RH3+ ruthenium Hexamine, [Ru(NH3)6]3+
[Ru(bpy)3]2+ tris(bipyridine)ruthenium(II)
[Ru(bpy)3]2+* exited state of Tris(bipyridine)ruthenium(II)
[RuIITMP(CO)] tetra (2,4,6-trimethyl)phenylporphyrinatoruthenium(II)
SCE saturated calomel electrode
SET-WNA single electron transfer‐water nucleophilic attack
Speciesox oxidized species
TBAP tetra butyl ammonium perchlorate
TBAPF6 tetrabutylammonium hexafluorphosphate
TGG triglycylglycine macrocyclic ligand
TMA tetramethylammonium
TMAOH tetramethylammonium hydroxide
TOF turnover frequency
TON turnover number
WE working electrode
WOC water oxidation catalyst
WOR water oxidation reaction

17

18
19
0. Thesis Overview
As a preamble, I would like to point out that the present work has been performed only since
May 2018. I have carried my research project in the group of ‘Artificial photosynthesis’ for 17
months only. Given the time constraints, I was not in a position to complete my targeted tasks.
In this manuscript, I have gathered my results and in parts I have been able to bring new
perspectives and comprehension while in others further studies will be needed to bring more
insights.
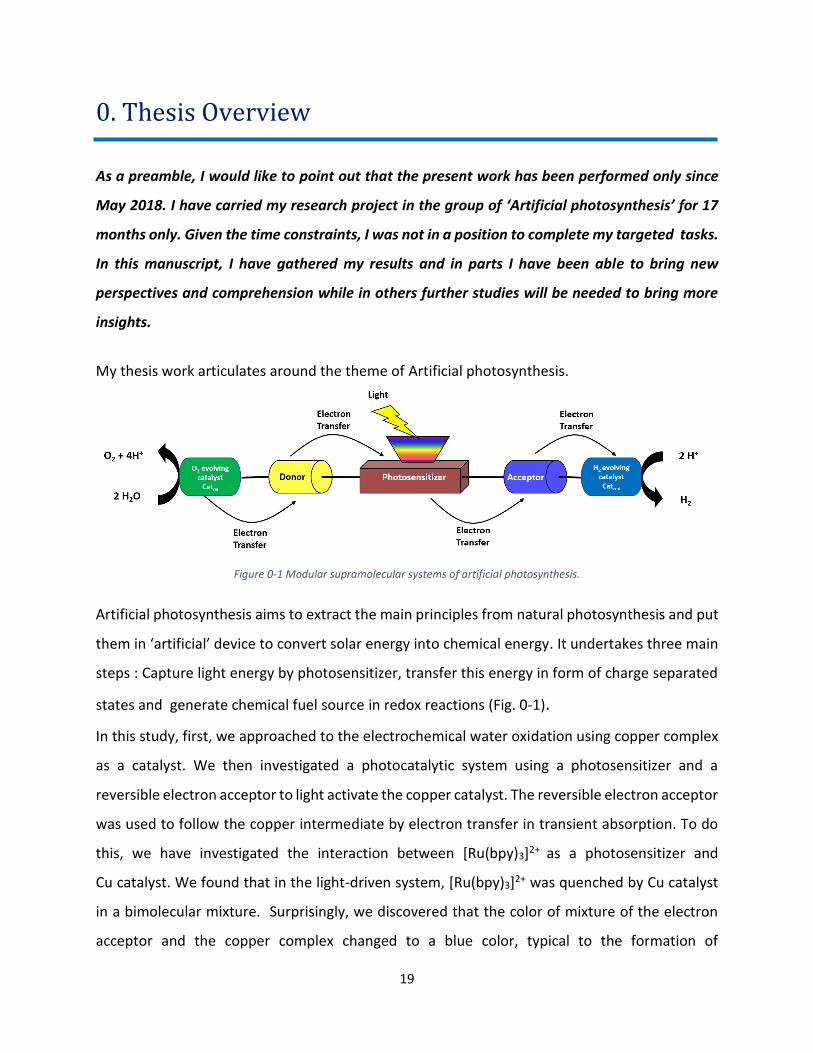
My thesis work articulates around the theme of Artificial photosynthesis.
Artificial photosynthesis aims to extract the main principles from natural photosynthesis and put
them in ‘artificial’ device to convert solar energy into chemical energy. It undertakes three main
steps : Capture light energy by photosensitizer, transfer this energy in form of charge separated
states and generate chemical fuel source in redox reactions (Fig. 0-1).
In this study, first, we approached to the electrochemical water oxidation using copper complex
as a catalyst. We then investigated a photocatalytic system using a photosensitizer and a
reversible electron acceptor to light activate the copper catalyst. The reversible electron acceptor
was used to follow the copper intermediate by electron transfer in transient absorption. To do
this, we have investigated the interaction between [Ru(bpy)3]2+ as a photosensitizer and
Cu catalyst. We found that in the light-driven system, [Ru(bpy)3]2+ was quenched by Cu catalyst
in a bimolecular mixture. Surprisingly, we discovered that the color of mixture of the electron
acceptor and the copper complex changed to a blue color, typical to the formation of
Figure 0-1 Modular supramolecular systems of artificial photosynthesis.

20
methylviologen radical (MV+.). Thermodynamically, MV2+ cannot oxidize Cu complex based on the
electrochemical properties. Moreover, the mixture between [Ru(bpy)3]2+ and MV2+ nothing had
happened in the dark. That is, the crucial trigger for studying ion pair formation based on the
puzzling observation when the Cu complex was mixed with methyl viologen (MV2+) in ACN, under
anaerobic conditions. The color of the mixture was visibly changed, and the blue color suggested
formation of MV+.. We reasoned that ion pair formation between the two oppositely charged
species could play a role. Finally, light-induced intramolecular oxidation in Ru-Mn supramolecular
complexes, which consists of chromophore and catalyst linked di-nuclear molecule were studied
to understand the direction of electron transfer steps and to generate oxidized Mn states by
exciting the photosensitizer with visible light in the presence of an electron acceptor.
In summary, Chapter 1. General Introduction gives energy issues and artificial photosynthesis in
terms of electrochemical and photochemical study of water oxidation. In addition, basic concept
of electron transfer and ion pair formation are mentioned. The end of the chapter explains our
objectives of this work.
Chapter 2. Electrochemical Water Oxidation gives the characterization of the Cu complexes and
their electrocatalysis properties. The high efficiency copper complexes for water oxidation
catalysis in electrochemical was revealed. The Cu complexes includes N atoms and O atoms which
gives key factor for water oxidation. With the results, we tried to investigate the electron transfer
mechanism in photocatalytic system. However, using in photocatalytic system was not successful
and it gave another study as following in Chapter 3.
In Chapter 3. Ion Pair Formation, we investigated the phenomenon between the oppositely
double charged species of Cu complex catalyst and electron acceptor. The electron transfer
pathway is the main target of this study.
In Chapter 4. Intramolecular Electron Transfer, we synthesized modular photocatalytic
assemblies by using different metal catalysts and Ru-photosensitizers. We have studied the
intramolecular electron transfer processes and photophysical characterizations. All detail
experimental principles, characterizations and crystal structures of the complexes are described
in Annex.
21
Chapter I.
General Introduction

22
23
1. General Introduction
1.1. Artificial Photosynthesis
1.1.1. From biological to artificial photosynthesis
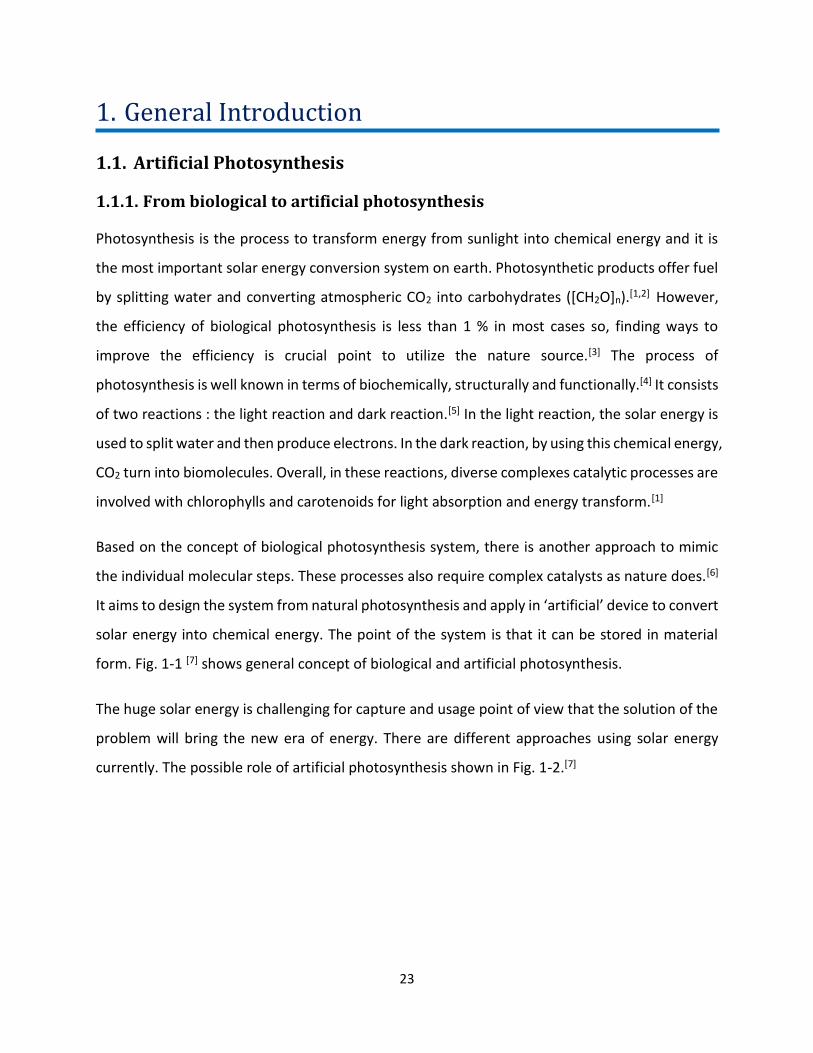
Photosynthesis is the process to transform energy from sunlight into chemical energy and it is
the most important solar energy conversion system on earth. Photosynthetic products offer fuel
by splitting water and converting atmospheric CO2 into carbohydrates ([CH2O]n).[1,2] However,
the efficiency of biological photosynthesis is less than 1 % in most cases so, finding ways to
improve the efficiency is crucial point to utilize the nature source.[3] The process of
photosynthesis is well known in terms of biochemically, structurally and functionally.[4] It consists
of two reactions : the light reaction and dark reaction.[5] In the light reaction, the solar energy is
used to split water and then produce electrons. In the dark reaction, by using this chemical energy,
CO2 turn into biomolecules. Overall, in these reactions, diverse complexes catalytic processes are
involved with chlorophylls and carotenoids for light absorption and energy transform.[1]
Based on the concept of biological photosynthesis system, there is another approach to mimic
the individual molecular steps. These processes also require complex catalysts as nature does.[6]
It aims to design the system from natural photosynthesis and apply in ‘artificial’ device to convert
solar energy into chemical energy. The point of the system is that it can be stored in material
form. Fig. 1-1 [7] shows general concept of biological and artificial photosynthesis.
The huge solar energy is challenging for capture and usage point of view that the solution of the
problem will bring the new era of energy. There are different approaches using solar energy
currently. The possible role of artificial photosynthesis shown in Fig. 1-2.[7]
24
The diverse systems for storing solar energy in chemical form can be divided into two approaches :
Direct approaches and multistage approaches. Direct approaches are the integration of light
absorption, primary charge separation and chemical reactions in a single object.[7] On the other
hands, multistage approaches are required the processes in the individual steps. Among the
different types of utilization such as solar electricity, solar thermal energy and solar fuel etc., the
most challenging task is design highly efficient man-made device to capture and drive the uphill
reactions to produce a fuel.[7] In this purpose, research in artificial photosynthesis is focused on
the capture and use solar energy to carry out multi-electron involved mechanism and catalytic
reactions by using water and carbon dioxide which are renewable sources in nature.
Figure 1-1 Biological photosynthesis (A) and artificial photosynthetic system (B). [7]

25
1.1.2. Global Warming crisis and Solar Energy
Many scientific experts and associations from countries all over the world made conclusion that
more than 95 % of greenhouse effect is affected by human activities. They change the natural
greenhouse, so the role of human activity is important to preserve the earth.[8,9] There are many
efforts to prevent both energy crisis and global warming. The energy, which is inexhaustible,
clean and non-polluting, we called it ‘renewable energy’.[10] The sources of renewable energy are
from nature for example, wind, geothermal, hydro and solar etc. Renewable energy has two
important factors, first they do not produce greenhouse gases and are reliable for long-term.
Even though they hold high potential for energy source, the efficiency and utilization are not yet
at reach.[11]
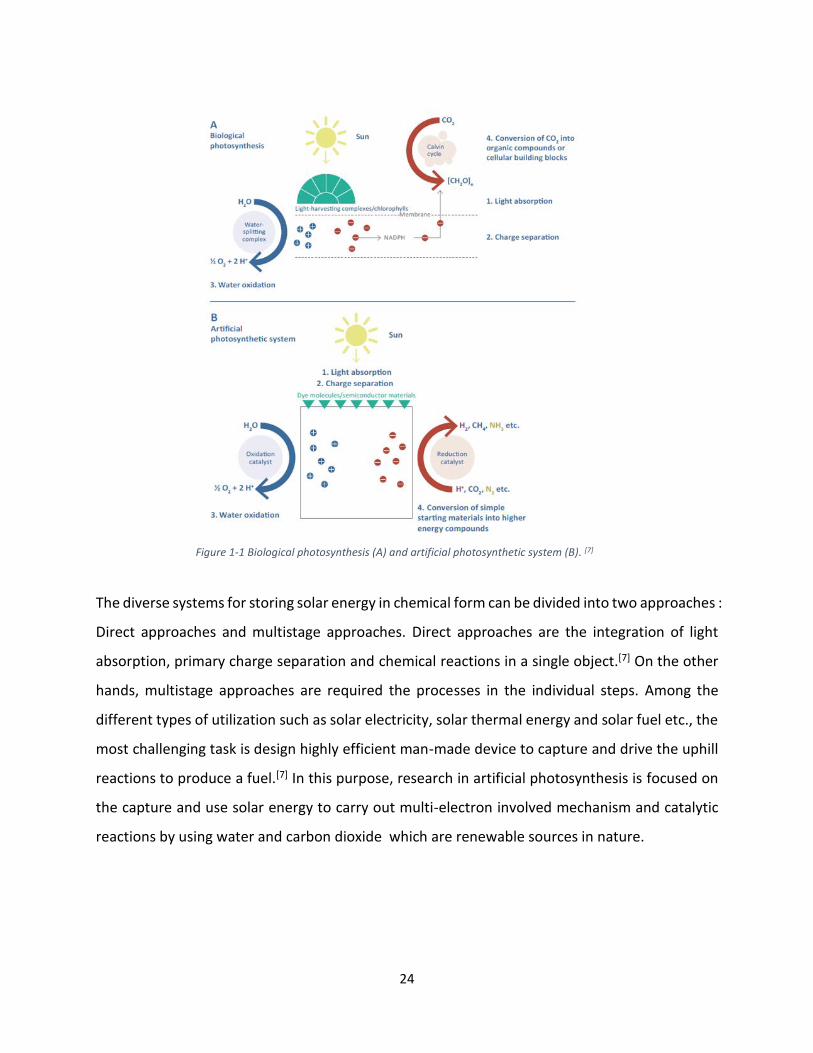
Solar power is the highest potential among the diverse renewable energy sources. Fig. 1-3 shows
total amount of energy recoverable and the volume of each sphere represents their values in
each.[12,13] The biggest size is solar energy and according to the reference, the energy
Figure 1-2 Possible role of artificial photosynthesis in the global energy and natural resource system. [7]
26
consumption of the world has increased nearly 12% to 18.3 TW/yr in 2014. We estimate it will
reach 28 TW/yr in 2050. That is, even in 2050, the amount of solar energy in a single day is still
more than the entire world consumes in a year.
A large part of the problem is storage to valorize solar power. That is, it is necessary to find ways
to efficiently store solar energy that can provide reliable power. The utilization of the solar energy
mainly divided by 2 parts : solar to electricity and solar to fuel. Photovoltaics (PV), battery and
thermal storage are included in case of the solar to electricity. The other case, for example, using
water and carbon dioxide through the thermal or electrochemical processes finally produce
oxygen, methane and hydrogen sorting in ‘solar to fuel’ part. The latter connects to ‘artificial
photosynthesis’, which approaches to the sustainable solar energy-driven cycle attempting to
use catalysts.
Figure 1-3 Estimate of finite and renewable planetary energy reserves (Terawatt-years). Total recoverable reserves are shown for the finite resources. Yearly potential is shown for the renewables. 2009 World energy consumption is comparing with the other energy resources. [13]
27
1.1.3. Photosystem II : Oxygen Evolving Center and Water Splitting
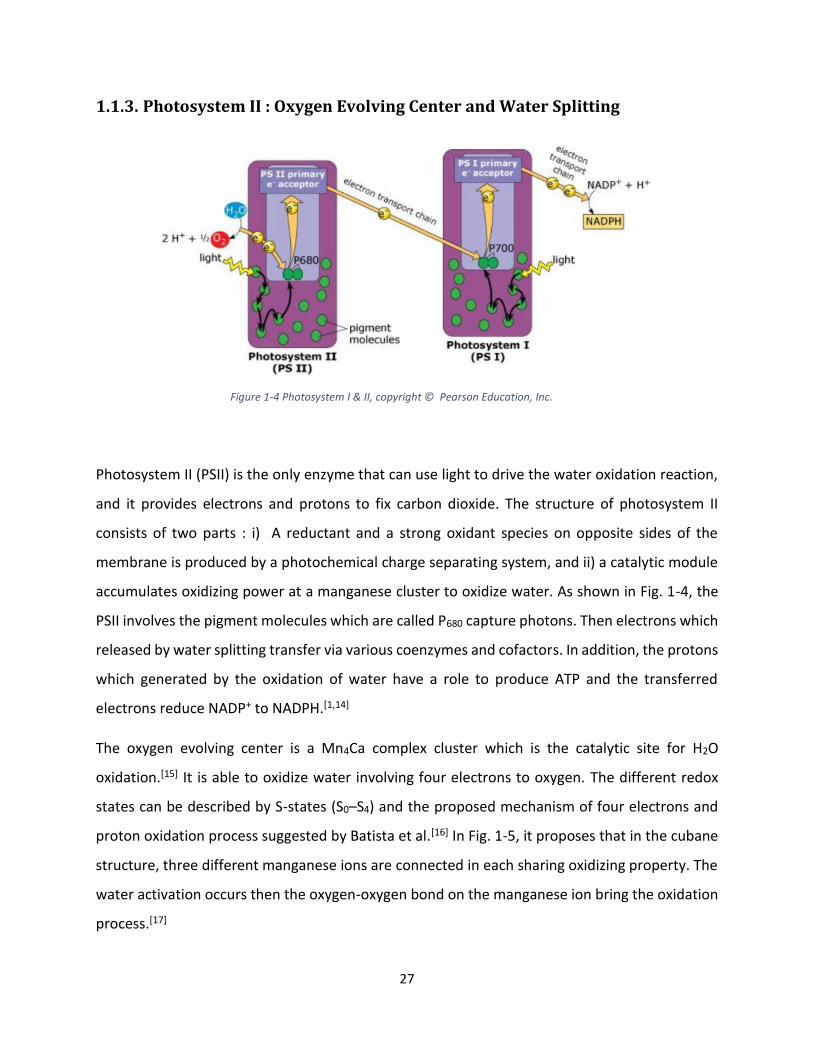
Photosystem II (PSII) is the only enzyme that can use light to drive the water oxidation reaction,
and it provides electrons and protons to fix carbon dioxide. The structure of photosystem II
consists of two parts : i) A reductant and a strong oxidant species on opposite sides of the
membrane is produced by a photochemical charge separating system, and ii) a catalytic module
accumulates oxidizing power at a manganese cluster to oxidize water. As shown in Fig. 1-4, the
PSII involves the pigment molecules which are called P680 capture photons. Then electrons which
released by water splitting transfer via various coenzymes and cofactors. In addition, the protons
which generated by the oxidation of water have a role to produce ATP and the transferred
electrons reduce NADP+ to NADPH.[1,14]
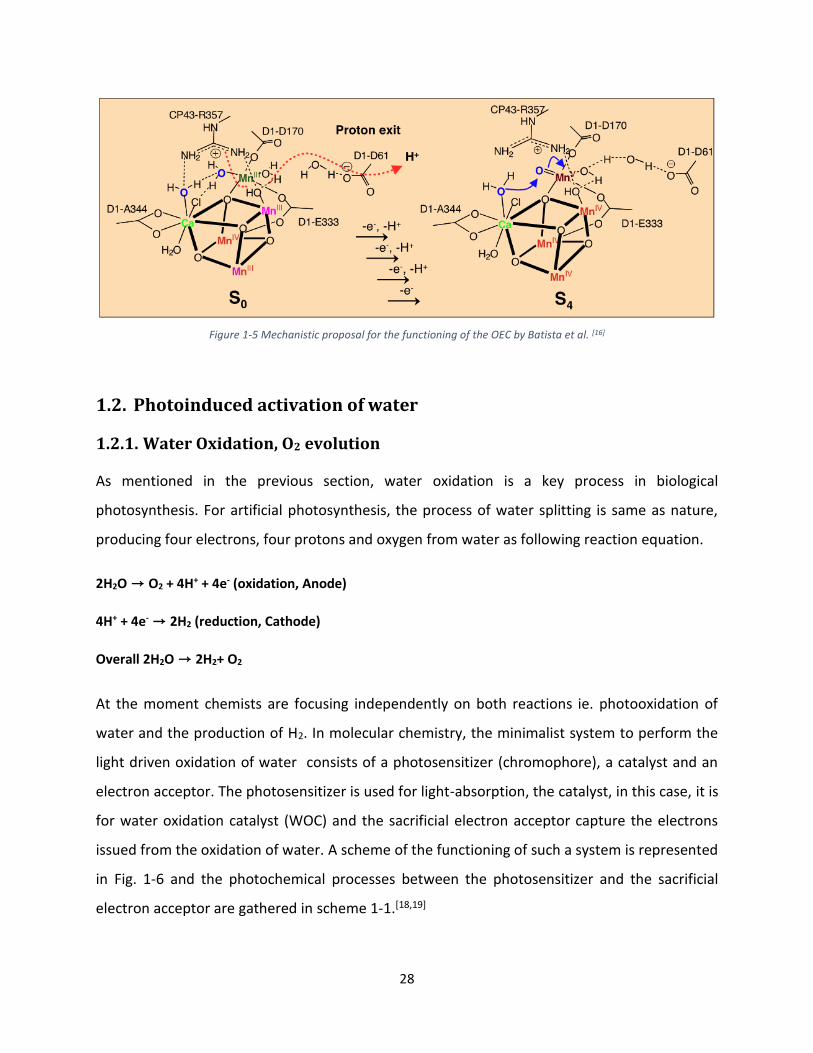
The oxygen evolving center is a Mn4Ca complex cluster which is the catalytic site for H2O
oxidation.[15] It is able to oxidize water involving four electrons to oxygen. The different redox
states can be described by S-states (S0–S4) and the proposed mechanism of four electrons and
proton oxidation process suggested by Batista et al.[16] In Fig. 1-5, it proposes that in the cubane
structure, three different manganese ions are connected in each sharing oxidizing property. The
water activation occurs then the oxygen-oxygen bond on the manganese ion bring the oxidation
process.[17]
Figure 1-4 Photosystem I & II, copyright © Pearson Education, Inc.
28
1.2. Photoinduced activation of water
1.2.1. Water Oxidation, O2 evolution
As mentioned in the previous section, water oxidation is a key process in biological
photosynthesis. For artificial photosynthesis, the process of water splitting is same as nature,
producing four electrons, four protons and oxygen from water as following reaction equation.
2H2O → O2 + 4H+ + 4e- (oxidation, Anode)
4H+ + 4e- → 2H2 (reduction, Cathode)
Overall 2H2O → 2H2+ O2
At the moment chemists are focusing independently on both reactions ie. photooxidation of
water and the production of H2. In molecular chemistry, the minimalist system to perform the
light driven oxidation of water consists of a photosensitizer (chromophore), a catalyst and an
electron acceptor. The photosensitizer is used for light-absorption, the catalyst, in this case, it is
for water oxidation catalyst (WOC) and the sacrificial electron acceptor capture the electrons
issued from the oxidation of water. A scheme of the functioning of such a system is represented
in Fig. 1-6 and the photochemical processes between the photosensitizer and the sacrificial
electron acceptor are gathered in scheme 1-1.[18,19]
Figure 1-5 Mechanistic proposal for the functioning of the OEC by Batista et al. [16]

29
There are three different types of molecular systems depending on the function of the molecules
and direct/indirect connection between molecules.[20]
i) Chromophore/catalyst systems
In these systems, monometallic ruthenium complexes act both as the chromophore and the
catalyst. Inoue’s lab is the pioneer to report this field.[21,22] They used tetra (2,4,6-
trimethyl)phenylporphyrinatoruthenium(II) [RuIITMP(CO)] as both chromophore and catalyst in
the presence of a platinum salt (PtIVCl2)2- as a sacrificial electron acceptor. The light driven
epoxidation of alkenes using water gives 60% of quantum yield and 95% of product selectivity.
Figure 1-6 Three-component system for light-driven water oxidation consisting of a catalyst, [Ru(bpy)3]2+ photosensitizer and electron acceptor.
Scheme 1-1 The processes involved in the light-driven persulfate system.[18,19]
30
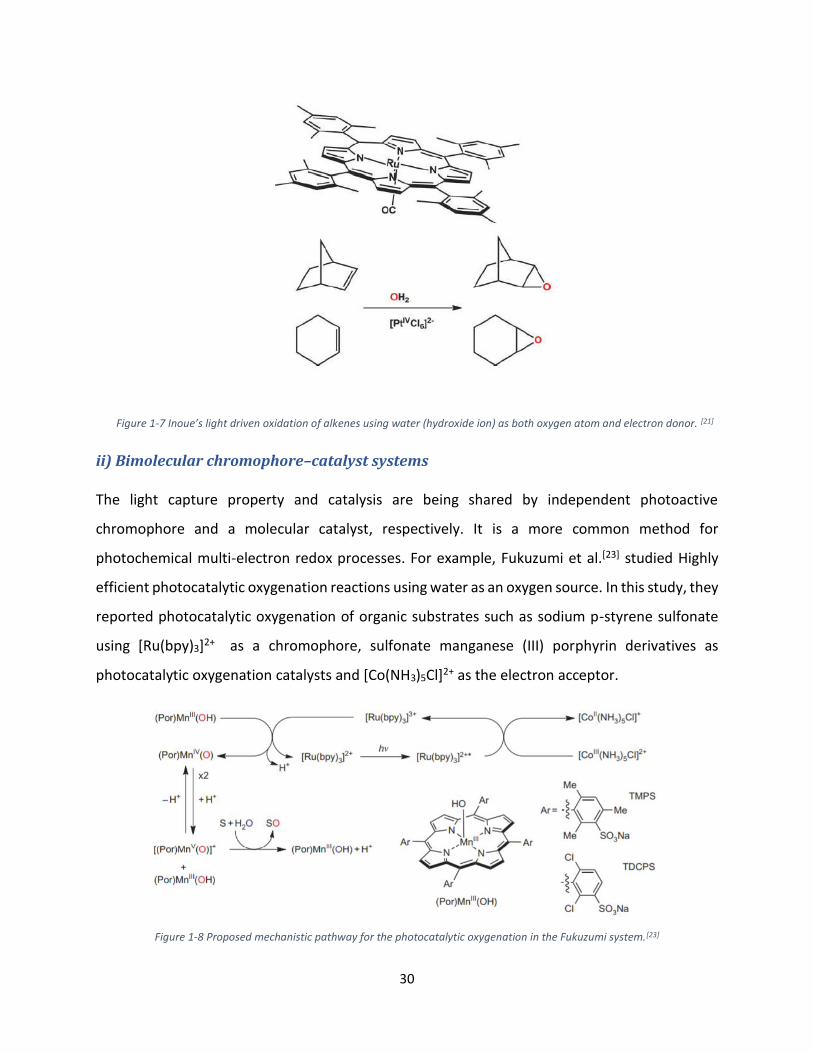
ii) Bimolecular chromophore–catalyst systems
The light capture property and catalysis are being shared by independent photoactive
chromophore and a molecular catalyst, respectively. It is a more common method for
photochemical multi-electron redox processes. For example, Fukuzumi et al.[23] studied Highly
efficient photocatalytic oxygenation reactions using water as an oxygen source. In this study, they
reported photocatalytic oxygenation of organic substrates such as sodium p-styrene sulfonate
using [Ru(bpy)3]2+ as a chromophore, sulfonate manganese (III) porphyrin derivatives as
photocatalytic oxygenation catalysts and [Co(NH3)5Cl]2+ as the electron acceptor.
Figure 1-8 Proposed mechanistic pathway for the photocatalytic oxygenation in the Fukuzumi system.[23]
Figure 1-7 Inoue’s light driven oxidation of alkenes using water (hydroxide ion) as both oxygen atom and electron donor. [21]
31
iii) Chromophore–catalyst assembly
In recent years, the field of visible-light-driven catalysis has been developed for oxidation and
their electron transfer mechanism.[24,25] Supramolecular dyads where chromophore and catalyst
unit are covalently linked are one of molecular systems in light-driven processes and these
assemblies can be integrated in solid electrode surfaces.[26] They have difficulties for their
synthesis with linking a chromophore to a catalyst and the energy quenching mechanisms can
bother the desirable role of the sensitizer. However, the strong points of these assemblies are
clear that they have stable properties of visible light absorption and provide suitable direction of
the electron transfer steps. For example, the design of a proper linker is necessary since
supramolecular dyads might be difficult in fast return electron transfer from the excited
chromophore to the oxidized water oxidation catalyst.[27] To mimic the electron-transfer from
the nature photosystem, the manganese cluster in photosystem II have been constructed as
model of the WOCs.[28] Applying in supramolecular system, diverse formations of Ru-Mn, where
Ru is photosensitizer and Mn act as catalysts have studied.[29,30]
In 1998, Hammarstrom et al. investigated kinetic analysis of intramolecular, MnII-RuII system by
flash photolysis experiments in the presence of methyl viologen as reversible electron acceptor.
The electron-transfer processes from MnII to photooxidized RuIII which was quenched by MV2+
were reported. EPR measurements were performed that the signal of RuIII and MnII disappeared
rapidly due to the silent properties of RuII and MnIII.[31]
Aukauloo et al. have worked light-induced intramolecular oxidation of Ru-Mn supramolecular
complexes. Heteroleptic [Ru(bpy)2L]2+ chromophore covalently linked to a MnIII-Salen unit was
performed to generate high-valent Mn states by exciting the photosensitizer with visible light in
the presence of an electron acceptor. Scheme 1-2. gives the light-induced reactions of the RuII-
Salen-MnIII in the presence of irreversible electron acceptor, 4-nitrobenzenediazonium
tetrafluoroborate (NBD). The oxidation states were proved by transient absorption and EPR
techniques which correspond to the conversion from MnIII to MnIV. This study provides the way
to control light-induced activation of catalysts in terms of the electron transfer and identity of
the oxidized intermediates component.[32]

32
The promising results obtained with the [RuII(tpy)(bpy)(OH2)]2+ complex in visible light-driven
water oxidation in the three-component component system using ruthenium hexamine
([RuIII(NH3)6]3+) as reversible electron acceptor. Two different modified Ru-based
photosensitizers were coupled to the Ru catalyst and depending on the electronic properties of
the chromophores, they work as antenna system by activating the catalyst via energy transfer or
direct electron transfer. (Fig. 1-9[33].)
Scheme 1-2 Light-induced reactions of the RuII-Salen-MnIII photosensitizer-catalyst in the presence of irreversible electron acceptor, NBD.[32]
Figure 1-9 Catalyst activation in different photosensitizer upon visible light absorption. [33]
33
1.2.2. Ruthenium-based Photosensitizers
The photosensitizer module is an essential part in the research for the photooxidation of water.
Actually, it is the core that will inject the required energy to perform energetically demanding
reactions. It absorbs light (ultraviolet or visible region) and produces a charge separated state
where after a cascade of electron transfers lead to charge accumulation to perform
multielectronic catalysis. Different families of photosensistizers are currently being investigated
such semiconductor quantum dots, inorganic molecular complexes, or organic chromophores.
[Ru(bpy)3]2+-type complexes have been widely studied and well known as excellent photo-redox
metal-based photosensitizers. They have several advantages that used in artificial photosynthesis.
They are quenched by electron acceptors or donors efficiently. The exited state, [Ru(bpy)3]2+* has
longer lifetime that chemical reactions allow to occur : a single-electron oxidation or a single-
electron reduction in the presence of an acceptor or a donor, respectively. The photostability is
another desirable property. In large pH range, they perform compatible and the broad absorption
of visible light is attractive point. Modification the ancillary ligands control their photophysical
and electrochemical properties in terms of the absorption of light region extension and redox
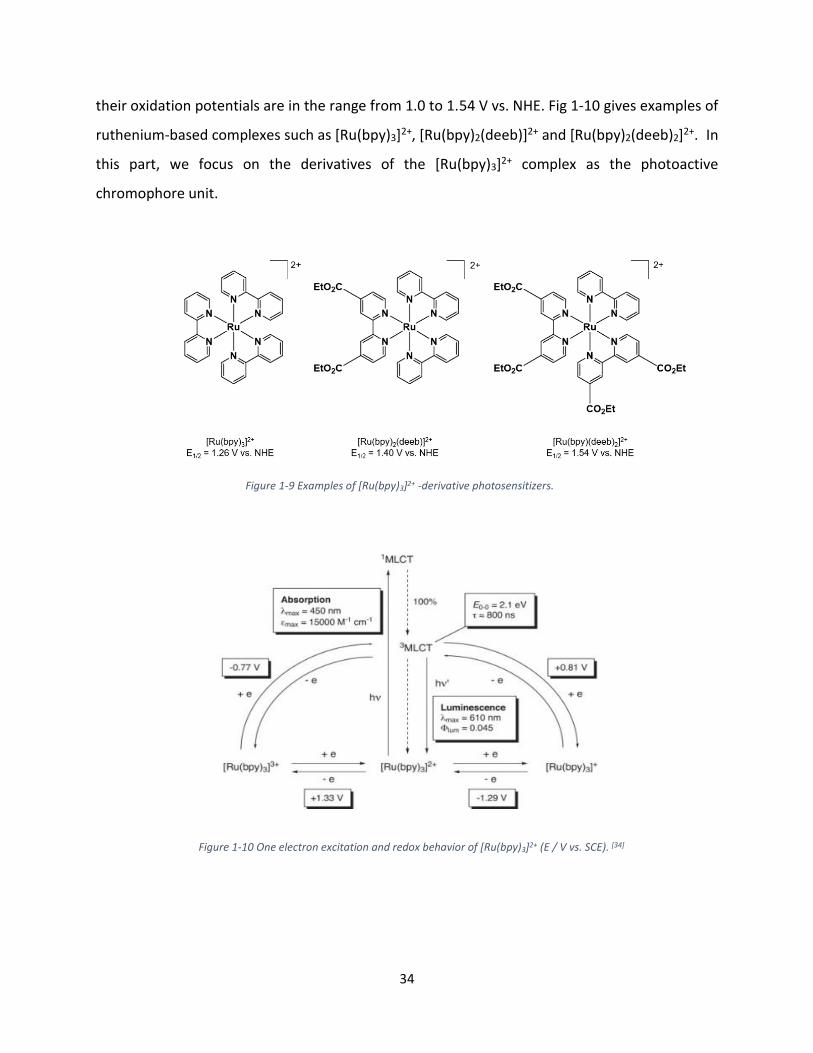
potential. Fig. 1-11 shows the photophysical features of [Ru(bpy)3]2+.[34] The potential of oxidation
species , [Ru(bpy)3]3+ is around 1.33 V vs. SCE and it is close to the primary donor of PSII, P680+.
That is, it can be a good candidate to reproduce the oxidation reactions.[35,36] The light absorption
at λmax = 450 nm which is investigated by flash photolysis is the typical property of [Ru(bpy)3]2+,
and it makes excitation of an electron in a metal-centered orbital to a π* orbital located on the
ancillary polypyridyl ligand. It is called ‘metal-to-ligand charge transfer (MLCT)’. That is, a singlet
excited state 1[Ru(bpy)3]2+* goes to intersystem crossing (ISC), affording a triplet state,
3[Ru(bpy)3]2+* which is relatively long lived.[37–39]
To modify the bipyridine ligands, synthetic handles are possible to change substituted ligands
with electron donating or withdrawing groups. The modification of the ligand changes the
photophysical properties of the complex such as the emission lifetimes and bathochromic shifts.
The addition of ester or carboxylate groups were shown around 50 nm of bathochromic shifts
due to the energies level of dp and p* orbital.[40,41] Depending on the properties of substitutions,
34
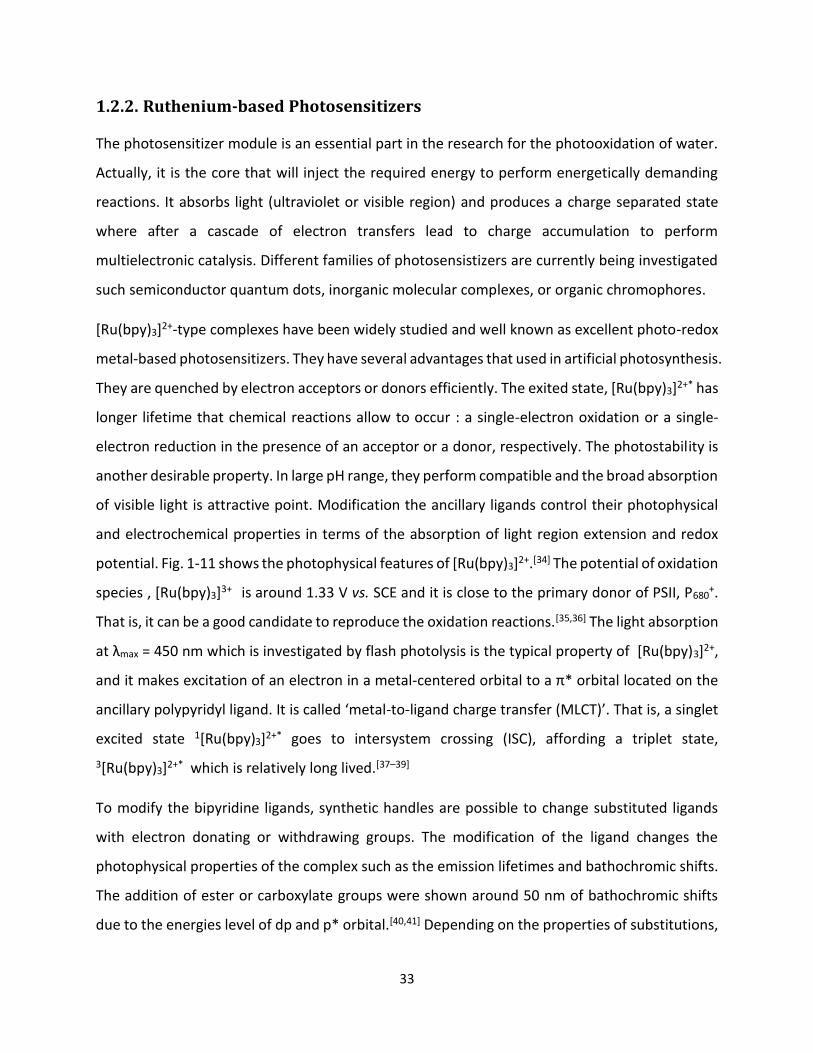
their oxidation potentials are in the range from 1.0 to 1.54 V vs. NHE. Fig 1-10 gives examples of
ruthenium-based complexes such as [Ru(bpy)3]2+, [Ru(bpy)2(deeb)]2+ and [Ru(bpy)2(deeb)2]2+. In
this part, we focus on the derivatives of the [Ru(bpy)3]2+ complex as the photoactive
chromophore unit.
Figure 1-9 Examples of [Ru(bpy)3]2+ -derivative photosensitizers.
Figure 1-10 One electron excitation and redox behavior of [Ru(bpy)3]2+ (E / V vs. SCE). [34]
35
1.2.3. Study of Water Oxidation using Copper Catalysts
One of the main challenges to water splitting is the development of robust WOCs with high
efficiency, low overpotentials, good stability and high turnover rates.[42] Water oxidation catalysts
divided by heterogeneous and homogeneous catalysts.[43] The heterogeneous catalysts such as
transition-metal oxides or hydroxides are the active species and they have high durability and
activity.[44,45] On the other hands, homogeneous catalysts which assisted by molecular complex
design, have active metal centers coupled with functional ligand that offer merits for mechanistic
studies.[46] In order to obtain low toxicity and earth abundant metals, recently the first-row
transition metals such as Fe, Cu, Co, Mn and Ni have been identified.[47–49] Homogeneous copper
molecular catalysts for water oxidation have been remarkable developed due to their relatively
high reactivity and stability under the highly oxidative conditions of the catalysis.[50,51] Besides,
they have emerged with well-defined redox properties and coordination chemistry.[52,53] For
water oxidation, the high thermodynamic potential required (1.23 V vs NHE at pH 0.0), means
that having the lower potential which can be applied in commercial applications is important
factor and it can be modulated by using oxidatively rugged ligands in homogenous catalysts
system. Therefore, this chapter summarizes the recent advances that have been made in
designing copper based WOCs for water oxidation.
The first report of homogeneous copper catalysts has been reported since 2012 by Mayer and
co-workers.[54] The examples of copper-based water oxidation catalysts (Fig. 1-11) contain
N-donor ligand which has capability of stabilizing the metal-oxo intermediates in transition
metal-catalyzed oxidations were recently studied as OEC by giving key catalytic properties (Table
1-1). To evaluate the performance of catalysts, the typical characterizations such as working
overpotential, catalytic activity, turnover number (TON), turnover frequency (TOF) and faradic
efficiency are the electrocatalytic parameters. Table 1-1. shows a set of electrochemical
parameters and kinetic data for Cu complexes described previously in the literature. Most of the
experiments have been explored under the basic electrolyte conditions rather than mild
conditions. The lowest overpotential value is 0.17 V (E 2) mentioned by Llobet.[55]

36
Table 1-1 . Kinetic and Electrochemical data of copper-based complexes water oxidation catalysts
Catalyst pH Ƞ / V kcat / s -1 TON
A[54] 12.5 0.75 100 30
B[56] 8.0 0.64 20 19
C[57] 12.4 0.64 0.4 1
D[58] 12.0 0.30 35 N/A
E1[55] 11.5 0.40 3.6 0.5
E2[55] 11.5 0.17 0.16 0.5
F[59] 7.0 0.88 7 N/A
G[60] 12.5 1.00 33 1.43
H[51] 11.0 0.52 33 13
Figure 1-11 Examples of copper-based water oxidation catalysts.

37
The complexes E series have been studied as function of the strength of the electron-donation
group. In addition, the equatorial N donor ligand-set complexes show the oxidatively stable. In
the recent studies of Cu complexes for water oxidation ‘E 2’ has the lowest overpotential value.[55]
The fastest complex A has quite higher rate constant 100 s-1 at pH 12.5 and overpotential is 750
mV.[54] The Other complexes (B, G, D and H) of rate constants are between 20 - 35 s-1. In 2013,
Mayer et al., provided CuII complex with triglycylglycine macrocyclic ligand (TGG4-) for electrolytic
water oxidation, [(TGG4-)CuII-OH2]2- (Figure 1-12, H).[51] The potentials which were measured by
CV happened at E1/2 = 0.58 V and 1.32 V vs NHE. The first reversible peak potential corresponds
to oxidation of Cu2+ to Cu3+ and the irreversible 2nd oxidation current peak appears remarkable
which occurs the onset potential for water oxidation at around 1.10 V vs. NHE that overpotential
is 0.52 V. The highlight part of this study is that they proposed the mechanism for electrocatalytic
water oxidation providing intermediate states. Fig. 1-12 Indicates that the first stage starts CuII
oxidation, CuII/III then appear CuIV peroxide intermediate, CuIV=O, losing one proton and one
electron. This propose attribute to bring new idea to improve ligand system catalysts.[51]
Figure 1-12 Proposed mechanism for water oxidation by ‘H’ in phosphate buffer solutions at pH 11. [51]

38
1.3. Ion Pair Formation
The presence of photosensitizer, electron donor (or acceptor) and catalyst are typical conditions
in the study of photocatalytic activity. Depending on their properties such as potentials, electrical
charge numbers, absorption wavelength and competition reactions etc., choosing carefully
suitable combinations is necessary. A possible phenomenon to occur is ion pair formation
between these elements which might affect the bimolecular electron transfer. For the ion pair
formation charge number of anion and cation is the main factor to consider together with the
dielectric constant of the solvent.
Ion pair formation is an association between positive ion and negative ion temporarily by
coulomb attraction (electrostatic force) without formation of a covalent bond. The two opposite
charge ions bond together and dissociation are followed by electron transfer.[61]
Based on the theory of ‘Bjerrum ion pair[62]’, when the oppositely charged ions are closer than its
centers distance, it formed an ion pair.
𝑞 =8.36 × 10⁶ 𝑍+𝑍−
𝜀𝑟Tpm
𝑍+, 𝑍−: charge numbers of the ions 𝜀𝑟 : relative permittivity (dielectric constant) T : Temperature
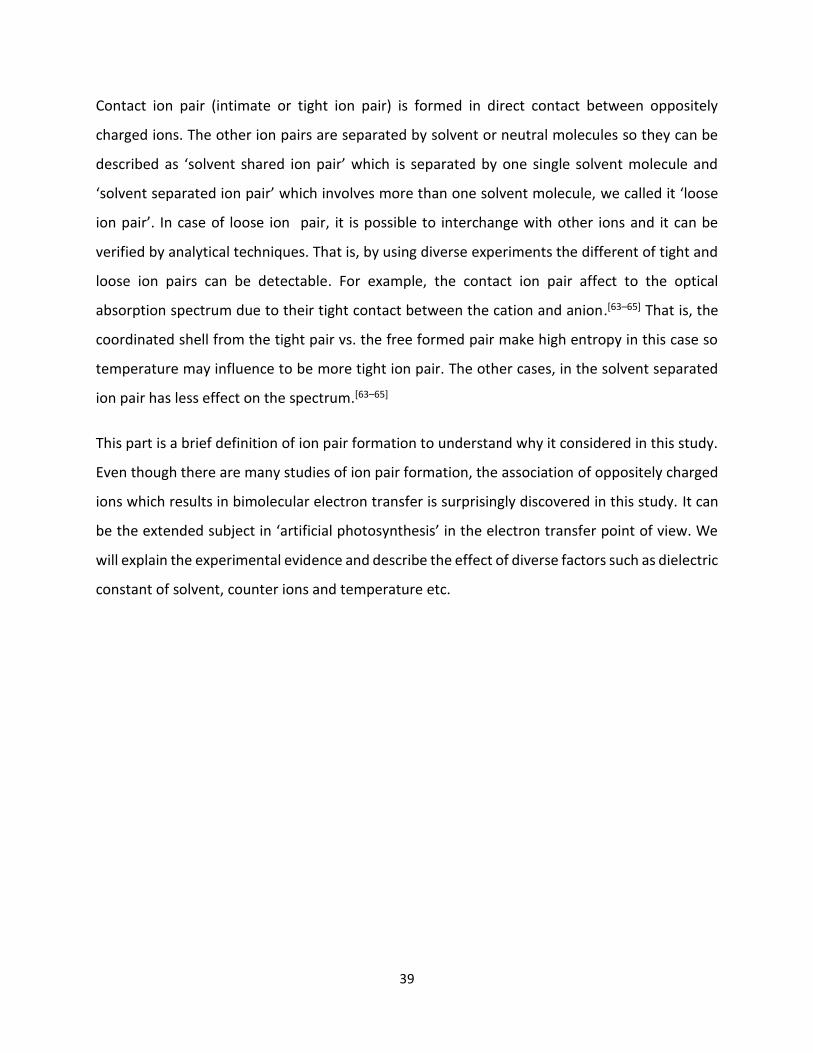
It consists of Contact (intimated or tight) Ion Pair, Solvent Shared Ion Pair and Solvent Separated
(loose) Ion Pair.
Figure 1-13 Diverse Ion-Pair formations
39
Contact ion pair (intimate or tight ion pair) is formed in direct contact between oppositely
charged ions. The other ion pairs are separated by solvent or neutral molecules so they can be
described as ‘solvent shared ion pair’ which is separated by one single solvent molecule and
‘solvent separated ion pair’ which involves more than one solvent molecule, we called it ‘loose
ion pair’. In case of loose ion pair, it is possible to interchange with other ions and it can be
verified by analytical techniques. That is, by using diverse experiments the different of tight and
loose ion pairs can be detectable. For example, the contact ion pair affect to the optical
absorption spectrum due to their tight contact between the cation and anion.[63–65] That is, the
coordinated shell from the tight pair vs. the free formed pair make high entropy in this case so
temperature may influence to be more tight ion pair. The other cases, in the solvent separated
ion pair has less effect on the spectrum.[63–65]
This part is a brief definition of ion pair formation to understand why it considered in this study.
Even though there are many studies of ion pair formation, the association of oppositely charged
ions which results in bimolecular electron transfer is surprisingly discovered in this study. It can
be the extended subject in ‘artificial photosynthesis’ in the electron transfer point of view. We
will explain the experimental evidence and describe the effect of diverse factors such as dielectric
constant of solvent, counter ions and temperature etc.

40
41
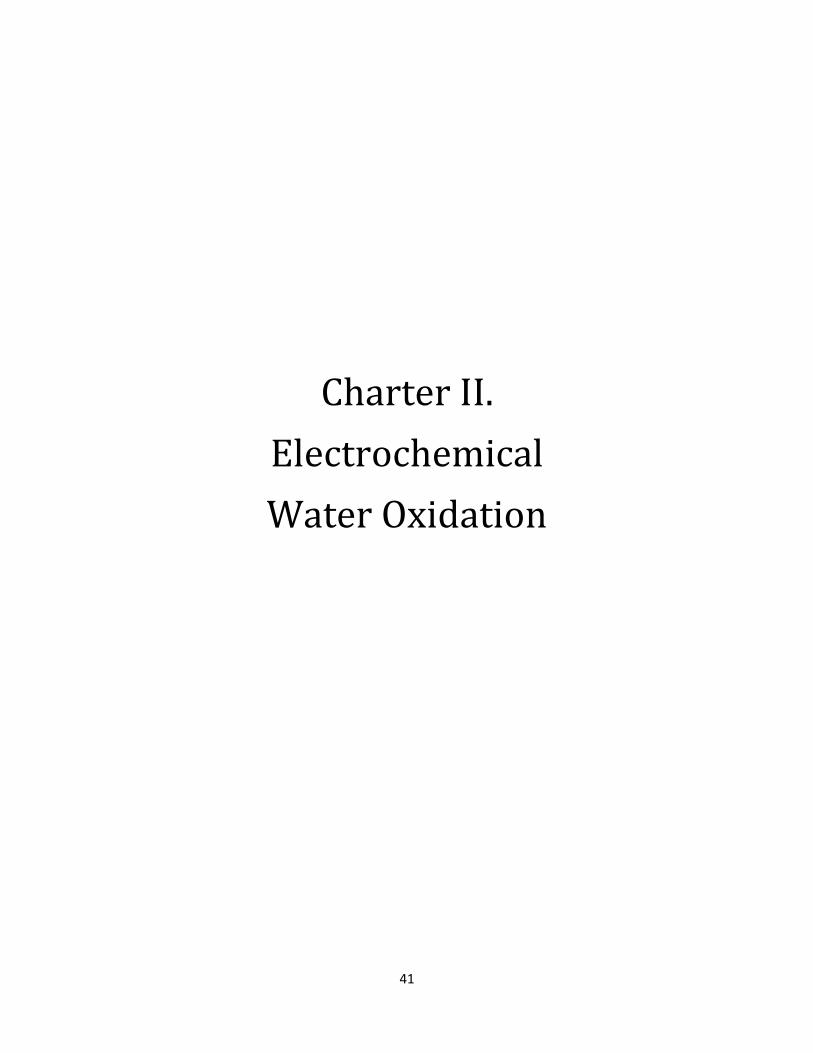
Charter II.
Electrochemical
Water Oxidation

42

43
2. Electrochemical Water Oxidation
This chapter is about the water oxidation using copper complexes as catalysts. The Cu (II)
complex, CuIIOPBI has been investigated for electrochemical water oxidation in 2015 by Llobet.
Recently, our lab collaborated with Prof. Abhishek Dey to extend the study of the Cu (II) complex,
having different electron donating and withdrawing substituent. In EPR spectro-
electrochemical point of view, the studies helped to sequence the elementary electrochemical
and chemical events leading towards the O2 formation selectively at the copper center.
Therefore, the study of OER and mechanism of water oxidation using CuIIOPBI has been
submitted for publication (Title : Ligand Radical Mediated Water Oxidation by a family of
Copper o-Phenylene Bis-Oxamidate Complexes)
Here, I summarized the paper which I contributed as a 3rd author. In addition, I put some trials
which we applied in a photocatalytic system using a photosensitizer and a reversible electron
acceptor to light activate the copper catalyst. Even though the photocatalytic system was not
successful, it led us to a new finding that we discuss in Chapter 3.
2.1. Introduction
Water oxidation reaction (WOR) is indisputably one of the main hurdles in developing sustainable
ways to store solar energy.[66–68] This half reaction provides the electrons and protons for further
synthesis of H2 or reduction of CO2 in energy rich compounds.[69,70] In Nature, a Mn4Ca cluster,
known as the Oxygen Evolving Complex, located at the heart of Photosystem II, is the locus where
this reaction takes place.[1,71] Both the advancement on the functioning of this enzyme and effort
of chemists to develop robust catalysts are bringing this target closer to reality.[2,72] If much
success has been achieved with ruthenium and iridium complexes in this quest, there is still an
urgent need to elaborate cost-efficient catalysts based on more abundant metal.[73–76]
While, close structural mimics of the OEC have been achieved however their catalytic reactivities
have not met our expectations yet.[77,78] On the contrary, significant progress in catalytic water
oxidation has been made with iron, cobalt, and manganese complexes in the homogeneous
medium by the addition of chemical oxidants such as Cerium (IV) or Ruthenium (III) salts.[47–49]

44
Recently, copper complexes have joined the short list of molecular catalysts for the WOR.[54,79]
Reasons behind this stem probably from the copper oxygenases functions where O2 activation
leads to the cleavage of the O-O bond leading to highly oxidized copper species.[80] Hence
reversing the activation steps from H2O to form O-O bond is an attractive perspective. Mayer and
coworkers, first exemplified such strategy in the electrocatalytic OER with a dinuclear bipyridine
CuII di-μ-hydroxo.[54] While, Meyer and coll. discovered that single site copper complexes with
the particularity of having deprotonated amido functions in the coordination sphere were
effective electrocatalysts for O2 release.[79] Mechanistically, a Cu (III) intermediate was clearly
depicted. However, no clear spectroscopic signature has yet been unraveled for the formal
Cu (IV) active catalytic species.[79] An alternate electronic structure proposed for this
intermediate is a Cu (III)-ligand radical species. More recently Llobet and coworkers have
reported on the electrocatalytic water oxidation with a copper (II) bis-oxamidate complex.[55,81]
Here too, a Cu (III)-radical species has been invoked in the oxygen-oxygen bond formation. The
authors put forward an original mechanism for the O-O bond formation tagged as SET-WNA
(Single Electron Transfer - Water Nucleophilic Attack), where no direct Cu-O intermediate is
pertained during the catalytic cycle.[55] Such a proposal has caught our attention and we have
been interested to use electrochemical techniques coupled to EPR spectroscopy to gain insights
in the mechanistic routes for the O2 formation in the SET-WNA scenario.[55]
Polyanionic chelating ligands were found to stabilize the unusual Cu (III) oxidation state as
evidenced with o-pheylene-bisamidate ligands.[82,83] Further studies also evidenced that these
families of ligands could be the siege for competitive ligand vs. metal centered redox behavior
depending on the substitution pattern on the aromatic ring.[53,84] The recent findings that in basic
medium the single site copper (II) bisoxamidate (OPBI) complexes were potential candidates for
the WOR have prompted us to interrogate the electronic properties of the activated forms.
The oxamate dianion can be used to make mono and polynuclear complexes by formation of
either a bidentate or a bis-bidentate metal coordination. It is well known that the transition metal
ions are stable in high oxidation states due to the deprotonation of amide nitrogen atoms which
are strong sigma and pi donating ligands. Cu (II) and Ni (II) complexes with oxamide-based ligand
are examples for the stabilized high oxidation states of the metal ions.[85] Scheme 2.1. shows the

45
mononuclear oxamato-copper (II) complexes which coordinate to divalent to copper via
carboxylate (A) and N-amido (B) groups.[86]
Unfortunately, some limitations have been mentioned that such as the easy hydrolysis of
oxamato groups.[86,87] To solve these problems, N,N'-bis(coordinating group-substituted)
oxamides are desirable since they are more stable towards hydrolysis. Polar pendant arms can
help to improve solubility. Moreover, the Cu (II) complexes, which include substituted oxamide
having five- or six-membered chelate rings, the dissociation and coordination of the amide group
might be occurring simultaneously in low pH range.[87–89]
The Cu (II) complex, CuIIOPBI has been investigated recently for electrochemical water oxidation.
In 2015, Llobet and co-workers reported the tetraamidate copper complex L1Cu (where L1 is the
ligand N1,N1′-(1,2-phenylene)bis(N2-methyloxalamidate)) as WOC.[55]
Scheme 2-1 Mononuclear oxamato-copper(II) complexes : via (A)
carbonyl and carboxylate and (B) carbonyl oxygen atoms.

46
The modified ligands which incorporate more electron donating substituents on the phenyl ring
play a crucial role in the catalytic performance. The results show that the overpotential decreased
from 700 mV to 170 mV when the ligand is substituted with strong electron donating groups. (L1
→ L4, scheme 2-2). A catalytic mechanism was proposed based on free energy calculation and
determined ligand oxidation as important step as shown in scheme 2-3.[55]
Scheme 2-2 Copper complexes with different ligand structures together with their
overpotential and turnover frequency for electrocatalytic water oxidation.
Scheme 2-3 Calculated catalytic cycle. Free energy changes for reaction steps occurring at the electrode are indicated explicitly in volts (red) and for steps in solution are indicated in kcal/mol (blue). [55]

47
In this study, we focus on the development of such catalysts based on earth-abundant copper
complexes. The synthesis and characterization of a monomeric Cu (II) complex with tetraanionic
chelating ligands N,N’-o-phenylenebis(methylamide) are described. The electrochemical
behavior of this complex was investigated by cyclic voltammetry (CV) and electrocatalytic activity
for water oxidation was observed. The study of OER and mechanism of water oxidation using
CuIIOPBI was investigated by EPR spectro-electrochemistry. In addition, considering its properties
as electrocatalyst, it was studied in a photocatalytic assay for water oxidation comprising of Ru-
based photosensitizer and diverse electron acceptors to find out whether dioxygen can be
evolved or not. The measurement of the dioxygen gas was performed by a Clark Electrode.

48
2.2. Experimental methods
2.2.1. Synthesis of Copper complex
The synthesis was performed in 2 steps : Synthesis of ligand (A → B), complexation of metal and
ligand (B → C). In the synthesis procedure B → C, the metal complexes, Cu (II) was prepared by
treating the dissolved proligand in MeOH with a base (tetramethylammonium hydroxide, TMAOH)
followed by the addition of the corresponding metal salt (Cu(ClO4)2 · 6H2O).[82]
2.2.2. Electron acceptors
Sacrificial electron acceptors were used to oxidatively quenched the triplet state of the
photosensitizer generating thereby a highly oxidizing species. The following examples are several
typical electron acceptors that I used in photosystem studies by taking account the solvent effect
and verifying the electron transfer using diverse techniques.
i) Methylviologen (MV2+)
Methylviologen (N,N’-dimethyl-4,4’-bipyridinium dichloride, the dication notated as MV2+) is and
widely used as a reversible electron-acceptor. In the electrochemical behavior of methylviologen,
MV2+ reduce by a reversible one-electron reaction to a strongly colored blue radical cations (MV.+,
Figure 2-1 Synthesis procedure, A→ B. Synthesis of Ligand, B→ C. Complexation of Cu (II) Complex (CuIIOPBI).

49
λmax = 600 nm, ε = 14000 M-1cm-1) then it reduces further to the neutral, which is fully reduced
form (MV0).[90,91] (Scheme 1-1.) MV2+ has been widely used in photoinduced electron transfer
studies.[92]
ii) Ruthenium Hexamine (RH3+), [Ru(NH3)6]3+
Ruthenium hexamine (RH3+), [Ru(NH3)6]Cl3 is also using as an electron acceptor and it is useful to
study transient absorption. In the visible region, RH does not present any marked absorption
bands in the visible region in both its oxidized and reduced forms.[93] As shown in Scheme 1-2,
upon excitation of [Ru(bpy)3]*2+ as chromophore, it reversibly accepts and an electron to
generate [Ru(bpy)3]3+.
Scheme 2-4 Accessible charge state of methylviologen.
Scheme 2-5 Chemical structure of [Ru(NH3)6]3+ (above) and the redox chemical equation (bottom).

50
iii) 4-nitrobenzenediazonium tetrafluoroborate (NBD)
The reduced form of diazonium (Dediazonation) leads to aryl radical and dinitrogen. The aryl
radical is highly reactive and recently in photochemistry the transfer photo-induced charge to the
diazonium that produce radical form has been studied.[94] It is used as an irreversible electron
acceptor. Indeed, upon accepting an electron from the excited state of the photosensitizer it
forms a radical that ultimately degrades.
iv) Persulfate (Pers)
Persulfate (Pers, S2O82-) is used as a sacrificial electron acceptor. It accepts a first electron to form
the sulfate radical (SO4.-). The latter is highly oxidizing and can act as an electron acceptor.[95,96] It
has been studied to be employed in promoting light-driven water oxidation system because as
an irreversible electron acceptor, without the recombination or reverse electron transfer, it is
useful to investigate the kinetic study of series steps in the catalytic process.[18]
Scheme 2-6 Chemical structure and its reduced form of 4-nitrobenzenediazonium tetrafluoroborate.
Scheme 2-7 Reduced form of persulfate.
51
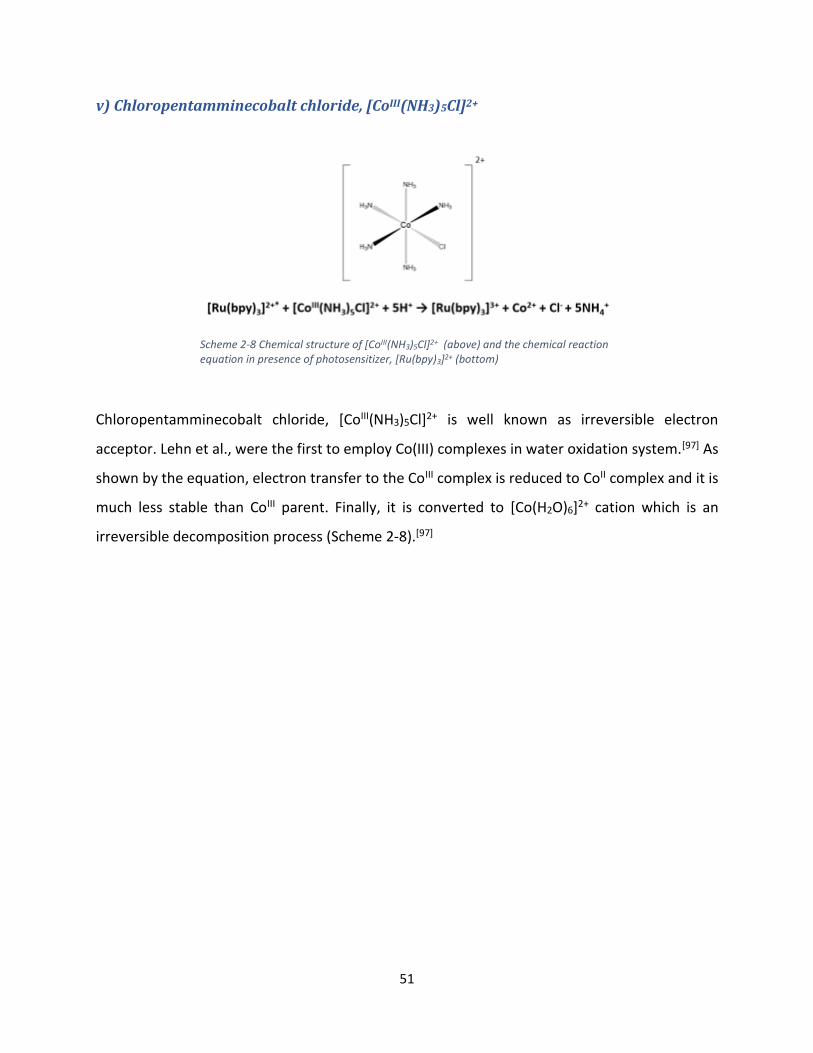
v) Chloropentamminecobalt chloride, [CoIII(NH3)5Cl]2+
Chloropentamminecobalt chloride, [CoIII(NH3)5Cl]2+ is well known as irreversible electron
acceptor. Lehn et al., were the first to employ Co(III) complexes in water oxidation system.[97] As
shown by the equation, electron transfer to the CoIII complex is reduced to CoII complex and it is
much less stable than CoIII parent. Finally, it is converted to [Co(H2O)6]2+ cation which is an
irreversible decomposition process (Scheme 2-8).[97]
Scheme 2-8 Chemical structure of [CoIII(NH3)5Cl]2+ (above) and the chemical reaction equation in presence of photosensitizer, [Ru(bpy)3]2+ (bottom)
52
2.3. Characterizations of CuIIOPBI
2.3.1. Cyclic Voltammetry (CV)
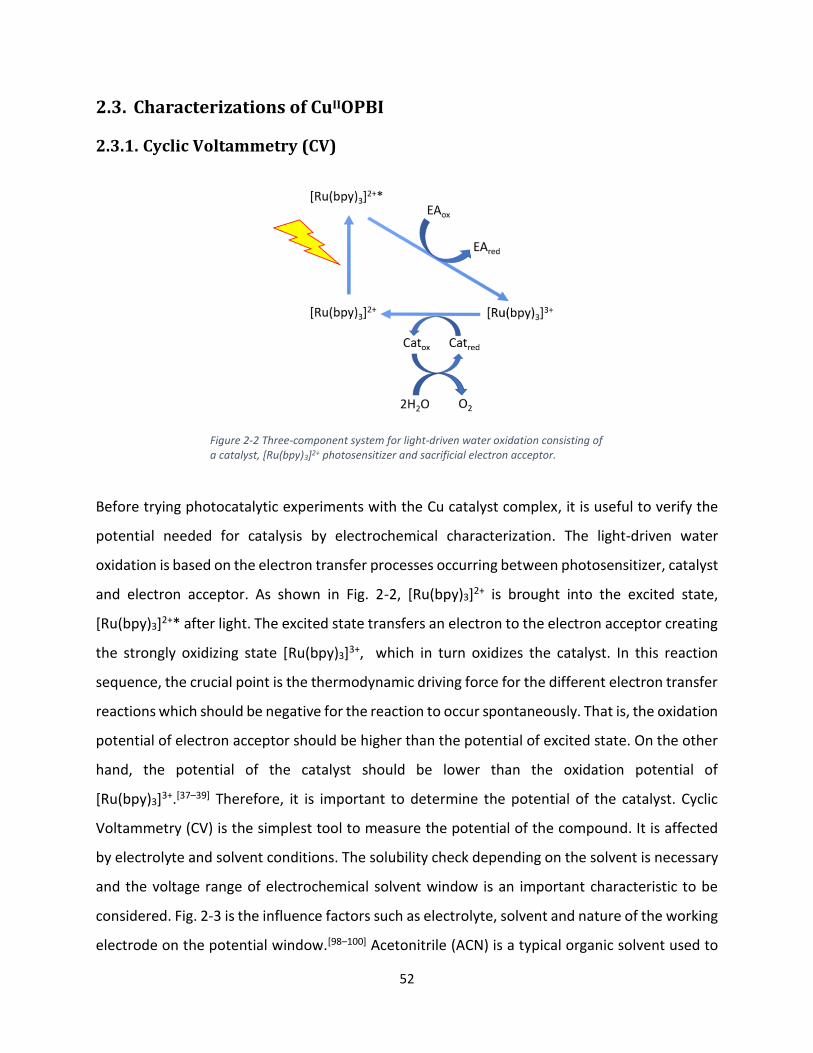
Before trying photocatalytic experiments with the Cu catalyst complex, it is useful to verify the
potential needed for catalysis by electrochemical characterization. The light-driven water
oxidation is based on the electron transfer processes occurring between photosensitizer, catalyst
and electron acceptor. As shown in Fig. 2-2, [Ru(bpy)3]2+ is brought into the excited state,
[Ru(bpy)3]2+* after light. The excited state transfers an electron to the electron acceptor creating
the strongly oxidizing state [Ru(bpy)3]3+, which in turn oxidizes the catalyst. In this reaction
sequence, the crucial point is the thermodynamic driving force for the different electron transfer
reactions which should be negative for the reaction to occur spontaneously. That is, the oxidation
potential of electron acceptor should be higher than the potential of excited state. On the other
hand, the potential of the catalyst should be lower than the oxidation potential of
[Ru(bpy)3]3+.[37–39] Therefore, it is important to determine the potential of the catalyst. Cyclic
Voltammetry (CV) is the simplest tool to measure the potential of the compound. It is affected
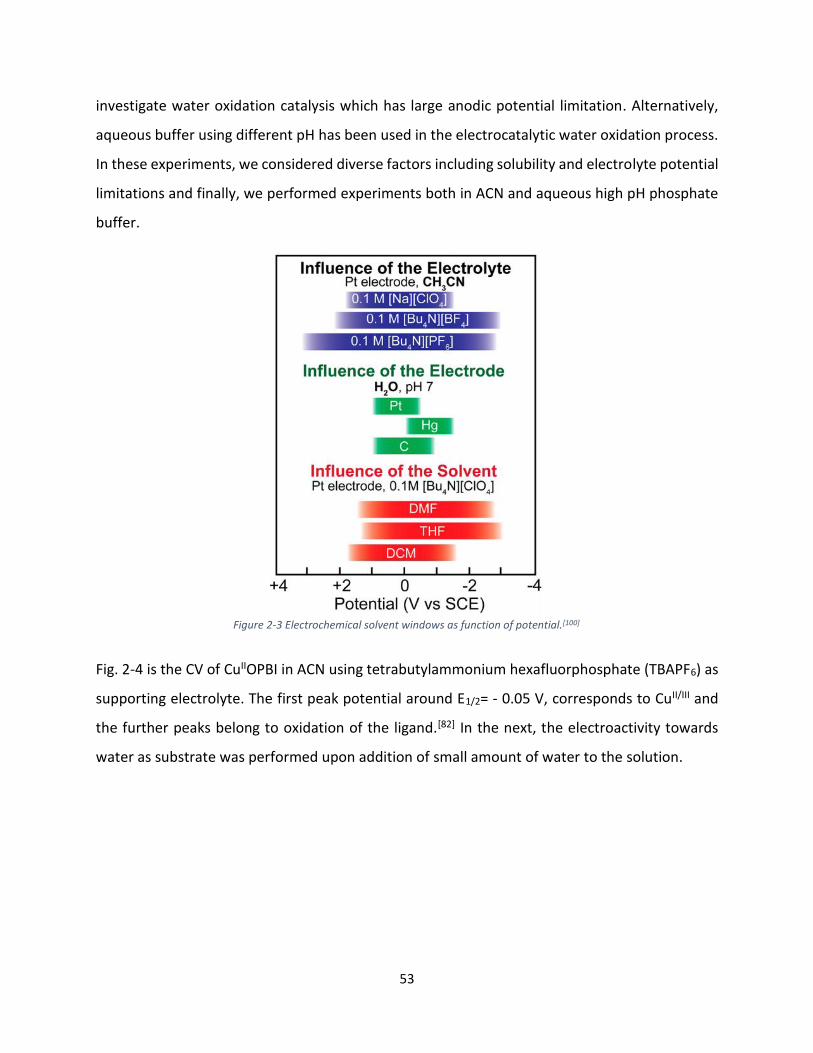
by electrolyte and solvent conditions. The solubility check depending on the solvent is necessary
and the voltage range of electrochemical solvent window is an important characteristic to be
considered. Fig. 2-3 is the influence factors such as electrolyte, solvent and nature of the working
electrode on the potential window.[98–100] Acetonitrile (ACN) is a typical organic solvent used to
Figure 2-2 Three-component system for light-driven water oxidation consisting of a catalyst, [Ru(bpy)3]2+ photosensitizer and sacrificial electron acceptor.
53
investigate water oxidation catalysis which has large anodic potential limitation. Alternatively,
aqueous buffer using different pH has been used in the electrocatalytic water oxidation process.
In these experiments, we considered diverse factors including solubility and electrolyte potential
limitations and finally, we performed experiments both in ACN and aqueous high pH phosphate
buffer.
Fig. 2-4 is the CV of CuIIOPBI in ACN using tetrabutylammonium hexafluorphosphate (TBAPF6) as
supporting electrolyte. The first peak potential around E1/2= - 0.05 V, corresponds to CuII/III and
the further peaks belong to oxidation of the ligand.[82] In the next, the electroactivity towards
water as substrate was performed upon addition of small amount of water to the solution.
Figure 2-3 Electrochemical solvent windows as function of potential.[100]

54
2.4. Electrochemical water oxidation
Fig. 2-5 shows the CV of CuIIOPBI in presence of water. The concentration of water was increased
from 1 % to 9 % which correspond to max. 4.95 M concentration based on Table 2-1. The CuII/III
peak shifts positive potential with decreasing current peak, which can be explained oxygen atoms
Figure 2-4 CV of 1 mM solutions of CuIIOPBI complex in ACN containing 0.1 M TBAPF6 as supporting electrolyte. GCE (WE), Pt (CE), E / V vs. SCE. v=100 mVs-1
Figure 2-5 CV of 1 mM solutions of CuIIOPBI complex at different water concentration 1, 3, 5, 7 and 9 % in ACN containing 0.1 M TBAPF6 as supporting electrolyte. GCE (WE), Pt (CE), E / V vs. SCE. v=100 mVs-1

55
on the ligand might have hydrogen bonding by water molecules. Thus, the stability of CuII/III with
ligand decreases as increasing the water concentration.
Table 2-1 Converted % concentration to M concentration
% 1 2 3 4 5 6 7 8 9
H2O (M) 0.55 1.10 1.65 2.20 2.75 3.30 3.85 4.40 4.95
The current peak increasing at potentials over 1.5 V vs. SCE that can be attributed to water
oxidation process. However, upon increasing the water concentration we noticed that intensity
of the observed current quickly reached a plateau. The results show that CuIIOPBI has modest
activity as electrochemical water oxidation catalyst in acetonitrile as solvent. Furthermore, the
potential at which water oxidation occurred in this ACN organic solvent condition was around 1.5
V vs. SCE, which is not available to be oxidized by the oxidized photosensitizer ([Ru(bpy)3]3+). In
order to verify whether water oxidation occurs at lower potential in aqueous buffer at high pH,
the CV was measured in high pH phosphate buffer as shown Fig. 2-6.[55]
Figure 2-6 CV of 1 mM solutions of CuIIOPBI complex in 0.1 M phosphate buffer pH 11.5, 12.0 and 12.5. GCE (WE), Pt (CE), E / V vs. SCE. v=100 mVs-1
56
In acidic buffer condition, the complex decomposed and the CuII/III oxidation peak potential
changed. However, in high pH buffer, the complex was stable, and the CV was measured in high
pH phosphate buffer in the pH range 11.5 - 12.6. The CuII/III potentials E1/2 = 0.25 V vs. SCE are pH-
independent with electrochemically quasi-reversible wave. It is explained by the formation of a
d8 Cu (III) square planar environment with low reorganizational energy, indicating both small
differences in their respective geometries and low potential from the tetraanionic nature of the
ligand.[55] The second oxidation peak potentials were pH-dependent shifting towards lower
values as function of pH, around 59 mV/pH. In addition, the amplitude of the second redox waves
indicate a large electrocatalytic activity for water oxidation to dioxygen. The proposed ligand-
based oxidation has been mentioned before in electrochemical point of view and the phenyl
substituents support further as the strong inductive effects influence on the complexes.
Theoretically, DFT calculations also confirm the ligand-based oxidation proposed.[55,81,101]
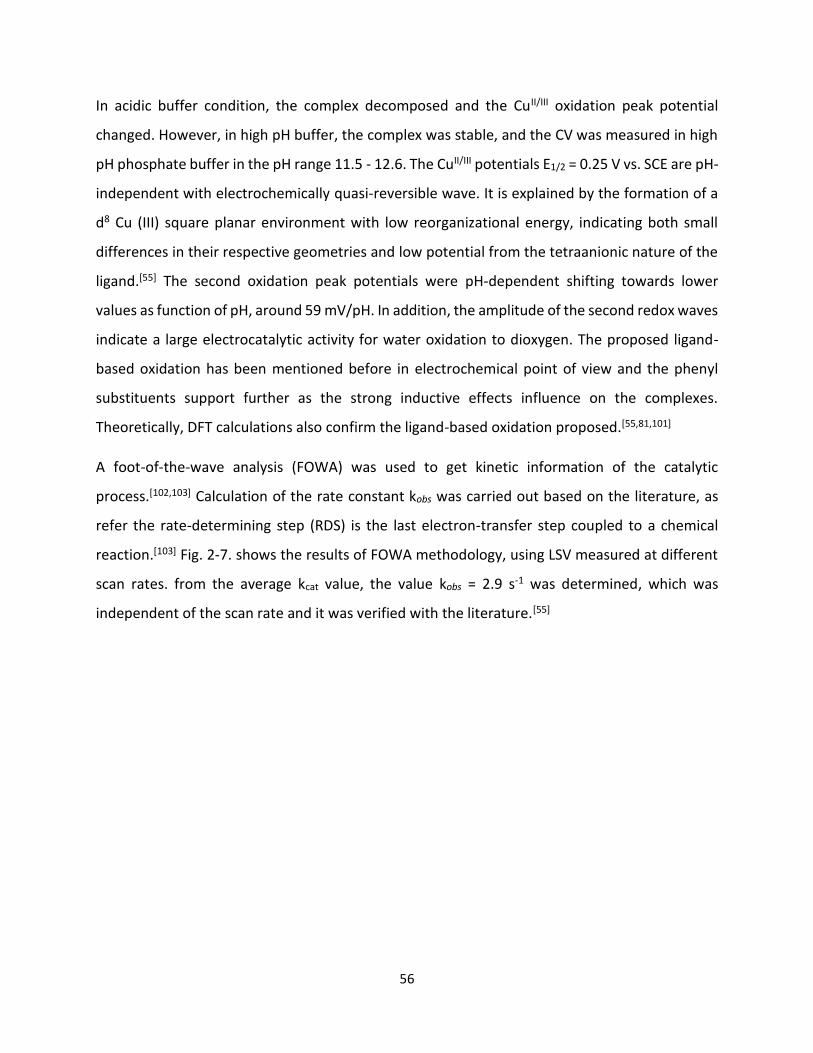
A foot-of-the-wave analysis (FOWA) was used to get kinetic information of the catalytic
process.[102,103] Calculation of the rate constant kobs was carried out based on the literature, as
refer the rate-determining step (RDS) is the last electron-transfer step coupled to a chemical
reaction.[103] Fig. 2-7. shows the results of FOWA methodology, using LSV measured at different
scan rates. from the average kcat value, the value kobs = 2.9 s-1 was determined, which was
independent of the scan rate and it was verified with the literature.[55]

57
Figure 2-7 Linear Sweep Voltammetries (LSV) of 1.0 mM CuIIOPBI at 0.1 M Phosphate buffer pH 11.5, at several scan rates : 5, 10, 20, 30, 40, 50 and 100 mVs-1, respectively (left). Foot of the wave analysis (FOWA) plotting icat/id vs. 1/(1+exp[F/RT](EP/Q°-E)) at each scan rate (right).
58
2.5. EPR spectro-electrochemical experiments
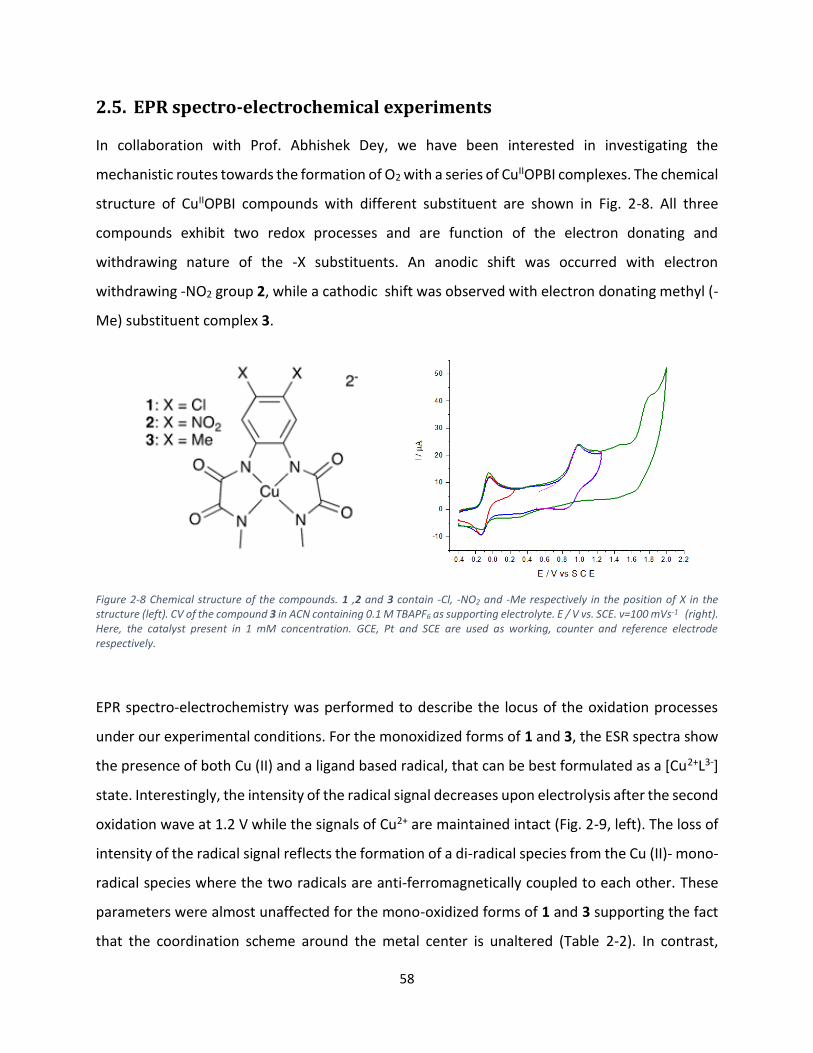
In collaboration with Prof. Abhishek Dey, we have been interested in investigating the
mechanistic routes towards the formation of O2 with a series of CuIIOPBI complexes. The chemical
structure of CuIIOPBI compounds with different substituent are shown in Fig. 2-8. All three
compounds exhibit two redox processes and are function of the electron donating and
withdrawing nature of the -X substituents. An anodic shift was occurred with electron
withdrawing -NO2 group 2, while a cathodic shift was observed with electron donating methyl (-
Me) substituent complex 3.
EPR spectro-electrochemistry was performed to describe the locus of the oxidation processes
under our experimental conditions. For the monoxidized forms of 1 and 3, the ESR spectra show
the presence of both Cu (II) and a ligand based radical, that can be best formulated as a [Cu2+L3-]
state. Interestingly, the intensity of the radical signal decreases upon electrolysis after the second
oxidation wave at 1.2 V while the signals of Cu2+ are maintained intact (Fig. 2-9, left). The loss of
intensity of the radical signal reflects the formation of a di-radical species from the Cu (II)- mono-
radical species where the two radicals are anti-ferromagnetically coupled to each other. These
parameters were almost unaffected for the mono-oxidized forms of 1 and 3 supporting the fact
that the coordination scheme around the metal center is unaltered (Table 2-2). In contrast,
Figure 2-8 Chemical structure of the compounds. 1 ,2 and 3 contain -Cl, -NO2 and -Me respectively in the position of X in the structure (left). CV of the compound 3 in ACN containing 0.1 M TBAPF6 as supporting electrolyte. E / V vs. SCE. v=100 mVs-1 (right). Here, the catalyst present in 1 mM concentration. GCE, Pt and SCE are used as working, counter and reference electrode respectively.

59
compound 2 forms solvent bound mono-radical when electrochemically oxidized at 0.9V
(Fig. 2-9, right). This was evidenced by a shift of the AII (Cu2+) value from 206 gauss (with a
gII = 2.14) in the initial copper (II) state to ~228 gauss (with a gII = 2.11) in the ligand mono-radical
state (Table 2-2). The second ligand based oxidation did not affect the Cu2+ signals and resulted
in the loss of the ligand radical signal.
The catalytic oxygen evolution by compound 1 was investigated in acetonitrile by adding different
amounts of an organic base (tetra butyl ammonium hydroxide, TBAOH) and the electro-catalytic
process was observed (Fig. 2-10). With the central goal to capture the electronic signatures of
the reactive intermediates under our homogeneous experimental conditions and furthermore to
decrypt the catalytic species responsible for the rate determining steps, we monitored the
control potential electrolysis the catalysts at two different oxidizing potentials (0.9 V and 1.2 V
vs. Ag/AgCl ) using the ESR spectroscopy.
Figure 2-9 (A) ESR spectra of compound 1 (left) and 2 (right) in ACN having 100 mM TBAP (black- initial, red- after controlledl potential electrolysis at 0.9 V and light green- after control potential electrolysis at 1.2 V). (B) ESR difference spectra (difference of the samples after respective oxidation from the initial without bulk electrolysis) of the same.

60
Figure 2-10 : Cyclic voltammograms of (A) 1, (B) 2 and (C) 3 (1 mM in acetonitrile containing 100 mM TBAP as electrolyte showing the homogeneous catalytic oxygen evolution with increasing amounts of TBAH). Glassy carbon (GC), platinum and a sealed aqueous Ag/AgCl (saturated KCl) are used as working, counter and reference electrode, respectively.
Indeed, as we have seen above ESR provides a clear picture of the electronic states of the oxidized
copper species together with the coordination scheme at the copper center. A common
observation for the follow up of the doubly oxidized solution was the persistent observation of a
copper(II) signal (Fig. 2-11). The EPR characteristics for compound 1 after 0.9 V and 1.2 V
electrolysis indicate that the signals from the Cu2+ center are altered from the initial state with gII
= 2.11 and AII (Cu2+) = 230 gauss to gII = 2.13 and AII (Cu2+) = 220 gauss (Fig. 2-11 and Table 2-2).
There is no marked difference between the 0.9 V data (non-catalytic) and 1.2 V data (catalytic)
providing support that a Cu2+(OH)-ligand mono-radical species is accumulated under catalytic
steady state. Hence, these electronic snapshots, provide an ECEC mechanistic scenario for 1,
where after the first the oxidation (E, generation of the ligand radical in the ESR), a hydroxide
binds to the Cu (II)-ligand mono-radical, (C, change in AII (Cu2+) and gII values) then a 2nd oxidation

61
to a Cu (II)-ligand di-radical state leading to the formation of the O-O bond like with a concerted
attack of an OH-.
In the case of 2, an initial C step occurs with the binding of OH- at the resting Cu (II) state as
detected by the shift of the g values from 2.14 to 2.12 upon addition of TBAH in the acetonitrile
solution (Table 2-2). The two consecutive oxidations (EE) matched with the formation mono-
radical and di-radical at 0.9 V and 1.2 V respectively. The consecutive hydroxide attack on the
hydroxide bound di-radical concludes to a CEEC mechanism as evidenced by the accumulation of
the Cu (II)(OH)-ligand di-radical state under steady state.
Figure 2-11 ESR spectrum (difference spectrum from initial with 7 mM TBAOH) of (A) compound 1, (B) compound 2, (C) compound 3 in presence of 7 mM TBAOH after bulk electrolysis has been done in two different potential (0.9 V and 1.2 V) using Hg-pool electrode as working electrode, sealed Ag/AgCl (aqueous, saturated KCl) and Pt electrode as reference and counter electrode respectively

62
Note that, any variation in the Cu (II) ligation (eg.-OOH) could have resulted in the shift of its ESR
signal. Two electrochemical oxidation sequences proceed for compound 3 forming the di-radical
where upon hydroxide ion bound to the resultant Cu (II)- ligand di-radical as detected by a shift
in the gII and AII (Cu2+) values. (Fig. 2-11, (C)) and Table 2-2). The O-O bond then completes an
EECC mechanism. The in-situ spectroelectrochemical investigations reveal that the mechanism
can vary substantially depending on the electronic structure of the ligand. The strong electron
withdrawing -NO2 substituents, entail the substrate -OH- binding in the resting state. The -Cl
substituents, a lesser electron withdrawing group, direct the substrate -OH- to bind in the
Cu (II)-ligand mono-radical species while the electron donating -Me substituents allow the
substrate binding only after two consecutive ligand oxidations.
Table 2-2 AII and gII values of the compounds in the absence and presence of TBAH and in initial and under catalytic conditions.
The mechanism of water oxidation in organic medium is investigated using spectro-
electrochemistry. The results show that the catalytic species involved in water oxidation are
Cu2+L2- ligand-diradical species. Furthermore, the mechanism shifts from CEEC to ECEC to EECC
as the substitution on the phenyl ring are made more electron donating (Scheme 2-9).
Species Compound 1 Compound 2 Compound 3
Without TBAOH
With TBAOH
Without TBAOH
With TBAOH
Without TBAOH
With TBAOH
AII gII AII gII AII gII AII gII AII gII AII gII
Initial 223 2.12 230 2.11 206 2.14 226 2.12 219 2.13 216 2.13
[email protected] 227 2.12 220 2.13 227 2.11 222 2.12 221 2.12 228 2.12
[email protected] 227 2.12 219 2.13 230 2.11 226 2.12 220 2.12 235 2.11

63
Scheme 2-9 Schematic representation of the formation of the hydroxide bound Cu (II) di-radical (responsible for water oxidation by the above-mentioned complexes, marked by green area).
64
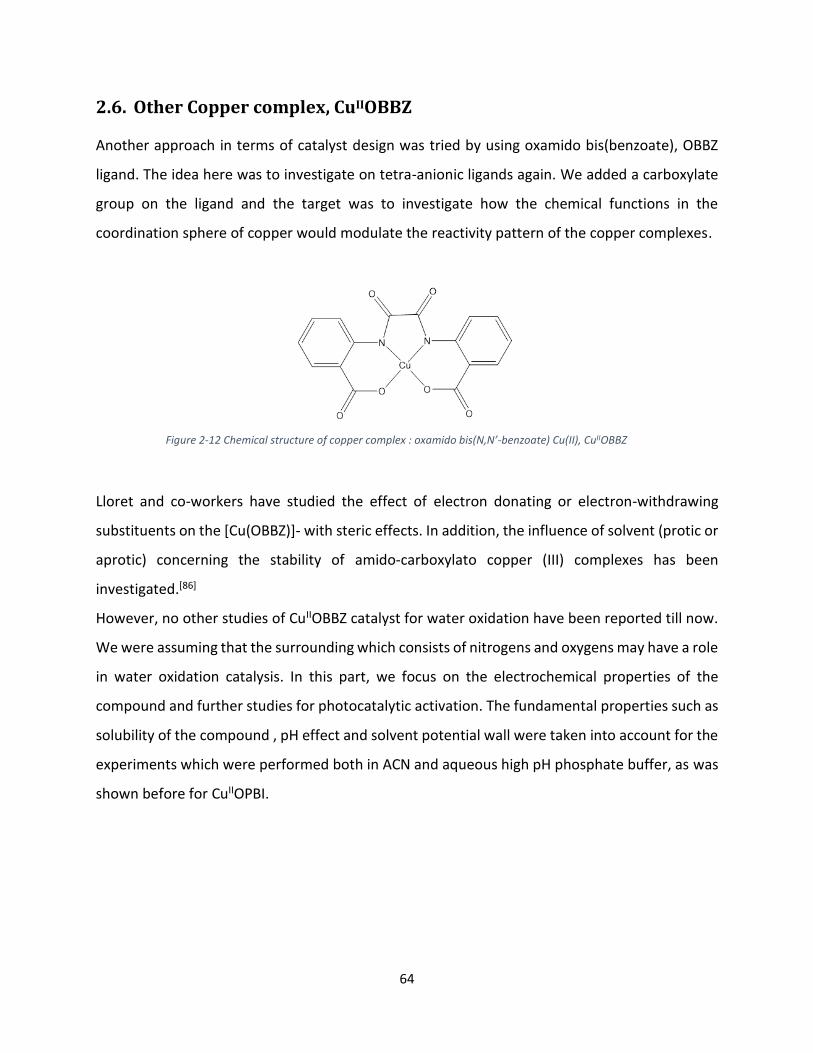
2.6. Other Copper complex, CuIIOBBZ
Another approach in terms of catalyst design was tried by using oxamido bis(benzoate), OBBZ
ligand. The idea here was to investigate on tetra-anionic ligands again. We added a carboxylate
group on the ligand and the target was to investigate how the chemical functions in the
coordination sphere of copper would modulate the reactivity pattern of the copper complexes.
Lloret and co-workers have studied the effect of electron donating or electron-withdrawing
substituents on the [Cu(OBBZ)]- with steric effects. In addition, the influence of solvent (protic or
aprotic) concerning the stability of amido-carboxylato copper (III) complexes has been
investigated.[86]
However, no other studies of CuIIOBBZ catalyst for water oxidation have been reported till now.
We were assuming that the surrounding which consists of nitrogens and oxygens may have a role
in water oxidation catalysis. In this part, we focus on the electrochemical properties of the
compound and further studies for photocatalytic activation. The fundamental properties such as
solubility of the compound , pH effect and solvent potential wall were taken into account for the
experiments which were performed both in ACN and aqueous high pH phosphate buffer, as was
shown before for CuIIOPBI.
Figure 2-12 Chemical structure of copper complex : oxamido bis(N,N’-benzoate) Cu(II), CuIIOBBZ
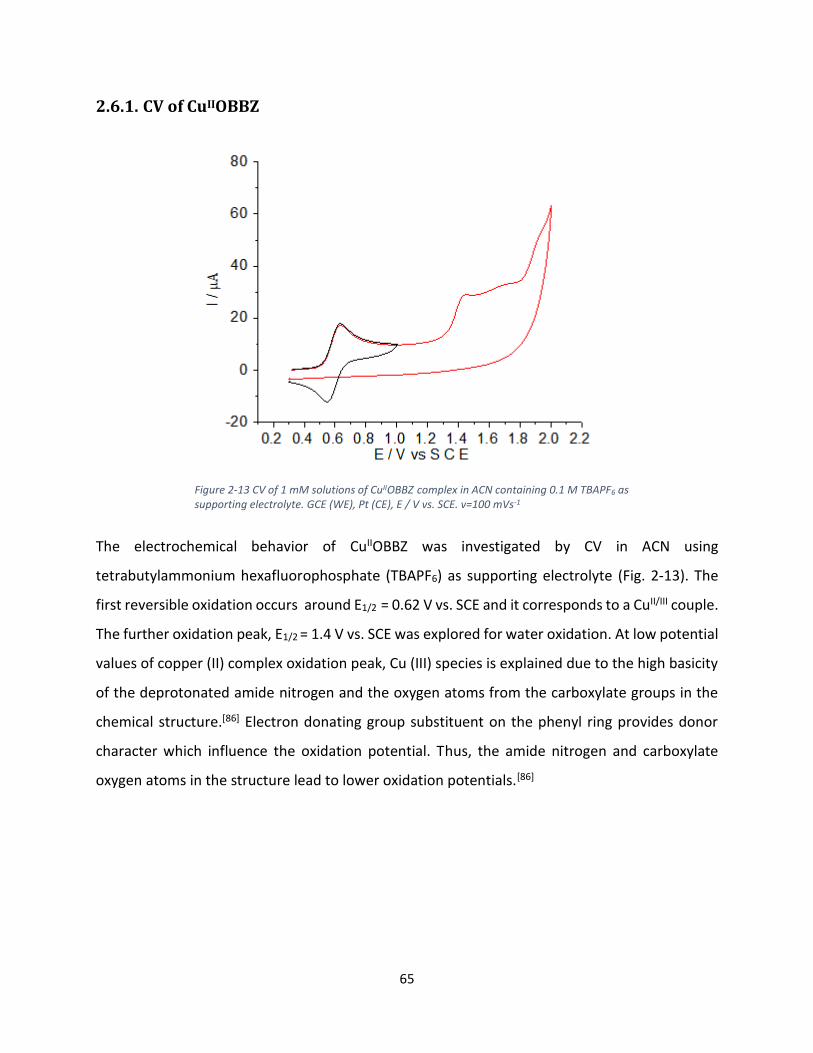
65
2.6.1. CV of CuIIOBBZ
The electrochemical behavior of CuIIOBBZ was investigated by CV in ACN using
tetrabutylammonium hexafluorophosphate (TBAPF6) as supporting electrolyte (Fig. 2-13). The
first reversible oxidation occurs around E1/2 = 0.62 V vs. SCE and it corresponds to a CuII/III couple.
The further oxidation peak, E1/2 = 1.4 V vs. SCE was explored for water oxidation. At low potential
values of copper (II) complex oxidation peak, Cu (III) species is explained due to the high basicity
of the deprotonated amide nitrogen and the oxygen atoms from the carboxylate groups in the
chemical structure.[86] Electron donating group substituent on the phenyl ring provides donor
character which influence the oxidation potential. Thus, the amide nitrogen and carboxylate
oxygen atoms in the structure lead to lower oxidation potentials.[86]
Figure 2-13 CV of 1 mM solutions of CuIIOBBZ complex in ACN containing 0.1 M TBAPF6 as supporting electrolyte. GCE (WE), Pt (CE), E / V vs. SCE. v=100 mVs-1

66
2.6.2. Electrochemical water oxidation by CuIIOBBZ
The second oxidation peak started at the potential over 1.4 V and the current kept increasing
with the concentration of water. It indicates that the catalytic wave could indeed indicate water
oxidation since the addition of water led to an oxidation process with pronounced wave.
By changing the electrolyte condition, 0.1 M phosphate buffer, in this case, the electrochemical
water oxidation was studied in different pH conditions. The pH conditions were restrained to high
pH range since at low pH ( < pH 8) the compound precipitated (Fig. 2-15). This had been
investigated in previous research which showed that at pH > 9 the complex is stable but lower
pH causes ligand protonation which renders the complex highly insoluble in aqueous solution.[86]
Thus, the CV was performed in the high pH range 9 < pH < 12 (Fig. 2-16). Under basic conditions,
at pH 9, a catalytic wave was observed at applied potentials above 1.2 V. This cannot be
attributed to deposition on the electrode as the electrode was polished after each CV scan.
However, unlike in ACN, oxidation peak was not reversible which could be explained with a fast
chemical reaction being coupled to the electrochemical process.[86]
Figure 2-14 CV of 1 mM solutions of CuIIOBBZ (TMA)2 complexes adding water concentration 1 % to 14 % in ACN containing 0.1 M TBAPF6 as supporting electrolyte. Potential range [0.3, 2.0 V] (right) and potential range [0.3, 1.2 V] (left). GCE (WE), Pt (CE), E / V vs. SCE. v=100 mVs-1 .

67
Fig. 2-17 shows CV of plot of the current at E = 1.377 V in dependence of the pH 9 - 12.5, which
corresponds the Fig. 2-16. By subtracting current values between blank and CuIIOBBZ, the
potential was determined which corresponding to the maximum current value at pH 9. A plot of
the catalytic current vs. solution pH indicates a current increase over the whole basic conditions.
Figure 2-15 Decomposition and precipitation in low pH of the solution, pH < 8.
Figure 2-16 CV of CuIIOBBZ in 0.1 M phosphate buffer at pH 9, 10, 11 and 12. GCE (WE), Pt (CE), E / V vs. SCE. v=100 mVs-1 .

68
Figure 2-17 . CV of Plot of the current ipc at E = 1.377 V in dependence of the pH. (The data from Fig. 2-16.).
Figure 2-18 Overpotential at pH 12.3 (ɳ = 1.528 – 0.51 = 1.018 V) (left), water electrolysis electrode potentials with pH (right).
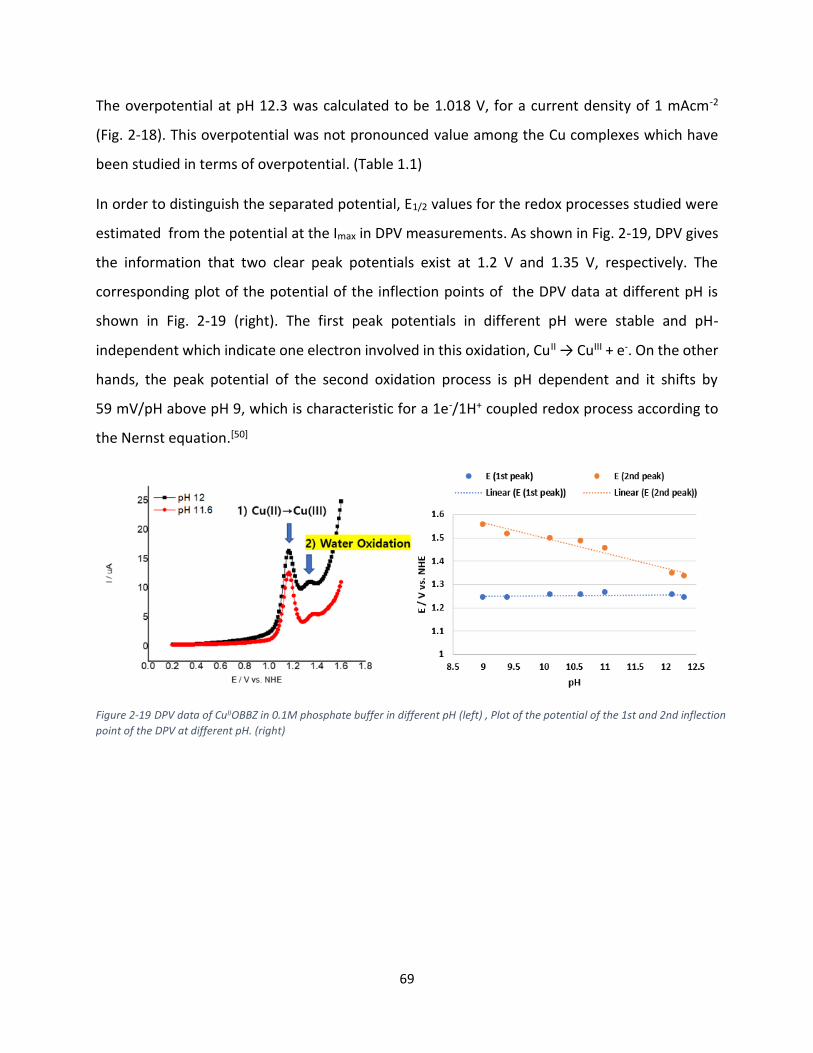
69
The overpotential at pH 12.3 was calculated to be 1.018 V, for a current density of 1 mAcm-2
(Fig. 2-18). This overpotential was not pronounced value among the Cu complexes which have
been studied in terms of overpotential. (Table 1.1)
In order to distinguish the separated potential, E1/2 values for the redox processes studied were
estimated from the potential at the Imax in DPV measurements. As shown in Fig. 2-19, DPV gives
the information that two clear peak potentials exist at 1.2 V and 1.35 V, respectively. The
corresponding plot of the potential of the inflection points of the DPV data at different pH is
shown in Fig. 2-19 (right). The first peak potentials in different pH were stable and pH-
independent which indicate one electron involved in this oxidation, CuII → CuIII + e-. On the other
hands, the peak potential of the second oxidation process is pH dependent and it shifts by
59 mV/pH above pH 9, which is characteristic for a 1e-/1H+ coupled redox process according to
the Nernst equation.[50]
Figure 2-19 DPV data of CuIIOBBZ in 0.1M phosphate buffer in different pH (left) , Plot of the potential of the 1st and 2nd inflection
point of the DPV at different pH. (right)

70
Controlled potential electrolysis experiment (CPE) at an applied potential of 1.4 V was performed
using carbon plate working electrode at pH 11.3. However, as shown in Fig. 2-20, the current
decreased as function of time. In addition, deposition on the working electrode was observed
visually. These phenomena give a reasonable evidence that the catalyst is not stable to function
as homogeneous catalyst during catalysis.
Figure 2-20 Electrolysis of 1.0 mM CuIIOBBZ, Time (s) vs. Current (A). Carbon plate (WE), Pt (CE) and SCE (RE), respectively.

71
2.7. Photochemical water oxidation
2.7.1. Photophysical studies between [Ru(bpy)3]2+ and Copper complex
We have examined issue relating to the behavior of the CuIIOPBI complex by laser flash photolysis.
The effect of ion pairing between [Ru(bpy)3]2+ sensitizer and the copper complex, CuIIOPBI was
investigated to go toward the photocatalytic events. Emission kinetics at 610 nm of the mixture
in different concentration of CuIIOPBI are shown in Fig. 2-21. Without an electron acceptor, the
quenching of excited state ([Ru(bpy)3]2+*) occurred in presence of the copper(II) complex. The
quenching takes place in ion-paired species, which is not an oxidative quenching as the yield of
Ru (I) is much lower than 2 % (Fig. 2-22). Note that, the mixture had no reaction in the dark.
1,0
2,0
3,0
4,0
5,0
6,0
7,0
-1000 0 1000 2000 3000 4000 5000 6000 7000 8000
Volts/1
0-2
Time/ns
Figure 2-21 Emission kinetics at 610nm. 35uM of [Ru(bpy)3]2+ with 10 (orange), 20 (pink), 30 (blue), 60 (green) uM of CuIIOPBI in ACN, degas conditions.; The life time get decreased as increasing the concentration of CuIIOPBI.(800, 572, 405 and 277 ns, respectively.)

72
These results were already interesting to investigate further the photophysical events in
presence of an electron acceptor. Interestingly, when I add 10 mM of methyl viologen as a
reversible electron acceptor in the mixture, I notice that the mixture turns blue, a colour typical
of the methyviologen radical. Fig. 2-23 shows absorption kinetics of the mixture in the presence
of methyl viologen at 450 nm. The blue spectra, which consist of 35 µM of [Ru(bpy)3]2+ with 20
µM of CuIIOPBI in the presence of 10 mM of methyl viologen. As we can see, we recover the band
at 450 nm very rapidly with the formation of a small absorption peak. A plausible route for this
light induced electron transfer process is represented in Fig. 2-23.
Figure 2-22 Absorption kinetics at 450 nm (left) and 510 nm (right) ; 35 µM of [Ru(bpy)3]2+ with 30 uM of CuIIOPBI. The yield of Ru (I) from [Ru(bpy)3]2+* was calculate based on the value on the peak.
Figure 2-23 Absorption kinetics at 450 nm (left) and the possible scheme (right). 35 µM of [Ru(bpy)3]2+ with 10 (green) and 20 (blue) µM of Cu OPBI in the presence of 10 mM of methyl viologen.

73
2.7.2. Oxygen measurement by Clark Electrode
Based on the principle of photocatalysis presented in the previous part ‘2.3.1’ and Fig. 2-2., a
potential for oxidation of CuIIOPBI in 0.1 M phosphate buffer, of > 0.8 V vs. SCE was required
which is compatible with using [Ru(bpy)3]2+ as photosensitizer. The Clark Electrode as shown in
the Fig. 2-24 was used to detect the formation if any of O2.
For the different combinations of photosensitizers and electron acceptors and copper complexes
no oxygen evolution was detected under irradiation. The summary of the results is gathered in
Table 2-3 and Fig. 2-25 .
Figure 2-24 Experimental set-up : Clark Electrode before (left) and under illuminating (right)
Figure 2-25 Oxygen measurement by Clark Electrode. 200 µM of [Ru(bpy)3]2+ as photosensitizer, 10 mM
NBD as electron acceptor and 100 µM of catalyst (CuIIOPBI) in 0.1 M phosphate buffer pH 11.5. At the
beginning, the solution was degassed until it reaches ‘zero (0)’ oxygen concentration then observes keeping
stable for 5 min. then turn on the light at the time point ‘800 sec.’

74
Table 2-3 The summary of Oxygen measurement by Clark Electrode, using Cu catalyst, CuIIOPBI
Another trial of photocatalysis using CuIIOBBZ was performed in the diverse combinations of
photosensitizers and electron acceptors. However, here too no oxygen evolution was evidenced.
The summary of results is shown in Table 2-4.
Table 2-4 The summary of Oxygen measurement by Clark Electrode, using Cu catalyst, CuIIOBBZ
Catalyst CuIIOBBZ
Photosensitizer [Ru(bpy)3]2+ [Ru(bpz)3]2+ [Ru(bpy)2(4-4'-(PO3H2)2bpy]
Electron Acceptor Pers NBD Pers
Electrolyte 0.1 M Phosphate buffer, pH 11.5
Results No evolution
Although these two copper complexes didn’t succeed to produce oxygen, surprisingly, we found
that the color of mixture changed in the dark. The mixture between [Ru(bpy)3]2+ sensitizer and
the copper complex or between [Ru(bpy)3]2+ and MV2+ nothing happened in the dark. We
discovered that the color of mixture of the electron acceptor (methylviologen) and the copper
complex changed to a blue color, typical to the formation of methylviologen radical. Such an
intriguing observation will constitute the study of the next chapter.
Catalyst CuIIOPBI
Photosensitizer [Ru(bpy)3]2+ [Ru(bpy)3]2+ [Ru(bpy)2(4-4'-(PO3H2)2bpy]
[Ru(bpy)2(4-4'-(PO3H2)2bpy]
Electron Acceptor NBD [CoIII(NH3)5Cl]2+ [CoIII(NH3)5Cl]2+ Pers
Electrolyte 0.1 M Phosphate buffer, pH 11.5
Results No evolution

75
2.8. Conclusions & Perspectives
In conclusion, we have observed the electrocatalytic water oxidation with a CuIIOPBI in both
organic solvent and aqueous medium. Other copper complex, CuIIOBBZ was also studied for the
electrochemical water oxidation catalysis. However, due to the deposition on the electrode
during electrolysis, it couldn’t be proved as homogeneous catalyst.
Concerning the CuIIOPBI, a copper (II) bis-oxamidate complex having different electron donating
and withdrawing substituent was investigated. The study of OER and mechanism of water
oxidation in organic medium was studied using spectro-electrochemistry in collaboration with
Prof. Abhishek Dey. The results show that the catalytic species involved in water oxidation are
Cu2+L2- ligand-diradical species. Furthermore, the mechanism shifts from CEEC to ECEC to EECC
as the substitution on the phenyl ring are made more electron donating.
Furthermore, it was investigated the photochemical water oxidation catalysis by using Ru-based
photosensitizers and diverse electron acceptors using laser flash photolysis and Clark electrode.
Even though the oxygen evolution was not detected, we discovered that the color of mixture of
the electron acceptor and the copper complex changed to a blue color, typical to the formation
of methyl viologen radical. This will be carried out in the Chapter 3, ‘ion pair formation’.

76

77
Chapter III.
Ion Pair Formation

78

79
3. Ion pair formation
In the previous Chapter 2, we discussed about Cu complexes as electrocatalyst. We found
something very intriguing in the process of light activation of the molecular complex with a
photosensitizer and an electron relay. First, the effect of ion pairing between [Ru(bpy)3]2+
sensitizer and the [CuIIOPBI]2- complex was investigated without an electron acceptor. The
quenching of excited state ([Ru(bpy)3]2+*) occurred by the Cu complex while no electron transfer
reaction took place in the dark. The addition of a reversible electron acceptor such as
methylviologen (MV2+) in the previous mixture led to a drastic color change to a blue solution
in the dark. No perceptible color change was observed for the mixture between [Ru(bpy)3] 2+
sensitizer and the Cu complex or between [Ru(bpy)3]2+ and MV2+. This color change was
reproduced when the Cu complex was mixed with methylviologen (MV2+) in ACN, under
anaerobic conditions. In this chapter, we investigated the ion pair formation phenomenon
between the oppositely double charged species of Cu complex catalyst and an electron acceptor.
The electron transfer pathway is the main target of this study.
3.1. Introduction
The presence of sensitizer, electron donor (or acceptor) and catalyst are typical conditions in the
study of photocatalytic activity. Depending on their properties such as potentials, electrical
charge numbers, absorption wavelength and competition reactions etc., choosing carefully
suitable combinations is necessary. A possible phenomenon to occur is ion pair formation
between these elements which might affect the bimolecular electron transfer. For the ion pair
formation, the charge number of the anion and the cation is a main factor to consider together
with the dielectric constant of the solvent. In this study, the copper(II) complex, copper(II) N,N’-
o-phenylenebis (methylamide) [CuIIOPBI]2- , and methylviologen (MV2+) were used which are
dianionic and dicationic, respectively.
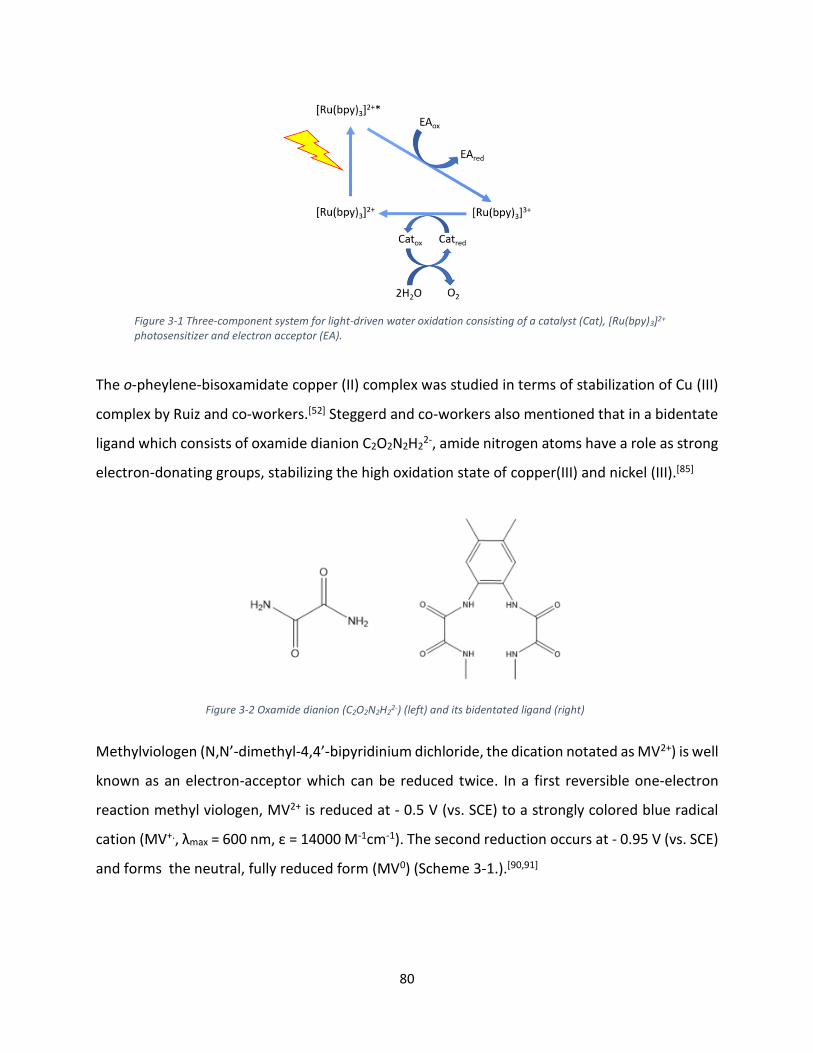
80
The o-pheylene-bisoxamidate copper (II) complex was studied in terms of stabilization of Cu (III)
complex by Ruiz and co-workers.[52] Steggerd and co-workers also mentioned that in a bidentate
ligand which consists of oxamide dianion C2O2N2H22-, amide nitrogen atoms have a role as strong
electron-donating groups, stabilizing the high oxidation state of copper(III) and nickel (III).[85]
Methylviologen (N,N’-dimethyl-4,4’-bipyridinium dichloride, the dication notated as MV2+) is well
known as an electron-acceptor which can be reduced twice. In a first reversible one-electron
reaction methyl viologen, MV2+ is reduced at - 0.5 V (vs. SCE) to a strongly colored blue radical
cation (MV+., λmax = 600 nm, ε = 14000 M-1cm-1). The second reduction occurs at - 0.95 V (vs. SCE)
and forms the neutral, fully reduced form (MV0) (Scheme 3-1.).[90,91]
Figure 3-2 Oxamide dianion (C2O2N2H22-) (left) and its bidentated ligand (right)
Figure 3-1 Three-component system for light-driven water oxidation consisting of a catalyst (Cat), [Ru(bpy)3]2+ photosensitizer and electron acceptor (EA).

81
Figure 3-3 CV of Methyl Viologen (red) and Cu II/III of CuIIOPBI (blue).
As shown in Fig. 3-3, the first reduction potential of MV+/2+ , E1/2, MV+/2+ is lower than the potential
of CuII/III. Thermodynamically, MV2+ cannot oxidize CuII and these compounds were considered
good candidates as electron-acceptor for charge shifts studies in photocatalysis system. However,
upon mixture of all the ingredients to do photocatalysis we observed the formation of a MV+..
We tried to discover how this phenomenon occurs by investigating the photophysical study
between the Ru photosensitizer and the copper complex then the study of mixture MV2+ and the
Cu complex. The mixture of MV2+ and [CuIIOPBI]2- under argon condition in ACN, leads to radical
cation (MV+.) formation as evidenced by the blue color and by UV-Vis spectra.
Scheme 3-1 Accessible redox and charge states of methylviologen.
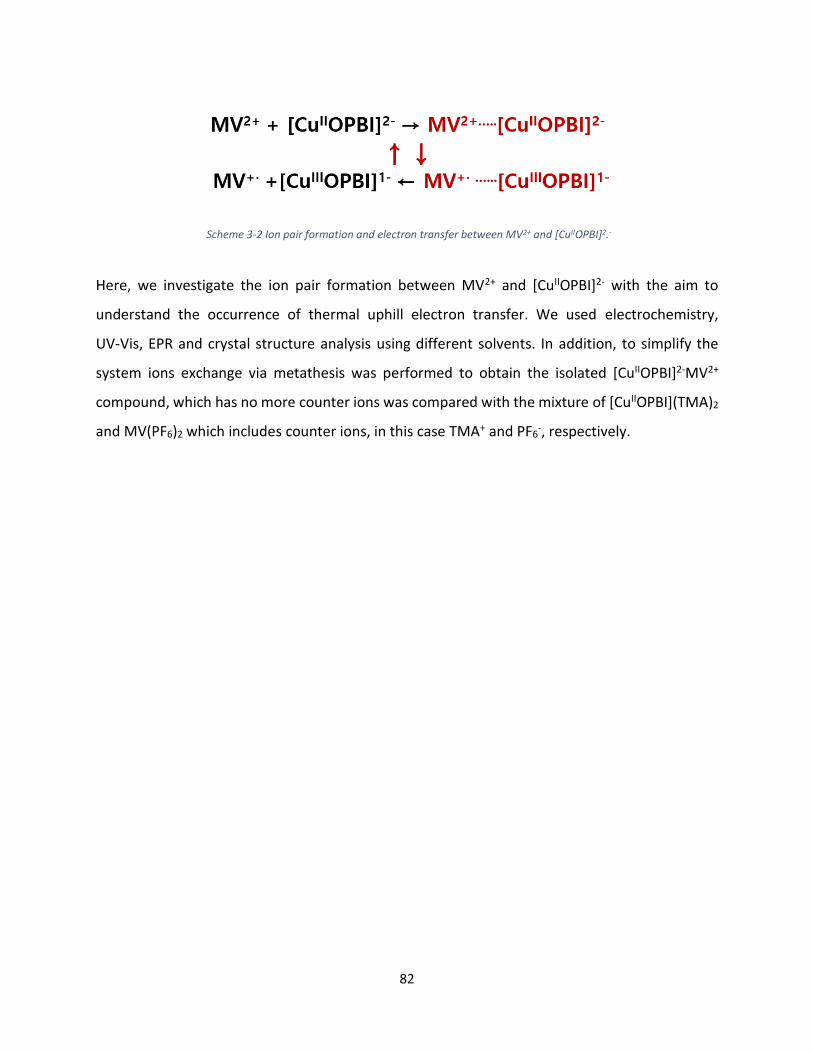
82
Here, we investigate the ion pair formation between MV2+ and [CuIIOPBI]2- with the aim to
understand the occurrence of thermal uphill electron transfer. We used electrochemistry,
UV-Vis, EPR and crystal structure analysis using different solvents. In addition, to simplify the
system ions exchange via metathesis was performed to obtain the isolated [CuIIOPBI]2-MV2+
compound, which has no more counter ions was compared with the mixture of [CuIIOPBI](TMA)2
and MV(PF6)2 which includes counter ions, in this case TMA+ and PF6-, respectively.
Scheme 3-2 Ion pair formation and electron transfer between MV2+ and [CuIIOPBI]2.-
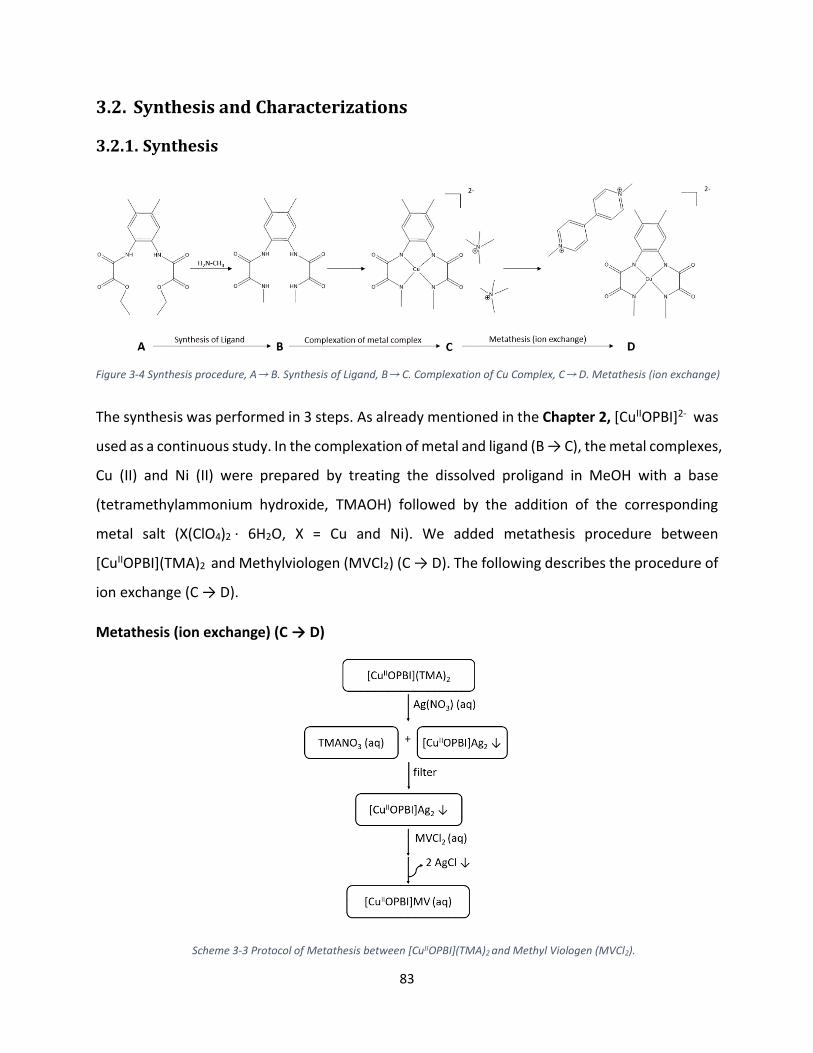
83
3.2. Synthesis and Characterizations
3.2.1. Synthesis
The synthesis was performed in 3 steps. As already mentioned in the Chapter 2, [CuIIOPBI]2- was
used as a continuous study. In the complexation of metal and ligand (B → C), the metal complexes,
Cu (II) and Ni (II) were prepared by treating the dissolved proligand in MeOH with a base
(tetramethylammonium hydroxide, TMAOH) followed by the addition of the corresponding
metal salt (X(ClO4)2 · 6H2O, X = Cu and Ni). We added metathesis procedure between
[CuIIOPBI](TMA)2 and Methylviologen (MVCl2) (C → D). The following describes the procedure of
ion exchange (C → D).
Metathesis (ion exchange) (C → D)
Figure 3-4 Synthesis procedure, A→ B. Synthesis of Ligand, B→ C. Complexation of Cu Complex, C→ D. Metathesis (ion exchange)
Scheme 3-3 Protocol of Metathesis between [CuIIOPBI](TMA)2 and Methyl Viologen (MVCl2).

84
To simplify the system ions exchange via metathesis was performed to obtain the isolated
[CuIIOPBI]MV compound, which has no more counter ions was compared with the mixture of
[CuIIOPBI](TMA)2 and MV(PF6)2 which includes counter ions, in this case TMA+ and PF6-,
respectively.
[CuIIOPBI](TMA)2 (309 mg, 0.6 mmol, 1.00 eq) was dissolved in water (20 mL). After addition of
AgNO3 (204 mg, 1.2 mmol, 2 eq.) the solution was stirred at room temperature for 10 min. A
precipitate was formed which is [CuIIOPBI]Ag2. After centrifugation, the brownish solid was
recovered and then dispersed in water. MVCl2 (154.2mg, 1 eq.) was used for the chemical
reaction to produce [CuIIOPBI]MV and the solid state AgCl was removed. The filtered solution
was treated by acetone for the slow vapor diffusion. The final product was obtained as black solid
precipitate and dried.
3.2.2. Characterizations
A) 1H NMR analysis of Ligand
Fig. 3-5 shows 1H-NMR spectrum of the ligand obtained in deuterated DMSO solvent. Each color
represents a set of protons as depicted on the figure. The signal assignment at δ 10.34 is
attributed to the two hydrogen (blue, H-NPh). The quadruplet signal assignment at δ 8.93 is
Figure 3-5 NMR spectra of ligand OPBI in DMSO solvent

85
attributed to the N-protons of the tetradentate ligand (sky blue, H-NMe) for two hydrogen. The
presence of signal assignment at δ 7.34 associated with the m-proton of the benzene ring (yellow).
The doublet signal at δ 2.73 is attributed to the N-methyl protons of the tetradentate ligand
(green) and δ 2.20 belong to six hydrogens on the methyl protons of the benzene ring.[52]
B) MS analysis of CuL(TMA)2
For the MS analysis of [CuIIOPBI](TMA)2, measured in negative mode, the fraction [CuIIOPBI+H]-
was observed with the value m/z = 366.04. However, for analysis MS of [CuIIOPBI]MV, it was not
possible to get the clear fraction value of m/z.
C) IR analysis (MVCl2, [CuIIOPBI](TMA)2 and [CuIIOPBI]MV)
Figure 3-7 IR spectra of MVCl2, [CuIIOPBI](TMA)2 and [CuIIOPBI]MV.
Figure 3-6 ESI-MS (negative mode) of the complex [Cu OPBI]2- anion, [CuL+H]- (m/z = 366.04)
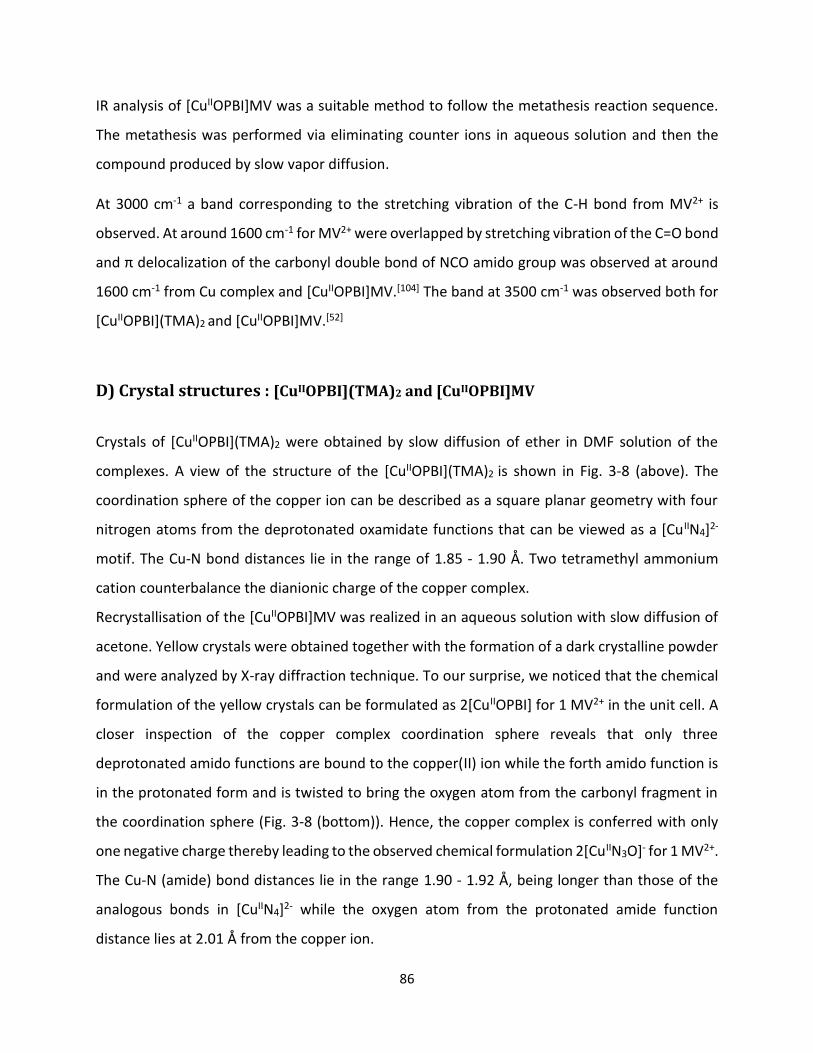
86
IR analysis of [CuIIOPBI]MV was a suitable method to follow the metathesis reaction sequence.
The metathesis was performed via eliminating counter ions in aqueous solution and then the
compound produced by slow vapor diffusion.
At 3000 cm-1 a band corresponding to the stretching vibration of the C-H bond from MV2+ is
observed. At around 1600 cm-1 for MV2+ were overlapped by stretching vibration of the C=O bond
and π delocalization of the carbonyl double bond of NCO amido group was observed at around
1600 cm-1 from Cu complex and [CuIIOPBI]MV.[104] The band at 3500 cm-1 was observed both for
[CuIIOPBI](TMA)2 and [CuIIOPBI]MV.[52]
D) Crystal structures : [CuIIOPBI](TMA)2 and [CuIIOPBI]MV
Crystals of [CuIIOPBI](TMA)2 were obtained by slow diffusion of ether in DMF solution of the
complexes. A view of the structure of the [CuIIOPBI](TMA)2 is shown in Fig. 3-8 (above). The
coordination sphere of the copper ion can be described as a square planar geometry with four
nitrogen atoms from the deprotonated oxamidate functions that can be viewed as a [CuIIN4]2-
motif. The Cu-N bond distances lie in the range of 1.85 - 1.90 Å. Two tetramethyl ammonium
cation counterbalance the dianionic charge of the copper complex.
Recrystallisation of the [CuIIOPBI]MV was realized in an aqueous solution with slow diffusion of
acetone. Yellow crystals were obtained together with the formation of a dark crystalline powder
and were analyzed by X-ray diffraction technique. To our surprise, we noticed that the chemical
formulation of the yellow crystals can be formulated as 2[CuIIOPBI] for 1 MV2+ in the unit cell. A
closer inspection of the copper complex coordination sphere reveals that only three
deprotonated amido functions are bound to the copper(II) ion while the forth amido function is
in the protonated form and is twisted to bring the oxygen atom from the carbonyl fragment in
the coordination sphere (Fig. 3-8 (bottom)). Hence, the copper complex is conferred with only
one negative charge thereby leading to the observed chemical formulation 2[CuIIN3O]- for 1 MV2+.
The Cu-N (amide) bond distances lie in the range 1.90 - 1.92 Å, being longer than those of the
analogous bonds in [CuIIN4]2- while the oxygen atom from the protonated amide function
distance lies at 2.01 Å from the copper ion.

87
Figure 3-8 Microscopy image of Crystals of [CuIIOPBI](TMA)2 (above) and [CuIIOPBI]MV (bottom).
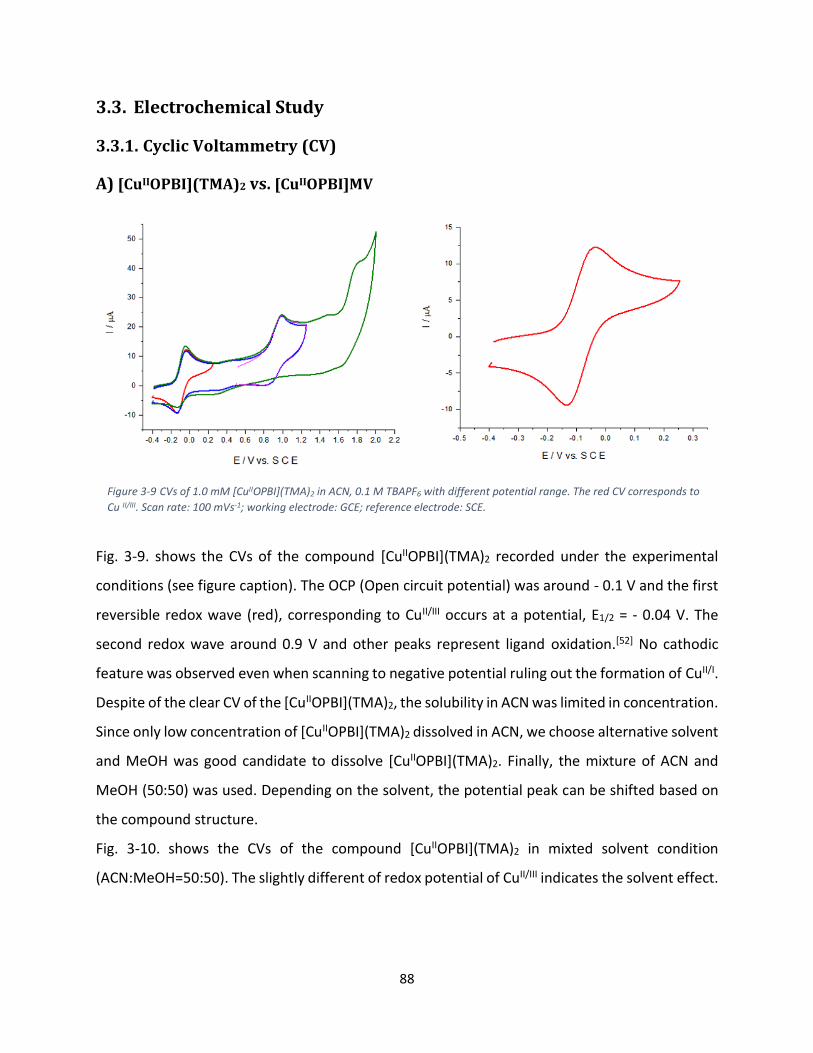
88
3.3. Electrochemical Study
3.3.1. Cyclic Voltammetry (CV)
A) [CuIIOPBI](TMA)2 vs. [CuIIOPBI]MV
Fig. 3-9. shows the CVs of the compound [CuIIOPBI](TMA)2 recorded under the experimental
conditions (see figure caption). The OCP (Open circuit potential) was around - 0.1 V and the first
reversible redox wave (red), corresponding to CuII/III occurs at a potential, E1/2 = - 0.04 V. The
second redox wave around 0.9 V and other peaks represent ligand oxidation.[52] No cathodic
feature was observed even when scanning to negative potential ruling out the formation of CuII/I.
Despite of the clear CV of the [CuIIOPBI](TMA)2, the solubility in ACN was limited in concentration.
Since only low concentration of [CuIIOPBI](TMA)2 dissolved in ACN, we choose alternative solvent
and MeOH was good candidate to dissolve [CuIIOPBI](TMA)2. Finally, the mixture of ACN and
MeOH (50:50) was used. Depending on the solvent, the potential peak can be shifted based on
the compound structure.
Fig. 3-10. shows the CVs of the compound [CuIIOPBI](TMA)2 in mixted solvent condition
(ACN:MeOH=50:50). The slightly different of redox potential of CuII/III indicates the solvent effect.
Figure 3-9 CVs of 1.0 mM [CuIIOPBI](TMA)2 in ACN, 0.1 M TBAPF6 with different potential range. The red CV corresponds to
Cu II/III. Scan rate: 100 mVs-1; working electrode: GCE; reference electrode: SCE.

89
The redox potential of CuII/III shifted positively (E1/2 = 0.2 V) and it might be affected by hydrogen
(H) bonding. The observed shift towards more positive potentials can be due to hydrogen
bonding effect between methanol and the external oxygen atoms of the oxamidate groups.
The mixture solvent condition (ACN:MeOH=50:50) was used for electrochemical study of
[CuIIOPBI]MV. Running the cyclic voltammogram of [CuIIN3O]2MV, we observed a redox process
with an E1/2 = 0.6 V vs SCE. This wave is attributed to the CuIII/II couple as no redox feature is
expected for the MV2+ in the anodic part of the CV. This positive shift ca. 400 mV with respect to
the [CuN4]2- coordinating scheme, support the stronger ligand field strength provided by the four
deprotonated amido groups in comparison with the three ones in the case of [CuIIN3O]2MV. With
the goal to investigate on the change in redox potential with the protonic state of the amido
function, we added one equivalent of tetramethylammonium hydroxide (TMAOH). Interestingly,
we found that the redox wave shifted E = 0.2 V vs. SCE, the same redox potential we already
observed in the case for a [CuN4]2- coordination site. Not only the potential shift, but also the
visible change was occurred in the presence of TMAOH. Upon mixing TMAOH, the color of
solution became blue which it seems MV+.. It can be explained that MV2+ is reduced to MV+. in
alkaline aqueous and methanolic solution under anaerobic condition.[105]
Figure 3-10 CVs of 1.0 mM [CuIIOPBI](TMA)2 in a 0.1 M TBAPF6 in ACN:MeOH (50:50). The red CV corresponds to CuII/III. Scan rate: 100 mVs-1; working electrode: GCE; reference electrode: SCE.

90
Figure 3-11 CVs of 1.0 mM [CuIIOPBI]MV with 1 eq. of base (TMAOH, blue) and without base (green) in ACN:MeOH (50:50)
Further insight in the coupled proton transfer electron transfer process with the [CuN4]2- complex
was gained by running the CV upon addition of one equivalent of a weak acid .[106]
Fig. 3-12. shows the CV of [CuN4]2- and upon addition of 1 eq. of acetic acid. Interestingly, the
same redox behavior is observed, that is to say, the initial wave for the CuIII/II couple for the
complex [CuN4]2- is shifted to a wave peaking at E1/2 = 0.6 V vs SCE as the one observed with
[CuIIOPBI]MV. This result matches the proposal that upon protonation there is a subsequent
anodic shift of the CuIII/II couple.
Figure 3-12 CVs of 1.0 mM [CuIIOPBI](TMA)2 adding 1 eq. of (acetic acid) in ACN:MeOH (50:50)
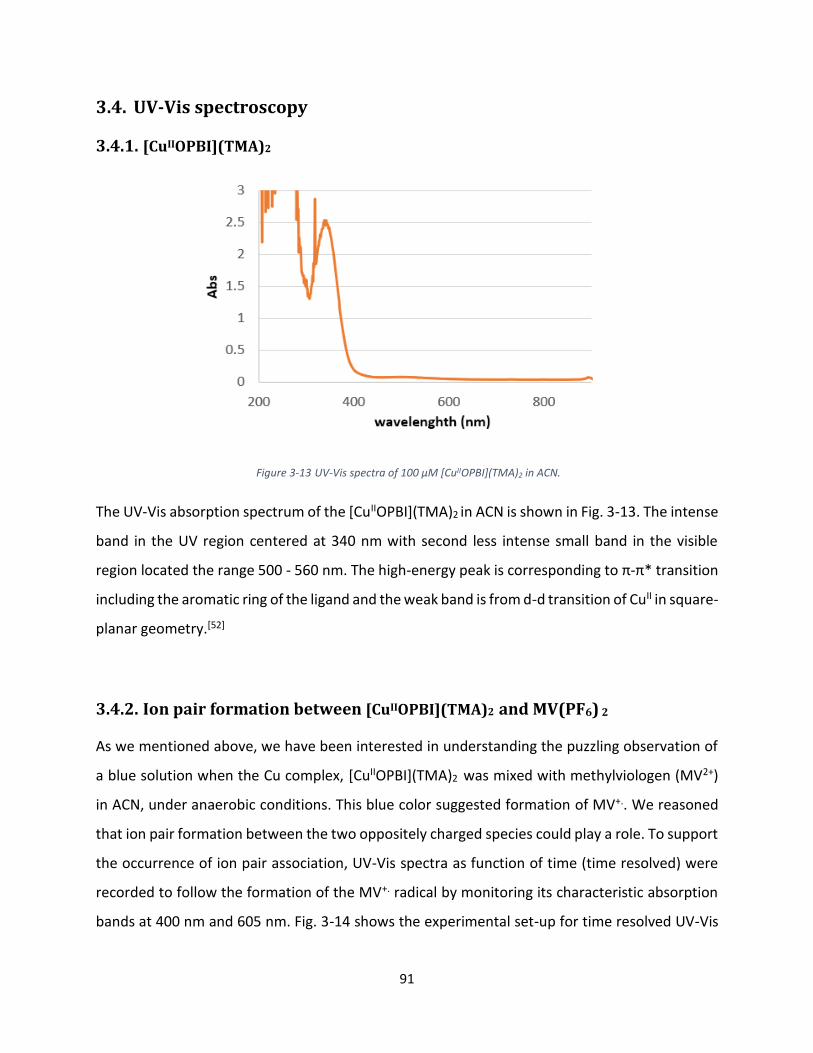
91
3.4. UV-Vis spectroscopy
3.4.1. [CuIIOPBI](TMA)2
The UV-Vis absorption spectrum of the [CuIIOPBI](TMA)2 in ACN is shown in Fig. 3-13. The intense
band in the UV region centered at 340 nm with second less intense small band in the visible
region located the range 500 - 560 nm. The high-energy peak is corresponding to π-π* transition
including the aromatic ring of the ligand and the weak band is from d-d transition of CuII in square-
planar geometry.[52]
3.4.2. Ion pair formation between [CuIIOPBI](TMA)2 and MV(PF6) 2
As we mentioned above, we have been interested in understanding the puzzling observation of
a blue solution when the Cu complex, [CuIIOPBI](TMA)2 was mixed with methylviologen (MV2+)
in ACN, under anaerobic conditions. This blue color suggested formation of MV+.. We reasoned
that ion pair formation between the two oppositely charged species could play a role. To support
the occurrence of ion pair association, UV-Vis spectra as function of time (time resolved) were
recorded to follow the formation of the MV+. radical by monitoring its characteristic absorption
bands at 400 nm and 605 nm. Fig. 3-14 shows the experimental set-up for time resolved UV-Vis
Figure 3-13 UV-Vis spectra of 100 µM [CuIIOPBI](TMA)2 in ACN.

92
spectra. The temperature of the solution was controlled by a liquid nitrogen cryostat and kept
under constant stirring. Different amount of methylviologen was introduced and the kinetics was
studied as function of temperature from -10 to 60 °C. Anaerobic condition were established by
bubbling with ACN-saturated nitrogen gas and were found to be necessary to avoid the reaction
between MV+. and oxygen (O2).
The evolution of the UV-Vis time-resolved spectra after mixing 100 µM [CuIIOPBI](TMA)2 and
10 mM of MV(PF6)2 is shown in Fig. 3-15. The spectra were measured every 2 min. for 2 hours
and show absorption increase at 400 nm and 605 nm leading to clearly visible blue solution in
the cuvette.
Figure 3-14 Experimental set-up for time resolved measurements.
Figure 3-15 UV-Vis time resolved spectra after mixing of 100 µM [CuIIOPBI](TMA)2 and 10 mM of MV(PF6)2. The spectra were measured every 2 min. for 2 hours.

93
Figure 3-17 UV-Vis time resolved plot (left) Abs vs. Time (min.) at the wavelength 605 nm of the mixture between 100 µM [CuIIOPBI](TMA)2 with different concentration of MV(PF6)2 (100, 200, 500, 1000 and 10000 µM). The yield of MV+. was calculated by dividing with [[CuIIOPBI]2-] = 100 µM and it plot as function of [MV2+]. The data were taken after 2 hours.
The kinetic study of electron transfer leading to the formation of MV+. was performed by UV-Vis
time resolved plot Abs vs. Time (min.) at 605 nm which shows the evolution of the MV+.. Fig 3-17
and Table 3-1 show the results of Abs and yield of MV+.. The mixture between 100 µM
[CuIIOPBI](TMA)2 with different concentration of MV(PF6)2 (100, 200, 500, 1000 and 10000 µM)
were used and the yield of [MV+.] was calculated by using the ε = 14000 of MV+ . The percent (%)
yield is [MV+.] divided by concentration of Cu complex, [[CuIIOPBI]2-] = 100 µM and it is plotted
as function of [MV2+] in Fig. 3-17. The concentration of MV2+, [MV2+] was varied from 100 µM,
which is 1 eq of , [[CuIIOPBI]2-] = 100 µM and to an excess amount, 100 eq. The initial slope in the
plot increases with increasing eq. of MV2+ showing acceleration of the reaction with higher
concentrations of MV2+. The interesting thing is the yield of MV+. after 2 hrs. The calculated yield
after 2 hrs for different [MV2+] shows that the maximum yield reached was around 50 %, with an
excess eq. of [MV2+]. This result suggests that only 50 % of [CuIIOPBI]2- are oxidized.
Figure 3-16 The color change of mixture of 100 µM [CuIIOPBI](TMA)2 + 10 mM of MV(PF6)2. Left: after 40 min, Right: after 2 hrs.

94
Table 3-1 The data summary from the Fig. 3-17. The Abs of MV+. after 2 hrs at the wavelength 605 nm as function of the [MV 2+] in [[CuIIOPBI]2-] = 100 µM. [MV+.] was calculated by using the ε of MV+..
As we have noticed before, at room temperature (30°C) there was a gradual increase in the
formation of methylviologen that did not reach a plateau after two hours (see Fig. 3-18). Hence,
we performed a set of temperature control experiment fixing the concentration of MV2+ at
100 mM and the concentration of the copper complex at 100 µM with the target to evaluate the
rate of formation of MV+. as a function of temperature. For this, a series of experiments from
- 10 °C to 60 °C were realized. Fig. 3-18 shows the results of time resolved plot at different
temperature. At -10 °C, the kinetic was too slow and no marked changes in the optical spectra
was evidenced. As discussed above, at 30 °C, a constant increase was found to reach a yield over
50 % (0.78/14000 = 57 %). Increasing the temperature to 40 °C, both kinetic and yield increased
to attain plateau at 64 % yield. Experiments done at higher temperature than 40°C ie. 50 and
60°C lead to an increase in the rate of formation of MV+..
[MV2+], µM Abs @605 nm [ MV+.], µM Yield (%)
([MV+.]/[[CuIIOPBI]2-] x 100)
100 0.18 13.01 13.01
200 0.31 22.60 22.60
500 0.51 37.16 37.16
1000 0.60 43.86 43.86
10000 0.62 47.31 47.31
Figure 3-18 UV-Vis time resolved plot Abs vs. Time (min.) at the wavelength 605 nm of the mixture 100 µM
[CuIIOPBI](TMA)2 with excess eq. of 100 mM MV(PF6)2 (100 eq.) for different temperatures (-10, 30, 40, 50 and
60 °C)

95
3.4.3. Effect of dielectric constant
The mixture of 100 mM of MV2+ (MVCl2, in this case) and 100 µM of [CuIIOPBI]2- in water did not
exhibit any formation of new peaks at 400 nm and 605 nm attributable to the methylviologen
radical. Concerning the water which has high dielectric constant solvent, many studies of methyl
viologen in water have investigated that the blue color of methyl viologen radical cation (MV+.)
exists stable and can be detected by the UV-Vis spectra.[107,108] We reasoned that the ion pair
formation and electron transfer phenomenon is affected by the nature of the solvent.[109] The
effect of dielectric constant has investigated in terms of ion pair formation. Low dielectric
constant organic solvents such as DMSO, DMF and DCM had similar phenomenon of ion pair
formation and electron transfer as in ACN, which we already discovered in the previous part
(Fig. 3-19 and Table 3-2).
Table 3-2 Effect of dielectric constant of solvent for ion pair formation and electron transfer.
Solvent Dielectric constant
Ion pair formation & electron transfer
ACN 38 Yes
DMF 37 Yes
DMSO 47 Yes
DCM 9 Yes
H2O 80 No
Figure 3-19 UV-Vis spectra of the mixture between 100 uM of [CuIIOPBI]2- with 100 mM of MV2+ in different solvent : In water (left) and in DMF (right).
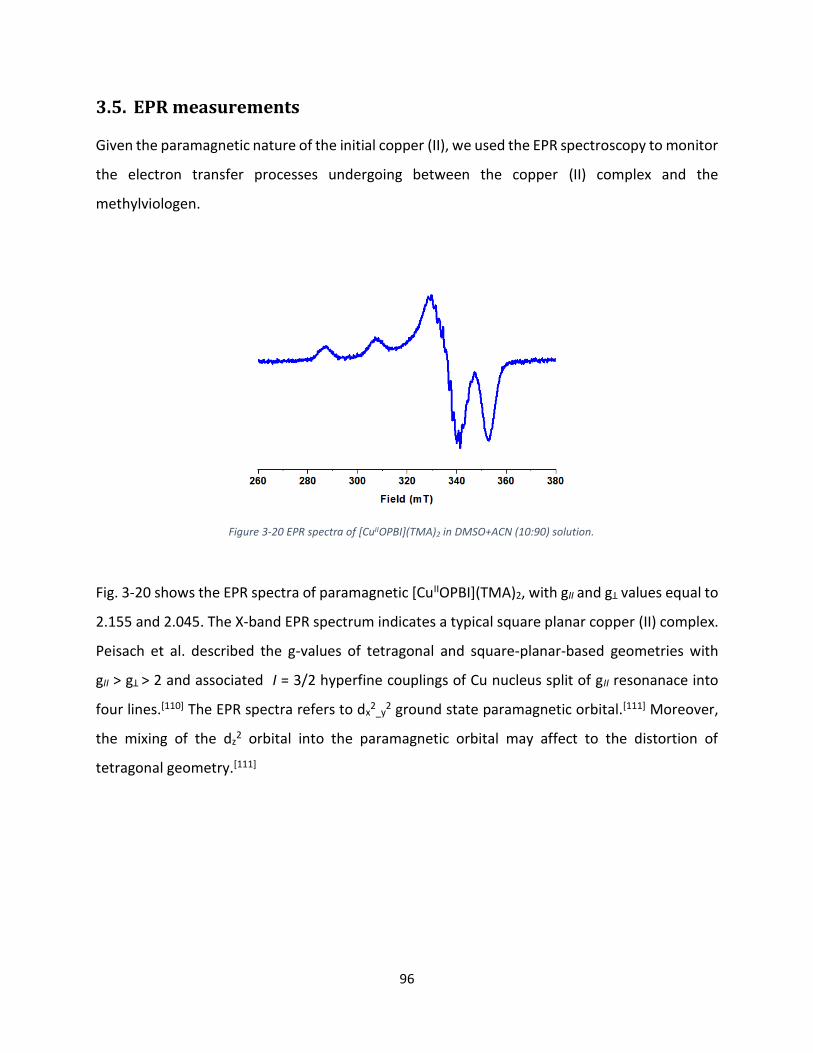
96
3.5. EPR measurements
Given the paramagnetic nature of the initial copper (II), we used the EPR spectroscopy to monitor
the electron transfer processes undergoing between the copper (II) complex and the
methylviologen.
Fig. 3-20 shows the EPR spectra of paramagnetic [CuIIOPBI](TMA)2, with gII and gꓕ values equal to
2.155 and 2.045. The X-band EPR spectrum indicates a typical square planar copper (II) complex.
Peisach et al. described the g-values of tetragonal and square-planar-based geometries with
gII > gꓕ > 2 and associated I = 3/2 hyperfine couplings of Cu nucleus split of gII resonanace into
four lines.[110] The EPR spectra refers to dx2
_y2 ground state paramagnetic orbital.[111] Moreover,
the mixing of the dz2 orbital into the paramagnetic orbital may affect to the distortion of
tetragonal geometry.[111]
Figure 3-20 EPR spectra of [CuIIOPBI](TMA)2 in DMSO+ACN (10:90) solution.

97
Fig. 3-21 is represented the spectrum of the copper complex superimposed with the metathesis
compound [CuIIOPBI]MV in solid state. As it can be noticed there is a drastic change in the
morphology of the EPR spectra. While the initial copper (II) complex presented a rhombic signal,
the one obtained from the mixture of the copper complex and methylviologen is mostly axial
with gII = 2.19 and gꓕ = 2.04. It indicates that [CuIIOPBI]MV which can be understood as Cu (II) ion
formation, [CuIIOPBI]2-MV2+ was not the case in solid state. The splitted gII resonance disappeared
and the broad splitting into two lines in the downside became one sharp line.
The formation of such a paramagnetic species was quite surprising and lead us to perform a set
of experiments in solution. With the target to decipher the locus of the lone electron for the
paramagnetic species, we carried on the measurement in solution state. Fig. 3-23 shows
[CuIIOPBI](TMA)2 and mixture of [CuIIOPBI]MV in DMSO+ACN (10:90) solvent, respectively. Based
on Scheme 3-2, we reasonable argued that under an aerobic condition the formation of the
methylviologen radical, detected by its classic absorption bands at 400 and 605 nm, should be
accompanied by the oxidation of the copper (II) complex to a Cu (III) species. This oxidized Cu (III)
complex with a d8 electronic configuration should be diamagnetic and EPR silent in nature.
In Fig. 3-22, we depict the spectra of the copper (II) complex and the mixture of the copper
complex with methylviologen under anaerobic condition. As we clearly noticed that upon
addition of MV2+, we evidenced a change from a metal center paramagnetic center (g = 2.05) to
Figure 3-21 X-band EPR spectra of [CuIIOPBI](TMA)2 (blue) and [CuIIOPBI]MV (black) in solid state.

98
a more metalloradical species with g = 2.00. A more in depth EPR study together with DFT
calculations to support the assumption.
As we have witnessed in the study as a function of temperature that the generation of the MV+.
radical was not complete even in an excess of MV2+. In order to delineate the nature of the
paramagnetic species we have performed an EPR study as a function of temperature (Fig. 3-23).
Interestingly, we found that at low temperature, the spectrum is dominated by the signal for the
copper (II) center with gII and gꓕ values equal to 2.18 and 2.05 which are typical for the
[CuIIOPBI](TMA)2. We also noticed the presence of a radical species with a g value at 2.00.
Increasing the temperature, we monitored the disappearance of the copper (II) signals at the
expense of the radical species. Henceforth we can reasonably propose that there is a dynamic
equilibrium of the locus of the spin from the metal to the methylviologen such as the one
observed for a valence tautomeric phenomenon. The fact that the EPR signal shows a strong
anisotropy raises the question on the coupling of the MV+. and the copper ion. A more in depth
spectroscopic and theoretical calculations are still needed to shine light on this original electron
transfer process upon formation of an ion pair formation.
Figure 3-22 X-band EPR spectra of [CuIIOPBI]MV and [CuIIOPBI](TMA)2 in DMSO+ACN (10:90) solution.

99
Figure 3-23 X-band EPR spectra of [CuIIOPBI]MV in different temperature in the range 90 K - 280 K in DCM+MeOH (50:50) solution.

100
3.6. NiIIOPBI ([NiIIOPBI]2-) and CuIIOBBZ ([CuIIOBBZ]2-)
3.6.1. Ni OPBI ([NiIIOPBI]2-)
Based on our observation with the [CuIIOPBI]2- we argued whether this electron transfer
phenomenon would prevail with another metal complex holding the same bisoxamidate ligand.
For this purpose, we have chosen the [NiIIOPBI]2- as a dianionic diamagnetic square planar
complex. Ottenwaelder et al. studied a series of nickel (II) complexes and demonstrated that the
ligand with large electron σ-donor could stabilize the trivalent and formally tetravalent nickel.[53]
The CV of Ni (II) complex as shown in Fig. 3-25, the lower valent Ni (II) complex can undergo two
one-electron oxidation, metal- and ligand-centered.[53] The half wave potential of NiII/III is 0.1 V,
which is higher than the potential of MV2+, E1/2 = - 0.45 V. That gives same concept as CuIIOPBI
complex that thermodynamically MV2+ cannot oxidize Ni (II) complex.
Figure 3-25 CVs of 1.0 mM of [NiIIOPBI](TMA)2 in a 0.1 M TBAPF6 in ACN with different potential range. The red CV corresponds to NiII/III. Scan rate: 100 mVs-1; working electrode: GCE; reference electrode: SCE.
Figure 3-24 Structure of Ni(II) complexes : Ottenwaekder’s work (left), in this work (right)
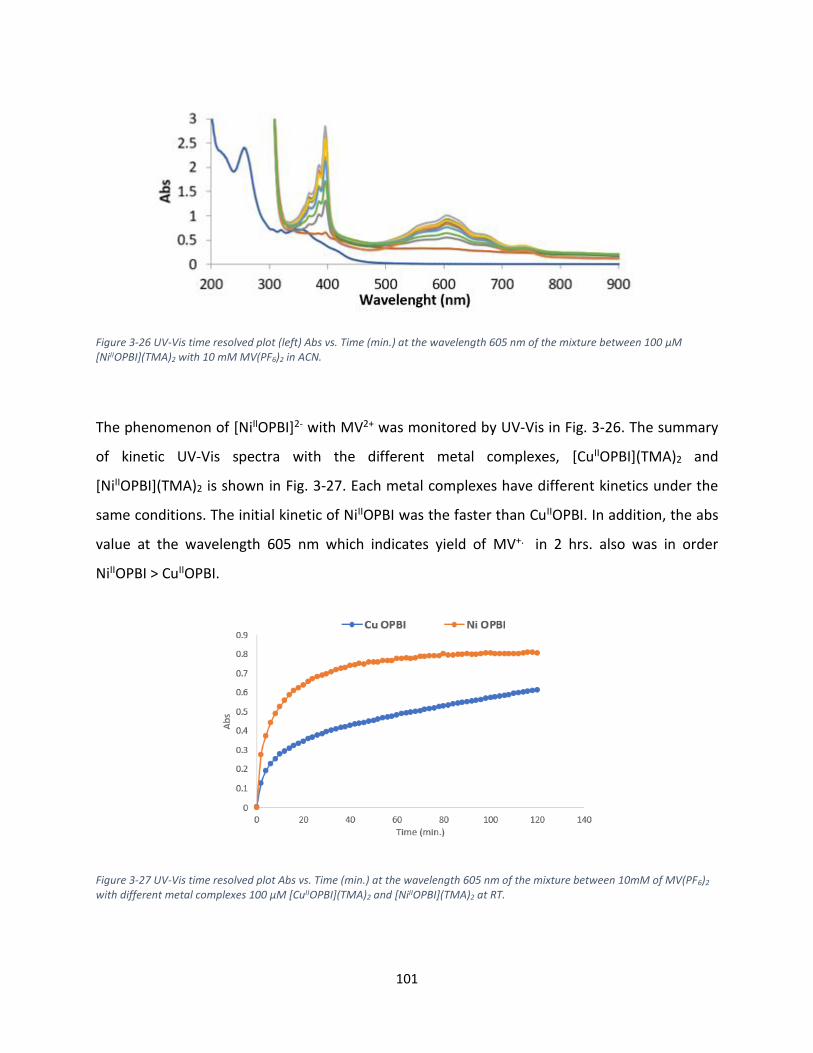
101
Figure 3-26 UV-Vis time resolved plot (left) Abs vs. Time (min.) at the wavelength 605 nm of the mixture between 100 µM [NiIIOPBI](TMA)2 with 10 mM MV(PF6)2 in ACN.
The phenomenon of [NiIIOPBI]2- with MV2+ was monitored by UV-Vis in Fig. 3-26. The summary
of kinetic UV-Vis spectra with the different metal complexes, [CuIIOPBI](TMA)2 and
[NiIIOPBI](TMA)2 is shown in Fig. 3-27. Each metal complexes have different kinetics under the
same conditions. The initial kinetic of NiIIOPBI was the faster than CuIIOPBI. In addition, the abs
value at the wavelength 605 nm which indicates yield of MV+. in 2 hrs. also was in order
NiIIOPBI > CuIIOPBI.
Figure 3-27 UV-Vis time resolved plot Abs vs. Time (min.) at the wavelength 605 nm of the mixture between 10mM of MV(PF6)2 with different metal complexes 100 µM [CuIIOPBI](TMA)2 and [NiIIOPBI](TMA)2 at RT.
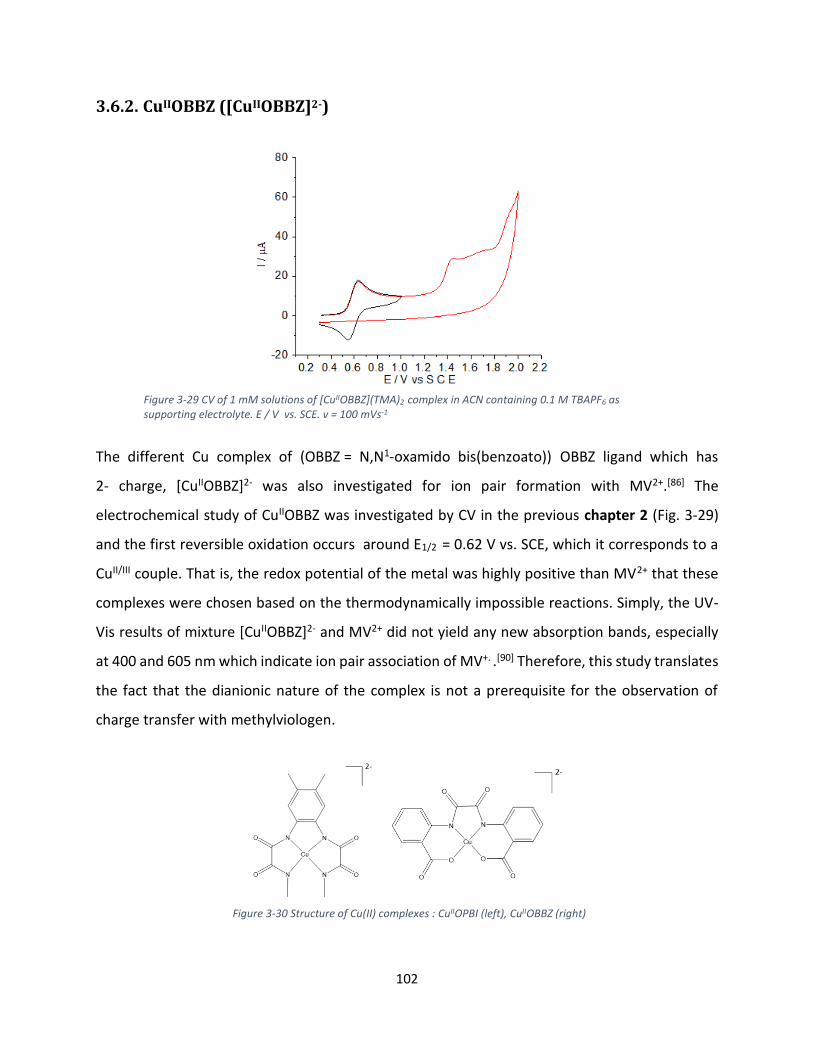
102
3.6.2. CuIIOBBZ ([CuIIOBBZ]2-)
The different Cu complex of (OBBZ = N,N1-oxamido bis(benzoato)) OBBZ ligand which has
2- charge, [CuIIOBBZ]2- was also investigated for ion pair formation with MV2+.[86] The
electrochemical study of CuIIOBBZ was investigated by CV in the previous chapter 2 (Fig. 3-29)
and the first reversible oxidation occurs around E1/2 = 0.62 V vs. SCE, which it corresponds to a
CuII/III couple. That is, the redox potential of the metal was highly positive than MV2+ that these
complexes were chosen based on the thermodynamically impossible reactions. Simply, the UV-
Vis results of mixture [CuIIOBBZ]2- and MV2+ did not yield any new absorption bands, especially
at 400 and 605 nm which indicate ion pair association of MV+. .[90] Therefore, this study translates
the fact that the dianionic nature of the complex is not a prerequisite for the observation of
charge transfer with methylviologen.
Figure 3-30 Structure of Cu(II) complexes : CuIIOPBI (left), CuIIOBBZ (right)
Figure 3-29 CV of 1 mM solutions of [CuIIOBBZ](TMA)2 complex in ACN containing 0.1 M TBAPF6 as supporting electrolyte. E / V vs. SCE. v = 100 mVs-1
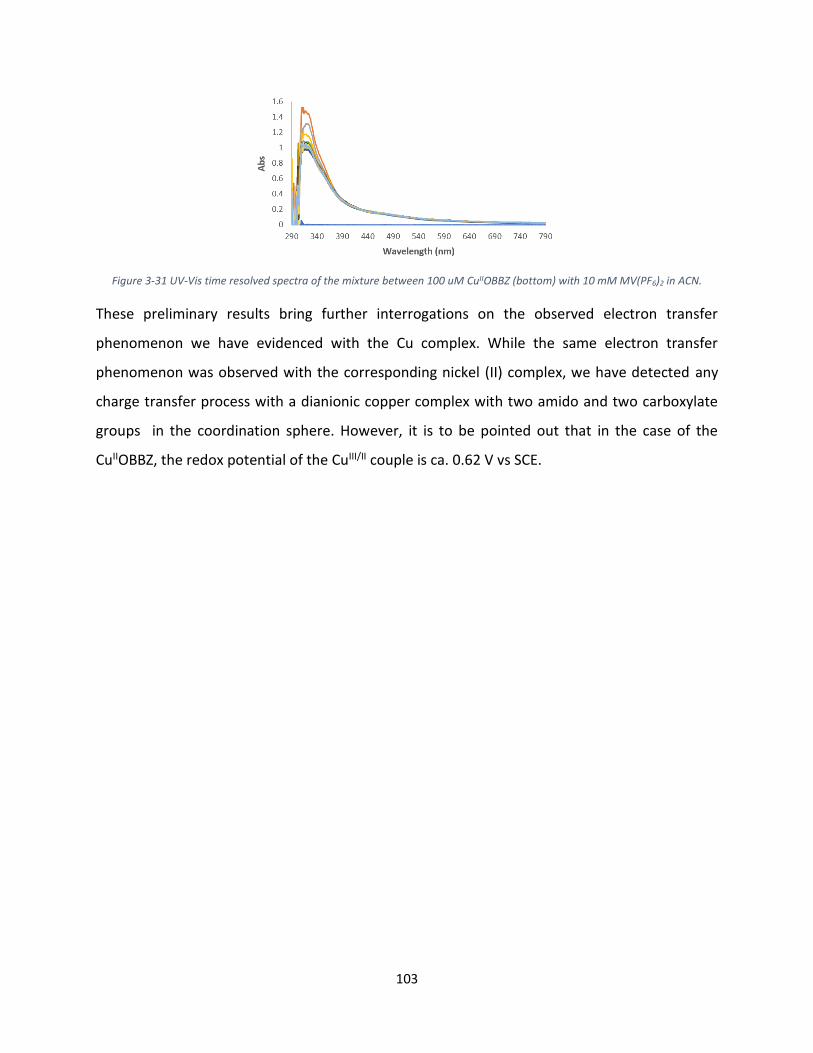
103
Figure 3-31 UV-Vis time resolved spectra of the mixture between 100 uM CuIIOBBZ (bottom) with 10 mM MV(PF6)2 in ACN.
These preliminary results bring further interrogations on the observed electron transfer
phenomenon we have evidenced with the Cu complex. While the same electron transfer
phenomenon was observed with the corresponding nickel (II) complex, we have detected any
charge transfer process with a dianionic copper complex with two amido and two carboxylate
groups in the coordination sphere. However, it is to be pointed out that in the case of the
CuIIOBBZ, the redox potential of the CuIII/II couple is ca. 0.62 V vs SCE.

104
3.7. Conclusions & Perspectives
We investigated the ion pair electron transfer between the oppositely double negative charged
species of complexes and electron acceptor the methylviologen dication. While we were set to
perform the photocatalytic investigation of the copper complex in presence of a photosensitizer
and an electron acceptor (methylviologen), we were intrigued by the discovery that the mixture
of the copper (II) complex and MV2+ lead to the formation of MV+.. The ion pair formation was
mainly studied by UV-Vis spectra, which gives clear appearance of MV+. and the solvent dielectric
constant affect to the phenomenon. Another attempt was the metathesis of [CuIIOPBI]MV. By
analysis crystal structure we found the protonated complex formed. EPR measurements were
the evidence of radical species appear and Cu (II) disappeared.
The different metal species replacing to Ni had similar phenomenon as Cu complex but the yield
and initial rate of MV+. was different. Another dianionic Cu complex CuIIOBBZ, did not lead to
charge transfer phenomenon. Thus, we assume that the role of ion pair formation is strongly
dependent on the ligand OPBI.
Small purple crystals of the [CuIIOPBI]MV were obtained upon crystallization in the glove box.
However, to date we have not been able to have the x-ray analysis of the species that would
accordingly described the reduced form of methylviologen together with the oxidized copper
complex. However, the color of these crystals already is clearly not the yellow ones obtained in
aerobic conditions. Our effort is guided to have the crystal structure of the charge separated state
and its more intimate characterization.
Figure 3-32 Microscopic crystal of [CuIIOPBI]MV in the glove box.

105
Chapter IV.
Intramolecular Electron Transfer

106

107
4. Intramolecular Electron Transfer
In this chapter, we have studied the light-induced intramolecular electron transfer in a Ru-Mn
supramolecular complexes, which consist of photosensitizer and a manganese complex linked
through an imidazole unit. We discussed here the electron transfer steps and investigated the
change in the Mn oxidation states upon exciting the photosensitizer with visible light in the
presence of an electron acceptor.
4.1. Introduction
Light-driven activation of a catalyst in intramolecular systems has gained a considerable attention
in recent years and the main aim is to attach such complexes to electrode surfaces and use them
as photoanode or photocathode in photoelectrochemical cells.[25,26] Fig. 4-1 shows the simple
diagram of a modular device for photo-oxidation of water. A chromophore, as a photo-active
module is able to transform light energy into redox equivalents by photo-induced electron
transfer to a catalyst. The final target in artificial photosynthesis study is to perform the water
splitting reaction. Many studies have investigated the water oxidation catalysis chemically by
using polynuclear manganese complexes with large amounts of oxidizing agents.[112,113] In these
reactions, their mechanisms and the origin of the oxygen atoms were not clearly revealed. An
elegant way to decipher the multielectronic activation pathways consists in studying the
Figure 4-1 modular device for photo-oxidation of water
108
sequential one electron processes photochemically. Several studies have been performed along
this line with ruthenium chromophores linked to metal complexes.[114,115]
In this section, we described the synthesis, characterization and photophysical studies of
different Ru-Mn assemblies incorporating a photosensitizer and a manganese complex. The
ligand surrounding the manganese ion was designed to wrap up the metal ion in a
pentacoordinated fashion leaving a free site for a water molecule as substrate. The goal in this
study is to unveil the light induced activation of the bound water molecule to generate an active
metal oxo species that can ultimately perform an oxidation reaction. We have to point out the
manganese (III)-OH complex with this ligand set was reported before in our lab.[120] We found
that a manganese (IV)-oxo type could be generated electrochemically.[120] In addition, non-
oxidizable mono zinc complex was inserted in place of manganese to serve as a reference.

109
4.2. Synthesis and Characterizations
4.2.1. Synthesis of RuIILMnIII
For the synthesis of the compound, all procedures were done by Dr. Shyamal Das. The
characterizations of NMR are presented in Annex. The synthetic pathway of the represented dyad,
abbreviated as RuIILMnIII (6), is described in scheme 4-2.
The reaction between 1,10-Phenanthroline-5,6-dione (1) with 3-tertiary butyl p-hydroxy
benzaldehyde was done via a Steck–Day reaction.[116] From this the 3-tertiary butyl phenol
precursor (2) to 3-tertiary butyl salicylaldehyde analogues (3) was prepared by a modified Duff
reaction. Synthesis of the ligand (L, (4)) was performed by condensation of (3) with the dipicodyl
ethyl amine, which had been obtained by the reaction of the dipicodyl amine and
N-(2-bromoethyl) phthalimide. Formation of (5) was achieved by coordination of Ru(bpy)2Cl2 to
the phenanthroline end of (4).[117] Target compound (6) was obtained by insertion of
manganese (II) cation inside the five dentated coordination site of the ligand, L. MnII was oxidized
to its MnIII state by air oxidation. In addition, for these two different chromophore structures,
zinc derivatives, abbreviated RuIILZnII (7) was synthesized.
Figure 4-2 Chemical structure of ligand (L).
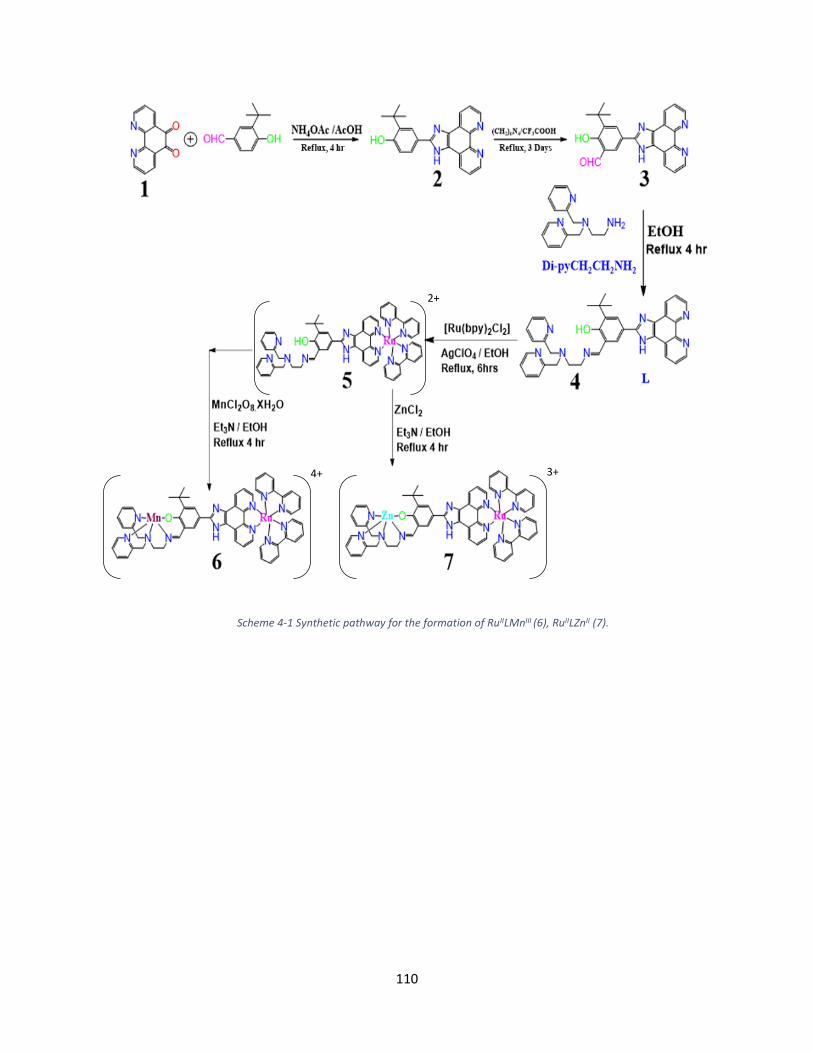
110
Scheme 4-1 Synthetic pathway for the formation of RuIILMnIII (6), RuIILZnII (7).
2+
4+ 3+
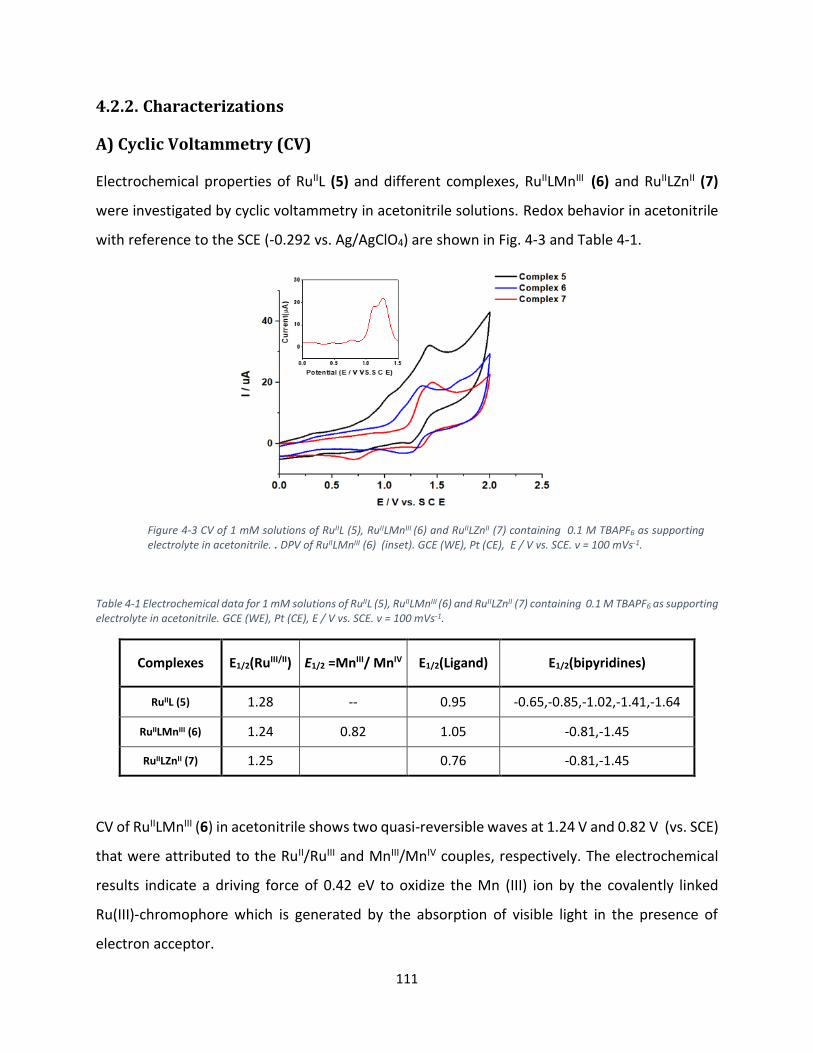
111
4.2.2. Characterizations
A) Cyclic Voltammetry (CV)
Electrochemical properties of RuIIL (5) and different complexes, RuIILMnIII (6) and RuIILZnII (7)
were investigated by cyclic voltammetry in acetonitrile solutions. Redox behavior in acetonitrile
with reference to the SCE (-0.292 vs. Ag/AgClO4) are shown in Fig. 4-3 and Table 4-1.
Table 4-1 Electrochemical data for 1 mM solutions of RuIIL (5), RuIILMnIII (6) and RuIILZnII (7) containing 0.1 M TBAPF6 as supporting electrolyte in acetonitrile. GCE (WE), Pt (CE), E / V vs. SCE. ν = 100 mVs-1.
Complexes E1/2(RuIII/II) E1/2 =MnIII/ MnIV E1/2(Ligand) E1/2(bipyridines)
RuIIL (5) 1.28 -- 0.95 -0.65,-0.85,-1.02,-1.41,-1.64
RuIILMnIII (6) 1.24 0.82 1.05 -0.81,-1.45
RuIILZnII (7) 1.25 0.76 -0.81,-1.45
CV of RuIILMnIII (6) in acetonitrile shows two quasi-reversible waves at 1.24 V and 0.82 V (vs. SCE)
that were attributed to the RuII/RuIII and MnIII/MnIV couples, respectively. The electrochemical
results indicate a driving force of 0.42 eV to oxidize the Mn (III) ion by the covalently linked
Ru(III)-chromophore which is generated by the absorption of visible light in the presence of
electron acceptor.
Figure 4-3 CV of 1 mM solutions of RuIIL (5), RuIILMnIII (6) and RuIILZnII (7) containing 0.1 M TBAPF6 as supporting electrolyte in acetonitrile. . DPV of RuIILMnIII (6) (inset). GCE (WE), Pt (CE), E / V vs. SCE. ν = 100 mVs-1.

112
B) Absorption spectra of complexes and their emission properties
Figure 4-4 Ground state absorption (left) and emission (right) spectra in acetonitrile for RuIIL (5), RuIILMnIII (6) and RuIILZnIII (7) and their emission.
Fig. 4-4 shows the absorption spectra of [Ru(bpy)3]2+ and the complexes RuIILMnIII (6) and RuIILZnII
(7). The attachment of salen moiety covalently with the ruthenium(II)-polypyridyl chromophore
yields RuIIL (5) that indicates π → π* and n → π* ligand centered transitions at 282, 312 nm
respectively and the broad MLCT band at 462 nm. RuIILMnIII (6) shows ligand field transitions at
272, 312 and 333 nm in the ultraviolet region and a broad MLCT band at 463 nm in the visible
region similar to (5). The absorption spectrum of the RuIILMnIII (6), shows a strong absorption
around 295 nm due to a π-π* transition, another band at 348 nm which results from an
intraligand charge transfer, and finally a band at 455 nm, the typical MLCT band of ruthenium
complexes. In the case of the dinuclear complexes Ru-Mn (6), the yield of emission is decreased.
This quenching process, which has been detected by several groups, has been described as an
energy transfer process between ruthenium and manganese.
Table 4-2 Summary of absorption and emission spectral data of complexes RuL (5), RuIILMnIII (6) and RuIILZnIII (7) in acetonitrile.
Complexes Absorption λmax, nm Emission, λmax, nm
RuIIL (5) 234, 282, 312, 415, 462 628
RuIILMnIII (6) 272, 312, 333, 463 628
RuIILZnII (7) 259, 294, 347, 430, 467 628
When pentadentate ligand is attached with pyridine part, the emission maximum is 628 nm
(Table 4-2). This shift of emission wavelength may be attributed to the presence of the higher
extent of conjugation. The bimetallic complexes RuIILMnIII (6) and RuIILZnII (7) show same emission
peaks at 628 nm in acetonitrile.

113
4.2.3. Photophysical Studies : Laser Flash Photolysis
The study of Laser Flash Photolysis (LFP) was to focus on internal electron transfer between the
excited chromophore part and the catalytic part leading to activation of the Mn ion in presence
of electron acceptors under the different pH conditions.
A) RuIIL
The photo-induced electron-transfer process in the complex was studied by the laser flash
photolysis. Transient absorption spectroscopy was performed to follow the internal electron
transfer between the excited chromophore part and the catalytic part leading to activation of the
Mn ion. First, the ruthenium(II)-polypyridiyl chromophore holding the covalently linked ‘salen-
type’ ligand RuIIL (5) was studied. As mentioned in the characterization part (4.2.2), the emission
maximum of RuIIL (5) shows typical emission decay at 628 nm in ACN and the excited state
lifetime was about 1.1 µs that corresponds to the 3MLCT transition. Fig. 4-7 shows transient
absorption spectra of RuIIL (5) in the range 30 µs to 300 µs in presence of methylviologen as a
reversible electron acceptor.
Fig. 4-5 shows transient absorption spectra of RuIIL (5) in presence of reversible electron
acceptors MV2+ (left) and RH3+ (right). The reduction of MV2+ to MV+. is observed at 400 nm and
605 nm, the characteristic absorptions bands for MV+. radical.[90] While irradiating in the presence
of ruthenium(III) hexaammine (RH3+) provides a more clear optical properties of the oxidized
species. The absorption peaks appeared at 410 nm, 460 nm and broad band around 800 nm.
Figure 4-5 Transient absorption spectra of RuIIL (5) in presence of MV 2+(left) in ACN and RH3+ (right) in ACN+H2O in the range 1 µs to 300 µs after laser flash excitation at 460 nm.

114
B) RuIILMnIII
Fig. 4-6 shows representative profiles of typical emission decay at 628 nm with lifetime of 1.2 µs
in ACN for the compound RuIILMnIII (6) and oxidative quenching in presence of electron acceptor.
Table 4-3 shows the summary of the quenching effect with diverse electron acceptors and good
quenching is observed with methyl viologen (MV2+) and ruthenium hexamine (RH3+).
Table 4-3 Emission kinetics at 628 nm of Ru-Mn with different electron acceptors; Ar-purged, excitation wavelength 460 nm.
As shown in Fig. 4-6 and Table 4-3, in presence of MV2+ as an electron acceptor, quenching
occurred decreasing the excited state lifetime of RuII* from 1224 ns to 75 ns. The formation of
MV+. was detected by the characteristic absorption bands at 400 nm and 605 nm.[90] The initially
formed RuIII state decays quickly (< 150 ns) and after 100 µs the MV+. has also disappeared as
shown in Fig. 4-10. The disappearance of the MV+. and recovery of the Ru(II) state of the
chromophore give rise to new absorption features, maxima at 400 nm and broad band around
770 nm. These oxidized species do not correspond to the absorption peaks of MnIV species.
however, this clearly evidenced an efficient activation of certain species to the oxidized form by
the photo-oxidized chromophore. In another experiment we used a different electron acceptor,
RuMn (O.D = 0.5, 35 µM)
Electron acceptor - MV(PF6)2 [Ru(NH3)6]Cl3 [CoIII(NH3)5Cl]Cl2
Concentration 10 mM 10 mM 10 mM
Life time (τ) 1224 ns 75 ns 290 ns 1170 ns
Results good quenching good quenching Not good candidate
Figure 4-6 Emission kinetics at 628 nm of RuIILMnIII (6), RuIILMnIII (6) in presence of RH3+ (pink) in ACN +H2O (50:50) and RuIILMnIII (6) in presence of MV2+ (blue) in ACN

115
RH3+. The quenching process in presence of RH3+ occurred in 290 ns and after 1 µs, absorption
peaks appeared at 410 nm, 460 nm and broad band around 800 nm. These two different electron
acceptors both lead a species presenting absorption peak around 800 nm. Based on the work of
Fujii, the observed bands can be assigned to generation of MnIII-phenoxyl radical species.[118,119]
Figure 4-7 Transient absorption spectra of RuIILMnIII (6) (a) in presence of MV2+ in ACN, recorded from 10 ns to 400 us (left) and 100 µs to 400 us (right) (b) in presence of RH3+ in ACN+H2O, recorded from 100 ns to 3 ms (left) and 1 us to 3 ms (right), after excitation at 460 nm.

116
C) RuIILZnII
Figure 4-9 Transient absorption spectra of RuIILZnII (7) in presence of RH3+ in ACN+H2O (left) and RuIILMnIII (6) in presence of RH3+ in ACN+H2O (right) in the range 30 ns to 3 ms after laser flash excitation at 460 nm.
The complex RuIILZnII (7), which contains zinc ion rather than manganese was also investigated
in presence of RH3+. The purpose of study RuIILZnII (7) was to compare the photophysical events
with those of RuIILMnIII (6). Based on the electrochemical properties of the RuIILZnII (7) complex,
an oxidation wave was observed prior the RuIII/II couple. This wave was assigned to the oxidation
of the ligand surround the Zn (II) ion. Henceforth, it was obvious for us to interrogate the electron
transfer event in this system where the zinc (II) ion is redox inactive. Fig. 4-8 shows the quenching
from 1017 ns to 119 ns at the emission wavelength of RuII/III*, 628 nm in presence of RH3+ as an
electron acceptor.
Figure 4-8 Emission kinetics at 628 nm of RuIILZnIII (7) and RuIILZnIII (7) in presence of RH3+ in ACN+H2O (50:50)

117
In Fig. 4-9 we compare the absorbance spectra between [RuIILZnII]ox and [RuIILMnIII]ox obtained
after light excitation in presence of RH3+. After 30 µs, they have similar spectra. To observe the
band at high wavelength, we blocked the blue range by using filter and after 300 ns it is obvious
that the peak at 840 nm shifted to 783 nm as shown in Fig. 4-10.
Interestingly, in presence of RH3+, the results give similar spectra as RuIILMnIII (6) and RuIILZnII (7),
indicating that the oxidized species is formed on the ligand and not on the metal in the
pentadendate cavity.
Figure 4-40 Transient absorption spectra of RuIILZnII (7) in presence of RH in ACN+H2O in the range 300 ns and 1us blocking blue range by filter.

118
4.3. Conclusions & Perspectives
We have studied intramolecular electron transfer from manganese to ruthenium-based
photosensitizer. We could induce the intramolecular oxidation by visible light absorption of
photosensitizer component.
In presence of ruthenium hexamine as electron acceptor, the results of transient spectra for RuIIL,
RuIILMnIII, and RuIILZnII were similar. It indicates that the oxidized species is formed on the ligand,
which is probably a phenoxyl radical species.[118,119] Therefore, to investigate the oxidized form,
X-band EPR technique might be useful.
Studies on different pH solutions is another challenge to examine the reactivity of
photogeneration. The bridging ligands, imidazole may participate to the electron transfer
depending on the pH conditions. Employing organic compound as substrate will be the further
study to demonstrate the photochemical generation of catalytic center.
These are preliminary results and the work is in progress to study in depth.

119
References
[1] N. Cox, M. Retegan, F. Neese, D. A. Pantazis, A. Boussac, W. Lubitz, Science 2014, 345, 804–808. [2] N. Cox, D. A. Pantazis, F. Neese, W. Lubitz, Acc. Chem. Res. 2013, 46, 1588–1596. [3] X.-G. Zhu, S. P. Long, D. R. Ort, Current Opinion in Biotechnology 2008, 19, 153–159. [4] Y. Umena, K. Kawakami, J.-R. Shen, N. Kamiya, Nature 2011, 473, 55. [5] F. R. WHATLEY, K. TAGAWA, D. I. ARNON, Proc Natl Acad Sci U S A 1963, 49, 266–270. [6] L. Hammarström, L. Sun, B. Åkermark, S. Styring, Biochimica et Biophysica Acta (BBA) - Bioenergetics 1998, 1365, 193–199. [7] M.-D. Weitze, Artificial Photosynthesis-State of Research, Scientific-Technological Challenges and
Perspectives, Acatech – National Academy Of Science And Engineering. [8] N. Oreskes, Science 2004, 306, 1686. [9] Lockwood Mike, Proceedings of the Royal Society A: Mathematical, Physical and Engineering Sciences 2010, 466, 303–329. [10] J. Twidell, T. Weir, Renewable Energy Resources | Taylor & Francis Group, London: Routledge, 2015. [11] C. Zou, Q. Zhao, G. Zhang, B. Xiong, Natural Gas Industry B 2016, 3, 1–11. [12] P. Richard, The International Energy Agency SHC Programme Solar Update 2009, 50, 2–3. [13] M. Perez, R. Perez, 2015, 62, 4. [14] W. Lubitz, M. Chrysina, N. Cox, Photosynthesis Research 2019. [15] J. P. McEvoy, G. W. Brudvig, Chem. Rev. 2006, 106, 4455–4483. [16] J. P. McEvoy, J. A. Gascon, V. S. Batista, G. W. Brudvig, Photochem. Photobiol. Sci. 2005, 4, 940–949. [17] L. V. Kulik, B. Epel, W. Lubitz, J. Messinger, J. Am. Chem. Soc. 2007, 129, 13421–13435. [18] B. Limburg, E. Bouwman, S. Bonnet, ACS Catal. 2016, 6, 5273–5284. [19] T. Ishizuka, A. Watanabe, H. Kotani, D. Hong, K. Satonaka, T. Wada, Y. Shiota, K. Yoshizawa, K. Ohara,
K. Yamaguchi, et al., Inorg. Chem. 2016, 55, 1154–1164. [20] T. J. Wydrzynski, W. Hillier, Molecular Solar Fuels, The Royal Society Of Chemistry, 2012. [21] S. Funyu, T. Isobe, S. Takagi, D. A. Tryk, H. Inoue, J. Am. Chem. Soc. 2003, 125, 5734–5740. [22] S. Funyu, M. Kinai, D. Masui, S. Takagi, T. Shimada, H. Tachibana, H. Inoue, Photochemical &
photobiological sciences : Official journal of the European Photochemistry Association and the European Society for Photobiology 2010, 9, 931–936.
[23] S. Fukuzumi, T. Kishi, H. Kotani, Y.-M. Lee, W. Nam, Nature Chemistry 2010, 3, 38. [24] W. Chen, F. N. Rein, R. C. Rocha, Angewandte Chemie International Edition 2009, 48, 9672–9675. [25] J. A. Treadway, J. A. Moss, T. J. Meyer, Inorg. Chem. 1999, 38, 4386–4387. [26] D. L. Ashford, W. Song, J. J. Concepcion, C. R. K. Glasson, M. K. Brennaman, M. R. Norris, Z. Fang, J. L.
Templeton, T. J. Meyer, J. Am. Chem. Soc. 2012, 134, 19189–19198. [27] E. A. Karlsson, B.-L. Lee, R.-Z. Liao, T. Åkermark, M. D. Kärkäs, V. S. Becerril, P. E. M. Siegbahn, X. Zou,
M. Abrahamsson, B. Åkermark, ChemPlusChem 2014, 79, 936–950. [28] E. Y. Tsui, R. Tran, J. Yano, T. Agapie, Nat Chem 2013, 5, 293–299. [29] L.-X. Xue, T.-T. Meng, W. Yang, K.-Z. Wang, Journal of Photochemistry and Photobiology B: Biology
2015, 152, 95–105. [30] Z. Yu, F. Li, L. Sun, Energy Environ. Sci. 2015, 8, 760–775. [31] H. Berglund-Baudin, L. Sun, R. Davidov, M. Sundahl, S. Styring, B. Åkermark, M. Almgren, L.
Hammarström, The Journal of Physical Chemistry A 1998, 102, 2512–2518. [32] C. Herrero, J. L. Hughes, A. Quaranta, N. Cox, A. W. Rutherford, W. Leibl, A. Aukauloo, Chemical
Communications 2010, 46, 7605. [33] C. Herrero, A. Quaranta, R.-A. Fallahpour, W. Leibl, A. Aukauloo, The Journal of Physical Chemistry C
2013, 117, 9605–9612.
120
[34] V. Balzani, N. Sabbatini, F. Scandola, Chem. Rev. 1986, 86, 319–337. [35] M. H. V. Huynh, D. M. Dattelbaum, T. J. Meyer, Coordination Chemistry Reviews 2005, 249, 457–483. [36] D. P. Rillema, C. B. Blanton, R. J. Shaver, D. C. Jackman, M. Boldaji, S. Bundy, L. A. Worl, T. J. Meyer,
Inorg. Chem. 1992, 31, 1600–1606. [37] S. Campagna, F. Puntoriero, F. Nastasi, G. Bergamini, V. Balzani, in Photochemistry and Photophysics
of Coordination Compounds I (Eds.: V. Balzani, S. Campagna), Springer Berlin Heidelberg, Berlin, Heidelberg, 2007, pp. 117–214.
[38] A. Juris, V. Balzani, F. Barigelletti, S. Campagna, P. Belser, A. von Zelewsky, Coordination Chemistry Reviews 1988, 84, 85–277.
[39] K. Kalyanasundaram, Coordination Chemistry Reviews 1982, 46, 159–244. [40] P. A. Anderson, G. F. Strouse, J. A. Treadway, F. R. Keene, T. J. Meyer, Inorg. Chem. 1994, 33, 3863–
3864. [41] J.-P. Collin, R. Kayhanian, J.-P. Sauvage, G. Calogero, F. Barigelletti, A. De Cian, J. Fischer, Chem.
Commun. 1997, 775–776. [42] J. M. Gonçalves, T. A. Matias, K. C. F. Toledo, K. Araki, in Advances in Inorganic Chemistry (Eds.: R. van
Eldik, C.D. Hubbard), Academic Press, 2019, pp. 241–303. [43] S. Fukuzumi, D. Hong, European Journal of Inorganic Chemistry 2014, 2014, 645–659. [44] B. M. Hunter, H. B. Gray, A. M. Müller, Chem. Rev. 2016, 116, 14120–14136. [45] A. Singh, S. L. Y. Chang, R. K. Hocking, U. Bach, L. Spiccia, Energy Environ. Sci. 2013, 6, 579–586. [46] D. J. Wasylenko, R. D. Palmer, C. P. Berlinguette, Chem. Commun. 2013, 49, 218–227. [47] C. Panda, J. Debgupta, D. Díaz Díaz, K. K. Singh, S. Sen Gupta, B. B. Dhar, J. Am. Chem. Soc. 2014, 136,
12273–12282. [48] E. A. Karlsson, B.-L. Lee, T. Åkermark, E. V. Johnston, M. D. Kärkäs, J. Sun, Ö. Hansson, J.-E. Bäckvall,
B. Åkermark, Angewandte Chemie International Edition 2011, 50, 11715–11718. [49] H.-Y. Wang, E. Mijangos, S. Ott, A. Thapper, Angewandte Chemie International Edition 2014, 53,
14499–14502. [50] S. Nestke, E. Ronge, I. Siewert, Dalton Transactions 2018, 47, 10737–10741. [51] M.-T. Zhang, Z. Chen, P. Kang, T. J. Meyer, J. Am. Chem. Soc. 2013, 135, 2048–2051. [52] R. Ruiz, C. Surville-Barland, A. Aukauloo, E. Anxolabehere-Mallart, Y. Journaux, J. Cano, M. C. Muñoz,
Journal of the Chemical Society, Dalton Transactions 1997, 745–752. [53] X. Ottenwaelder, R. Ruiz-García, G. Blondin, R. Carasco, J. Cano, D. Lexa, Y. Journaux, A. Aukauloo,
Chem. Commun. 2004, 504–505. [54] S. M. Barnett, K. I. Goldberg, J. M. Mayer, Nat Chem 2012, 4, 498–502. [55] P. Garrido-Barros, I. Funes-Ardoiz, S. Drouet, J. Benet-Buchholz, F. Maseras, A. Llobet, J. Am. Chem.
Soc. 2015, 137, 6758–6761. [56] M. K. Coggins, M.-T. Zhang, Z. Chen, N. Song, T. J. Meyer, Angewandte Chemie International Edition
2014, 53, 12226–12230. [57] T. Zhang, C. Wang, S. Liu, J.-L. Wang, W. Lin, J. Am. Chem. Soc. 2014, 136, 273–281. [58] L. A. Stott, K. E. Prosser, E. K. Berdichevsky, C. J. Walsby, J. J. Warren, Chem. Commun. 2017, 53, 651–
654. [59] A. Prevedello, I. Bazzan, N. Dalle Carbonare, A. Giuliani, S. Bhardwaj, C. Africh, C. Cepek, R. Argazzi, M.
Bonchio, S. Caramori, et al., Chemistry – An Asian Journal 2016, 11, 1281–1287. [60] S. J. Koepke, K. M. Light, P. E. VanNatta, K. M. Wiley, M. T. Kieber-Emmons, J. Am. Chem. Soc. 2017,
139, 8586–8600. [61] R. A. Marcus, The Journal of Physical Chemistry B 1998, 102, 10071–10077. [62] N. Bjerrum, Danske Vid. Selskab, Math.-fys. medd 1926, 7, 1–48. [63] M. Szwarc, Ions and Ion Pairs in Organic Reactions, Wiley- Interscience, 1972. [64] K. Y, L. G, S. Michael, Journal of the American Chemical Society 1971, 93, 4614.
121
[65] C. Reichardt, SolVent and SolVent Effects in Organic Chemistry, VCH: New York, 1988. [66] J. H. Montoya, L. C. Seitz, P. Chakthranont, A. Vojvodic, T. F. Jaramillo, J. K. Nørskov, Nature Materials
2017, 16, 70–81. [67] N. S. Lewis, D. G. Nocera, Proceedings of the National Academy of Sciences 2006, 103, 15729–15735. [68] V. Balzani, A. Credi, M. Venturi, ChemSusChem 2008, 1, 26–58. [69]T. R. Simmons, G. Berggren, M. Bacchi, M. Fontecave, V. Artero, Coordination Chemistry Reviews 2014,
270–271, 127–150. [70] H. Takeda, C. Cometto, O. Ishitani, M. Robert, ACS Catal. 2017, 7, 70–88. [71] H. Dau, A. Grundmeier, P. Loja, M. Haumann, Philos. Trans. Royal Soc. B 2008, 363, 1237–1243. [72] M. D. Kärkäs, O. Verho, E. V. Johnston, B. Åkermark, Chem. Rev. 2014, 114, 11863–12001. [73] S. W. Gersten, G. J. Samuels, T. J. Meyer, J. Am. Chem. Soc. 1982, 104, 4029–4030. [74] C. W. Chronister, R. A. Binstead, J. Ni, T. J. Meyer, Inorg. Chem. 1997, 36, 3814–3815. [75] J. F. Hull, D. Balcells, J. D. Blakemore, C. D. Incarvito, O. Eisenstein, G. W. Brudvig, R. H. Crabtree, J.
Am. Chem. Soc. 2009, 131, 8730–8731. [76] K. S. Joya, N. K. Subbaiyan, F. D’Souza, H. J. M. de Groot, Angew. Chem., Int. Ed. 2012, 51, 9601–9605. [77] J. S. Kanady, E. Y. Tsui, M. W. Day, T. Agapie, Science 2011, 333, 733. [78] C. Zhang, C. Chen, H. Dong, J.-R. Shen, H. Dau, J. Zhao, Science 2015, 348, 690. [79] M.-T. Zhang, Z. Chen, P. Kang, T. J. Meyer, J. Am. Chem. Soc. 2013, 135, 2048–2051. [80] J. Serrano-Plana, I. Garcia-Bosch, A. Company, M. Costas, Acc. Chem. Res. 2015, 48, 2397–2406. [81] P. Garrido-Barros, C. Gimbert-Suriñach, D. Moonshiram, A. Picón, P. Monge, V. S. Batista, A. Llobet, J.
Am. Chem. Soc. 2017, 139, 12907–12910. [82] R. Ruiz, C. Surville-Barland, A. Aukauloo, E. Anxolabehere-Mallart, Y. Journaux, J. Cano, M. C. Muñoz,
Dalton Trans. 1997, 745–752. [83] F. C. Anson, T. J. Collins, T. G. Richmond, B. D. Santarsiero, J. E. Toth, B. G. R. T. Treco, J. Am. Chem.
Soc. 1987, 109, 2974–2979. [84] S. W. Gordon-Wylie, B. L. Claus, C. P. Horwitz, Y. Leychkis, J. M. Workman, A. J. Marzec, G. R. Clark, C.
E. F. Rickard, B. J. Conklin, S. Sellers, et al., Chem. Eur. J. 1998, 4, 2173–2181. [85] J. J. Steggerda, J. J. Bour, P. J. M. W. L. Birker, Inorg. Chem. 1971, 10, 1202–1205. [86] J. Soto, R. Martinez-Manez, J. Paya, F. Lloret, M. Julve, Transition Metal Chemistry 1993, 18, 69–72. [87] F. Lloret, J. Sletten, R. Ruiz, M. Julve, J. Faus, M. Verdaguer, Inorg. Chem. 1992, 31, 778–784. [88] H. Ojima, K. Nonoyama, Coordination Chemistry Reviews 1988, 92, 85–111. [89] F. Lloret, M. Julve, J. Faus, Y. Journaux, M. Philoche-Levisalles, Y. Jeannin, Inorg. Chem. 1989, 28,
3702–3706. [90] T. Watanabe, K. Honda, J. Phys. Chem. 1982, 2617. [91] N. Chitose, J. A. LaVerne, Y. Katsumura, J. Phys. Chem. A 1998, 2087. [92] M. Borja, P. K. Dutta, Nature 1993, 362, 43–45. [93] X. ZHU, M. HUANG, J. LI, H. HE, X. ZHANG, S. WANG, Analytical Sciences 2017, 33, 585–590. [94] S. H. Kang, Y.-M. Jeon, K. Kim, S. Houbrechts, E. Hendrickx, A. Persoons, J. Chem. Soc., Chem. Commun.
1995, 635–636. [95] E. Pizzolato, M. Natali, B. Posocco, A. Montellano López, I. Bazzan, M. Di Valentin, P. Galloni, V. Conte,
M. Bonchio, F. Scandola, et al., Chem. Commun. 2013, 49, 9941–9943. [96] M. D. Kärkäs, T. Åkermark, E. V. Johnston, S. R. Karim, T. M. Laine, B.-L. Lee, T. Åkermark, T. Privalov,
B. Åkermark, Angewandte Chemie International Edition 2012, 51, 11589–11593. [97] J.-M. Lehn, R. Ziessel, Proc Natl Acad Sci USA 1982, 79, 701. [98] C. Zoski, Handbook of Electrochemistry - 1st Edition, Elsevier Science, 2007. [99]A. J. Bard, L. R. Faulkner, Electrochemical Methods: Fundamentals and Applications, John Wiley & Sons,
2006.
122
[100] N. Elgrishi, K. J. Rountree, B. D. McCarthy, E. S. Rountree, T. T. Eisenhart, J. L. Dempsey, J. Chem. Educ. 2018, 95, 197–206. [101] A. de Aguirre, P. Garrido-Barros, I. Funes-Ardoiz, F. Maseras, European Journal of Inorganic Chemistry 2019, DOI 10.1002/ejic.201801534. [102] C. Costentin, J.-M. Savéant, ChemElectroChem 2014, 1, 1226–1236. [103] C. Costentin, S. Drouet, M. Robert, J.-M. Savéant, J. Am. Chem. Soc. 2012, 134, 11235–11242. [104] O. Poizat, C. Sourisseau, J. Corset, Journal of Molecular Structure 1986, 143, 203–206. [105] V. Novakovic, M. Z. Hoffman, Journal of the American Chemical Society 1987, 109, 2341–2346. [106] Farhana Haque, MS Rahman, Etmina Ahmed, PK Bakshi, AA Shaikh, DUJS 2013, 61. [107] E. M. Kosower, J. L. Cotter, Journal of the American Chemical Society 1964, 86, 5524–5527. [108] K. Kim, N. Selvapalam, Y. H. Ko, K. M. Park, D. Kim, J. Kim, Chem. Soc. Rev. 2007, 36, 267–279. [109] V. Van Even, M. C. Haulait-Pirson, Journal of Solution Chemistry 1977, 6, 757–770. [110] J. Peisach, W. E. Blumberg, Archives of Biochemistry and Biophysics 1974, 165, 691–708. [111] B. Bennett, J. M. Kowalski, Methods Enzymol 2015, 563, 341–361. [112] A. K. Poulsen, A. Rompel, C. J. McKenzie, Angewandte Chemie International Edition 2005, 44, 6916– 6920. [113] W. Rüttinger, G. C. Dismukes, Chem. Rev. 1997, 97, 1–24. [114] L. Hammarstrom, Current Opinion in Chemical Biology 2003, 7, 666–673. [115] M. D. Kärkäs, T. Akermark, E. V. Johnston, S. R. Karim, T. M. Laine, B.-L. Lee, T. Akermark, T. Privalov, B. Akermark, Angewandte Chemie (International ed. in English) 2012, 51, 11589–11593. [116] C. Hiort, P. Lincoln, B. Norden, J. Am. Chem. Soc. 1993, 115, 3448–3454. [117] G. Sprintschnik, H. W. Sprintschnik, P. P. Kirsch, D. G. Whitten, J. Am. Chem. Soc. 1976, 98, 2337– 2338. [118] T. Kurahashi, A. Kikuchi, T. Tosha, Y. Shiro, T. Kitagawa, H. Fujii, Inorg. Chem. 2008, 47, 1674–1686. [119] T. Kurahashi, A. Kikuchi, Y. Shiro, M. Hada, H. Fujii, Inorg. Chem. 2010, 49, 6664–6672. [120] S. El Ghachtouli, B. Lassalle-Kaiser, P. Dorlet, R. Guillot, E. Anxolabéhère-Mallart, C. Costentin, A.
Aukauloo, Energy Environ. Sci. 2011, 4, 2041–2044.

123
Annex.

124

125
Annex
(A) Experimental part
A.1. Electrochemistry
A.1.1 Cyclic Voltammetry
Cyclic voltammetry (CV) is a transient technique in which the potential is scanned between two
limiting values (Fig. A-1) and the resulting current crossing the system measured, giving rise to
graphs named cyclic voltammograms (I = f(E)). Cyclic voltammetry has become a very popular
technique for initial electrochemical studies of new systems and has proven useful in obtaining
information about complicated electrode reactions.
Figure A-1 Electrochemical cell for cyclic voltammetry.
Figure A-2 (A) Cyclic potential sweep ramp, (B) Resulting cyclic voltammogram.

126
A potentiostat from AUTOLAB 204, controlled by the NOVA 1.10 software, was used for cyclic
voltammetry (CV), Differenctial Potential Voltammetry (DPV) and Chronoamperometry (CA). A
conventional three-electrode compartment cell was used. The working electrode was a glassy
carbon electrode, GCE (diameter = 3mm, area = 0.07 mm2, Fig. A-3), the reference electrode was
a silver-silver chloride electrode (Ag/AgCl) for aqueous solution, silver-silver nitrate electrode
(Ag/AgNO3) for non-aqueous solution and Saturated Calomel Electrode (SCE) for both aqueous
and non-aqueous solution. The counter electrode was a platinum electrode. All studies were
carried out at room temperature and kept under an argon flow. Most of the CVs were obtained
under the following experimental conditions: a scan rate of 100 mVs-1. The GCE was conditioned
by a polishing procedure using diamond pastes of 6, 3 and 1 μm on a micro-cloth polishing pad,
and then the electrode was rinsed with ultra-pure water for aqueous experiments and with
acetone and ethanol for non-aqueous experiments.
Figure A-3 Glassy carbon electrode
A.1.2 Controlled-Potential Coulometry
Controlled-potential coulometry is based on an exhaustive electrolysis of the analyte
in which we apply a constant potential to the electrochemical cell. The analyte is completely
oxidized or reduced at the working electrode or that it reacts completely with a reagent
generated at the working electrode.
During an electrolysis, the total charge, Q, in coulombs, passing through the electrochemical cell
is proportional to the absolute amount of analyte by Faraday’s law,

127
Q = nFN0
where n is the overall number of electrons per mole of analyte consumed in the experiment, F is
Faraday's constant (96,485 C/mol), and N0 is the total moles of redox species present. A coulomb
is equivalent to an A⋅sec. Thus, when passing a constant current, i, the total charge is
Q = i × te
where te is the electrolysis time. If the current varies with time, as it does in controlled- potential
coulometry, then the total charge is
Figure A-4 Total charge area by using CPC
The technique of controlled-potential coulometry (CPC) was used to oxidise H2O in the presence
of the metal complex and an applied potential at which water oxidation occurred. The purpose
was to assess the quantity of oxygen involved during water oxidation so that faraday’s efficiency
could be calculated. The Faraday efficiency (FE) of oxygen evolution is determined according to
the expression :
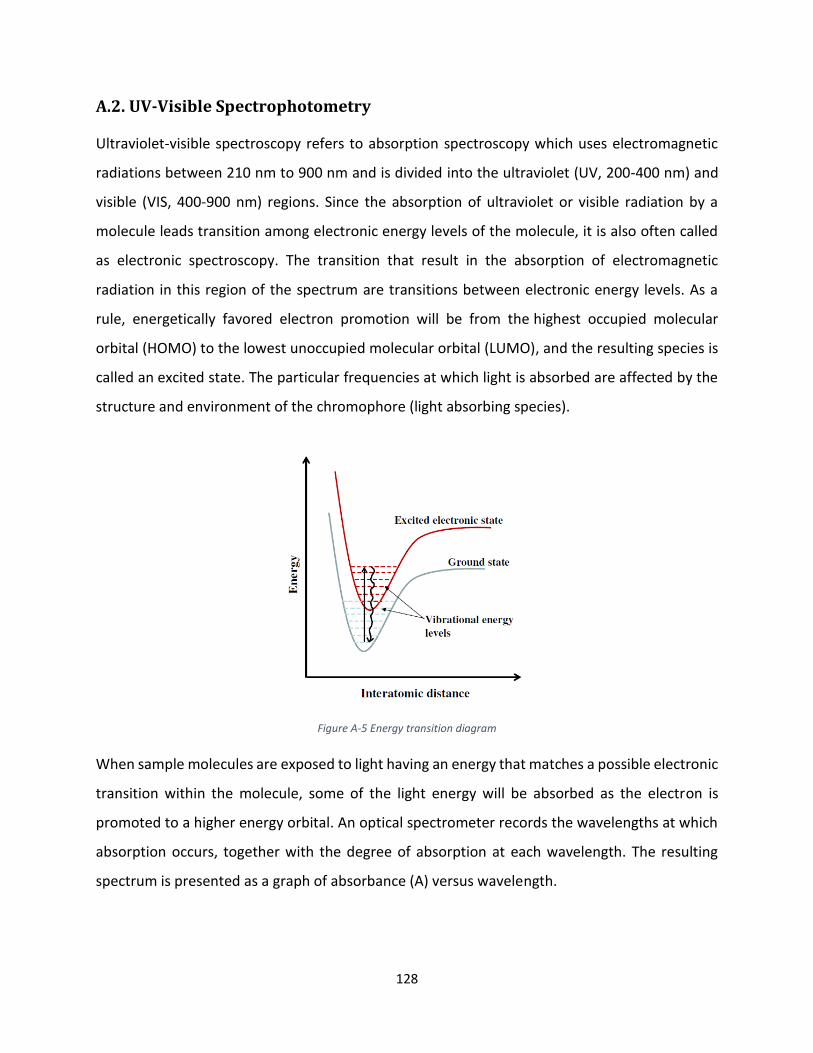
128
A.2. UV-Visible Spectrophotometry
Ultraviolet-visible spectroscopy refers to absorption spectroscopy which uses electromagnetic
radiations between 210 nm to 900 nm and is divided into the ultraviolet (UV, 200-400 nm) and
visible (VIS, 400-900 nm) regions. Since the absorption of ultraviolet or visible radiation by a
molecule leads transition among electronic energy levels of the molecule, it is also often called
as electronic spectroscopy. The transition that result in the absorption of electromagnetic
radiation in this region of the spectrum are transitions between electronic energy levels. As a
rule, energetically favored electron promotion will be from the highest occupied molecular
orbital (HOMO) to the lowest unoccupied molecular orbital (LUMO), and the resulting species is
called an excited state. The particular frequencies at which light is absorbed are affected by the
structure and environment of the chromophore (light absorbing species).
Figure A-5 Energy transition diagram
When sample molecules are exposed to light having an energy that matches a possible electronic
transition within the molecule, some of the light energy will be absorbed as the electron is
promoted to a higher energy orbital. An optical spectrometer records the wavelengths at which
absorption occurs, together with the degree of absorption at each wavelength. The resulting
spectrum is presented as a graph of absorbance (A) versus wavelength.

129
Figure A-6 Absorbance and Beers-Lambert law
The absorption, A is defined as log(I0/I), where I0 is the intensity of the incident light and I is the
intensity of the transmitted light. The Beer-Lambert law quantifies the process of absorption. At
a given wavelength,
A = εcl
Where ε is the extinction co-efficient, c is the concentration of the sample in the cuvette and l is
the length of the light path through the sample. The extinction co-efficient is a constant for the
absorbing species and defines the absorption of the species at a particular wavelength. It is
determined by the number and type of chromophores present in each molecule of the absorbing
species.
The fundamental characterization of chemicals such as MLCT of [Ru(bpy)3]2+ and metal
complexes were assessed using UV-Visible spectrophotometry (Cary 5000 spectrophotometer)
with 1 cm or 1 mm quartz cell. It used to determine ε of compounds based on Beer-Lambert law.
For kinetic study of ion pair formation between Cu complex and MV2+ , mostly kinetic spectra
(time drive) technique used.

130
A.3. Infrared (IR) Spectroscopy
Figure A-7 Infrared functional group diagram
Many functional groups absorb infrared radiation at the certain wavenumber, regardless of the
structure of the rest of the molecule. That is, normal way to approach interpretation of an IR
spectrum is to identify the functional group region to determine which groups might be present,
then to note any unusually strong bands or particularly prominent patterns in the fingerprint
region. The group frequency region is from 4000 to 1200 cm-1 and the peaks in this region are
characteristic of specific kinds of bonds, and therefore can be used to identify whether a specific
functional group is present. The region of the infrared spectrum from 1200 to 700 cm-1 is called
the fingerprint region and is notable for the large number of infrared bands that are found there.
Peaks in this region arise from complex deformations of the molecule. They may be characteristic
of molecular symmetry, or combination bands arising from multiple bonds deforming
simultaneously.
In the experiment, the concentration of the sample in KBr was in 2 %. In this case, I used 100 mg
of KBr with 2 mg of samples (MVCl2, CuLMV, CuL(TMA)2). In the pump chamber, pumped until
the pressure reaches 10 ton then left for 2 min. After removing the pallet which should be
homogenous and transparent in appearance, inserted into the IR sample holder.

131
A.4. Nuclear magnetic resonance (NMR) Spectroscopy
NMR spectroscopy is useful tool both studying different properties of atomic nuclei and
determining the molecular structure of organic compounds.
Figure A-8 Charged spins of electron and its energy diagram as function of magnetic field.
Considering electrons have a +1/2, -1/2 spin, charged spins create a magnetic field (magnetic
moment). The nuclei which has half-interger spin such as hydrogen (1H), 13C isotope of carbon,
15N isotope of nitrogen, 19F isotope of fluorine, and the 31P isotope of phosphorus, all they have
magnetic moments that can be detectable by NMR.
For 1H NMR spectra of organic molecules it can be measured in solution state. In this case, not to
interfere from solvent protons, deuterated (deuterium = 2H, often symbolized as D) solvents are
used in NMR. (deuterated water, D2O, deuterated acetone, (CD3)2CO, deuterated methanol,
CD3OD, deuterated dimethyl sulfoxide, (CD3)2SO, and deuterated chloroform, CDCl3.)
However, carbon tetrachloride, CCl4 or carbon disulfide, CS2, which don’t have hydrogen can be
used.
Figure A-9. 1H NMR Approximate Chemical Shift Ranges

132
Chemical shift which is the x-axis of an NMR spectrum gives information the structural
environments in a molecule. In a 1H NMR spectrum, the number of signals correspond to the
number of distinct proton surroundings. The 1H NMR chemical shifts generally fall in the range of
13–0 ppm, which is the resonant frequency in a magnetic field. Electron density of molecule
affect to the local magnetic environment of nucleus indicates that the actual frequency produced
by the nuclei and it gives the NMR signals.
Integration of Signal Area in a 1H NMR spectrum represents to the number of hydrogen atoms.
The height of the integral brings the information of the ratio between the height associated with
one and another signal so that it is possible to compare the number of hydrogen atoms in each.
Spin-Spin Coupling (signal splitting or signal multiplicity) is another property of 1H NMR spectra
and it gives the information about the structure of a compound. It is due to the magnetic effect
of nonequivalent hydrogen atoms. A group of equivalent atoms are split into multiple peaks and
a rule ‘n+1’ explain the number of peaks in a 1H NMR signal.
Figure A-10 Spin-spin coupling
In the experiments, mostly 1H NMR spectra were used for the analysis of ligand OPBI, using
deuterated dimethyl sulfoxide, (CD3)2SO as solvent. The spectra were recorded on AM360 (360
MHz) spectrometers. The chemical shifts δ were described in ppm and coupling constants J were
given in hertz (Hz).

133
A.5. Electron Paramagnetic Resonance (EPR)
Electron paramagnetic resonance spectroscopy (EPR) (or electron spin resonance, ESR) is a
spectroscopic technique to study unpaired electrons in chemical species. EPR spectroscopy has a
crucial role in organic and inorganic radicals, transition metal complexes, and some biomolecules.
Generally, EPR and NMR has similar concept, however in EPR the magnetic moments observe
nuclear spins rather than electron spins.
EPR spectrometers analysis the absorption of electromagnetic radiation. A example of the EPR
spectra is shown in Fig. A-11. The normal absorption shows as on the above in the figure but
usually they present the converted signal to its derivative (on the bottom). In the EPR spectrum,
the x-axis represents to the magnetic field with the unit gauss (G) or tesla (T) which is 10000 times
of gauss. That is, the peak of absorption spectrum corresponds to the spectrum passes through
zero.
Figure A-11 Comparison of absorption spectrum and EPR spectrum.
Proportionality factor (g-factor) and Hyperfine Interactions
There are 2 main factors in EPR : Proportionality factor (g-factor) and Hyperfine Interactions. For
the g-factor, based on the Zeeman Effect the energy difference of an electron with s=1/2 in
magnetic field can be expressed as below. According to Plank’s law ΔE=hv ( h is Planck’s constant),
the microwave frequency involve in the equation where β is the constant, Bohr magneton and
the magnetic field B.
ΔE=gβB = hν
The g-factor is a constant of proportionality which represent the property of the electron. By
using the constant values of h and β, g value can be shown as below.
g=71.4484v(in GHz)/B (in mT)

134
Knowing the magnetic field and microwave frequency can give the g factor. For example, at the
magnetic field of 331.85 mT, a free electron absorbs the microwave with an X-band frequency of
9.300 GHz so, a free electron in vacuum has a g value ge= 2.00232.
On the other case, when the electron is in a certain circumstance, such as transition metal-ion
complex, the additional magnetic field produced by the nuclei, ΔB, will also affect the electron.
At this kind of surrounding, Equation will be
hν=gβ(Be+ΔB)
A fingerprint which is Δg includes the chemical information like the interaction between the
electron and the electronic structure of the molecule. Simply we express the value of g = ge+ Δg
as a fingerprint of the molecule. For organic radicals, the g value is very close to ge with values
ranging from 1.99-2.01. For transition metal complexes, the g value diverse in large range (1.4-
3.0) because of the spin-orbit coupling and zero-field splitting and it depends on the geometry of
the complex. The center of the signal apply to calculate the g factor of the absorption in the
spectrum. The value of g factor is related to the electronic environment, as well as related to
anisotropy.
The magnetic moments of atoms nuclei in a molecule or complex are their own properties. The
hyperfine interaction is occurred between the electron and the nuclei produced local magnetic
field. The energy level of the electron is below, where
E = gmBB0MS + aMsmI
B0 is applied magnetic field, a is the hyperfine coupling constant, mI is the nuclear spin quantum
number. Hyperfine interactions give many information such as the number and identity of atoms
in a molecule or compound, distance from the unpaired electron.
Table A-1 Bio transition metal nuclear spins and EPR hyperfine pattern
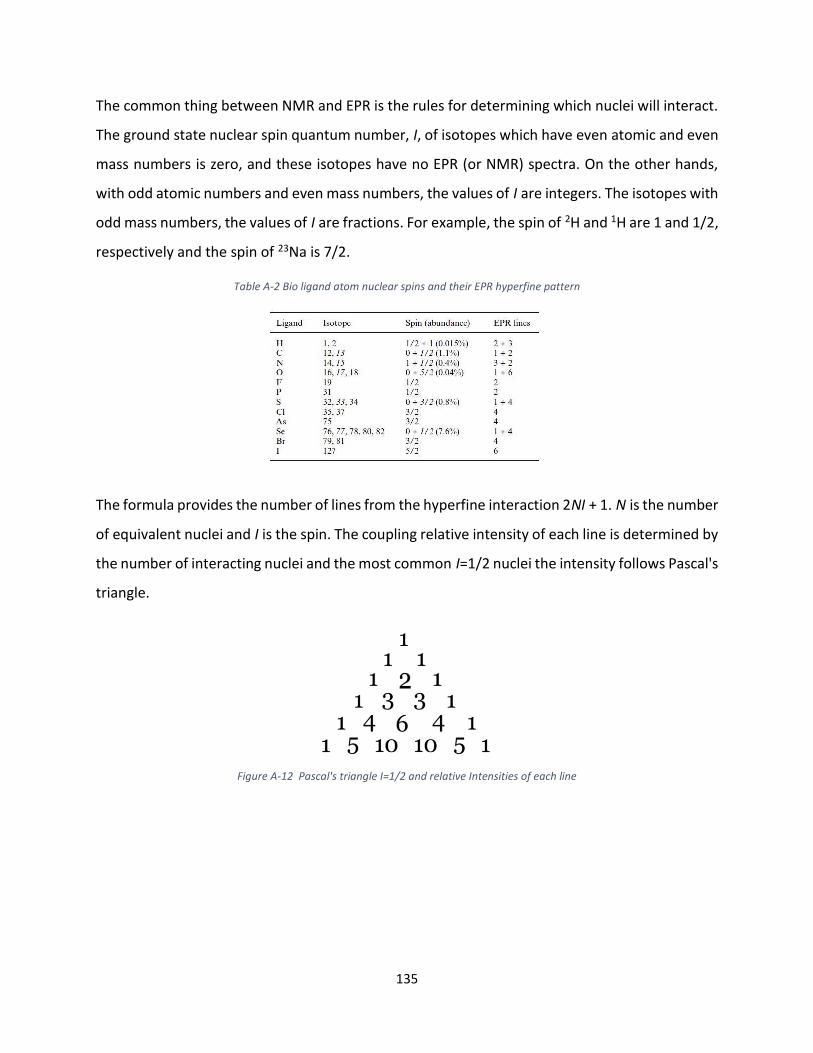
135
The common thing between NMR and EPR is the rules for determining which nuclei will interact.
The ground state nuclear spin quantum number, I, of isotopes which have even atomic and even
mass numbers is zero, and these isotopes have no EPR (or NMR) spectra. On the other hands,
with odd atomic numbers and even mass numbers, the values of I are integers. The isotopes with
odd mass numbers, the values of I are fractions. For example, the spin of 2H and 1H are 1 and 1/2,
respectively and the spin of 23Na is 7/2.
Table A-2 Bio ligand atom nuclear spins and their EPR hyperfine pattern
The formula provides the number of lines from the hyperfine interaction 2NI + 1. N is the number
of equivalent nuclei and I is the spin. The coupling relative intensity of each line is determined by
the number of interacting nuclei and the most common I=1/2 nuclei the intensity follows Pascal's
triangle.
Figure A-12 Pascal's triangle I=1/2 and relative Intensities of each line
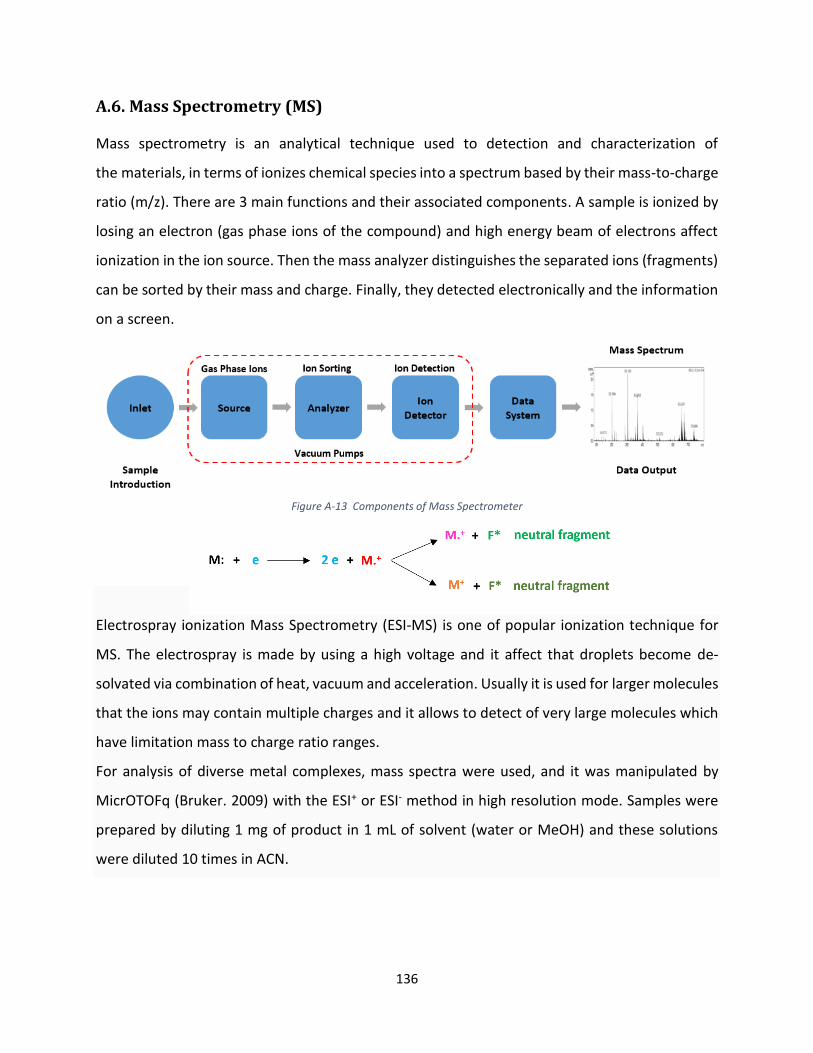
136
A.6. Mass Spectrometry (MS)
Mass spectrometry is an analytical technique used to detection and characterization of
the materials, in terms of ionizes chemical species into a spectrum based by their mass-to-charge
ratio (m/z). There are 3 main functions and their associated components. A sample is ionized by
losing an electron (gas phase ions of the compound) and high energy beam of electrons affect
ionization in the ion source. Then the mass analyzer distinguishes the separated ions (fragments)
can be sorted by their mass and charge. Finally, they detected electronically and the information
on a screen.
Figure A-13 Components of Mass Spectrometer
Electrospray ionization Mass Spectrometry (ESI-MS) is one of popular ionization technique for
MS. The electrospray is made by using a high voltage and it affect that droplets become de-
solvated via combination of heat, vacuum and acceleration. Usually it is used for larger molecules
that the ions may contain multiple charges and it allows to detect of very large molecules which
have limitation mass to charge ratio ranges.
For analysis of diverse metal complexes, mass spectra were used, and it was manipulated by
MicrOTOFq (Bruker. 2009) with the ESI+ or ESI- method in high resolution mode. Samples were
prepared by diluting 1 mg of product in 1 mL of solvent (water or MeOH) and these solutions
were diluted 10 times in ACN.

137
A.7. Transient Absorption (TA) / Laser Flash photolysis (LFP)
Transient Absorption / Laser Flash Photolysis is a technique applied by a short intense light pulse
from a pulsed laser source (pump source). It is used to study kinetic and mechanism of chemical
species by absorption and emission change at certain wavelength. The intense light pulse brings
photo-excited intermediates (excited states, radicals and ions) which might be long or short-lived
depends on the photo properties of the molecules. Then the absorption characters which
modified temporally can be observed. For a probe source, a spectrally continuous Xenon lamp is
used and to improve the photon flux it is operated in a pulsed mode. Kinetic and spectral mode
are two modes of operation of the laser flash photolysis spectrometer. In kinetic mode, it
provides the decay of the species at a single wavelength as a function of time. In spectral mode,
the spectra are measured at a specific time after excitation using an ICCD detector. The transient
spectral features give information of the transient species which was exposed only a few laser
shots. This is especially useful to study electron transfer which can easily influence by light.
Figure A-14. Kinetic data acquisition (left) and Spectral data acquisition (right)
Edinburgh Instruments LP920 flash photolysis spectrometer system was used for both transient
absorption kinetics and time-resolved spectral measurements. A Continuum Surelite Q-switched
Nd:YAG laser coupled with Continuum optical parametric oscillator (OPO) for sample excitation
(∼5 ns pulse duration at a wavelength of 460 nm with a typical laser energy of 10 mJ per flash)
was incorporated. The probe source was a pulsed 450 W xenon arc lamp for the transient
absorption measurements. Detection of the signal was performed either by a Hamamatsu
photomultiplier tube (PMT) for kinetic mode or a water-cooled Andor intensified charge coupled
device (ICCD) camera for spectral mode.
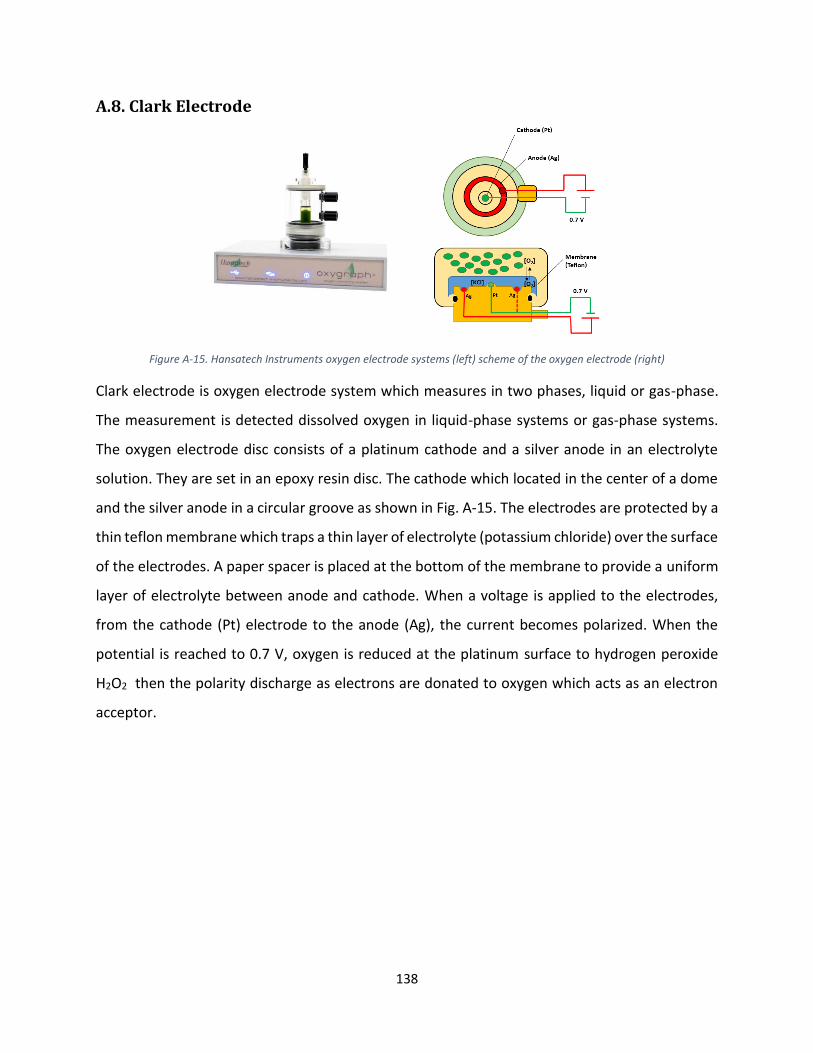
138
A.8. Clark Electrode
Figure A-15. Hansatech Instruments oxygen electrode systems (left) scheme of the oxygen electrode (right)
Clark electrode is oxygen electrode system which measures in two phases, liquid or gas-phase.
The measurement is detected dissolved oxygen in liquid-phase systems or gas-phase systems.
The oxygen electrode disc consists of a platinum cathode and a silver anode in an electrolyte
solution. They are set in an epoxy resin disc. The cathode which located in the center of a dome
and the silver anode in a circular groove as shown in Fig. A-15. The electrodes are protected by a
thin teflon membrane which traps a thin layer of electrolyte (potassium chloride) over the surface
of the electrodes. A paper spacer is placed at the bottom of the membrane to provide a uniform
layer of electrolyte between anode and cathode. When a voltage is applied to the electrodes,
from the cathode (Pt) electrode to the anode (Ag), the current becomes polarized. When the
potential is reached to 0.7 V, oxygen is reduced at the platinum surface to hydrogen peroxide
H2O2 then the polarity discharge as electrons are donated to oxygen which acts as an electron
acceptor.
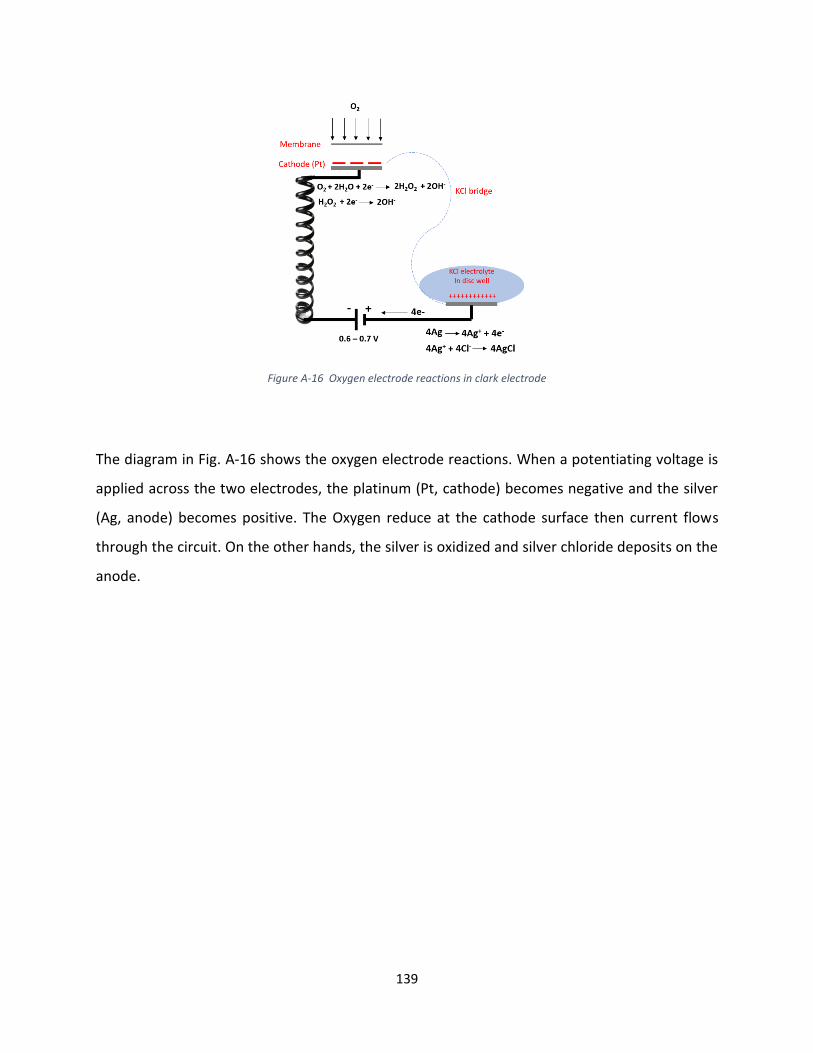
139
Figure A-16 Oxygen electrode reactions in clark electrode
The diagram in Fig. A-16 shows the oxygen electrode reactions. When a potentiating voltage is
applied across the two electrodes, the platinum (Pt, cathode) becomes negative and the silver
(Ag, anode) becomes positive. The Oxygen reduce at the cathode surface then current flows
through the circuit. On the other hands, the silver is oxidized and silver chloride deposits on the
anode.

140
A.9. Glove box system
Glove box is a leak-tight container to control atmospheres or to use with hazardous substances.
It protects from dangerous materials and provides safe surrounding for contamination or oxygen-
sensitive materials. As purpose, there are two types of glove boxes. To manipulate in oxygen-free
atmosphere, the glove box controlled by argon or nitrogen and we called it Inert atmosphere
work. In my experiment, to prevent the reaction of methylviologen (MV2+) with oxygen, the
experiments were manipulated in glove box.
Figure A-17. Glove box
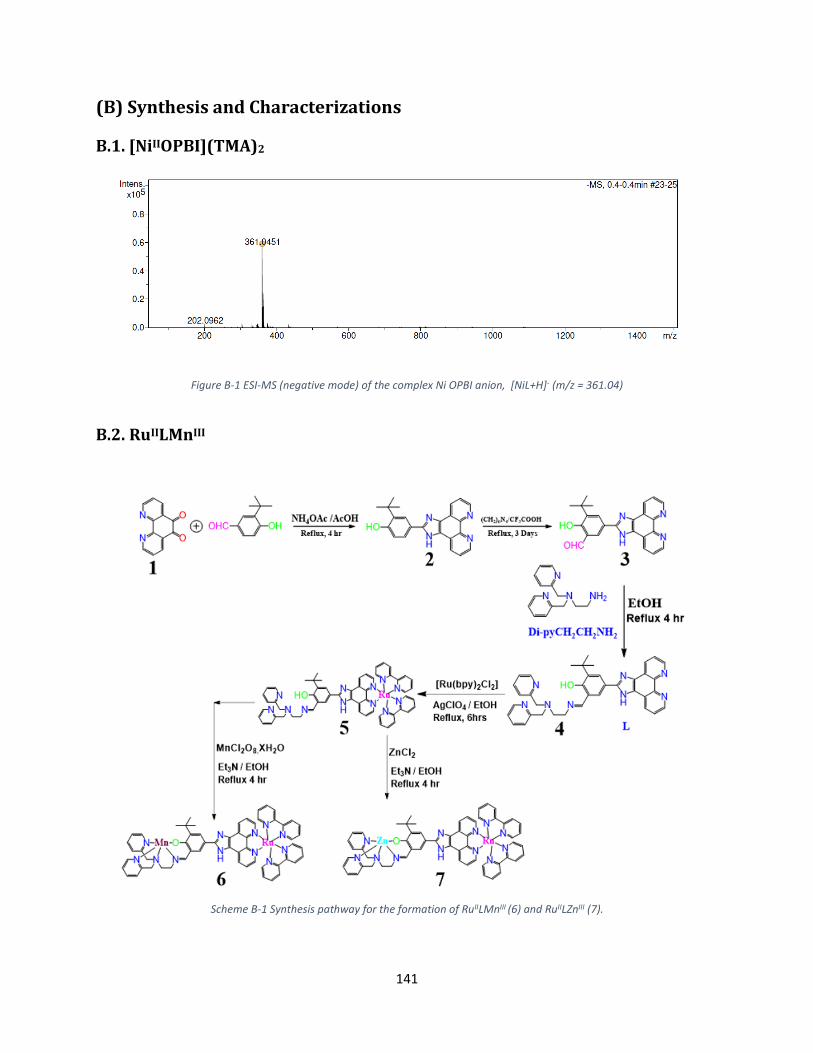
141
(B) Synthesis and Characterizations
B.1. [NiIIOPBI](TMA)2
Figure B-1 ESI-MS (negative mode) of the complex Ni OPBI anion, [NiL+H]- (m/z = 361.04)
B.2. RuIILMnIII
Scheme B-1 Synthesis pathway for the formation of RuIILMnIII (6) and RuIILZnIII (7).
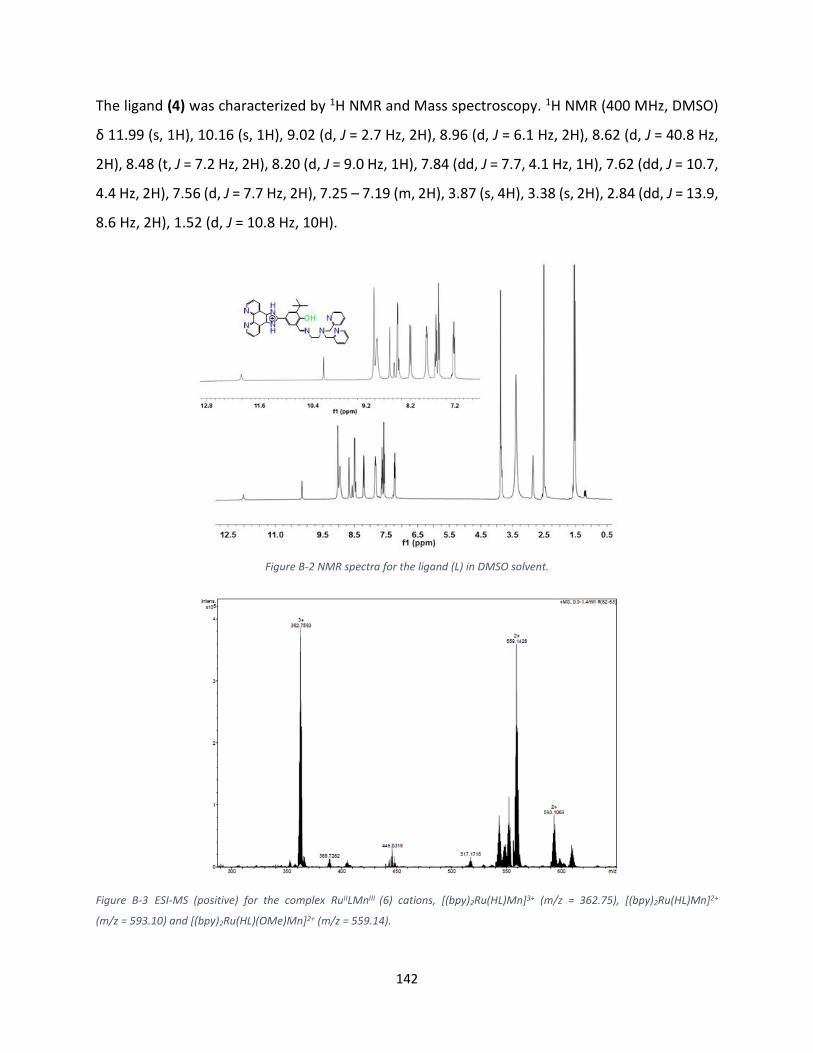
142
The ligand (4) was characterized by 1H NMR and Mass spectroscopy. 1H NMR (400 MHz, DMSO)
δ 11.99 (s, 1H), 10.16 (s, 1H), 9.02 (d, J = 2.7 Hz, 2H), 8.96 (d, J = 6.1 Hz, 2H), 8.62 (d, J = 40.8 Hz,
2H), 8.48 (t, J = 7.2 Hz, 2H), 8.20 (d, J = 9.0 Hz, 1H), 7.84 (dd, J = 7.7, 4.1 Hz, 1H), 7.62 (dd, J = 10.7,
4.4 Hz, 2H), 7.56 (d, J = 7.7 Hz, 2H), 7.25 – 7.19 (m, 2H), 3.87 (s, 4H), 3.38 (s, 2H), 2.84 (dd, J = 13.9,
8.6 Hz, 2H), 1.52 (d, J = 10.8 Hz, 10H).
Figure B-2 NMR spectra for the ligand (L) in DMSO solvent.
Figure B-3 ESI-MS (positive) for the complex RuIILMnIII (6) cations, [(bpy)2Ru(HL)Mn]3+ (m/z = 362.75), [(bpy)2Ru(HL)Mn]2+
(m/z = 593.10) and [(bpy)2Ru(HL)(OMe)Mn]2+ (m/z = 559.14).

143
(C) X-ray Crystal Structure
X-ray diffraction data for compounds was collected by using a VENTURE PHOTON100 CMOS
Bruker diffractometer with Micro-focus IuS source Mo Kα radiation. X-ray diffraction data were
collected by using a VENTURE PHOTON100 CMOS Bruker diffractometer with Micro-focus IuS
source Cu Kα radiation. Crystals were mounted on a CryoLoop (Hampton Research) with
Paratone-N (Hampton Research) as cryoprotectant and then flashfrozen in a nitrogen-gas stream
at 100 K. For compounds, the temperature of the crystal was maintained at the selected value
by means of a 700 series Cryostream or an N-Helix to within an accuracy of ±1K. The data were
corrected for Lorentz polarization, and absorption effects. The structures were solved by direct
methods using SHELXS-97 and refined against F by full-matrix least-squares techniques using
SHELXL-2018 with anisotropic displacement parameters for all non-hydrogen atoms. All
calculations were performed by using the Crystal Structure crystallographic software package
WINGX.
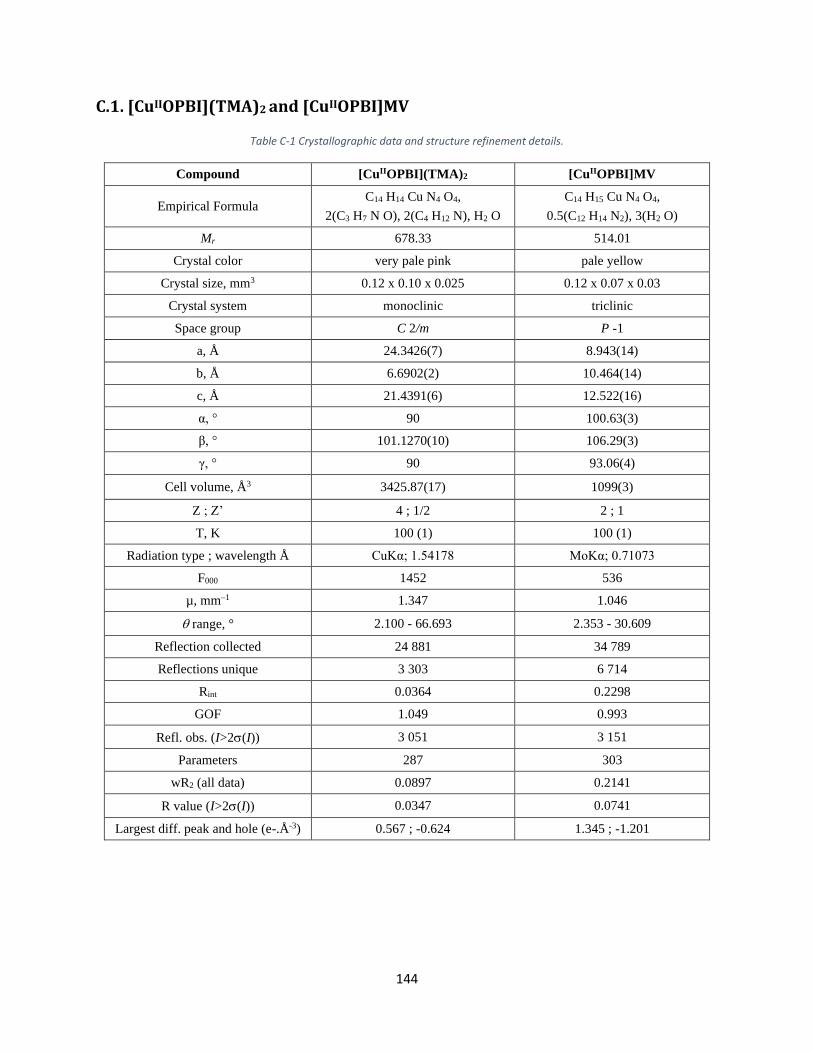
144
C.1. [CuIIOPBI](TMA)2 and [CuIIOPBI]MV
Table C-1 Crystallographic data and structure refinement details.
Compound [CuIIOPBI](TMA)2 [CuIIOPBI]MV
Empirical Formula C14 H14 Cu N4 O4,
2(C3 H7 N O), 2(C4 H12 N), H2 O
C14 H15 Cu N4 O4,
0.5(C12 H14 N2), 3(H2 O)
Mr 678.33 514.01
Crystal color very pale pink pale yellow
Crystal size, mm3 0.12 x 0.10 x 0.025 0.12 x 0.07 x 0.03
Crystal system monoclinic triclinic
Space group C 2/m P -1
a, Å 24.3426(7) 8.943(14)
b, Å 6.6902(2) 10.464(14)
c, Å 21.4391(6) 12.522(16)
α, ° 90 100.63(3)
β, ° 101.1270(10) 106.29(3)
γ, ° 90 93.06(4)
Cell volume, Å3 3425.87(17) 1099(3)
Z ; Z’ 4 ; 1/2 2 ; 1
T, K 100 (1) 100 (1)
Radiation type ; wavelength Å CuKα; 1.54178 MoKα; 0.71073
F000 1452 536
µ, mm–1 1.347 1.046
range, ° 2.100 - 66.693 2.353 - 30.609
Reflection collected 24 881 34 789
Reflections unique 3 303 6 714
Rint 0.0364 0.2298
GOF 1.049 0.993
Refl. obs. (I>2(I)) 3 051 3 151
Parameters 287 303
wR2 (all data) 0.0897 0.2141
R value (I>2(I)) 0.0347 0.0741
Largest diff. peak and hole (e-.Å-3) 0.567 ; -0.624 1.345 ; -1.201
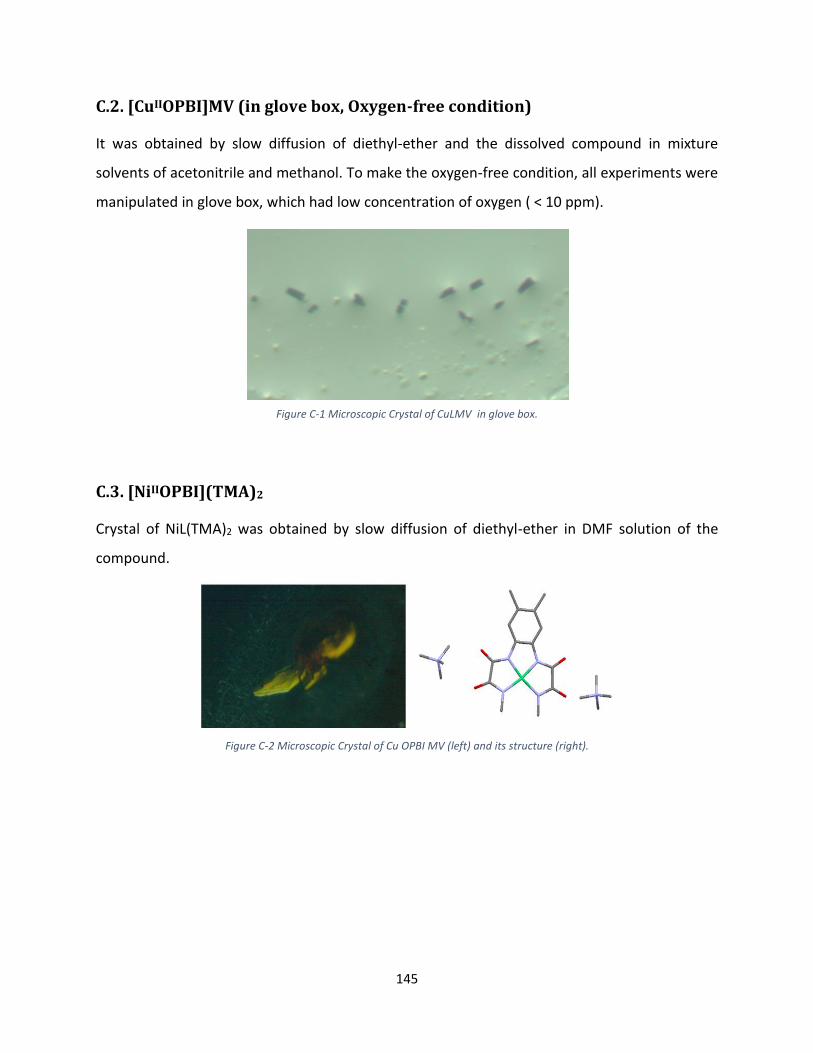
145
C.2. [CuIIOPBI]MV (in glove box, Oxygen-free condition)
It was obtained by slow diffusion of diethyl-ether and the dissolved compound in mixture
solvents of acetonitrile and methanol. To make the oxygen-free condition, all experiments were
manipulated in glove box, which had low concentration of oxygen ( < 10 ppm).
Figure C-1 Microscopic Crystal of CuLMV in glove box.
C.3. [NiIIOPBI](TMA)2
Crystal of NiL(TMA)2 was obtained by slow diffusion of diethyl-ether in DMF solution of the
compound.
Figure C-2 Microscopic Crystal of Cu OPBI MV (left) and its structure (right).

146
Table C-2 Crystallographic data and structure of NiL(TMA)2 refinement details.
Compound NiL(TMA)2
Empirical Formula C14 H14 N4 Ni O4,
2(C4 H12 N), 5/2(H2 O)
Mr 549.29
Crystal color orange
Crystal size, mm3 0.18 x 0.07 x 0.04
Crystal system monoclinic
Space group C 2/c
a, Å 16.7611(10)
b, Å 8.7767(5)
c, Å 37.022(2)
α, ° 90
β, ° 100.958(2)
γ, ° 90
Cell volume, Å3 5346.9(5)
Z ; Z’ 8 ; 1
T, K 100 (1)
Radiation type ; wavelength Å MoKα; 0.71073
F000 2336
µ, mm–1 0.774
range, ° 2.241 - 30.792
Reflection collected 122 201
Reflections unique 8 321
Rint 0.0654
GOF 1.188
Refl. obs. (I>2(I)) 7 166
Parameters 347
wR2 (all data) 0.1301
R value (I>2(I)) 0.0509
Largest diff. peak and hole (e-.Å-3) 0.837 ; -0.696

147
C.4. [CuIIOBBZ](TBA)2
Figure C-3 Structure of CuIIOBBZ
Table C-3 Crystallographic data and structure of Cu OBBZ(TBA)2 refinement details.
Compound Cu OBBZ(TBA)2
Empirical Formula C16 H8 Cu N2 O6, 2(C16 H36 N), 8(H2O)
Mr 1016.82
Crystal color pale blue
Crystal size, mm3 0.10 x 0.06 x 0.03
Crystal system triclinic
Space group P -1
a, Å 11.864(3)
b, Å 12.475(4)
c, Å 21.600(6)
α, ° 105.463(12)
β, ° 92.923(12)
γ, ° 113.023(12)
Cell volume, Å3 2792.0(14)
Z ; Z’ 2 ; 1
T, K 100 (1)
Radiation type ; wavelength Å MoKα; 0.71073
F000 1106
µ, mm–1 0.452
range, ° 2.263 - 32.771
Reflection collected 128 088
Reflections unique 20 488
Rint 0.0968
GOF 1.027
Refl. obs. (I>2(I)) 14 965
Parameters 612
wR2 (all data) 0.1321
R value (I>2(I)) 0.0526
Largest diff. peak and hole (e-.Å-3) 0.783 ; -1.147

148
References
1. A.J. Bard, L.R. Faulkner, Electrochemical methods: fundamentals and application, 2nd ed., John wiley & sons, Inc., New York, 2001. 2. F. C. Anson, Electroanalytical Chemistry, ACS Audio Course Manual, ACS, Washington, D. C., 1976, 55. 3. L. R.Faulkner, Chem.Educ, 60, 1983, 262. 4. L. R. Faulkner, Physical Methods in Modern Chemical Analysis, Vol. 3, Ed Academic, New York, 1983. 5. H. H Perkampus, UV-VIS spectroscopy and its applications, Berlin:Springer-Verlag, 1992. 6. Bougeard, M. Buback, A. Cao, Infrared and raman spectroscopy : methods and applications, Weinheim VCH, cop. 1995. 7. A. C. Testa and W. H. Reinmuth, Anal. Chem.,33, 1961. 8. Breitmaier, E., Structure elucidation by NMR in organic chemistry : a practical guide.,Wiley, West Sussex, England, 2002. 9. K. C. Khulbe, A. F. Ismail, T. Matsuura, Electron Paramagnetic Resonance Spectroscopy, Membrane
Characterization, Elsevier, 2017.
10. K. Downard, Mass Spectrometry, The Royal Society of Chemistry, 2004.
11. R. Berera, R. van Grondelle, J. T. M. Kennis, Photosynthesis Research 2009, 101, 105–118. 12. L. C. Clark, R. Wolf, D. Granger, Z. Taylor, Journal of Applied Physiology 1953, 6, 189–193. 13. Sheldrick, G. M. SHELXS-97, Program for Crystal Structure Solution, University of Göttingen, Göttingen, Germany, 1997. 14. Sheldrick, G. M. Acta Crystallogr., Sect. A: Found. Crystallogr., 2008, 64, 112-122. 15. Farrugia, L. J. J. Appl. Cryst. 1999, 32, 837.

149
Résumé (en français)
En guise de préambule, je voudrais souligner que le présent travail n’a été effectué que depuis
mai 2018. Je ai mené mon projet de recherche dans le groupe de la «photosynthèse artificielle»
que pendant 17 mois. Compte tenu des contraintes de temps, je n’étais pas en mesure de mener
à bien les tâches que je visais. Dans ce manuscrit, j'ai rassemblé mes résultats et j'ai pu, en
partie, apporter de nouvelles perspectives et compréhension, alors que dans d'autres, des
études plus approfondies seront nécessaires pour apporter plus de connaissances.
Mon travail de thèse s'articule autour du thème de la photosynthèse artificielle.
Systèmes supramoléculaires modulaires de la photosynthèse artificielle.
Le développement de sources d’énergie renouvelables telles que les combustibles solaires est
une question cruciale dans le contexte actuel du réchauffement de la planète. L'eau est une
source abondante, respectueuse de l'environnement, bon marché et abondante en électrons et
en protons nécessaires à la production de combustible. Par conséquent, l'oxydation de l'eau
activée par la lumière est une étape clé de la photosynthèse artificielle et le développement de
catalyseurs efficaces, robustes et durables constitue un objectif important pour les chimistes.
La photosynthèse artificielle vise à extraire les principes de base de la photosynthèse naturelle
et à les mettre dans un dispositif «artificiel» pour convertir l’énergie solaire en énergie chimique.
Il entreprend trois étapes principales : capturer l'énergie lumineuse par photosensibilisateur,
transférer cette énergie sous forme d'états à charge séparée et générer une source de
combustible chimique lors de réactions d'oxydoréduction. Ce manuscrit consiste en :

150
Une Introduction générale qui aborde les problèmes d'énergie et la photosynthèse artificielle en
termes d'étude électrochimique et photochimique de l'oxydation de l'eau. De plus, le concept de
base du transfert d'électrons et de la formation de paires d'ions sont mentionnés. La fin du
chapitre explique les objectifs de ce travail.
Le chapitre 2. Dans ce chapitre nous nous concentrons sur le développement de tels catalyseurs
basés sur des complexes métalliques à base de métaux de la première série des éléments de
transition tel que le cuivre pour cette étude. L'électrocatalyse et la photocatalyse par oxydation
de l'eau ont été étudiées. Nous décrivons l’oxydation électrochimique de l’eau avec des
complexes moléculaires de cuivre(II) bisoxamidate. Ces complexes ont fait l’objet de recherche
dans notre laboratoire dans les 90’s. Récemment, ces complexes ont été rapportés comme
catalyseurs d’oxydation de l’eau par une équipe en Espagne. En collaboration avec l’équipe du
Pr. Abhishek Dey à Calcutta nous avons voulu mieux comprendre les mécanismes de
fonctionnement de ces catalyseurs moléculaires. J’ai d’abord préparé une série de complexes de
cuivre(II) oxamidate avec différents substituents, Me, Cl et NO2. Pour ma part, j’ai effectué des
électrochimiques en solutions en faisant varier les conditions de pH. J’ai pu mettre en évidence
l’évolution du potentiel d’oxydation de l’eau en fonction de la nature des substituents. Les
résultats, obtenus par nos collaborateurs ont montré une évolution nette dans les étapes
d’activation de la molécule d’eau. Nous avons aussi la possibilité de faire la photo-oxidation de
l’eau en utilisant un photosensibilisateur tel que le ruthénium(II) trisbipyridine et un accepteur
d’électron. Cependant, cette étude nous a conduit vers d’autres problématiques que nous
décrivons dans le chapitre 3.
Au chapitre 3. Formation des paires d'ions : Nous avons remarqué dans les études de
photoactivation du complexe de Cu(II), un transfert d’électron dans l’état excité du
photosensibilisateur. De plus nous avons observé un phénomène très intriguant lors de l’ajout
de l’accepteur d’électron le méthyleviologène et le complexe de cuivre(II). En effet bien que la
thermodynamique soit défavorable nous observons un transfert d’électron du complexe de
cuivre(II) vers l’accepteur d’électron dans l’état fondamentale. Ce phénomène a été mis en
évidence par la spectroscopie RPE et l’UV-Visible.

151
Le chapitre 4. Transfert d'électron intramoléculaire, nous avons synthétisé des assemblages
modulaires constitués d’un chromophore photoactif et d’un catalyseur de manganèse. Nous
avons étudié les processus de transfert d'électrons intramoléculaires et les caractérisations
photophysiques. Nous avons pu montrer que nous pouvons photooxyder le complexe de Mn(III)
en Mn(IV) et aussi nous avons réalisé des études de photocatalyse d’oxydation de substrats
organiques.
Par conséquent, l’étude des complexes moléculaires pour la photosynthèse artificielle fournit
diverses orientations pour développer le rendement d’utilisation de l’énergie solaire.
Tous les détails des principes expérimentaux, des caractérisations et des structures cristallines
des complexes sont décrits en Annexe.

Université Paris-Saclay Espace Technologique / Immeuble Discovery Route de l’Orme aux Merisiers RD 128 / 91190 Saint-Aubin, France
Titre : Complexes moléculaires pour la photosynthèse artificielle
Mots clés : Photosynthèse artificielle, Transfert électron photo-induit, Oxydation de l'eau, Paire d'ions,
Transfert électron
Résumé : Le développement de sources d’énergie
renouvelables telles que les combustibles solaires
est une question cruciale dans le contexte actuel du
réchauffement de la planète. L'eau est une source
abondante, respectueuse de l'environnement, bon
marché et abondante en électrons et en protons
nécessaires à la production de combustible. Par
conséquent, l'oxydation de l'eau activée par la
lumière est une étape clé de la photosynthèse
artificielle et le développement de catalyseurs
efficaces, robustes et durables constitue un objectif
important pour les chimistes. Dans la première
partie de cette étude, nous nous concentrons sur le
développement de tels catalyseurs basés sur des
complexes métalliques à base de métaux de la
première série des éléments de transition tel que le
cuivre pour cette étude. L'électrocatalyse et la
photocatalyse par oxydation de l'eau ont été
étudiées.
La deuxième partie du travail concerne la formation
de paires d'ions entre les espèces à double charge
opposée du catalyseur complexe et de l'accepteur
d'électrons et du photosensibilisant et du catalyseur
complexe. Cette étude devrait apporter des preuves
solides de l'influence de chaque composant du
photosystème par l'association et la dissociation de
paires d'ions.
Dans la troisième partie, nous étudions un système
synthétique sensibilisant-catalyseur capable de
photoactiver une molécule d’eau liée à l’unité
catalytique par le biais d’une oxydation à deux
électrons et à deux protons, réalisant toute la
caractérisation photophysique de la dyade. Par
conséquent, l’étude des complexes moléculaires
pour la photosynthèse artificielle fournit diverses
orientations pour développer le rendement
d’utilisation de l’énergie solaire.
Title : Molecular complexes for artificial photosynthesis
Keywords : Artificial photosynthesis, Photo-induced electron transfer, Water oxidation, Ion pair, Electron
transfer
Abstract : Development of renewable energy
sources like solar fuels is a crucial issue in the
actual context of global warming. Water is an
environmentally friendly, cheap and abundant
source of the electrons and protons needed for fuel
production. Therefore, light-activated water
oxidation is a key step in artificial photosynthesis
and the development of efficient, robust and
sustainable catalysts is an important goal for
chemists. In the first part of this study, we focus on
the development of such catalysts based on earth
abundant copper complexes. The water oxidation
electrocatalysis and photocatalysis were
investigated.
The second part of the work concerns the ion pair
formation between the oppositely double charged
species of complex catalyst and electron acceptor
and Photosensitizer and complex catalyst are
investigated. This study should bring solid evidence
on the influence of each component in photosystem
through the ion pair association and dissociation. In
the third part, we study a synthetic sensitizer-
catalyst system that can photoactivate a water
molecule bound to the catalytic unit through a two-
electron, two-proton abstraction, performed all the
photophysical characterization of the dyad.
Therefore, studying molecular complexes for
artificial photosynthesis provides diverse direction
to develop the utilization efficiency of solar energy.