MOLECULAR CLONING, OVEREXPRESSION AND BIOCHEMICAL CHARACTERIZATION OF...
70
MOLECULAR CLONING, OVEREXPRESSION AND BIOCHEMICAL CHARACTERIZATION OF BACTERIAL AMYLASE FOR BIOTECHNOLOGICAL PROCESSES A Thesis Submitted to the Graduate School of Engineering and Sciences of İzmir Institute of Technology in Partial Fulfillment of the Requirements for the Degree of MASTER OF SCIENCE in Biothecnology by Tülin BURHANOĞLU September 2012 İZMİR
Transcript of MOLECULAR CLONING, OVEREXPRESSION AND BIOCHEMICAL CHARACTERIZATION OF...

MOLECULAR CLONING, OVEREXPRESSION
AND BIOCHEMICAL CHARACTERIZATION OF
BACTERIAL AMYLASE FOR
BIOTECHNOLOGICAL PROCESSES
A Thesis Submitted to
the Graduate School of Engineering and Sciences of
İzmir Institute of Technology
in Partial Fulfillment of the Requirements for the Degree of
MASTER OF SCIENCE
in Biothecnology
by
Tülin BURHANOĞLU
September 2012
İZMİR

We approve the thesis of Tülin BURHANOĞLU
Examining Committee Members:
________________________________
Assist.Prof.Dr. Ferda SOYER
Department of Molecular Biology And Genetics
İzmir Institute of Technology
________________________________
Inst.Dr. İlhan DOĞAN
Department of Molecular Biology And Genetics
İzmir Institute of Technology
________________________________
Assist.Prof.Dr. Gülşah ŞANLI
Department of Chemistry
İzmir Institute of Technology
20 September 2012
________________________________ ________________________________
Assist.Prof.Dr. Gülşah ŞANLI Assist.Prof.Dr. H. Çağlar KARAKAYA
Supervisor, Department of Chemistry Co-supervisor, Department of Molecular
İzmir Institute of Technology Biology and Genetics
İzmir Institute of Technology
________________________________ ________________________________
Assoc.Prof.Dr.Volga BULMUŞ Prof.Dr. R.Tuğrul SENGER
Head of the Department of Biotechnology Dean of the Graduate School
and Bioengineering Engineering and Sciences

iii
ACKNOWLEDGEMENTS
Firstly, I would like to thank to my supervisor Assist. Prof. Dr. Gülşah ŞANLI
MOHAMED for her excellent guidance, endless support, valuable help and
encouragement throughout my thesis study.
I also would like to thank to my co-supervisor Assist. Prof. Dr. H. Çağlar
KARAKAYA, for his valuable comments during my studies.
I thank to Dane RUSÇUKLU, Yekta GÜNAY OĞUZ and Evrim BALCI in
Izmir Institute of Technology, Biotechnology and Bioengineering Central Research
Laboratories for all their advice, help and support during my experiments.
I would like to thank to all Molecular Biology and Mass Spectroscopy
laboratory members for having share equipments and their experiences during my
experiments.
I want to thank to Prof.Dr.Devrim BALKÖSE for her encouragement, support
and confidence throughout my career.
I would like to thank to labmates; Seden GÜRACAR, Hüseyin İLGÜ and Taylan
TURAN for having shared their experiences and kind helps in my experiments.
I would like to express my sincere thanks to Burcu ALP, Fatma ÜSTÜN, Derya
BOZKUŞ and Özlem KARATAŞ for their moral supports, kind helps and endless
friendship.
Finally, I am greatfull to my family; mother and father for their support and
endless love, especially to my sister Nejla BURHANOĞLU and elder sister Sine
SADİOĞLU for their support, engouragement and motivation and also to my brother
Cafer BURHANOĞLU for being a source of inspration to me during my thesis as in all
stages of my life.

iv
ABSTRACT
MOLECULAR CLONING, OVEREXPRESSION AND BIOCHEMICAL
CHARACTERIZATION OF BACTERIAL AMYLASE FOR
BIOTECHNOLOGICAL PROCESSES
Amylases are the enzymes that act on glycosidic bond of starch and related
polysaccarides. They comprise 25% of enzyme utilised in a variety of industry. It is
used to obtain maltose, glucose and maltodextrins in various lenghts during industrial
processes. Amylases are widely distributed enzymes in bacteria, fungi, higher plants
and animals. Thermophilic enzymes are widely demanded in order to be stable at harsh
process conditions. Isolating these enzymes from thermophilic microorganism is
increasing trend because of ease of enzyme production.
In this study α-amylase gene region from a thermophilic Bacillus sp. isolated
from Balçova Geotermal region in İzmir was cloned to compotent E. coli BL 21 cells.
Additionally protein expression was reinforced with pKJE7 chaperone plasmid. Cloned
gene was sequenced and found as 1542 bp in length. Thermophilic amylase that has a
59.9 kD molecular weight was expressed and purified from this recombinant strain.
Mass spectrometric analysis were performed and the enzyme was matched with α-
amylase family protein of Geobacillus thermodenitrificans NG80-2 using NCBInr
database. The aminoacid sequence of this enzyme was seen to be similar 92% with our
obtained enzyme.
According to the results of characterization studies, the amylase enzyme was
seen to have highest activity at pH 8.0 and 60°C. The enzyme was also showed to have
resonable activity between pH5 and 9. 85% of the enzyme activity was retained at 70°C.
Furthermore, amylase activities at 65 and 85°C were observed to remain stable for 5 and
2 hours, respectively. It was also showed that the activity was stable and pH7 and 9 for
6 hours. The effects of some metal ions, chemical agents and organic solvents on
enzyme activity were examined so, Co+2
, Mg+2
,Ca+2
was determined to be as inducer for
the enzyme activity. Conversely the activity was inhibited by Cu+2
. Furthermore
methanol, DDT and Triton X-100 was found to have no effect on the enzyme activity.

v
ÖZET
BİYOTEKNOLOJİK UYGULAMALARDA KULLANILMAK ÜZERE
BAKTERİYEL AMİLAZIN KLONLANMASI, İFADELENMESİ VE
BİYOKİMYASAL KARAKTERİZASYONU
Amilazlar nişasta ve ilgili polisakkaritlerin glikozidik bağlarına etki eden enzimlerdir.
Bunlar, çeşitli endüstrilerde kullanılan enzimlerin %25’ini oluştururlar. Endüstriyel
işlemler esnasında maltoz, glikoz ve çeşitli uzunluklarda matodekstrinler elde etmek
için kullanılırlar. Amilazlar bakteriler, mantarlar, yüksek bitkiler ve hayvanlarda geniş
oranda bulunan enzimlerdir. Termofilik enzimler ağır işlem koşullarında kararlı
oldukları için geniş oranda tercih edilirler. Termofilik mikroorganizmalardan bu
enzimleri üretmek üretim kolaylıkları sebebiyle yükselen bir eğilim olmuştur.
Bu çalışmada İzmir Balçova Jeotermal bölgesinden izole edilen termofilik
Bacillus sp. suşundan α-amilaz gen bölgesi kompotent E. coli BL 21 hücrelerine
klonlanmıştır. Ek olarak pKJE7 şaperon plazmiti ile protein ifadelenmesi
güçlendirilmiştir. Klonlanan gen sekanslanmış ve uzunluğu 1542 bp olarak
bulunmuştur. Bu rekombinant suştan 59.9 kD moleküler ağırlığına sasip termofilik
amilaz üretilmiş ve saflaştırılmıştır. Kütle spektoskobi analizi yapılmış ve enzim
NCBInr veritabanı kullanılarak Geobacillus thermodenitrificans NG80-2 α-amylase
family protein ile eşleştirilmiştir. Bu enzimin aminoasit sekansı bizim elde ettiğimiz
enzimle %92 benzer olduğu görülmüştür.
Karakterizasyon çalışmalarının sonuçlarına göre, amilaz enziminin en yüksek
aktiviteyi pH 8.0 ve 60°C’de gösterdiği görülmüştür. Ayrıca enzimin pH5 ve 9’da kabul
edilebilir bir aktiviteye sahip olduğu gösterilmiştir. 70°C’de enzim aktivitesinin %85’ini
geri kazanmıştır. Dahası, 65 ve 85°C’deki enzim aktivitesinin sırasıyla 5 ve 2 saat
kararlı kaldığı gözlenmiştir. pH7 ve 9’da da aktivitenin 6 saat kararlı olduğu
gösterilmiştir. Bazı metal iyonları, kimyasal ajanlar ve organik solventlerin enzim
aktivitesine etkileri incelenmiş ve Co+2
, Mg+2
,Ca+2
iyonlarının enzim aktivitesi için
indükleyici olduğu saptanmıştır. Diger taraftan aktivite Cu+2
tarafından inhibe edilmiştir.
Ayrıca methanol, DDT and Triton X-100’ün enzim aktivitesi üzerine bir etkisi olmadığı
bulunmuştur.
vi
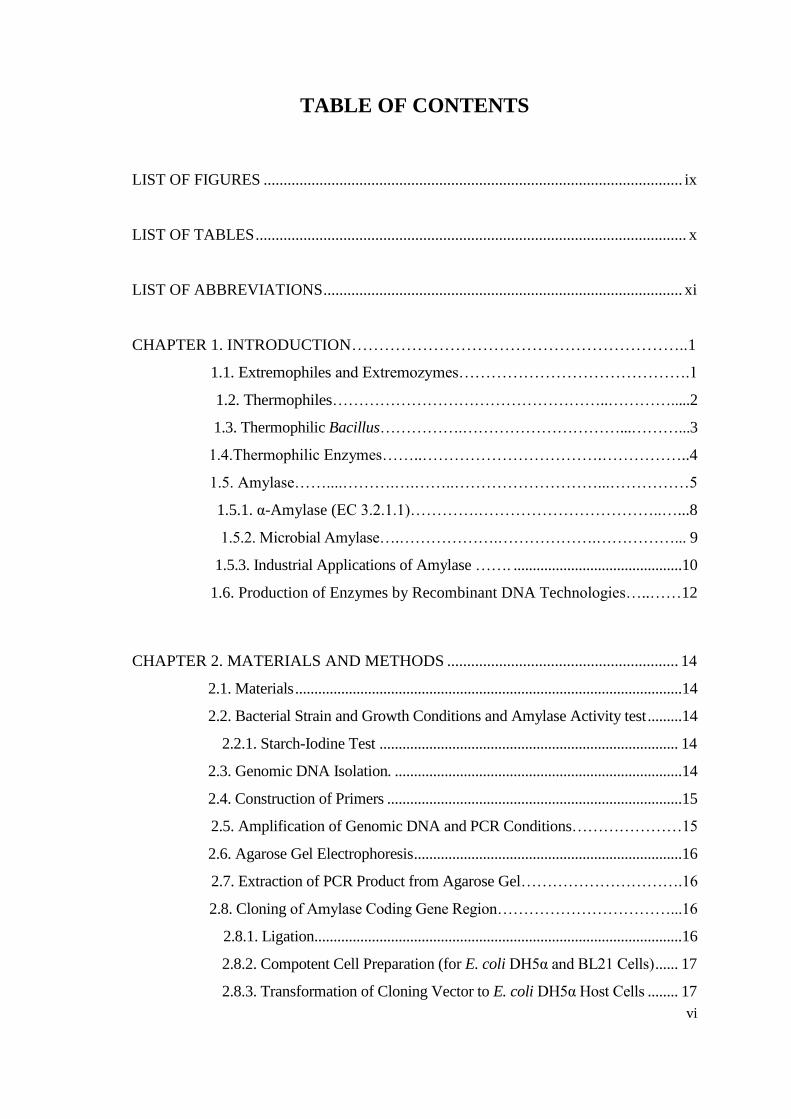
TABLE OF CONTENTS
LIST OF FIGURES ......................................................................................................... ix
LIST OF TABLES ............................................................................................................ x
LIST OF ABBREVIATIONS .......................................................................................... xi
CHAPTER 1. INTRODUCTION……………………………………………………..1
1.1. Extremophiles and Extremozymes…………………………………….1
1.2. Thermophiles……………………………………………..………….....2
1.3. Thermophilic Bacillus…………….…………………………...………...3
1.4.Thermophilic Enzymes……..…………………………….……………..4
1.5. Amylase……....……….….……..………………………...……………5
1.5.1. α-Amylase (EC 3.2.1.1)………….……………………………..…...8
1.5.2. Microbial Amylase….……………….……………….……………... 9
1.5.3. Industrial Applications of Amylase ……. ............................................10
1.6. Production of Enzymes by Recombinant DNA Technologies…..……12
CHAPTER 2. MATERIALS AND METHODS .......................................................... 14
2.1. Materials .....................................................................................................14
2.2. Bacterial Strain and Growth Conditions and Amylase Activity test .........14
2.2.1. Starch-Iodine Test .............................................................................. 14
2.3. Genomic DNA Isolation. ...........................................................................14
2.4. Construction of Primers .............................................................................15
2.5. Amplification of Genomic DNA and PCR Conditions…………………15
2.6. Agarose Gel Electrophoresis ......................................................................16
2.7. Extraction of PCR Product from Agarose Gel………………………….16
2.8. Cloning of Amylase Coding Gene Region……………………………...16
2.8.1. Ligation................................................................................................16
2.8.2. Compotent Cell Preparation (for E. coli DH5α and BL21 Cells) ...... 17
2.8.3. Transformation of Cloning Vector to E. coli DH5α Host Cells ........ 17

vii
2.8.4. Plasmid Isolation ................................................................................ 18
2.8.5. Digestion of Plasmid .......................................................................... 18
2.8.6. Ligation of Insert to Expression Vector pET28a+. ............................ 19
2.8.7. Transformation to Compotent E.coli BL21 Cells. ............................. 19
2.9. Protein Expression Procedure for E. coli BL21 Cells.…...……………...19
2.10. Coexpression with Chaperone Plasmids ………………………………20
2.11. Lysis of Bacterial Cells ……………………………………………….21
2.12. Enzyme Purification ………………………………………………….21
2.13. SDS-PAGE ……………………………………………………….…..21
2.14. Screening of Amylase Activity on Agar Plate…….…………………...22
2.15. Protein Identification and Mass Spectrometric Analysis ………….......22
2.15.1. In-Gel Digestion ............................................................................... 22
2.15.2. Mass Spectrometric Analysis. .......................................................... 24
2.16. Determination of Protein Concentration ................................................ 25
2.17. Amylase Assay ………………………………………………………..25
2.18. Protein Characterization………………………………………...……..26
2.18.1. Optimum pH and Temperature. ....................................................... 26
2.18.2. pH and Temperature Stability .......................................................... 26
2.18.3. Effect of Metal Ions on Enzyme Activity ........................................ 26
2.18.4. Effect of Solvents and Detergents on Enzyme Activity .................. 27
CHAPTER 3. RESULTS AND DISCUSSION..................................................,.........28
3.1. Screening of Amylase Activity of Bacterial Strain…………………..….28
3.2. Genomic DNA Isolation and PCR Amplification………………………28
3.3. Cloning Experiments ..................................................................................29
3.3.1. Subcloning .......................................................................................... 29
3.3.2. Coexpression with Chaperone Plasmids ............................................ 33
3.4. Protein Expression and Purification………………………………….…34
3.5. Screening of Amylase Activity on Agar Plate…………………………..36
3.6. Protein Identification and Mass Spectrometric Analysis...........................37
3.7. Protein Characterization……………………………………………..…38
3.7.1. Optimum pH and Temperature .......................................................... 38
3.7.2. pH and Temperature Stabilties ........................................................... 39

viii
3.7.3. Effect of Metal Ions on Enyzme Activity .......................................... 42
3.7.4. Effect of Various Agents on Enzyme Activity .................................. 43
CHAPTER 4. CONCLUSION ...................................................................................... 45
REFERENCES ............................................................................................................... 47
APPENDICES
APPENDIX A. MEDIA, BUFFERS, REAGENTS AND SOLUTIONS……………...54
APPENDIX B. ABSORBANCE VALUES OF BSA STANDARTS,
and STANDART CURVES FOR BRADFORD ASSAY
and AMYLASE ASSAY……………………………………………...58

ix
LIST OF FIGURES
Figure Page
Figure 1.1. Molecular structure of amylose molecule ................................................... ...6
Figure 1.2. Brached structure of amylopectin molecule ................................................... 6
Figure 1.3. Hydrolytic mechanisms of amylases. .............................................................. 7
Figure1.4. Crystal structure of human salivary α-amylase................................................8
Figure 3.1. Bacterial colonies on starch agar plate ......................................................... 28
Figure 3.2. Agarose gel image of PCR product .............................................................. 29
Figure 3.3.White colonies on LB- amp plate indicating recombinant E.coli DH5α
cells including inserted gene ........................................................................ 30
Figure 3.4. Nucleotide sequence comparison of inserted gene and the source .............. 31
Figure 3.5. Protein sequence comparison of our protein and the
source…........................................................................................................32
Figure 3.6. SDS-PAGE image that shows effects of different chaperones on protein
expression.....................................................................................................34
Figure3.7.SDS-PAGE image of purification of coexpressed with affinity
chromotography………………………………………………….………...35
Figure 3.8. SDS-PAGE image of unpurified and purified protein……………………..36
Figure 3.9. Amylase activity screening on stach agar plate …… ……………………..36
Figure 3.10. Sequence comparison of our protein and identified protein in mass
spectrometry.………………...………..……………………………..……37
Figure 3.11. Effect of pH on amylase enzyme activity (at 55ºC)…………………..….39
Figure 3.12. Effect of temperature on amylase enzyme activity (pH 8)………………39
Figure 3.13. Stability of amylase activity at pH 7 for 24 hours (at 60ºC)…………..….40
Figure 3.14. Stability of amylase activity at pH 9 for 24 hours (at 60ºC)……………...41
Figure 3.15. Stability of the amylase activity at 65°C for 24 hours (pH 8)…………….41
Figure 3.16. Stability of the amylase activity at 85°C for 24 hours (pH 8)…………….42
Figure 3.17. Effect of metal ions on enzyme activity…………………………..……....43

x
LIST OF TABLES
Table Page
Table 1.1. Major examples of enzymes and biomolecules from
extremophile and their foreseen applications ……………………..…..…...2
Table 1.2. Bioconversion reactions and applications of thermostable enzymes………...5
Table 1.3. Source microorganisms and properties of thermostable starch hydrolyzing
enzymes…………………...…………….….………………………………..10
Table 2.1. Chaperone plasmids and their properties…………………………………...20
Table 3.1. Effect of various agents on enzyme activity .................................................. 44

xi
LIST OF ABBREVIATIONS
BSA Bovine serum albumin
DMSO Dimethyl sulfoxide
DTT Dithiothreitol
EDTA Ethylenediamine tetra acetic acid
LB Luria-Bertani broth
PAGE Polyacrylamide gel electrophoresis
PIPES Piperazine-N,N′-bis (2-ethanesulfonic acid)
PMSF Phenylmethylsulphonyl fluoride
Rpm Revolutions per minute
SDS Sodium dodecyl sulfate
sp. Species
TCA Trichloroacetic acid
μl Microliter
ml Milliliter
mM Millimolar

1
CHAPTER 1
INTRODUCTION
1.1. Extremophiles and Extemozymes
Extremophiles are microorganisms that can live and reproduce in harsh
environments. They live in hot springs, volcanic areas, deep sea, in the Antarctic
biotopes and in other particular geothermal sites (Schiraldi and De Rosa 2002).
Extremophilic microorganisms can be thermophilic, psychrophilic, alkaliphilic and
halophilic.
Enzymes from these microorganisms are called extremozymes and they are also
resistant to extreme conditions. For example; Moderately halophilic bacteria are able to
grow over a wide range of saline concentrations from 0.4 to 3.5 M (Patel et al. 2005;
Chakraborty et al. 2010). Halophilic enzymes from these microorganisms with polymer-
degrading ability at low water activity are utilized in many harsh industrial processes
where concentrated salt solutions would inhibit enzymatic conversions (Chakraborty et
al. 2010). Additional major examples for applications of extremozymes that have
reached the market are; Taq polymerase, from Thermus aquaticus and cellulase 103
from alkaliphiles. Becoming the key element of the polymerase chain reaction, Taq
polymerase provided a new perspective in molecular biology and encouraged the
research activities on DNA-polymerases from hyperthermophiles. Cellulase 103 was
isolated from bacteria living in soda lakes. It is used to break down the microscopic fuzz
of cellulose fibers that traps the dirts on the surface of cotton textile, without harming
the natural fabric. This biocatalyst started to be used in 1997 by Genencor International
(Rochester, NY, USA) as a novel detergent agent. It helps to keep cotton fabric looking
‘as new’ even after thousands of washing cycles (Pennisi 1997; Schiraldi and De Rosa
2002).
In this concept all over the globe researchers are now trying to search out
extremophiles which are valuable source of novel enzymes (Chakraborty et al. 2010).
Several enzymes and biomolecules isolated from extremophiles and their applications
were listed Table 1.1.

2
Table 1.1. Major examples of enzymes and biomolecules from extremophiles
and their foreseen applications (Source: Schiraldi and De Rosa 2002)
1.2. Thermophiles
Bacteria are classified into the following four groups depending on their optimal
growth temperature: psychrophiles (5 to 20 °C), mesophiles (15-45°C), thermophiles
(45–80°C) (Li, Zhou, Lu 2005). Further classification for the thermophilic organisms
was made by Baker et al. (2001). Thermophilic organisms was divided into three groups
according to their minimal and maximal growth temperatures: moderate thermophiles
(35-70ºC), extreme thermophiles (55-85ºC) and hyperthermophiles (75-113ºC).
A reverse DNA gyrase produces positive super coils in the DNA of thermophiles
(Lopez 1999; Haki and Rakshit 2003). This causes elevated melting point of the DNA
as high as the organisms maximum temperature for growth. Thermophiles also tolerate
high temperature by using increased interactions; electrostatic, disulphide bridge and
hydrophobic interactions (Kumar and Nussinov 2001; Haki and Rakshit 2003).
Thermophilic organisms have thermostable cellular components such as
enzymes, proteins and nucleic acids. They are also known to withstand denaturants of
extremly acidic and alkaline conditions. Thermostable enzymes are being studied as

3
more useful alternatives to mesophilic enzymes already in place in some industrial
processes because they are highly specific (Giver et al. 1998; Kumar 2002).
Such enzymes maximizing reactions accomplished in the food and paper
industry, detergents, drugs, toxic wastes removal and drilling for oil is being studied
extensively (Haki and Rakshit 2003). Various thermostable enzymes have been purified
from thermophilic bacteria; some are alkaline protease, endo-1,5-alpha-L-arabinase, and
pectate lyase. Commercial products such as laundry detergents needs thermostable
lipase and esterase usage. Alternatively, thermostable proteins are being studied in the
hope that their adaptive mechanisms may yield methods to stabilize other less stable
proteins (Giver et al. 1998; DeFlaun et al. 2007).
Because of a good area of usage in industry and research isolation and
characterization of new thermophilic bacterial strains is one of the goals of the
investigation all over the world.
1.3. Thermoplilic Bacillus
Geobacillus is a recently created genus (Nazina et al. 2001) that contains a
number of highly thermophilic spore-forming bacilli, together with newly described
species. Though many of the Geobacillus have been isolated from hot environments
such as geothermal features and deep oil reservoirs, it has recently been shown
(Marchant et al. 2002a, b; Pavlostathis et al. 2006) that they are almost abundant in cool
environments. They also occur in great diversity and may since form an important part
of the soil microflora (Rahman et al. 2004). Several Geobacillus species show a
significant capacity to degrade hydrocarbons and recent studies have been focused on
phenol degradation by Geobacillus thermoleovorans (Feitkenhauer et al. 2001; 2003;
Pavlostathis et al. 2006). Metabolic capabilities of geobacilli suggest that they may have
significant biotechnological applications in industrial and also environmental fields
(Uma Maheswar Rao and Satyanarayana 2004; Pavlostathis et al. 2006).
The taxonomy of the genus Bacillus showed that thermophilic species were
members of Bacillus rRNA Group 5 (Ash et al. 1991; Rainey et al.1994; Romano et al.
2005). Accordingly to the level of DNA-DNA reassociation values Bacillus
thermoleovorans, Bacillus kaustophilus and Bacillus thermocatenulatus should be

4
combined into one species, namely Geobacillus thermoleovorans which also included
Bacillus caldolyticus, Bacillus caldovelox and Bacillus caldotenax (Nazina et al., 2001;
Sunna et al. 1997; Romano et al. 2005).
1.4. Thermophilic Enzymes
Enzymes produced by thermophilic and hyperthermophilic organisms known as
thermozymes (or thermoenzymes) are also thermophilic and thermostable. They are
resistant to irreversible inactivation at high temperatures and optimally active at high
temperatures, between 60°C and 125°C (Vieil le et al. 1996).
Thermostable enzymes have received attention due to their potential commercial
applications because of their overall inherent stability and high reaction rates at high
temperatures. From different exotic ecological zones of the planet earth several
thermophilic microorganisms have been isolated in order to be used for such
applications. Applications and bioconversion reactions of some are mentioned in Table
1.2. Thermozymes possess major biotechnological advantages distinct from mesophilic
enzymes as follows:
They are easier to purify by heat treatment.
They have a higher resistance to chemical denaturants such as solvents
and guanidinium hydrochloride.
They can withstand higher substrate concentrations.
Because of their stability at elevated temperature, thermozyme reactions are less
susceptible to microbial contamination and often display higher reaction rates than
mesozyme catalyzed reactions. Additionally thermozymes can be seen as models for
understanding thermostability. Therefore the structural features of thermozymes must be
identified to contruct a theoretical description of the physico-chemical principles
contributing to prote in stability and folding. Morover, this information also helps
designing more stable enzymes for industrial processes (Li et al. 2005).
Thermophilic enzymes in polysaccharides processing have major benefits. In
addition to the reduced contamination, they lower the inlet stream viscosity and they
can hold a constant pH during the whole biotransformation, so salt addition necessary in
modern processes can be avoided. Actually, several research groups have focused on the

5
search and characterization of this type of biocatalyst. Polymer degrading enzymes,
such as amylases, pullulanases, xylanases, proteases and cellulases, have a crucial role
in food, chemical and pharmaceutical, paper, pulp and waste-treatment industries
(Schiraldi and De Rosa 2002).
Table 1.2. Bioconversion reactions and applications of thermostable enzymes
(Source: Haki and Rakshit 2003)
1.5. Amylase
Starch is one of the most existing polysaccharides composed of D-glucose
molecules in nature. It has a heterogenous structure including two high molecular-
weight compounds: amylose (15–25%) and amylopectin (75–85%).
Amylose is a linear molecule composed of 100-700 glucose residues linked with
α-1,4 bonds in every 4 glucose unit. It is insoluble in cold water.

6
Figure 1.1. Molecular structure of amylose molecule
(Source:Voet and Voet 1995)
Amylopectin is a branched polymer that has α-1,4–linked glucose units which
are branched at every 17–26 residues with α-1,6 linkages (Bertolod and Antranikian
2002).
Figure1.2. Brached structure of amylopectin molecule
(Source:Voet and Voet 1995)
A wide variety of organisms secrete amylolytic enzymes to degrade and utilize
starch molecule as energy source. Amylolytic enzymes belong mainly to three families
of glycoside hydrolases (GHs) :
GH13 – the α-amylase family
GH14 – β-amylases
GH15– glucoamylases (Rashid et al. 2009)
The amylase superfamily can be divided into two groups;
Endoamylases (α-amylase); Endoamylases cleavage α-1,4 glycosidic bonds
which present in the inner part of amylose or amylopectin chains and generate
oligosaccharides of various lengths. Endoamylases have been found in phyla from
Archaea to Mammalia (Frøystad et al. 2006; Chai et al. 2012).

7
Exoamylases (β-amylase, α-amyloglucosidase); Exoamylases cleavage
glycosidic bonds exist in the non-reducing ends of polysaccharides and produce low
molecular weight products such as glucose and maltose (Chai et al. 2012).
β-amylases (alfa-1,4 glucan maltohidrolase, EC3.2.1.2) act on α-1,4 glycosidic
bonds at the nonreducing end of molecule. Thus the reaction stops at α-1,6
glycosidic bond, β-maltose and limit dextrins are formed.
Amyloglucosidases (glucoamylase, α-1,4-glucanohydrolase EC3.2.1.3) produces
only glucose acting on both α-1,6 glucosidic bond and α-1,4 glycosidic bonds at
the nonreducing end of amylopectin molecule (Pazur and Kleppe 1962).
Figure 1.3. Hydrolytic mechanisms of amylases
(Source: snnu 2011 )
Starch-processing industries demands for mainly amylases. Endoamylases first
provide starch degradation (liquefaction process) with producing maltodextrins, and
followingly exoamylases achieve further degradation of maltodextrins into glucose and
maltose (saccharification process) (Chai et al. 2012). Hydrolytic mechanisms of
amylases are summarized in Figure 1.3.

8
1.5.1. α- Amylase
α-Amylases (α-1,4-glucan-4-glucanohydrolases, EC 3.2.1.1) are enzymes that
catalyze the hydrolysis of amylose and amylopectin in starch and related poly- and
oligosaccharides by the breaking down α-(1,4) glycosidic linkages (Titarenko and
Chrispeels 2000). End product may be maltose, glucose and maltodextrins in various
lenght. These amylases are widely distributed enzymes in bacteria, fungi, higher plants
and animals (Janecek 1997; Rashid et al. 2009).
Figure 1.4. Crystal structure of human salivary α-amylase
(Source: Davidson 2011)
Thermophilic and thermostable α-amylases are needed in industry because the
enzyme must be active at the high temperature of gelatinization (100–110 ◦
C) and
liquefaction (80–90°C). Thermophilic amylases also reduce cooling cost, provide better
solubility of substrate resulting in lower viscosity which increases the mixing, pumping
process and decreases the microbial contamination risk (Pancha et al. 2010).
Owing to the maltose has diverse applications in e.g., food, pharmaceutical,
biomedical field, and fine chemicals, α- amylases that produce high levels of maltose
would rather prefered (Chai et al. 2012). Besides this, fungal α -amylases produce more
maltodextrins and reported as more efficient in saccharifying (Brena et al. 1996;
Aquino et al. 2003).
Halofilic and alkalitolerant α-amylases has gained great attention. Common
amylases are easily denaturated by high salt concentrations and certain organic solvents
so halophilic ones are tolerant of these. Thermostable and alkalitolerant amylases are
also desirable in the starch and textile industries and in detergent production (Shafiei et
al. 2011; Chai et al. 2012).

9
1.5.2. Microbial Amylase
Because of they are more stable than plant and animal derivatives and can be
obtained cheaply, microbial α-amylases have a broad spectrum of industrial applications
(Grupta et al. 2003; Tanyıldızı et al. 2004). The economical bulk production capacity
and easy manipulation to obtain desired characteristics in enzymes are major advantages
of using microorganisms for the production of amylases (Chakraborty et al. 2010).
Thermophilic archaea and bacteria have been acknowledged as a very good
source of starch hydrolyzing enzymes. There are many efforts to find the archaeal or
bacterial microorganisms can produce mutually compatible amylolytic enzymes that
would provide the reduction of starch degradation process to a single step (Horvathov et
al. 2006).
Species of genus Bacillus are widely used for α-amylase production among
bacteria. Bacillus subtilis, Bacillus stearothermophilus, Bacillus licheniformis and
Bacillus amyloliquefaciens are reported to be good sources of α-amylase and for various
industrial applications they have been used for commercial production of the enzyme
(Rashid et al. 2009). Different Bacillus species produce various types of α-amylases for
saccharifying or liquefying that are optimally active at different pH and temperature
range (Cordeiro et al. 2002).
Specific maltooligosaccharides, mainly maltotetraose, maltoheptaose and
maltohexaose has recently received considerable interest due to their potential use in
food, pharmaceutical and fine chemical industries. Many bacterial strains have been
described secreting amylases able to produce these specific products. B. circulans,
B.amyloliquefaciens, B. cadovelox, Bacillus sp. H-167 and a mutant of B.
stearothermophilus produce maltohexaose-forming amylase; B. cereus NY-14 produce
the maltopentaose-forming amylase and Pseudomonas sp. IMD 353 produce the
maltotetraose-forming amylase. However, all these amylases are reported not to be
sufficient thermoactive because the optimal activity is between 55°C and 70°C (Ben Ali
et al. 1999). Some sources of amylolytic enzymes and their properties were listed in
Table 1.3.

10
Table 1.3. Source microorganisms and properties of thermostable starch hydrolyzing
enzymes ( Source: Haki and Rakshit 2003)
1.5.3. Industrial Applications of Amylase
The usage of enzymes in the industrial production has began when Dr. Jhokichi
Takamine produce digestive enzyme from wheat bran koji culture of Aspergillus oryzae
in 1894. Then α-amylase and glucoamylase were first utilized in industry for the
production of dextrose powder and dextrose crystals from starch in 1959 (V. Aiyer.
2005). Today amylase is used in extensive biotechnological applications in many
industrial processes such as sugar, textile, paper, brewing, baking and distilling
industries. The demand for amylase is increasing day by day because of its industrial
applications (Chakraborty et al. 2010).
Some of the industrial applications can be mentioned as follows:
Paper industry: With the aim of protecting paper against mechanical damage
during processing, the sizing of paper with starch is performed. Sizing improves the

11
quality of the finished paper, enhances the stiffness and strengthen in paper also
improves the erasibilty. The temperature of sizing process generally in the range of 45-
60°C. Because of the viscosity of natural starch is too high for paper sizing it is adjusted
by partially degrading the polymer with α-amylases in a batch or continuous processes
(Gupta et al. 2003).
Bread and baking industry: Baking industry has used enzymes for hundreds of
years to be able to manufacture a wide variety of high quality products. Malt and
microbial α-amylases have been widely used in the baking industry for decades (Si
1999, Pintauro 1979; Gupta et al. 2003). The enzymes were used to give the products a
higher volume, better colour and a softer crumb. Malt preparation opened the
opportunities for many enzymes to be used commercially in baking. Today, so many
enzymes like proteases, lipases, xylanases, pullulanases, pentosanases, cellullases,
glucose oxidases, lipoxygenases etc. are being used in the bread industry for various
purposes (Kulp 1993; Pintauro 1979; Monfort et al. 1996; Prieto et al. 1995; Gupta et al.
2003), but none of them had been able to replace α-amylases. α-Amylase provides
improvement in the volume and texture of the product by enhancing the rate of
fermentation and reducing the viscosity of dough. It also generates additional sugar in
the dough that improves the taste, crust colour and toasting qualities of the bread (Van
Dam and Hille 1992; Gupta et al. 2003). α-Amylase is also being used as antisalling
agent.
Liquefaction: Liquefaction process includes the dispersion of insoluble starch
granules in aqueous solution followed by partial hydrolysis with thermostable amylases.
In industrial processes, the viscosity of starch suspension for liquefaction is of
extremely high following gelatinization. Thermostable α-amylas is used for reducing
the viscosity as a thinning agent and for partial hydrolysis of starch. If the liquefaction
process does not implemented well, some problems like poor filtration and turbidity of
the processed solution occurs. In ideal liquefaction of starch is that the starch slurry
which contains suitable amount of α-amylase must be treated at 105 -107°C as quickly
and uniformly as possible (Hattori 1984; Aiyer 2005).
Manufacture of oligosaccharide mixture: Maltooligomer mix is a novel
commercial product. Its composed of usually glucose, 2.2%; maltose, 37.5%;
maltotriose, 46.4%; and maltotetraose and larger maltooligosaccharides, 14%. It is
mainly used instead of sucrose and other saccharides. It is also prevents crystallization

12
of sucrose in foods and keep a certain level of hardness of the texture during storage
(Aiyer 2005).
Manufacture of maltotetraose syrup: Freezing points of frozen foods can be
controled by Maltotetraose syrup (G4 syrup) addition. Thermostable α-amylase of
B.licheniformis or B.subtilis is used to make commertial G4 syrups (Aiyer 2005).
Textile desizing: Considerable strain on the warp during weaving exist in
modern processes for textiles. Therefore the yarn must be protected from breaking. Thus
a removable protective layer is applied to the threads. Because starch is cheap, easily
available in most regions of the world and can be removed quite easily it is a very
attractive size agent. After production process starch is desized from textiles by the
application of α-amylases. The enzyme selectively remove the size not to attack the
fibres and randomly cleaves the starch into dextrins soluble in water then can be
removed by washing (Gupta el al. 2003).
Detergent applications: Early automatic dishwashing detergents were very
harsh, caused injury when ingested. Thus detergent industries started to search for
milder and more efficient solutions (Van 1992; Gupta et al. 2003) like enzymes. They
also lower washing temperatures. α–Amylase is included in 90% of all liquid detergents
today (Kottwitz 1994; Gupta et al. 2003) and now for automatic dishwashing detergents
the demand for it is increasing. Sensitivity to calcium and some oxidants comprise
limitations of most wild-type α-amylases in detergents. As achieved in protease stability
against oxidants in household detergents was accomplished by utilising successful
strategies (Gupta et al. 2003).
Additionally amylase is beeing used in direct fermentation of starch to ethanol
and in treatment of starch processing of waste water (SPW) (Aiyer 2005).
1.6. Production of Enzymes by Recombinant DNA Technologies
To obtain high level of expression both for fundamental studies and commercial
purposes foreign proteins are expressed in prokaryotic systems mostly. In the aim of
achieving maximal expression convenient expression vector and host must be used.
Bacterial expression might have problems like proteolytic degradation and the
production of proteins that accumulate in misfolded forms (Abdel-Fattah and Gaballa
2006).

13
According to the objectives of expression the expression system should be
choosen. As its vectors are well characterized E. coli expression is highly recommended
to obtain quickly a sufficient amount of a recombinant enzyme for basic
characterization. Furthermore E. coli has a specific growth rate five- to ten-fold higher
than most of the extremophilic organisms. So it is easily cultivated in the laboratory,
yields enough biomass and product even in simple shake flask growth. On the other
hand expression in yeasts has noticeable advantages for large-scale industrial
production. As yeast is a generally recognized as safe (GRAS) organism, it represents
an ideal pilot system for the production of enzymes to be applied in food and feed
manufacturing. Though stronger resistance of the yeast membrane respect to the
bacterial membrane, cytosolic products can not be easily recovered ( Schiraldi and De
Rosa 2002).
One strain can produce different amylases with different specificities or amount
of amylase production may be very low. As the screening for a single amylase is
difficult, cloning of amylase gene is performed. With the cloning of one gene directing
synthesis of desired amylase, a good characterisation and a significant yield can be
achieved in host like E. coli and B. substilis (Özcan, Altınalan and Ekinci 2001).
To overcome misfolding of recombinant proteins coexpression can be performed
with chaperone plasmids. Molecular chaperone is unstable conformer of another
protein. It regulates folding, oligomeric assembly, interaction of target protein with
other cellular components, switching between active and inactive conformations,
intracellular transport, or proteolytic degradation, either singly or with the help of co-
factors (Agashe and Hartl 2000; Bhutani and Udgaonkar 2002).

14
CHAPTER 2
MATERIALS AND METHODS
2.1. Materials
Preparation of buffers, reagents, solutions and the standart curves are given in
Appendix A and Appendix B
2.2. Bacterial Strain, Growth Conditions and Amylase Activity Test
Bacterial strain used in this study was isolated from Baçova Geothermal Region
in İzmir and determined as Gram (+) Geobacillus sp. in a previous study (Yavuz et al.
2004). Optimum growth conditions were determined for the strain and the strain was
cultivated in Luria Bertani broth at 55°C and 200 rpm for 22 hours.
2.2.1. Starch-Iodine Test
The strain number 33 was chosen to perform the study and amylase activity was
secreened according to starch iodine test (Bragger et al. 1989). Isolate was first spreaded
on starch agar plate and incubated for 16 hours at 55°C. Then the plate was dyed with
iodine solution.
2.3. Genomic DNA Isolation
The strain number 33 was cultivated in 5ml LB medium at 55ºC and 200 rpm for
22 hours. The culture was centrifugated at 13000 rpm for one minute then the pellet was
used to prepare cell lysate. Genomic DNA was isolated with Invitrogen PureLink
Genomic DNA mini kit according to the instructions of user manuel.

15
2.4. Construction of Primers
To constract primers for amplifing the genomic DNA, α-amylase gene region of
Geobacillus thermoleovorans subsp. stromboliensis strain P220 (GenBank A.C
HM034453.1) was taken as referans. Restriction sites of NdeI and Hind III enzymes
were placed to the end of both primers.
Seguences of primers;
Amf F : CATATGGAAATGGGGAACCGGCTCTTTATG
Amy R : AAGCTTTTATTCATTGATCCGTTTTGCCCG
2.5. Amplification of Genomic DNA - PCR Conditions
PCR mixture was prepared on ice as written below.
dH2O 14 µl
MgCl2 2 µl
dNTP mix (2mmol) 2.5 µl
Taq polimerase buffer 2.5 µl
Primer F 0.5 µl
Primer R 0.5 µl
DNA template (genomic DNA) 2.5 µl
Taq polimerase 0.5 µl
The PCR was performed for 30 cycle with the following conditions;
Initial denaturation 94 ºC
Denaturation 94 ºC
Annealing temperature 56 ºC
Extention 72 ºC
Final extention 72 ºC
Then the product was run on 1% agarose gel in order to be visualized.

16
2.6. Agarose Gel Electrophoresis
0.5 g of agarose was dissolved in 50ml TAE buffer and boiled in microwave
oven. After it was cooled under tap water, 0.5µl of EtBr (10.0 mg/ml) was added. The
solution was poured into electorphoresis gel aparatus. Then a comb useful to form
sample wells was placed. The gel was waited to cool to room temperature for 30
minute. Then the comb was removed and TAE buffer was poured on gel to cover. 5µl of
each samples were loaded into the wells after they were mixed with 1µl of 6x loading
dye. The gel was run with 100V and 80mA electrical field for 45 minutes. Finally, it
was visualized under the UV light.
2.7. Extraction of PCR Product from Agarose Gel
Agorose gel pieces including the amplified gene region was cut with a surgical
blade and put in a vial. It was extracted and purified with the Fermentas K0513 DNA
Extraction kit. The quantity of purified DNA was calculated measuring the absorbance
at 260nm with Nanodrop ND1000 instrument.
2.8. Cloning of Amylase Coding Gene Region
Purified PCR product was subcloned to T/A cloning vector, PTZ57RT, with
Fermentas InsTA clone PCR cloning kit K1214.
2.8.1. Ligation
The reaction was set in way the optimal insert/vector ratio was 10:1. The insert
volume was calculated from the equation:
ng of insert = [ng of vector x size of insert (bp) ∕ size of vector(bp)] x vector/insert
20 µl reaction mixture contained 2.0 µl 10X Ligation Buffer, 4µl T4 DNA
Ligase, 1 µl Vector pTZ57R/T, (0.17 pmol ends), 12 µl PCR product (20.8 ng/ µl) , 1 µl
ultra pure water. The mixture was incubated at room temperature overnight.

17
2.8.2. Compotent Cell Preperation (for E. coli DH5α and BL21 Cells)
Firstly, bacterial cell was inoculated on LB agar plate and incubated at 37ºC
overnight. Single colony was selected from plate then it was inoculated into a 5.0 ml of
LB liquid media with aditional incubation at 37˚C and 180 rpm overnight. After the
incubation, bacterial culture was transfered into 200 ml of SOB media and incubated at
100 rpm for 2 hours at 10˚C and 37˚C and for 16 hours at 10˚C. The culture was divided
into four equal volume and incubated on ice for 10 minutes. After that they were
centrifugated at 4˚C and 4000 rpm for 10 minutes. Supernatants were removed and
pellets were resuspended with 5.0 ml of ice-cold TB medium and the samples were hold
on ice for 10 minutes. They were centrifuged at 4˚C and 4000 rpm for 10 minutes. After
the supernanats were poured off, the pellets were resuspended gently on ice with TB
solution. 1.0 ml of TB solution was added for 1.0 ml of pellet. Then filtered (0.2 μm
filter) DMSO was added by 7.0% of TB solution. Next, the samples were aliquoted in a
volume of 100μl into previously cooled eppendorfs. In the final step, eppendorfs were
immersed into the liquid nitrogen immediately and stored at -80˚C.
2.8.3. Transformation of Cloning Vector to Compotent E. coli
DH5α Host Cells
5 µl of ligation mixture was mixed with 50 µl of compotent cell DH5α (stored at
- 80oC and thawed on ice before use). After incubating on ice for 10 minute, the mixture
was put in 42°C waterbath. Then it was incubated for 2 minutes on ice again. 400 µl
SOC media was added and cells were incubated at 37°C for 1.5 hours. Finally they were
spreaded on LB-ampicilin (100mg/ml) agar plate. Mixture of 40.0 μl of X-gal (20.0
mg/ml), 40.0 μl of IPTG (Isopropyl-β-D thiogalactopyranoside) (0.1 M) and 20.0 μl of
dH2O were spreaded on the surface of LB-amp plate before use. After the inoculation of
cells, the plates were incubated at 37ºC for 18-20 hours.

18
2.8.4. Plasmid Isolation
PTZ57RT vector including insert was isolated to be used in the following step of
the cloning to seguence the inserted gene. Single white colony from LB-amp plate was
inoculated into 5 ml LB-amp medium and incubated at 37°C for 12-16 hours while
shaking at 250 rpm. The bacterial culture was harvested by centrifugation at 13500 rpm
for 1 minute. The supernatant was decanted and the pellet was used to isolate plasmid
with the Fermantas Plasmid Mini Prep kit ♯ K0503. Finally amount of isolated plasmid
was determined with Nanodrop Spectroptotometer ND1000 at 260 nm. Then the whole
seguence of isolated PTZ57RT plasmid was analysed by (16 and 80 capillary, Applied
Biosystem, 3130XL) using M13 primers.
2.8.5. Digestion of Plasmid
With the aim of transfering the target gene to expression vector, ligated gene
was excised from cloning vector. The cloning vector PTZ57R/T was digested with the
NdeI and Hind III digestion enzymes. Double digestion was applied as in this
procedure.
3,5 µl of plasmid (202,4ng/µl)
0,5µl of NdeI
1µl of 10x fast digest buffer
4,5µl of dH20
The mixture was incubated at 37°C for 1 hour. Then the enzyme activity was
altered at 65°C for 5 minute. After that 0,5 µl of Hind III was added to the mixture and
incubated 37°C for 1 hour. The mixture was run on 1% agarose gel and digestion was
observed. Then insert was extracted from gel by using gel extraction procedure. pET
28a(+) was also digested with the same enzymes.

19
2.8.6. Ligation of Insert to Epression Vector pET 28a(+)
Due to pET 28a+ and insert were digested with the same enzymes they had sticky
ends and gained affinity to each other. The ligation reaction conditions were designed
according to 1/10 ratio of vector to insert as below;
5x ligation buffer 4µl
T4 ligase 1µlI
Insert 9µl (78ng/ul)
pET28a+ 6µl (36ng/ul)
The mixture was incubated overnight at room temperature.
2.8.7. Transformation to Compotent E. coli BL21 Cells
To express the target gene, plasmid pET 28a(+) with insert was transformed to
compotent E. coli BL21 cell line. 100µl of compotent cell was taken from -80°C and
put on ice immediately. Just before it thawed, 5 µl of ligation mixture was added. It was
incubated on ice for 30 minutes, in 42°C waterbath for 45 seconds and again on ice for
2 minutes. 250 µl SOC medium (heated to 37°C before use) was added and it was
incubated at 37°C, shaking with 200rpm for 1 hour. Finally the mixture was spreaded
on LB kanamycin(30µg/ml) agar plate and it was incubated at 37°C for 18 hours. The
colonies formed after incubation were used for plasmid isolation and also protein
expression.
2.9. Protein Expression Procedure for E. coli BL21 Cells
Single colony choosen from LB-kan agar plate was inoculated in 20 ml LB-kan
media and incubated at 37°C and 225 rpm for 16 hours. It was tranfered into 400ml LB-
kan media and incubated until the optical density of 0,8 at 600nm. Then IPTG was
added to the culture in a final concentration of 1mM. Additional 4 hour incubation was
proceeded at the same conditions.

20
2.10. Coexpression with Chaperone Plasmids
While the expressed protein could not be purified with nickel affinity
chromotography, chaperone plasmids were used to repair improper folding of expressed
protein. Chaperone plasmids were transfered to compotent E. coli BL21 cells including
pET 28a(+) with the insert. Firstly E. coli BL21 cells including pET 28(a+) plasmid
with the insert were made compotent according to the compotent cell preperation
method.
1,5 µl of each chaperone plasmids (70ng/µl) were tranfered into each 100µl
competent E.coli BL21 recombinant cells. 250 µl SOC medium (heated to 37° C before
use) was added and was incubated at 37°C, shaking with 200 rpm for 1 hour. The cells
were spreaded on LB-kan (30µg/ml)-chloramphenicol (20µg/ml) agar plates. The plate
was incubated at 37°C for 16 hours. A single colony was selected and inoculated into 5
ml of LB kan-chloramphenicol including also inducers of each plasmids. Five cultures
were prepared. They were incubated at 37°C at 200rpm for 16 hours.
Table 2.1. Chaperone plasmids and their properties
(Source: Instruction manuel of Takara Chaperone Plasmid Set.Cat.no. 3340)
No. Plasmid Chaperone Promoter Inducer
Resistant
Marker References
1 pG-JE8
dnaK-dnaJ-grpE
groES-groEL
araB
Ptz-1
L-Arabinose
Tetracyclin Cm (Nishihara 1998) (Nishihara 2000)
2 pGro7 groES-groEL araB L-Arabinose Cm Nishihara 1998
3 pKJE7 dnaK-dnaJ-grpE araB L-Arabinose Cm Nishihara 1998
4 pG-Tf2 groES-groEL-tig Pzt-1 Tetracyclin Cm Nishihara 2000
5 pTf16 tig araB L-Arabinose Cm Nishihara 2000
At the end of incubation, they were transfered into 100 ml of the same media and
incubated again at the same conditions. While the optical density of the cultures at 600
nm (OD600) reached to 0,4, IPTG was added with a final concentration of 1mM. Finally
the cultures were incubated for 4 hours.

21
2.11. Lysis of Bacterial Cells
Bacterial cultures were centrifuged at 5000 rpm, at 4°C for 10 minutes. Pellets
were dissolved in 5 ml lysis buffer and the cells were disrupted with a sonicator for
6x20 seconds. They were centrifuged again at 10000 g, at 4°C for 20 minutes.
Supernatants were used for protein purification. Both supernatants and pellets were run
in SDS-PAGE.
Lysis buffer was prepared in 50mM TrisHCl (pH 8.0) and included 10%
glycerol, 0.1% Triton X-100, 100ug/ml lysozyme, 1mM PMSF and 2mM MgCl2.
2.12. Enzyme Purification
Crude enzyme extract was loaded in DEAE-cellulose anion exchange column
(2.5 cm x 10cm). The column was equilibrated with 50mM Tris-HCl (pH 7.2) before
use. After loading sample, the column was washed with the same buffer. In order to
elute the proteins according to their ionic strenght, gradient dilutions of NaCl from 0 to
2 M in 50mM Tris-HCl (pH 7.2) were flowed from the column. 30 drops of fractions
were collected and then protein concentrations were measured at 280nm using
Nanodrop ND1000.
After SDS-PAGE analysis of fractions, collected fractions were loaded in
Sephadex G-100 size exclussion column. Elution was applied with 50mM TrisHCl (pH
7.2) in 50 drops.
ISCO Low Pressure Liquid Chromotography system was used to apply both ion
exchange and size exclussion. Purified protein was assayed for protein concentration
determination using Bradford method and for amylase activity analysis.
2.13. SDS-PAGE
Purified enzyme solution was screened in SDS-PAGE gel to detect the
molecular weight and purity. Biorad Mini– Protean Tetra Cell was used in this method.
10 ml Seperating gel (12% monomer conc.) and 5 ml Stacking gel 4% were prepared as
explained in appendix A and load to gel apparatus respectively. After the gel become

22
solid, module tank was filled with running buffer. In order to obtain 1µg/µl final
concentration, samples were diluted with sample buffer in 1/1 ratio. Protein marker and
samples were kept in boling water for 10 minutes to be denaturated. 5 µl marker and 10
µl of each sample were loaded into wells on the gel. They were run at 100 V for 120
minutes. Then the gel was replaced from electrophoretic modul and incubated into 20%
TCA for 30 minutes by shaking gently. It was rinsed with fresh ultrapure water. Then
the gel was incubated into 0,05% commassi blue R250 for 30 minutes on a shaker. After
the gel was destained with destaining solution, it was monitored with camera under
white light.
2.14. Screening of Amylase Activity on Agar Plate
1% starch agar plate was prepared then the crude enzyme extract and purified
enzyme was droplet to the plate. It was incubated at 55°C for 10 minutes. Then the plate
was dyed with iodine solution.
2.15. Protein Identification and Mass Spectrometric Analysis
2.15.1. In-Gel Digestion
In gel digestion was applied according to Shevchenko and co-workers protocol
(Shevchenko et al. 1996). It is a three-day procedure consists of cutting protein spot and
washing the gel pieces for the first day, reduction, alkylation, washing out reagents and
exchange of buffers followed by digestion with trypsin for the second day and
extraction of peptides for analysis for the third day.
Solutions required for in-gel digestion was prapared as described below.
• Washing solution ( 50% (v/v) methanol and 5% (v/v) acetic acid): 10 ml of methanol
(Merck) was mixed with 5 ml of deionized water and 1 ml of acetic acid was added. The
solution was adjusted to 20 ml with deionized water.
• 100 mM ammonium bicarbonate: 0.2 g of ammonium bicarbonate (AppliChem) was
dissolved in 20 ml of water.

23
• 50 mM ammonium bicarbonate: 2 ml of 100 mM ammonium bicarbonate was mixed
with 2 ml of deionized water.
• 10 mM DTT: 1.5 mg of dithiothreitol was dissolved in 1 ml of 100 mM ammonium
bicarbonate completely.
• 100 mM iodoacetamide: 18 mg of iodoacetamide was dissoved in 1 ml 100 mM
ammonium bicarbonate completely.
• Trypsin solution (20 ng/ml): 20 μg of sequencing-grade modified trypsin (V5111;
Promega) was dissolved in 1 ml of ice cold 50 mM ammonium bicarbonate by drawing
the solution into and out of the pipette. The solution was kept on ice until use.
• Extraction buffer (50% (v/v) acetonitrile and 5% (v/v) formic acid): 10 ml of
acetonitrile (Merck) was mixed with 5 ml of deionized water and 1 ml of formic acid
(Merck) was added. The solution volume was adjusted to 20 ml with deionized water.
First day; Protein spot was cut from SDS-PAGE gel with a surgical blade as
possible as beeing carefull to take whole protein and it was divided into smaller pieces.
The gel pieces were placed in a tube. 200 μL of wash solution was added and it was
incubated overnight.
Second day; Wash solution was removed from the sample. 200 μL of wash
solution was added again with incubation for additional 2-3 hours at room temperature
and finally discarded. Then the gel pieces were dehydrated with 200 μL of acetonitrile
for 5 minutes at room temperature. They became opaque white color. After acetonitrile
was removed the sample was dried in a vacuum centrifuge for 2-3 minutes at room
temperature.
In the next step gel pieces were incubated in 30 μL of 10 mM DTT for 30
minutes at room temperature to reduce the protein.
Again DTT was removed from the sample carefully. Then 30 μL of 100 mM
iodoacetamide was added and incubated for 30 minutes at room temperature to alkylate
the protein.
After iodoacetamide was removed from the sample carefully, the sample was
dehydrated for 5 minutes at room temperature with addition of 200 μL of acetonitrile.
Then it was also removed.
Rehydration was applied by incubating the sample with 200 μL of 100 mM
ammonium bicarbonate for 10 minutes at room temperature.

24
Ammonium bicarbonate was carefully removed. 200 μL of acetonitrile was
added to the sample and dehydrated for 5 minutes at room temperature. Acetonitrile was
carefully removed.
Sample was completely dried at room temperature in a vacuum centrifuge for 2-
3 minutes.
30 μL of the trypsin solution was added and the sample was allowed to rehydrate
on ice for 10 minutes with vortex mixing.
Sample was centrifugated for 30 seconds and the gel pieces were collected on
the bottom of the tube. Excess trypsin solution was carefully discarded from the sample
5 μL of 50 mM ammonium bicarbonate was added to the tube and the mixture
was vortexed. The sample was driven to the bottom of the tube by centrifuging the
sample for 30 seconds. Digestion was applied overnight at 37 ºC.
Third Day; After 30 μL of 50 mM ammonium bicarbonate was added and the
sample was incubated for 10 minutes, it was centrifudated for 30 seconds.
The supernatant was carefully collected and the sample was transferred to
another micro centrifuge tube.
30 μL of extraction buffer was added to the gel pieces and incubated for 10
minutes, Then it was centrifuged for 30 seconds. The supernatant was carefully
collected and combined with the former supernatant.
30 μL of extraction buffer was added to the tube containing the gel pieces, and
incubated for 10 minutes. It was centrifuged for 30 seconds and supernatant was
carefully collected and added to the tube containig previous supernatants.
The volume of the supernatant was reduced to less than 20 μL by evaporation in
a vacuum centrifuge at room temperature.
Finally volume of the sample was adjusted to 20 μL with acetic acid. Sample
became ready for mass spectrometric analysis.
2.15.2. Mass Spectrometric Analysis
Sample that was applied in-gel digestion procedure was identified by MALDI-
TOF-TOF Mass Spectrometry. Sequence of the protein spots were found by using
NCBInr (National Center for Biothecnology Information, Bethesda, USA) database.

25
For mass analysis, α-cyano-4-hydroxycinnamic acid (HCCA) was used as
matrix.
2.16. Determination of Protein Concentration
Protein concentration was determined with Bradford (Sigma, product number; B
6916) reagent. Standart curve was constructed by measuring absorbance of BSA
(Bovine serum albumin) standarts in 0.25 mg/ml, 0.5 mg/ml, 1 mg/ml, 1.4 mg/ml, 2
mg/ml concentrations.
50 µl of sample was mixed with 1.5 ml of Bradford reagent. The mixture was
incubated at room temperature in dark for 10 minutes. Protein concentrations were
measured at 595 nm with Perkinelmer Lamda 25 UV-Vis spectrophotometer.
2.17. Amylase Assay
Amylase activity was estimated by measuring the reducing sugar released during
the reaction of enzyme-substrate. Starch was used as substrate in the reaction and DNS
assay method was modified from Somogyi and Nelson (Nelson, 1944). 25µl of purified
enzyme extract was incubated with 50 µl of 1% starch solution in a 55ºC waterbath for
20 minute. 100 µl DNS reagent (Dinitrosalycilic acid solution) was added to the mixture
to stop the reaction. The mixture was incubated in boiling water for 5 minutes. After
cooling to room tempereture, 825 µl dH2O was added. Finally the optical density at 540
nm was measured.
The amount of reducing sugar was estimated according to standart curve that
was prepared by measuring absorbance of different concentrations of D-glucose at 540
nm. One unit of enzyme was defined as the amount of enzyme that produce 1 µmol of
reducing sugar per one minute under the assay conditions.

26
2.18. Protein Characterization
2.18.1. Optimum pH and Temperature
In order to obtain optimum pH for enzyme activity, substrate solution (1%
starch) was prepared in different buffers; pH 3.0-6.0 (citrate buffer), pH 7.0 (sodium
phosphate buffer), pH 8.0 (Tris-HCl buffer), pH 9.0, 10.0 (Glycine-NaOH buffer). Then
the amylase assay was applied in the sameway at 55°C. Blank was not including
enzyme solution.
Optimum temperature of the enzyme was determined by performing the enzyme
assay at different temperatures. Incubation temperature of enzyme-substrate solution in
waterbath was changed from 40ºC to 90 ºC.
2.18.2. pH and Temperature Stability
pH stability of the enzyme was tested by incubating 25 µl of enzyme solution
with 25 µl of pH 9 and pH 7 buffers for 6, 16, 24 hours respectively. Then the 50 µl
substrate was added and the assay was performed, absorbance values were measured at
540nm.
For temperature stability, 25 µl emzyme was incubated both 65 ºC and 80 ºC for
12, 16,24 hours and 50 µl substrate was added then amylase assay was performed.
2.18.3. Effect of Metal Ions on Enzyme Activity
25 µl of purified enzyme extract was incubated at 60 ºC waterbath in the
presence of 25 µl of some metal salts for 10 minutes then 25 µl of substrate solution
was added. The reaction was allowed to happen for 20 minutes at 60 ºC. Afterwards the
enzyme assay was applied. 10mM and 25mM of CaCl2, NaCl, NaF, MgCl2, CuSO4,
CoCl2, KCl solutions were used. Blank was formed by adding 25 µl of water to enzyme
extract and applying enzyme assay in the same conditions.

27
2.18.4. Effect of Solvents and Detergent on Enzyme Activity
25µl of purified enzyme extract was incubated at 60ºC waterbath in the presence
of 25µl of various surfectants and solvents for 10 minutes then 25µl of substrate
solution was added. The reaction was allowed to happen for 20 minutes at 60ºC. Then
the enzyme assay was applied in the same conditions.

28
CHAPTER 3
RESULTS AND DISCUSSION
3.1. Screening of Amylase Activity of Bacterial Strain
Isolate number 33 was spreaded on starch agar and incubated for 16 hours at 55°C.
When it was dyed with iodine solution, white zones were obtained. It proves that
isolated bacterial colonies are capable of degrading starch.
Figure 3.1. Bacterial colonies on starch agar plate
3.2. Genomic DNA Isolation and PCR Amplification
Bacterial genomic DNA was isolated from culture of isolate number 33. 87.24 ng/µl
DNA was obtained by measuring absorbance with Nanodrop ND 1000. Target sequence
(α-amylase) was amplified in the presence of designated amylase primers. After PCR
amplification, the product was run on agarose gel and photographed. Its molecular weight
was determined as nearly 1600 bp (Figure 3.2).

29
Figure 3.2. Agarose gel image of PCR product.
3.3. Cloning Experiments
3.3.1. Subcloning
At the end of gel extraction, the concentration of obtained DNA was found to be
43ng/µl. In 20µl ligation reaction, 142 ng DNA sample was used. Then ligated PTZ57R/T
cloning vector was transformed into compotent cells of E. coli DH5α. After incubation of
the compotents cells on LB-amp agar plate, blue and white colonies formed as shown in
figure 3.3. Blue nonrecombinant cells could metabolize X-gal because of lac-Z gene on
plasmid PTZ57R/T. Because the Lac-Z gene was interrupted by insertion of our target
gene, X-gal could not be metabolized by white recombinant colonies. Therefore white
colonies from the plate were choosen to continue further experiments.
500bp
1000bp
1500bp
3000bp
6000bp

30
Figure 3.3. White colonies on LB- amp plate indicating recombinant E.coli DH5α cells
including inserted gene
For the confirmation purpose, four white colonies were chosen from transformation
plate and plasmids were isolated from them. They were sequenced and compared with
each other, then the complete sequence of insert was determined. The length of the target
gene cloned into PTZ57R/T plasmid was found as to be 1542 bp. It was compared with the
referans gene seguence in figure 3.4. Sequence alignment between the referans gene
(Geobacillus thermoleovorans subsp. stromboliensis strain P220, GenBank A.C
HM034453.1) and our target gene sequences showed that overlap ratio is ~ 97%. Also,
the protein sequence was constructed and the molecular weight of our protein was
calculated as 59.9 kD.
Recombinant
colonies

31
Source ATGGAAATGGGGAACCGGCTCTTTATGCTGCTCGTCCTTCCGTTCCTTCTTTTTTATGCC 60
α-amylase ATGGAAATGGGGAACCGGCTCTTTATGCTGCTCGTCCTTCCGTTCCTTCTTTTTTATGCC 60
************************************************************
Source ATGCCGGCTGCGGCGGCGGAAAAAGAAGAACGGACGTGGCAAGATGAAGCCATTTATTTC 120
α-amylase ATGCCGGCTGCGGCGGCGGAAAAAGAAGAACGGACGTGGGAAGATGAAGCCATTTATTTC 120
*************************************** ********************
Source ATTATGGTCGACCGGTTTAACAATATGGATCCGACAAACGACCAGAACGTGAATGTGAAC 180
α-amylase ATTATGGTCGACCGGTTTAACAATATGGATCCGACAAACGACCAGAACGTGAATGTGAAC 180
************************************************************
Source GATCCGAAAGGGTATTTCGGCGGCGACTTGAAAGGGGTGACGGCGAAACTCGATTACATC 240
α-amylase GATCCGAAAGGGTATTTCGGCGGCGACTTGAAAGGGGTGACGGCGAAACTCGATTACATC 240
************************************************************
Source AAGGAGATGGGATTTACCGCCATTTGGCTGACGCCGATTTTTAAAAACATGCCGGGCGGT 300
α-amylase AAGGAGATGGGATTTACCGCCCTTTGGGTGACGCCGATTTTTAAAAACATGCCGGGGGGG 300
********************* ***** **************************** **
Source TATCATGGCTATTGGATTGAAGATTTTTATCAAGTCGATCCGCACTTTGGCACGCTGGGC 360
α-amylase TATCATGGCTATTGGATTGAAGAATTTTATCAAGTCCATCCGCACTTTGGGACGCTGGGG 360
*********************** ************ ************* ********
Source GATTTGAAAACACTCGTCAAAGAAGCGCATAAGCGCGACATGAAAGTCATTTTGGATTTT 420
α-amylase GATTTGAAAAAACTCCCCAAAAAAACGCATAAACGCGACATGAAAGGCATTTTGGAATTT 420
********** **** **** ** ******* ************* ********* ***
Source GTCGCCAACCATGTCGGTTACAATCACCCATGGTTACATGACCCAACGAAAAAAGATTGG 480
α-amylase GTCGCCAACCATGGCGGGTACAATCACCCCTGGGTACATGACCCCACCAAAAAAAAATGG 480
************* *** *********** *** ********** ** ****** * ***
Source TTTCACCCGAAAAAAGAGATTTTCGACTGGAACGACCAAACACAGCTTGAAAACGGCTGG 540
α-amylase TTTCTCCCCAAAAAAGAAAATTTCTACTGGGACGACCCAACCCCGCTTGAAAACGGCTGG 540
**** *** ******** * **** ***** ****** *** * ****************
Source GTGTATGGGTTGCCTGATTTGGCGCAGGAAAATCCAGAGGTCAAAACGTATTTAATTGAC 600
α-amylase GTGTATGGGTTGCCTGATTTGGCGCAGGAAAATCCAGAGGTCCAAACGTATTTAATTGAC 600
****************************************** *****************
Source GCTGCCAAATGGTGGATTAAAGAGACCGACATTGACGGTTACCGGCTCGATACAGTGCGC 660
α-amylase GCTGCCCAATGGTGGATTAAAGAGACCGACATTGACGCTTACCGGCTCGATACAGTGCGC 660
****** ****************************** **********************
Source CACGTGCCAAAATCGTTTTGGCAGGAGTTTGCGAAAGAAGTCAAATCGGTGAAAAAAGAC 720
α-amylase CACGTGCCAAAATCGTTTTGGCAGGAGTTTGTGAAAGAAAACAAATCGGTGAAAAAAGAC 720
******************************* ******* *******************
Source TTTTTCCTTCTCGGTGAAGTGTGGAGCGACGATCCGCGCTATATTGCCGATTACGGGAAG 780
α-amylase TTTTTCCTTCTCTGTGAAGTGTGGAGCGACGATCCGCGCTATATTGCCGATTACGGAAAG 780
************ ******************************************* ***
Source TATGGCATCGACGGGTTTGTCGATTATCCGCTGTATGGCGCGGTGAAGCAGTCGCTTGCG 840
α-amylase AATGGCATCGACGGGTTTGTCGATTATCCGCTGTATGGCGCGGTGAAGCAGTCGCTTGCG 840
***********************************************************
Source AGGCGCGATGCCTCGCTCCGCCCGCTGTATGATGTCTGGGAATACAACAAAACGTTTTAC 900
α-amylase AGGCGCGATGCCTCGCCCCCCCCCCTGTATGATGTCTGGGAATACAACAAAACGGTTTAC 900
**************** ** *** ****************************** *****
Source GACCGACCGTATTTGCTCGGGTCGTTTTTGGACAACCATGATACCGTGCGGTTTACGAAG 960
α-amylase GATCGACCGCATTTGCTCGCGTCGTTTTTGGACAACCATGATACCGTGCGGTTTACGAAG 960
** ****** ********* ****************************************
Source CTCGCGATTGACAACCGCAACAACCCGATTTCACGCATTAAACTGGCCATGACGTATTTG 1020
α-amylase CTCGCGATTGACAACCGCAACAACCCGATTTCACGCATTAAACTGGCCATGACGTATTTG 1020
************************************************************
Figure 3.4. Nucleotide sequence comparison of inserted gene and the source
(Geobacillus thermoleovorans subsp. stromboliensis strain P220)
(Cont. on next page)

32
Source TTCACCGCCCCTGGCATCCCGATCATGTATTACGGGACCGAAATCGCCATGAACGGCGGC 1080
α-amylase TTCACCGCCCCTGGCATCCCGATCATGTATTACGGGACCGAAATCGCCATGAACGGCGGC 1080
************************************************************
Source CAAGATCCGGACAACCGCCGTCTGATGGATTTCCGCGCCGATCCAGAAATCATCGATTAC 1140
α-amylase CAAGATCCGGACAACCGCCGTCTGATGGATTTCCGCGCCGATCCAGAAATCATCGATTAC 1140
************************************************************
Source TTGAAAAAAATCGGCCCGCTTCGCCAAGAGCTGCCATCATTGCGGCGCGGCGATTTTACG 1200
α-amylase TTGAAAAAAATCGGCCCGCTTCGCCAAGAGCTGCCATCATTGCGGCGCGGCGATTTTACG 1200
************************************************************
Source CTGTTGTATGAAAAAGACGGCATGGCGGTGTTGAAACGGCAATATCAAGATGAAACGACG 1260
α-amylase CTGTTGTATGAAAAAGACGGCATGGCGGTGTTGAAACGGCAATATCAAGATGAAACGACG 1260
************************************************************
Source GTCATCGCCATCAACAATACGAGCGAAACGCAGCATGTCCATCTCACCAATGACCAGTTG 1320
α-amylase GTCATCGCCATCAACAATACGAGCGAAACGCAGCATGTCCATCTCACCAATGACCAGTTG 1320
************************************************************
Source CCAAAAAACAAAGAACTGCGCGGCTTTTTATTGGACGATCTCGTCCGCGGCGATGAGGAC 1380
α-amylase CCAAAAAACAAAGAACTGCGCGGCTTTTTATTGGACGATCTCGTCCGCGGCGATGAGGAC 1380
************************************************************
Source GGCTACGACCTTGTGCTCGACCGCGAAACGGCGGAAGTATACAAGCTGCGGGAGAAAACA 1440
α-amylase GGCTACGACCTTGTGCTCGACCGCGAAACGGCGGAAGTATACAAGCTGCGGGAGAAAACA 1440
************************************************************
Source GGGATCAACATCCCGTTTATCGCCGCCATCGTATCGGTTTACGTGCTGTTTCTTTTGTTT 1500
α-amylase GGGATCAACATCCCGTTTATCGCCGCCATCGTATCGGTTTACGTGCTGTTTCTTTTGTTT 1500
************************************************************
Source TTATATTTGGTGAAAAAACGGGCAAAACGGATCAATGAATAA 1542
α-amylase TTATATTTGGTGAAAAAACGGGCAAAACGGATCAATGAATAA 1542
******************************************
Figure 3.4. (cont.)
The protein sequence of our enzyme matched up by 95% score with the
source gene. Protein sequence comparison of our enzyme and the source enzyme
was shown in figure 3.5.
α-Amylase 1 MEMGNRLFMLLVLPFLLFYAMPAAAAEKEERTWEDEAIYFIMVDRFNNMDPTNDQNVNVN
Source 1 MEMGNRLFMLLVLPFLLFYAMPAAAAEKEERTWQDEAIYFIMVDRFNNMDPTNDQNVNVN
********************************* **************************
α-Amylase 61 DPKGYFGGDLKGVTAKLDYIKEMGFTALWVTPIFKNMPGGYHGYWIEEFYQVHPHFGTLG
Source 61 DPKGYFGGDLKGVTAKLDYIKEMGFTAIWLTPIFKNMPGGYHGYWIEDFYQVDPHFGTLG
*************************** * ***************** **** *******
α-Amylase 121 DLKKLPKKTHKRDMKGILEFVANHGGYNHPWVHDPTKKKWFLPKKENFYWDDPTPLENGW
Source 121 DLKTLVKEAHKRDMKVILDFVANHVGYNHPWLHDPTKKDWFHPKKEIFDWNDQTQLENGW
*** * * ****** ** ***** ****** ****** ** **** * * * * *****
Figure 3.5. Protein sequence comparison of our protein and the source
(Geobacillus thermoleovorans subsp. stromboliensis strain P220)
(Cont. on next page)

33
α-Amylase 181 VYGLPDLAQENPEVQTYLIDAAQWWIKETDIDAYRLDTVRHVPKSFWQEFVKENKSVKKD
Source 181 VYGLPDLAQENPEVKTYLIDAAKWWIKETDIDGYRLDTVRHVPKSFWQEFAKEVKSVKKD
************** ******* ********* ***************** ** ******
α-Amylase 241 FFLLCEVWSDDPRYIADYGKNGIDGFVDYPLYGAVKQSLARRDASPPPLYDVWEYNKTVY
Source 241 FFLLGEVWSDDPRYIADYGKYGIDGFVDYPLYGAVKQSLARRDASLRPLYDVWEYNKTFY
**** *************** ************************ *********** *
α-Amylase 301 DRPHLLASFLDNHDTVRFTKLAIDNRNNPISRIKLAMTYLFTAPGIPIMYYGTEIAMNGG
Source 301 DRPYLLGSFLDNHDTVRFTKLAIDNRNNPISRIKLAMTYLFTAPGIPIMYYGTEIAMNGG
*** ** *****************************************************
α-Amylase 361 QDPDNRRLMDFRADPEIIDYLKKIGPLRQELPSLRRGDFTLLYEKDGMAVLKRQYQDETT
Source 361 QDPDNRRLMDFRADPEIIDYLKKIGPLRQELPSLRRGDFTLLYEKDGMAVLKRQYQDETT
************************************************************
α-Amylase 421 VIAINNTSETQHVHLTNDQLPKNKELRGFLLDDLVRGDEDGYDLVLDRETAEVYKLREKT
Source 421 VIAINNTSETQHVHLTNDQLPKNKELRGFLLDDLVRGDEDGYDLVLDRETAEVYKLREKT
************************************************************
α-Amylase 481 GINIPFIAAIVSVYVLFLLFLYLVKKRAKRINE
Source 481 GINIPFIAAIVSVYVLFLLFLYLVKKRAKRINE
*********************************
Figure 3.5. (cont.)
After digestion of the PTZ57R/T vector carrying insert gene with NdeI and
HindIII restriction enzymes, agarose gel electrophoresis was performed for confirmation
of digestion. Target sequence was isolated with gel extraction method. Then, isolated α-
amylase gene sequence was ligated with expression vector (pET28a+ plasmid). In the
following step transformation was carried out by using compotetent E.coli BL21 cells.
Protein expression procedure was applied to these recombinant cells and
expressed protein was tried to be purified with Ni-affinity chromotography. Unfortunately,
obtained protein amount was not sufficient for characterization studies. Large amount of
target protein was left in the pellet. It might be because of aggregation or misfolding of the
protein. The reason for inadequate protein purification in supernatant could be because of
histidine residues found inside of the protein ring resulting in blocking nickel binding to
the protein.
3.3.2. Coexpression with Chaperone Plasmids
Chaperone plasmids may be used to overcome misfolding of expressed protein. In our
studies, five chaperone plasmids were used to eliminate low expression of amylase
protein. Chaperone plasmids were originated from heat shock proteins therefore these

34
choosen plasmid kits were useful to increase expression level of our termophilic protein.
For the first step of coexpression , E. coli BL21 cells containing pET28a+ with target gene
were made compotent to take in the plasmid. Then, chaperone plasmids were inserted into
these cells seperately. After that protein expression procedure was employed according to
TAKARA kit. Next, cells were disrupted and centrifuged. Supernatants and pellets of cells
were loaded on SDS-PAGE and protein profiles were photographed as seen in figure 3.6.
As a result, concentration of the target protein was increased considerably by employing
chaperone 3.
Figure 3.6. SDS-PAGE image that shows effects of different chaperones on protein
expression: M: protein marker, S1: chaperone1supernatant,
P1: chaperone1pellet, S2: chaperone2 supernatant, P2: chaperone2 pelet,
S3: chaperone3 supernatant, P3: chaperone3 pelet, S4: chaperone4
supernatant, P4: chaperone4 pelet, S5: chaperone5 supernatant,
P5: chaperone5 pelet, SN: non-coexpressed protein in supernatant,
PN: non-coexpressed protein in pellet
3.4. Protein Expression and Purification
Protein exppession procedure was employed by using with cahperone 3.
Unfortunately, a good yield of protein was not achieved with application of affinity
chromotography as seen in figure 3.7. It seems that the target protein has no binding
M P1 S2 S1 P2 S3 P3 S4 P4 S5 P5 SN PN
35.0kD
45.0kD
18.4k D
14.4kD
66.0kD
116.0kD

35
capacity to Ni-affinity column. Therefore, aternative method namely ion exchange and
size exclussion chromotography were employed for the protein purification.
Figure 3.7. SDS-PAGE image of purification of coexpressed protein with affinity
chromotography; M: protein marker, P: pelet (before purification),
S: supernatant (before purification), Fl: flowthrough, W: washing solution,
Fr: collected fraction
First, the protein was tried to be purified by using ion exchange chromotography.
After washing step, elution was done with a gradient concentration of NaCl. The proteins
were seperated according to their ionic strenght. Collected fractions were first run on SDS-
PAGE to visualize the target protein. Fractions containing target protein were incorporated
and loaded to Sephadex G-100 gel filtration column. After that, SDS-PAGE was
performed again for confirmation of purification. 30 ml of amylase protein was obtained
after overall prufication procedure. It was concentrated to 10 ml at 40ºC in vacuum oven.
Then, the concentration of purified protein was found as 3mg/ml by measurements with
nanodrop instrument. Concentrations of our purified protein was also measured by
employing Bradford method. According to the standart curve constructed with optical
densities of different concentrations of BSA at 595 nm, concentration of our purified
enzyme was found to be 1,1252 mg/ml. So, obtained total protein was 11.252 mg.
M P S Fl w Fr
116k
D
66kD
45kD
36kD
25kD
18kD

36
Figure 3.8. SDS-PAGE image of unpurified and purified protein M: protein marker,
S:unpurified supernatant, P: unpurified pellet, F1, F2, F3, F4: fractions after
ion-exchange chromotography
3.5. Screening of Amylase Activity on Agar Plate
Purified protein was spotted on 1% starch agar. Afterwards it was dyed with KI/I
solution. White zones indicating amylase activity were formed (Figure 3.9). It was a
preliminary test to screen amylase activity.
Figure 3.9. Amylase activity screening on stach agar plate
M S F2 F1
1
P F4 F3
14bp
25bp
35bp
45bp
66bp
116bp
19bp

37
3.6. Protein Identification and Mass Spectrometric Analysis
For mass spectrometric analysis of our protein spot on the SDS-PAGE gel, the protein
was digested into its peptides. After in-gel digestion, the peptides were analysed in the
MALDI-TOF mass spectrophotometry instrument. 1776 D peptid of our protein matched
with α-amylase family protein of Geobacillus thermodenitrificans NG80-2 with NCBInr
database. Protein sequence coverage and Mascot Mowse score were found to be as 3%,
and 57, respectively. Nominal mass and pI of identified protein were found to be 59855 D
and 5.66, respectively.
The sequences of identified protein in mass spectometric analysis and the sequence of
our protein constructed were compared (Figure 3.10). Their complete sequence were
matched with 92% ratio. Mached peptides in mass spectrometric analysis are shown in
bold.
Figure 3.10. Sequence comparison of our protein with the protein (α-amylase family
protein of G.thermodenitrificans NG80-2) identified in mass spectrometry
analysis.
identified MGNRLFMLFILPFLLFYAMPVAAAEKEERTWQDEAIYFIMVDRFNNMDSTNDQDVNVNDP 60
our protein MGNRLFMLLVLPFLLFYAMPAAAAEKEERTWEDEAIYFIMVDRFNNMDPTNDQNVNVNDP 62
identified KGYFGGDLKGVTAKLDYIKEMGFTAIWLTPIFKNRPGGYHGYWIEDFYEVDPHFGTLDDL 120
our protein KGYFGGDLKGVTAKLDYIKEMGFTALWVTPIFKNMPGGYHGYWIEEFYQVHPHFGTLGDL 122
identified KTLVKEAHKRDMKVILDFVANHVGYDHPWLHDPAKKDWFHPKKEIFDWNSQEQVENGWVY 180
our protein KKLPKKTHKRDMKGILEFVANHGGYNHPWVHDPTKKKWFLPKKENFYWDDPTPLENGWVY 182
identified GLPDLAQENPEVKNYLIDAAKWWIKETDIDGYRLDMVRHVPKSFWQEFAKEVKAVKKDFF 240
our protein GLPDLAQENPEVQTYLIDAAQWWIKETDIDAYRLDTVRHVPKSFWQEFVKENKSVKKDFF 242
identified LLGEVWSDDPRYIADYGKYGIDGFVDYPLYGAVKQSLAKRDASLRPLYDVWEYNKTFYDR 300
our protein LLCEVWSDDPRYIADYGKNGIDGFVDYPLYGAVKQSLARRDASPPPLYDVWEYNKTVYDR 302
identified PYLLGSFLDNHDNVRFTKLVIDHRNNPISRMKVAMTYLFTAPGIPIMYYGTEIAMTGGPD 360
our protein PHLLASFLDNHDTVRFTKLAIDNRNNPISRIKLAMTYLFTAPGIPIMYYGTEIAMNGGQD 362
identified PDNRRLMDFRADPEIIDYLKKVGPLRQQLPSLRRGDFTLLYEQDGMAVFKRQYKDETTVI 420
our protein PDNRRLMDFRADPEIIDYLKKIGPLRQELPSLRRGDFTLLYEKDGMAVLKRQYQDETTVI 422
identified AINNTSETKHVHLTNEQLPKNKELRGFLLDDLVRGDEDGYDIVLDRETAEVYKLRNKTGV 480
our protein AINNTSETQHVHLTNDQLPKNKELRGFLLDDLVRGDEDGYDLVLDRETAEVYKLREKTGI 482
identified NVPFIVAMVAVYALFILFLYMVKKRTKRTNE 511
our protein NIPFIAAIVSVYVLFLLFLYLVKKRAKRINE 513

38
3.7. Protein Characterization
3.7.1. Optimum pH and Temperature
Optimum pH and temperature values for the purified enzyme were determined
by using the amylase assay based on Somogyi and Nelson (Nelson 1944) method.
Relative enzyme activity was measured at different pHs and temperatures ranging from
3 to 9 and 40°C to 90°C, respectively. According to our results shown in Figure 3.11,
the enzyme showed 65% activity at pH 5 and 70% activity at pH 9. Optimum activity
was obtained at pH 8 as considered 100% activity. On the other hand, as seen in Figure
3.12, the enzyme showed activity in range of 50-70°C, but the optimum temperature for
enzyme activity was determined as to be 60°C. When the optimum pH and temperature
values for α-amylase were compared with other studies, similarities and differences
were observed. Optimum pHs and temperatures of amylase proteins obtained from
some bacterial strains are listed as follows: from Bacillus ferdowsicous; pH 4.5, 70°C
(Asoodeh A. et al 2010), from Thermococcus profoundus; pH 4-5, 80°C (Kwak et al.
1998), from Lactobacillus manihotivorans; pH 5.5, 55°C (Aguilar et al. 2000) from
Geobacillus caldoxylosilyticus TK4; pH 7.0, 50°C (Kolcuğlu et al. 2010), from Bacillus
sp. US100; pH 5.6, 80°C (Ben Ali et al. 1999), from Anoxybacillus sp.; pH 8.0, 60°C
(Chai et al. 2012), from Bacillus amyloliquefaciens; pH 7.0, 70°C (Underkofler 1976),
from Pyrococcus furiosus; pH 5.5, 100°C (Laderman et al. 1993a,b), from
Thermococcus profoundus; pH 4.0–5.0, 80°C (Kwak et al. 1998).

39
Figure 3.11. Effect of pH on amylase enzyme activity (at 55ºC)
Figure 3.12. Effect of temperature on amylase enzyme activity (pH 8)
3.7.2. pH and Temperature Stabilities
Stability of the enzyme at different pHs and temperatures were determined in
different time intervals. pH stability was studied by incubating the enzyme in pH 7 and
9 buffers at 65°C for 6, 16 and 24 hours. After 6 hours, the enzyme retained 80 and
75% of its activity at pH 7 and 9, respectively. After incubation of the enzyme at 60 and

40
80°C at pH 8 for 1, 2, 3, 4, 5, 6, 12, 16 and 24 hours, enzyme assay was performed and
residual activity was measured. According to our results, enzyme activity was so high
for 6 hours. At the end of 5 and 6 hours it retained 94 and 89% of activity, respectively.
On the other hand, in 85°C its residual activity was 85% after 2 hours, then, it was
gradually decreased to 60% at the end of 12 hours. When the literature was examined;
α-amylase obtained from Geobacillus caldoxylosilyticus TK4 was incubated in different
pH buffers at 50°C and residual activity was obtained >90% at different pHs from pH 3
to 9 after 7 days. While incubating at 80°C and pH7, 80% residual activity was seen
after 3 days in the same study (Kolcuoğlu et al. 2010). For α-amylase of Bacillus sp.
US100, the activity was completely stable at 80°C for at least 90 minutes (Ben Ali
1999). α-Amylase from marine haloalkaliphilic Saccharopolyspora sp. A9 retained 90%
of its activity for 12 hours at pH10 and the activity was decreased gradually to 80%
after 24 hours (Chakraborty et al. 2010).
Figure 3.13. Stability of amylase activity at pH 7 for 24 hours (at 60ºC)

41
Figure 3.14. Stability of amylase activity at pH 9 for 24 hours (at 60ºC)
Figure 3.15. Stability of the amylase activity at 65°C for 24 hours (pH 8)

42
Figure 3.16. Stability of the amylase activity at 85°C for 24 hours (pH 8)
3.7.3. Effect of Metal Ions on Enzyme Activity
In order to determine the effect of metal ions on enzyme activity, the enzyme
was incubated with 10mM and 25mM metal salts for 10 minutes. Then the enzyme
assay was applied and the enzymatic activity was measured. The results were shown in
Figure 3.17. According to the results the activity was increased to 166, 141 and 12 by
Co+2
, Ca+2
and Mg+2
, respectively. While Na+ and K
+ ions showed no significant effect,
relative activity was decreased slightly by Cu+2
. According to the literature Ca was
typically found to be as inducer of α-amylase enzyme activity. Chakraborty et al. (2010)
measured relative activity as 110.21% with 10mM Co+2
, 117% with 10mM Cu+2
, 142%
with 10mM Ca+2
. In another study (Kolcuoğlu et al. 2010), the activity was inhibited
25% by Co+2
whereas the activity was induced 150 and 110% by Mn+2
and Ca+2
,
respectively. By contrast, the activity of a thermoactive α-amylase from Bacillus sp. was
fairly degreased in presence of Ca+2
and Mg+2
(Pancha et al. 2010).

43
Figure 3.17. Effect of metal ions on enzyme activity
3.7.4. Effect of Various Agents on Enzyme Activity
The effect of the organic solvents, surfactans and some agents on the enzyme activity was
investigated to gather information on whether they inhibit or activate the enzyme. Seperately 10%
organic solvents, 1% surfactants and 1mM agents were added to the enzyme solution. The samples
were incubated for 10 minutes at 60°C. Then, the enzyme assay was performed. The results showed
that acetone had excessive inhibition and methanol had no significant effect on the activity of the
enzyme. PMSF, DDT and Triton X-100 had no effect on enzyme activity. On the other hand, the
enzyme activity was slighty inhibited by SDS.
In the literature, α-amylase from Anoxybacillus sp. was investigated in presence of some
agents and relative activities were listed as; b-Mercaptoethanol (50 mM) 67%, Urea (8 M)
53%, SDS (1%, w/v) 3%, Triton X-100 (5%, v/v) 119%, EDTA (5 mM) 4% (Chai et al.
2012). In another study, iodoacetic acid, N-bromosuccinic acid, SDS, guanidine
hydrochloride were investigated and found to be as inhibitors for T. profundus DT5432
amylase (Chung et al. 1995).

44
Table 3.1. Effect of various agents on enzyme activity
Agent
Concentration
Relative Activity (%)
None
100
Hexane 10% 82.70
Methanol 10% 98.0
Ethanol 10% 85.0
Acetone 10% 55.12
PMSF 1mM 100.3
DDT 1mM 100.16
EDTA 1mM 87.73
SDS 1% 36.0
Tween 20 1% 60.6
TritonX-100 1% 102.8
BME 1% 93.3
45
CHAPTER 4
CONCLUSION
The aim of this study was to isolate amylase enzyme from thermophilic Bacillus
sp. by using molecular cloning methods, purify and characterize the isolated enzyme. In
this context, a thermophilic Bacillus strain isolated from Balçova Geotermal region in
İzmir was used as the starting material for the experiments. The strain was previously
characterized by Elif Yavuz.
The strain number-33 was also determined as to produce amylase enzyme in her
study. Firstly, the amylase activity was verified by performing starch-iodine test. The
clear zones indicated amylase activity was formed around the colonies on starch agar
plate. α-Amylase coding gene from this microorganism was cloned to compotent E.coli
BL21 cells by using molecular methods. Recombinant cells were cultured and protein
expression was stimulated by IPTG addition. The expressed enzyme was purified by
performing ion exchange chromatograpy using a weak anion exchange (DEAE-
Cellulose) column and also size exclussion chromotography using G-100 Sephadex
column. Purified enzyme was identified by mass specrometry and matched with α-
amylase family protein of Geobacillus thermodenitrificans NG80-2. Aminoacid
sequence similarity of the identified enzyme and our purified enzyme was found to be
92%.
In the enzyme characterization studies, the results indicated that the amylase
enzyme had the highest activity at pH 8.0 and 60°C. After 6 hours the enzyme retained
80% of its activity at pH 7 and 75% of activity at pH 9. The enzyme is stable for 6 hours
at 65°C and 2 hours at 85°C. According to the results Co+2
, Ca+2
, Mg+2
increased the
enzyme activity. While Na+ and K
+ ions did not have important effect on enzyme, Cu
+2
slightly decreased the relative activity. Resultant enzyme was found to be stable in the
presence of 10% methanol, 1mM PMSF, 1mM DDT, 1% Triton X-100. The relative
activity was considerably decreased in presence of 1% SDS and 1% Tween 20.
In conclusion, the amylase enzyme isolated from alkaliphilic and thermophilic
Bacillus sp. was cloned, expressed, purified and characterized during our studies.

46
In the further studies, this enzyme features could be improved by protein
engineering efforts in order to utilize in several biotechnological processes. Moreover
the immobilization studies using various organic or inorganic supports could be appllied
to the enzyme in order to be used in industrial processes.

47
REFERENCES
Abdel-Fattah Y. R. and Gaballa A. A. 2008. Identification and over-expression of a
thermostable lipase from Geobacillus thermoleovorans Toshki in Escherichia coli.
Microbiological Research 163:13-20.
Aguilar G., Morlon-Guyot J., Trejo-Aguilar B., Guyot J.P., 2000. Purification and
characterization of an extracellular alpha-amylase produced by Lactobacillus
manihotivorans an amylolytic lactic acid bacterium. Enzyme Microb. Technol.
27: 406–413.
Aiyer P. V. 2005. Amylases and their applications. African Journal of Biotechnology 4
(13): 1525-1529.
Ash C., Farrow J. A. E., Wallbanks S. and Collins M. D. 1991. Phylogenetic
heterogeneity of the genus Bacillus revealed by comparative analysis of small-
subunit-ribosomal RNA. Lett. Appl. Microbiol. 13: 202–206.
Asoodeh, A., Chamani, J., Lagzian, M. (2010). A novel thermostable, acidophilic alpha-
amylase from a new thermophilic "Bacillus sp. Ferdowsicous" isolated from
Ferdows hot mineral spring in Iran: Purification and biochemical characterization.
Int J Biol Macromol 46: 289-297.
Aquino A. C. M. M., Jorge J. A., Terenzi H. F. and Polizeli M. L. T. M. 2003. Studies
on a hermostable α-amylase from the thermophilic fungus Scytalidium
thermophilum. Applied Microbiol Biotechnology 61: 323-328.
Baker G. C., Gaffar S., Cowan D. A., and Suharto A. R. 2001. Bacterial community
analysis of Indonesian hot springs. FEMS Microbiology Letters 200 (1):103-109.
Ben Ali M., Mezghani M. and Bejar S. 1999. Enzyme and Microbial Technology 24:
584-589.
Bhutani N. and Udgaonkar J.B. 2002. Chaperonins as protein-folding machines.
Current Science, Vol. 83, No. 11: 1337-1351.
Bibel M., Bretel C., Gosslar U., Kriegshauser G., Liebl W. 1998. Isolation and analysis
of genes for amylolyticenzymes of the hyperthermophilicbac terium Thermotoga
maritema. FEMS Microbiol. Lett. 158: 9–15.
Bragger J.M., Daniel R.M., Coolbear T., Morgan H.W. 1989. Very stable enzymes from
extremely thermophilic archaebacteria and eubacteria,. Applied Microbiology and
Biotechnology 31: 556-561.
Brown S., Kelly R., 1993. Characterization of amylolytic enzymes having both a 1,4
and a 1,6 hydrolyticac tivity from the thermophilicarc haea Pyrococcus furiosus
and Thermococcus litoralis. Appl. Environ. Microbiol. 59: 2614–2621.

48
Canganella F., Andrade C., Antranikian G., 1994. Characterization of amylolyticand
pullulytic enzymes from thermophilic archaea and from a new Ferividobacterium
species. Appl. Microb. Biotechnol. 42: 239–245.
Chai Y. Y., Rahman R. N. Z. R. A., Illias R. Md. and Goh K. M. 2012. Cloning and
characterization of two new thermostable and alkalitolerant α-amylases from the
Anoxybacillus species that produce high levels of maltose. Journal of Industrial
Microbiology & Biotechnology Volume 39, Issue 5: 731-741.
Chakraborty S., Khopade A., Bia R., Jian W., Liu X., Mahadik K., Chopade B., Zhang
L. and Kokare C. 2011. Characterization and stability studies on surfactant,
detergent and oxidant stable α- amylase from marine haloalkaliphilic
Saccharopolyspora sp. A9. Journal of Molecular Catalysis B: Enzymatic 68:52–
58.
Chung YC., Kobayashi T., Kanai H., Akiba T., Kudo T. 1995. Purification and
properties of extracellular amylase from the hyperthermophilic archeon
Thermococcus profundus DT5432. Appl Environ Microbiol 61:1502-6.
Cordeiro C.A.M., Martins M.L.L. 2002. Production and properties of α-amylase from
thermophilic Bacillus sp.. Brazilian Journal of Microbiology 33:57-61.
Darnis S., Juge N., Guo X., Marchis-Mouren G., Puigserver A. and Chaix J. 1999.
Biochimica et Biophysica Acta 1430: 281-289.
Davidson 2011. Crystal structure of human salivary α-amylase. www.bio.davidson.edu.
Access: March 2011.
DeFlaun M.F., Fredrickson J.K, Dong H., Pfiffner S.M., Onstott T.C., Balkwill D.L.,
Streger S.H., Stackebrandt E., Knoessen S. and van Heerden E. 2007. Isolation
and characterization of a Geobacillus thermoleovorans strain from an ultra-deep
South African gold mine. Systematic and Applied Microbiology 30: 152–164.
Estelle L., Ladrat C., Ann G., Georges B., Francis D. 1997. Thermostable
amylolyticenzymes of thermophilic microorganisms from deep-sea hydrothermal
vents. Animal Biology. CR Acad. Sci. Paris 320: 893–898.
Feitkenhauer H., Schnicke S., Muller R., Markl H. 2001. Determination of the kinetic
parameters of the phenol-degrading thermophile Bacillus thermoleovorans sp.A2.
Appl Microbiol Biotechnol 54: 744-750.
Feitkenhauer H., Schnicke S., Muller R., Markl H. 2003. Kinetic parameters of
continuous cultures of Bacillus thermoleovorans sp. A2 degrading phenol at
658C. J Biotechnol 103: 129-135.
Frøystad M. K., Lilleeng E., Sundby A. and Krogdahl A. 2006. Cloning and
characterization of α-amylase from Atlantic salmon (Salmo salar L.).
Comparative Biochemistry and Physiology Part A 145: 479–492.

49
Haki G.D. and Rakshit S.K. 2003. Developments in industrially important thermostable
enzymes. Bioresource Technology 89: 17-34.
Henrissat B. and Coutinho P. M. 2002. Carbohydrate-actıve enzymes in completely
sequenced genomes. Carbohydrate Bioengineering: Interdisciplinary Approaches.
The Royal Society of Chemistry, Cambridge 171-177.
Horvathova V., Godany A., Sturdık E. and Janecek S. 2006. α-Amylase from
Thermococcus hydrothermalis: Re-cloning aimed at the improved expression and
hydrolysis of corn starch. Enzyme and Microbial Technology 39: 1300–1305.
Gantlet H., Duchiron F., 1998. Purification and properties of a thermoactive and
thermostable pullulanase from Thermococcus hydrothermalis, a
hyperthermophilic archaeon isolated from a deep sea hydrothermal vent. Appl.
Microbiol. Biotechnol. 49, 770–777.
Giver L., Gershenson A., Freskgard P.O., Arnold F.H. 1998. Directed evolution of a
thermostable esterase. Proc. Natl. Acad. Sci. 95: 12809–12813.
Gupta R., Gigras P., Mohapatra H., Goswami V.K. and Chauhan B. 2003. Microbial α-
amylases: a biotechnological perspective. Process Biochemistry 38: 1599-1616.
Jeayoung K., Takashi N., Ryu S., 1989. Thermostable, raw-starchdigesting amylase
from Bacillus stearothermophilus. Appl. Environ. Microbiol. 55: 1638–1639.
Jensen B., Olsen, J. 1991. Physicochemical properties of a purified alpha-amylase from
the thermphilicfungus Thermomyces lanuginosus. Enzyme Microb. Technol. 14:
112–116.
Kim C., Nashiru, O., Ko, J., 1996. Purification and biochemical characterization of
pullulanase type I from Thermus caldophilus Gk-24. FEMS Microbiol. Lett. 138:
147–152.
Koch R., Spreinat K., Lemke K., Antranikan G. 1991. Purification and Properties of a
hyperthermoactive α-amylase from the archaeobacterium Pyrococcus woesei.
Arch. Microbiol. 155: 572-578.
Kolcuoğlu Y., Colak A., Faiz O. and Belduz A. O. 2010. Cloning, expression and
caharacterization of highly thermo- and pH-stable maltogenic amylase from a
thermophilic bacterium Geobacillus caldoxylosilyticus TK4. Process
Biochemistry 45: 821–828.
Kuhn H.J., Cometta S., Fiechter A. 1980. Effects of growth temperature on maximal
specific growth rate, yield, maintenance, and death rate in glucose-limited
continuous culture of the thermophilic Bacillus caldotenax. Eur J Appl Microbiol
10: 303-315.
Kumar C.G. 2002. Purification and characterization of a thermostable alkaline protease
from alkalophilic Bacillus pumilus. Lett. Appl. Microbiol. 34: 13-17.

50
Kumar S., Nussinov R. 2001. How do thermophilic proteins deal with heat?. Cell. Mol.
Life Sci. 58: 1216-1233.
Kwak Y., Akeba T., Kudo T. 1998. Purification and characterization of enzyme from
hyperthermophilic archaeon Thermococcus profundus, which hydrolyses both a-1-
4 and a-1-6 glucosidic linkages. J. Ferment. Bioeng. 86: 363–367.
Laderman K., Davis B., Krutzsch H., Lewis M., Griko Y., Privalov P., Anfinsen C.,
1993(a). The purification and characterization of an extremely thermostable a-
amylase from the hyperthermophilic archaebacterium Pyrococcus furiosus. J.
Biol. Chem. 268: 24394–24401.
Landerman K., Asada K., Uemori T., Mukai H., Taguchi Y., Kato, I., Anfinsen, C.
1993(b.) Alpha amylase from the hyperthermophilic archaebacterium Pyrococcus
furious. Cloning and sequencing of the gene and expression in E. coli. J. Biol.
Chem. 268: 24402–24407.
Li W.F., Zhou X. X., Lu P. 2005. Structural features of thermozymes. Biotechnology
Advances 23: 271–281.
Lopez G. 1999. DNA supercoiling and temperature adaptation: a clue to early
diversification of life. J. Mol. Evol. 46: 439-452.
Marchant R., Banat I. M., Rahman T. J., Berzano M. 2002a. What are high temperature
bacteria doing in cold environments?. Trends Microbiol 10: 20-121.
Marchant R., Banat I. M., Rahman T. J., Berzano M. 2002b. The frequency and
characteristics of highly thermophilic bacteria in cool soil environments. Environ
Microbiol 4: 595-602.
Monfort A., Blasco A., Preito J.A., Sanz P. 1996. Combined expression of Aspergillus
nidulans endoxylanase X-24 and Aspergillus oryzae α-amylase in industrial
baker’s yeast and their use in bread making. Appl Environ Microbiol 62: 3712-5.
Nazina T.N., Tourova T.P., Poltaraus A.B., Novikova E.V., Grigoryan A.A., Ivanova
A.E., Lysenko A.M., Petrunyaka V.V., Osipov G.A., Belyaev S.S., Ivanov M.V.
2001. Taxonomic study of aerobic thermophilic bacilli: Descriptions of
Geobacillus subterraneus gen. nov., sp. nov. and Geobacillus uzenensis sp. nov.
from petroleum reservoirs and transfer of Bacillus stearothermophilus, Bacillus
thermocatenulatus, Bacillus thermoleovorans, Bacillus kaustophilus, Bacillus
thermoglucosidasius and Bacillus thermodenitrificans to Geobacillus as the new
combinations G. stearothermophilus, G. thermocatenulatus, G. thermoleovorans,
G. kaustophilus , G. thermoglucosidasius and G.thermodenitrificans. Int J Syst
Evol Microbiol 51: 433-446.
Nelson N. 1944. A photometric adaptation of the Somogyi method for the determination
of glucose. J. Biol. Chem. 153: 375-380.

51
Nipkow A., Shen G., Zeikus J. 1989. Continuos production of thermostable b-amylase
with Clostridium thermosulfurogenes: effect of culture conditions and metabolite
levels on enzyme synthesis and activity. Appl. Environ. Microbiol. 55: 689–694.
Nishara K., Kanemori M., Kıtaga W.A.M., Yanagı H., and Yura T. 1998. Chaperone
Coexpression Plasmids: Differential and Synergistic Roles of DnaK-DnaJ-GrpE
and GroEL-GroES in Assisting Folding of an Allergen of Japanese Cedar Pollen,
Cryj2, in Escherichia coli. Applied and Environmental Microbıology 1694–1699.
Nishara K., Kanemori M., Yanagı H., and Yura T. 2000. Overexpression of Trigger
Factor Prevents Aggregation of Recombinant Proteins in Escherichia coli.
Applied and Environmental Microbıology 884–889.
Pancha I., Jain D., Shrivastav A.,, Mishra S. K., Shethia B., Mishra S., V.P. Mohandas
and Jha B. 2010. A thermoactive α-amylase from a Bacillus sp. isolated from
CSMCRI salt farm. International Journal of Biological Macromolecules 47: 288–
291.
Pavlostathis S. G., Marchant R., Banat I. M., Ternan N. G. and McMullan G. 2006.
High growth rate and substrate exhaustion results in rapid cell death and lysis in
the thermophilic bacterium Geobacillus Thermoleovorans. Biotechnology and
Bioengineering. Vol. 95:No. 1.
Patel R.K., Dodia M.S., Singh S.P. 2005. Extracellular alkaline protease from a newly
isolated haloalkaliphilic Bacillus sp. Production and optimization. Process
Biochemistry 40: 3569-3575.
Pennisi E. 1997. Industry, extremophiles begin to make their mark. Science 276: 705–
706.
Pintauro N.D. 1979. Bread and baked goods. Food processing enzymes */recent
developments. Food technology review No. 52. Park Ridge, NJ, USA: Noyes Data
Corporation.
Prieto J.A., Bort B.R., Martinez J., Randez-Gil F., Buesa C., Sanz P. 1995. Purification
and characterization of aa new α-amylase of intermediate thermal stability from
the yeast Lipomyces kononenkoae . Biochem Cell Biol 73: 41-9.
Poonam N., Dalel S., 1995. Enzyme and microbial systems involved in starch
processing. Enzyme Microb. Technol. 17:770–778.
Rahman T.J., Marchant R., Banat I. M. 2004. Distribution and molecular investigation
of highly thermophilic bacteria associated with cool soil environments. Biochem
Soc Trans 32: 209-213.
Rainey F. A., Fritze D. and Stackebrandt, E. 1994. The phylogenetic diversity of
thermophilic members of the genus Bacillus as revealed by 16S rDNA analysis.
FEMS Microbiol. Lett., 115:205–212.

52
Rashid N., Farooq A., Haq I. and Akhtar M. 2009. Insoluble but enzymatically active
α-amylase from Bacillus licheniformis. Biologia 64/4: 660-663.
Romano I., Poli A., Lama L., Gambacorta A. and Nicolaus B. 2005. Geobacillus
thermoleovorans subsp. stromboliensis subsp. nov., isolated from the geothermal
volcanic environment. J. Gen. Appl. Microbiol.51:183-189.
Ramkrishna S., Samir K., Chakrabarty S. 1993. Immobilization of a-amylase from
Mycelophthora thermophila D-14 (ATCC 48104). Enzyme Microbiol. Technol.
15: 801–804.
Rudiger A., Jorgensen, P., Antranikan G. 1995. Isolation and characterization of a heat
stable pullulanase from the hyperthermophilic Archeon Pyrococcus woesei after
cloning and expression of its gene in Escherichia coli. Appl. Environ. Microbiol.
61: 567–575.
Schiraldi C. and De Rosa M. 2002. Trends in Biotechnology Vol.20 No.12: 515-521.
Shen G., Saha B., Lee Y., Bhatnagar L., Zeikus J. 1988. Purification and
characterization of a novel thermostable b-amylase from Clostridium
thermosulfurogenes. Biochem. J. 254: 835–840.
Si J.Q. 1999. Enzymes, baking, bread making. Encyclopedia of bioprocess technology:
fermentation, biocatalysis and bioseparation, vol. 2. 947: 58.
Snnu 2011. Hydrolytic mechanisms of amylases. http://fch.snnu.edu.cn. Accessed: June
2011.
Sunna A., Tokajian S., Burghardt J., Raney F., Antranikian G. and Hashwa F. 1997.
Identification of Bacillus kaustophilus, Bacillus thermocatenulatus and Bacillus
Strain HSR as members of Bacillus thermoleovorans. Syst. Appl. Microbiol. 20:
232–237.
Özcan N., Altınalan A. and Ekinci M.S. 2001. Molecular cloning of an α-amylase gene
from Bacillus subtilis RSKK246 and its expression in Escherichia coli and in
Bacillus subtilis. Turkish Journal of Veterinary and Animal Sciences 25: 197-201.
Takasaki Y., 1976(a). Production and utilization of b-amylase and pullulanase
from Bacillus cereus var. mycoides. Agri. Biol. Chem. 40: 1515–1522.
Takasaki Y., 1976(b). Purification and enzyme properties of b-amylase and pullulanase
from Bacillus cereus var. mycoides. Agri. Biol. Chem. 40, 1523–1530.
Tanyildizi M.S., Özer D. and Elibol M. 2005. Optimization of α-amylase production by
Bacillus sp. using response surface methodology. Process Biochemistry 40: 2291-
2296.
Titarenko E. and Chrispeels M. J. 2000. cDNA cloning, biochemical characterization
and inhibition by plant inhibitors of the α-amylases of the Western corn

53
rootworm, Diabrotica virgifera virgifera. Insect Biochemistry and Molecular
Biology 30: 979–990.
Underkofler, L.A. 1976. Microbial enzymes. in Industrial Microbiology. Miller, B.,
Litsky, W. (Eds.), Industrial Microbiology. McGraw-Hill, Tokyo 128.
Uma Maheswar Rao J.L., Satyanarayana T. 2004. Amelioration in secretion of
hyperthermostable and Ca+2
independent α -amylase of Geobacillus
thermoleovorans by some polyamines and their biosynthesis inhibitor
methylglyoxal-bis-guanylhydrazone. J Appl Microbiol 97: 1015-1020.
Viara N., Elena P., Elka I. 1993. Purification and characterization of a thermostable
alpha-amylase from Bacillus licheniformis. J. Biotechnol. 28: 277–289.
Vihinen M., Mantsala P., 1990. Characterization of a thermostable Bacillus
stearothermophilus alpha-amylase. Biotechnol. Appl. Biochem 12: 427–435.
Yavuz E., Gunes H., Harsa S. and Yenidunya A.F. 2004. Identification of extracellular
enzyme producing thermophilic bacilli from Balcova (Agamemnon) geothermal
site by ITS rDNA RFLP. Journal of Applied Microbiology 97(4): 810-817.
Young M., Dong G., Jung-Hoon Y., Yong-Ha P., Young J. 2001. Rapid and simple
purification of a novel b-amylase from Bacillus sp. Biotechnol. Lett. 23: 1435–
1438.

54
APPENDIX A
MEDIA, BUFFERS, REAGENTS AND SOLUTIONS
A.1. Media and Buffers
Luria Bertani (LB) Medium
10 g tryptone, 5 g yeast extract, 5 g NaCl were dissolved in dH2O up to 1 L and
autoclaved at 121°C for 15 minutes.
Luria Bertani (LB) Agar
10 g tryptone, 5 g yeast extract, 5 g NaCl, 15 g agar were dissolved in dH2O up to 1 L and
autoclaved at 121°C for 15 minutes.
SOC Media
2.0 g Tryptone, 0.5 g of Yeast Extract, 1.0 ml of 1.0 M NaCl, 0.25 ml of 1.0 M KCl, 1.0
ml of 2.0 M Mg2+
and 1.0 ml of 2.0 M Glucose were dissolved in dH2O up to 100.0 ml and
sterilized.
SOB Medium
2 g Tryptone, 0.5 g Yeast Extract, 1 ml 1M NaCl, 0.02 g KCl, 1 ml 1M MgCl, 1 ml 1M
MgSO4 were dissolved in deionized dH2O up to 100 ml and autoclaved at 121°C for 15
minutes.
Starch Agar Media
0.5g yeast extract, 2.5g soluble starch and 7.5g agar agar was dissolved in 500ml distilled
water and sterilised by autoclaving at 121°C for 15 minutes.
TB Medium, per 100 ml
0.3 g PIPES, 3 ml 1 M CaCl2 and 1.85 g KCl were dissolved in 100 ml deionized water
and the solution pH was adjusted to 6.7 with KOH. Then 1.4 g MnCl2 was added and the
solution was filtered sterilized.
50 X TAE
242 g Tris base was dissolved in deionized water, 57.1 ml glacial acetic acid and 100 ml
0.5 M EDTA (pH 8.0) were added. Volume was adjusted to 1000 ml with deionized water.

55
Citrate Buffer; pH 3.0, pH 4.0, pH 5.0, pH 6.0
Citrate buffer (Gomori 1955) stock solutions: A: 0.1 M citric acid; B: 0.1 M sodium
citrate. Using the following amounts from these stock solutions and diluting them to 100.0
ml with 50.0 ml dH2O, the following buffer systems were prepared. Finally, to obtain 50.0
mM concentration, one more 1:2 dilutions were applied.
Volume of 0.1 M
Citric acid, ml
Volume of 0.1 M Sodium
citrate (ml)
Desired pH
45.6 3.5 3.0
33.0 17.0 4.0
20.5 29.5 5.0
Volume of 1.0 M
Na2HPO4, ml
Volume of 1.0 M NaH2PO4,
ml
Desired pH
57.7
42.3
7.0
Sodium Phosphate Buffer, 0.1 M; pH 7.0
Indicated amounts of stock solutions were mixed and diluted as 1:2 to obtain 50.0 mM buffer
system at pH 7.0.
Tris-Cl Buffer, 1.0 M; pH 8.0
121.1 g of Tris base was dissolved in 700.0 ml of dH2O. Concentrated HCl was added until the
pH reached to 8.0. The solution was filled up to 1.0 L with dH2O. Finally, the stock solution
was diluted to 50.0 mM with dH2O.
Iodine solution
2 g Potassium iodide and 1g of Iodine was dissolved in 300ml distilled water

56
A.2. Solutions and Reagents for SDS- PAGE
10 ml Seperating Gel (12% monomer conc.)
Acrylamide/bis 4 ml
dH2O 3,35 ml
1,5 M Tris-HCl , pH 8.8 2,5 ml
10%SDS( w/v) 0,1 ml
10% amonium persulfate (fresh preperation) 50µl
TEMED 5µl
5 ml Stacking Gel 4%
Acrylamide/bis 650 µl
Ultra pure water 3,05 ml
0,5M Tris-HCl pH 6, 1,25 ml
10% (w/v) SDS 50µl
10% amonium persulfat 25µl
TEMED 5µl
30% Acrylamide Mixture
(29.2 g acrylamide, 0.8 g N’N’-bis-methylene-acrylamide)
Make up to 100 ml with ultrapure water. Filter and store at 4ºC in the dark for at least one
month.
Sample Buffer
3,8 ml dH2O, 1ml 0.5 M Tris-HCl, pH 6.8, 0.8 ml Glycerol, 1.6 ml 10% (w/v) SDS, 0.4 ml
2- mercaptoethanol, 0.4 ml 1% (w/v) bromophenol blue
5X Running Buffer
• 15g Tris Base
• 72g Glycine
• 5g SDS
Dissolve Tris base, glycine and SDS in ~800ml deionized water and make up to

57
1L with water. Store at 4ºC. For electrophoretic run, dilute 5X stock solution to 1X with
deionized water.
Destaining soln:
100ml Methanol, 250 ml acetic acid was added to 1650ml deionized water.

58
APPENDIX B
ABSORBANCE VALUES OF BSA STANDARTS AND
STANDART CURVES FOR BRADFORD ASSAY AND
AMYLASE ASSAY
Table B.1. Absorbance values of BSA standarts
Concentration
(mg/ml)
Absorbance
(595 nm)
0.25 0.1908
0.5 0.3623
1 0.6963
1.4 0.9082
2 1.1409

59
Figure B.1. BSA standart curve for Bradford assay
0,25 0,305
0,5 0,76
1 1,417
Figure B.2. Standart calibration curve for amylase assay
1,25 1,629
1,5 1,841
2